Chapter 12 Neuroimaging in Restless Legs Syndrome
Positron-Emission Tomography and Single-Photon Emission Computed Tomography Imaging Studies
Single-photon emission computed tomography (SPECT) and positron-emission tomography (PET) rely on the same underlying principle— the injection of radioactive isotopes, which are linked to particular tracers. These radiolabeled tracers cross the blood-brain barrier and emit photons while decaying. The PET isotopes have a relatively short half-life, whereas the SPECT isotopes have a much longer half-life. The PET technique provides a better spatial and higher temporal resolution than SPECT. The distribution of the radioactivity is related to the density of selected binding sites that are focused on special brain areas (i.e., the striatum). The reference region approach is used to estimate binding site availability for ligand binding and to generate an index of specific binding.
Dopaminergic Function
Fluorodopa Positron Emission Tomography
There have been three published PET studies using 18F-DOPA ligand in the evaluation of RLS. The small study by Trenkwalder and colleagues1 compared 4 RLS subjects with 10 control subjects and found no difference in either caudate or putamen uptake of isotope between the groups. Turjanski and associates2 compared 13 RLS subjects with 14 control subjects and found a significant decrease in isotope in the putamen but not in the caudate of RLS subjects. This decrease, however, was much less than that commonly detected in patients with Parkinson’s disease. About 40% of the RLS subjects in this study were receiving dopaminergic agents before the study; these medications were stopped about 36 hours before the scan. In a post hoc analysis, they compared the findings for 8 drug-naïve RLS subjects with findings for control subjects, but the results were not different. The dopamine-2 receptor (D2R) binding potential (BP) was also studied by PET (see later) in this same group of subjects, thus allowing for a comparison with 18F-DOPA results. They found a strong correlation (r = 0.62. p =.02) between 18F-DOPA Ki and D2R BP in the putamen for the RLS group. RLS severity and total sleep time did not correlate with any of the PET measures. Ruottinen and associates3 studied nine drug-naïve RLS subjects and found a significant decrease in both putamen and caudate compared with 27 matched control subjects. What is unclear from this study is the exact clinical nature of the supposed RLS group, because the authors refer to this group as having “RLS and PLMD (periodic limb movement disorder).”
The degree of decrease in 18F-DOPA isotope in RLS patients is relative small (about 10%) compared with that seen in patients with Parkinson’s disease or other neurodegenerative disorders.4,5 Even if small, the real question is what does any difference, large or small, mean with regard to 18F-DOPA isotope? Studies of this basic question have lead to the conclusion that 18F-DOPA isotope defines a complex multisystem process: cell uptake, decarboxylation, vesicular uptake, release, and metabolism—all contribute in a dynamic way to the kinetics (Ki) of this isotope.6,7 Therefore, the most that can be said about the findings is that there are subtle dynamic changes in the turnover of dopamine in the putamen (and possibly caudate) of RLS patients.
Studies of Dopamine-2 Receptor
Staedt and colleagues8–10 were the first to evaluate RLS for possible changes in D2R BP using SPECT techniques. This involved a series of three reported studies in 1993 and 1995. All three studies reported a decrease in D2R BP in the striatum of RLS compared with control subjects. However, there were several critical issues in regard to methodology. First, the RLS population was poorly defined and included subjects with pure PLMD (i.e., no RLS symptoms). Second, in two of the three studies, subjects were undergoing treatment and were withdrawn only 36 hours before the SPECT procedure.8,9 In the last study, the authors reported, “RLS patients were free of drugs interfering with central dopaminergic system.”10 It is unclear if those patients were drug-naïve or did not take drugs prior to the procedure. Finally, there were significant age differences, with the control subjects being hospital staff members and much younger than the RLS subjects. This is important, as a strong inverse correlation between age and D2R BP has been reported (see later).
Eisensehr and associates11 studied 25 RLS subjects, of whom 56% were drug-naïve, and compared the findings of 20 age- and gender-matched control subjects. No significant between-group differences in SPECT BP were found. BP ratio did not correlate with the duration of RLS symptoms, levodopa dosage, serum iron, serum ferritin, periodic limb movement syndrome (PLMS), or sleep efficiency. However, there was a strong correlation (r = 0.65, p <.0001) between the age of the subjects (controls and RLS inclusive) and the BP ratio: the older the age, the lower was the BP. Tribl and associates12 studied 14 pretreated RLS and 9 healthy gender- and age-matched control subjects and also found no difference between the groups for SPECT BP in the striatum. As with Eisensehr and coworkers’ study, BP ratio strongly correlated with age and D2R BP in both RLS (r = 0.7, p =.005) and control (r = 0.68, p =.032) groups. The BP ratio did not correlate with PLMS, sleep efficiency, or RLS duration.
Michaud and colleagues13 studied 10 drug-naïve RLS patients and found a significant reduction in striatal D2R BP compared with 10 control subjects. In addition, 9 of the 10 patients showed a mean striatal D2R binding below the control group mean. However, BP did not correlate with severity or PLMS. The only obvious difference between this study and that of Eisensehr and Tribl and colleagues is the time of day at which the procedure was done: Michaud and colleagues’ studies whereas done late in the day (4:30 P.M. to 9:30 P.M.), whereas the other two studies were done sometime during the working hours.
One PET study of D2R BP found a decrease in both caudate and putamen for RLS subjects (n = 13) compared with age- and gender-matched control subjects (n = 9).2 Limitations of the study include prior treatment in about 48% of the subjects with withdrawal of RLS medications only 36 hours prior to the procedure. However, a second study14 found increases in BP. Sixteen RLS subjects who had never taken dopaminergics or opioids were compared with age-matched control subjects. The RLS subjects had longstanding idiopathic RLS; nine were aware of an affected first-degree relative. The scans, done both in the morning and at night, found a significant increase in striatal D2R BP in RLS subjects using RAC and a significant regional increase in extrastriatal D2R BP in areas involved with sensory and emotional processing (thalamus, anterior cingulated cortex). The variation in BP of both ligands between the morning and night was within test-retest limits. The authors concluded that the RLS patients had a presynaptic dopamine deficiency and that variation in receptor density did not underlie the circadian variation of RLS. One distinction of this study from others was the possibility that these were subjects with milder symptoms: they scored in the moderate range on the International Restless Legs Syndrome Study Group Rating Scale.
Studies of the Dopamine Transporter
Eisensehr and associates11 used [123I] IPT-SPECT to compare RLS and controls for dopamine transporter (DAT) BP in the striatum. There were two groups of RLS patients: drug-naïve (n = 14) and those on long-term levodopa treatment (n = 11). In both groups, polysomnographic studies have been performed and showed high PLMS indices (32/hr versus 51/hr). Two control groups (n = 10 in each), matched for the age with the RLS groups and with polysomnographic studies (PLMS index <10/hr) were used for comparison. The results revealed no difference in DAT BP between any of the groups. Two further studies confirmed this negative finding. Michaud and colleagues13 used the radioligand (123I)-β-CIT for SPECT imaging in 10 idiopathic RLS patients compared with 10 healthy controls. These studies were done late in the day (4:30 P.M. to 9:30 P.M.). Linke and associates15 studied 28 idiopathic RLS and 23 age- and gender-matched control subjects and were unable to find a difference using IPT SPECT assessment of DAT. None of these three studies found any correlation between DAT BP and age, RLS severity or duration, PLMS, or sleep efficiency.
Opiate Imaging
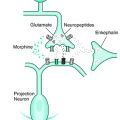
Based on the successful treatment of RLS patients with opioids, opioid receptor BP was studied in patients with RLS.16 Opioid receptor BP was studied in patients with primary RLS (n = 15) and age-matched healthy volunteers (n = 12) using PET ligand (11C)-diprenorphine, a nonselective opioid receptor radioligand. Eight of 15 subjects were receiving dopaminergic treatment. All RLS medications were stopped 48 hours before the scan. There were no mean group differences in opioid receptor binding between patients and control subjects. However, regional negative correlations between ligand binding and RLS severity could be detected in those areas serving the medial pain system (medial thalamus, amygdala, caudate nucleus, anterior cingulate gyrus, insular cortex, and orbitofrontal cortex). These findings suggested that the more severe the RLS, the greater is the release of endogenous opioids within the medial pain system, a result concordant with the distribution of opioid binding in patients with chronic pain. This study does not favor a primary dysfunction of the central opioid system as a cause of RLS. It also suggests that the relevant control group for opiate receptor studies in RLS may be those with other chronic pain syndromes.
Brain Glucose Metabolism
One published study investigated the use of 18F-fluorodeoxyglucose PET (FDG-PET) in six patients with RLS compared with 12 age-matched control subjects.1 All except one of the RLS subjects was receiving dopaminergic medications that were stopped 36 hours before the scan. All patients had had symptoms for longer than 20 years. Both global and regional glucose metabolisms were calculated. All RLS subjects were asymptomatic during the PET study. There was a normal global and regional metabolic uptake in all patients. There was no correlation with disease severity or duration.
Brain Magnetic Resonance Imaging and Other Imaging Techniques
Magnetic resonance imaging (MRI) has been used to study the brain in RLS patients. However, several distinctly different MRI techniques were used in different studies. The earliest use of MRI was in the study by Bucher and colleagues.17 Using standard T1 and T2 imaging, they found no structural lesions in 25 patients with RLS beyond the usual age-related change in cortical volume and in white matter lesions.17 Functional MRI techniques have been used to study brain localization of “cerebral generators” of RLS-related symptoms.18 The authors compared the sensory and motor symptoms of RLS with control conditions, which included “voluntary” leg movements or no sensation and no movements. With only sensory symptoms, there was increased activity noted in both cerebellum and in the contralateral thalamus. The thalamic area that was activated appears to correspond to dorsal medial nucleus of the thalamus. When RLS symptoms also include “involuntary” movements (PLM), the red nucleus and a portion of the brainstem also had increased activity. Voluntary movements of the legs were used to control for leg movements associated with PLM. The pattern of activation was quite different from that seen with PLM, resulting in activation of globus pallidus and motor cortex in both RLS and control subjects. Voxel-based MRI morphometry techniques were used to evaluate volumetric differences in regional gray matter of RLS patients. Etgen and associates19 found that bilateral pulvinar gray matter was increased in idiopathic RLS patients compared with age-matched control subjects. The significance of this finding is unclear, although the authors speculate that it may represent either a component of the underlying pathology or chronic changes to afferent input to the area. But it does represent the first reported structural change in RLS brains.
Using special T2-weighted imaging to quantify brain iron, one small study found decreased iron in the substantia nigra (SN) and putamen.20 The changes in SN iron index also correlated with RLS severity using the Johns Hopkins RLS severity scale. More recently, the same group published a similar study of brain iron in RLS. This study evaluated a much larger population of control and RLS subjects and also had as its primary aim to specifically evaluate early- and late-onset RLS.21 They reported a decrease in SN iron index for early-onset, but not for late-onset RLS compared with a control group. In this study, the putamen did not show a decrease in iron index as reported in the earlier, smaller study. In fact, late-onset RLS had an increase in brain iron in the putamen and pons, which, when corrected for multiple analyses using a Bonferonni correction, was not significant. Another study of SN iron status in RLS used B-mode transcranial Doppler (TCD) imaging of the midbrain22 and found those with idiopathic RLS had decreased echogenicity in the SN region, suggestive of decreased SN iron. Previous studies of TCD imaging using autopsy material and subsequent determination of tissue iron in the SN validated the changes in signal intensity as representative of changes in tissue iron (rho = 0.57, p =.008).23 (For a discussion on the implication of these findings, see Chapters 9 and 10)
1. Trenkwalder C, Walters AS, Hening WA, et al. Positron emission tomographic studies in restless legs syndrome. Mov Disord. 1999;14:141-145.
2. Turjanski N, Lees AJ, Brooks DJ. Striatal dopaminergic function in restless legs syndrome: 18F-dopa and 11C-raclopride PET studies. Neurology. 1999;52:932-937.
3. Ruottinen HM, Partinen M, Hublin C, et al. An FDOPA PET study in patients with periodic limb movement disorder and restless legs syndrome. Neurology. 2000;54:502-504.
4. Brooks D, Ibanez V, Sawls G, et al. Differing patterns of striata and progressive supranuclear palsy. Ann Neurol. 1990;28:547-555.
5. Piccini P, Turjanski N, Brooks DJ. PET studies of the striatal dopaminergic system in Parkinson’s disease (PD). J Neural Transm Suppl. 1995;45:123-131.
6. Snow BJ, Tooyama I, McGeer EG, et al. Human positron emission tomographic (18F)fluorodopa studies correlate with dopamine cell counts and levels. Ann Neurol. 1993;34:324-330.
7. Sossi V, de la Fuente-Fernandez R, Holden JE, et al. Changes of dopamine turnover in the progression of Parkinson’s disease as measured by positron emission tomography: Their relation to disease-compensatory mechanisms. J Cereb Blood Flow Metab. 2004;24:869-876.
8. Staedt J, Stoppe G, Kogler A, et al. Dopamine D2 receptor alterations in patients with periodic movements in sleep (nocturnal myoclonus). J Neural Transm Gen Sect. 1993;93:71-74.
9. Staedt J, Stoppe G, Kogler A, et al. Single photon emission tomography (SPET) imaging of dopamine D2 receptors in the course of dopamine replacement therapy in patients with nocturnal myoclonus syndrome (NMS). J Neural Transm Gen Sect. 1995;99:187-193.
10. Staedt J, Stoppe G, Kogler A, et al. Nocturnal myoclonus syndrome (periodic movements in sleep) related to central dopamine D2-receptor alteration. Eur Arch Psychiatry Clin Neurosci. 1995;245:8-10.
11. Eisensehr I, Wetter TC, Linke R, et al. Normal IPT and IBZM SPECT in drug-naive and levodopa-treated idiopathic restless legs syndrome. Neurology. 2001;57:1307-1309.
12. Tribl GG, Asenbaum S, Klosch G, et al. Normal IPT and IBZM SPECT in drug naive and levodopa-treated idiopathic restless legs syndrome [letter to editor]. Neurology. 2002;59:649-650.
13. Michaud M, Soucy JP, Chabli A, et al. SPECT imaging of striatal pre- and postsynaptic dopaminergic status in restless legs syndrome with periodic leg movements in sleep. J Neurol. 2002;249:164-170.
14. Cervenka S, Palhagen SE, Comley RA, et al. Support for dopaminergic hypoactivity in restless legs syndrome: A PET study on D2-receptor binding. Brain. 2006;129:2017-2028.
15. Linke R, Eisensehr I, Wetter TC, et al. Presynaptic dopaminergic function in patients with restless legs syndrome: Are there common features with early Parkinson’s disease? Mov Disord. 2004;19:1158-1162.
16. von Spiczak S, Whone AL, Hammers A, et al. The role of opioids in restless legs syndrome: An (11C)diprenorphine PET study. Brain. 2005;128(pt 4):906-917.
17. Bucher SF, Trenkwalder C, Oertel WH. Reflex studies and MRI in the restless legs syndrome. Acta Neurol Scand. 1996;94:145-150.
18. Bucher S, Seelos K, Oertel W, et al. Cerebral generators involved in the pathogenesis of the restless legs syndrome. Ann Neurol. 1997;41:639-645.
19. Etgen T, Draganski B, Ilg C, et al. Bilateral thalamic gray matter changes in patients with restless legs syndrome. Neuroimage. 2005;24:1242-1247.
20. Allen RP, Barker PB, Wehrl F, et al. MRI measurement of brain iron in patients with restless legs syndrome. Neurology. 2001;56:263-265.
21. Earley CJ, Barker PB, Horská A, et al. MRI-determined regional brain iron concentrations in early and late-onset restless legs syndrome. Sleep Med. 2006;7:263-268.
22. Schmidauer C, Sojer M, Seppi K, et al. Transcranial ultrasound shows nigral hypoechogenicity in restless legs syndrome. Ann Neurol. 2005;58:630-634.
23. Berg D, Roggendorf W, Schroder U, et al. Echogenicity of the substantia nigra: Association with increased iron content and marker for susceptibility to nigrostriatal injury. Arch Neurol. 2002;59:999-1005.