Chapter 33C Neuroimaging
Functional Neuroimaging: Functional Magnetic Resonance Imaging, Positron Emission Tomography, and Single-Photon Emission Computed Tomography
Functional Neuroimaging Modalities
Functional Magnetic Resonance Imaging
In addition to fMRI, structural imaging has recently gained more attention. Voxel-based morphometry (VBM) allows voxel-by-voxel comparison of the relative contribution of white or gray matter to the signal between groups. A well-known application to learning was the increase of parietal regions used for visuospatial integration in people who learned to juggle (Draganski et al., 2004). Integrity of tracts may be determined through diffusion tensor imaging (DTI). DTI measures the diffusion vector in each voxel. It is feasible to detect the direction of diffusion across longer distances by analyzing and relating the values in several neighboring voxels. As diffusion is facilitated along axes, in contrast, probabilistic fiber tracking identifies the most likely course of fiber tracts (Kreher et al., 2008). Comparison of diffusivity (i.e., fractional anisotropy) voxel by voxel across the entire brain allows the differentiation of tracts between groups, analogous to VBM. For instance, stutterers have a less smooth connection below a region responsible for preparation of articulation (Sommer et al., 2002).
Positron Emission Tomography
Although the first attempts to use positron emitters for medical imaging were made as early as the 1950s, the concept of modern PET was developed during the 1970s (Phelps et al., 1975). The underlying principle of PET, and also of SPECT, is to image and quantify a physiological function or molecular target of interest (e.g., blood flow, metabolism, receptor binding) in vivo by noninvasively assessing the spatial and temporal distribution of the radiation emitted by an intravenously injected target-specific probe (radiotracer). Importantly, PET and SPECT tracers are administered in a non-pharmacological dose (micrograms or less), so they neither disturb the underlying system nor cause pharmacological or behavioral effects. Because of their ability to visualize molecular targets and functions on a macroscopic level with unsurpassed sensitivity, down to picomolar concentration, PET and SPECT are also called molecular imaging techniques. (See Cherry et al., 2003, for an excellent textbook on PET and SPECT physics.)
In this chapter on perfusion and metabolism, we will focus on PET studies using the glucose analog, 2-deoxy-2-(18F)fluoro-d-glucose ([18F]FDG), to assess cerebral glucose metabolism. With the rate of glucose metabolism being closely related to maintenance of ion gradients and transmitter turnover (in particular, glutamate), [18F]FDG represents an ideal tracer for assessment of neuronal function and its changes (Sokoloff, 1977). After uptake in cerebral tissue by specific glucose transporters, [18F]FDG is phosphorylated by hexokinase. Since [18F]FDG-6-P is neither a substrate for transport back out of the cell nor can it be metabolized further, it is virtually irreversible trapped in cells. Therefore, the distribution of [18F]FDG in tissue imaged by PET (started 30-60 minutes after injection to allow for sufficient uptake; 5-20 minute scan duration) closely reflects the regional distribution of cerebral glucose metabolism. By use of appropriate pharmacokinetic models and a plasma input function (i.e., [18F]FDG concentration in arterial or arterialized venous plasma), the absolute cerebral metabolic rate of glucose (CMRglc in µmol/min/100 g tissue) can be estimated. In the case of [18F]FDG, absolute quantification is usually not necessary for routine clinical studies, since the diagnostic information can often be obtained from the cerebral pattern of [18F]FDG uptake or relative estimates of regional glucose metabolism gained by normalizing regional [18F]FDG uptake to the uptake of a suitable reference region unaffected by disease.
Single-Photon Emission Computed Tomography
The first SPECT measurements were performed in the 1960s (Kuhl and Edwards, 1964). As explained earlier, SPECT relies on the same radiotracer principle as PET. Unlike PET, SPECT employs gamma-emitting radionuclides that decay by emitting a single gamma ray. Typical radionuclides employed for neurological SPECT are technetium-99m (99mTc; half-life = 6.02 hours) and iodine-123 (123I; half-life = 13.2 hours). Gamma cameras are used for SPECT acquisition, whereby usually two or three detector heads rotate around the patient’s head to acquire two-dimensional planar images (projections) of the head from multiple angles (e.g., in 3-degree steps). Whereas radiation collimation is achieved by coincidence detection in PET, hardware collimators with lead septa are placed in front of the detector heads in the case of SPECT scanners. Finally, 3D image data reconstruction is done by conventional reconstruction algorithms. With combined SPECT/CT systems, a CT transmission scan can replace the less accurate calculated attenuation correction.
The different acquisition principles outlined above imply that SPECT possesses a considerably lower sensitivity than PET. Thus, rapid temporal sampling (image frames of seconds to minutes) as a prerequisite for pharmacokinetic analyses is the strength of PET, whereas a single SPECT acquisition usually takes 20 to 30 minutes. Furthermore, the spatial resolution of modern SPECT is only about 7 to 10 mm, deteriorating with increasing distance between object and collimator (i.e., higher resolution for cortical than subcortical structures; distance between patient and collimator should be minimized for optimal resolution). SPECT is considerably more susceptible to partial volume effects than PET, which can be a particular drawback when it comes to imaging small structures or lesions (e.g., brain tumors). Nevertheless, brain-dedicated SPECT instruments have been proposed that allow for optimized spatial and temporal sampling and pharmacokinetic data quantification (Meyer et al., 2008), and further technical developments are underway (Jansen and Vanderheyden, 2007). The important advantages of SPECT over PET are the lower costs, the broad availability of SPECT systems, and the availability of SPECT radionuclides in smaller community hospitals and private practices. While 123I-labelled tracers (e.g., [123I]FP-CIT and [123I]IBZM for dopamine transporter and receptor imaging, respectively) can easily be shipped over long distances, technetium-99m can be eluted onsite from molybdenum-99 (99Mo)/99mTc generators and used for labeling commercially available radiopharmaceutical kits. Although 99mTc is an almost ideal radionuclide from the perspective of imaging physics, chemical incorporation of 99mTc into tracers is much more demanding than in case of the aforementioned PET radionuclides, limiting the diversity of 99mTc-labelled tracers.
Clinical Applications
Dementia
Early and accurate diagnosis of dementia is of crucial importance for appropriate treatment (including possible enrollment into investigational trials on novel therapies and avoidance of possible side effects of treatments), for prognosis, and for adequate counseling of patients and caregivers. The diagnostic power of [18F]FDG PET in this situation is well established (Herholz, 2003). In clinical practice, [18F]FDG PET studies are interpreted by qualitative visual readings. These readings are commonly assisted by voxel-based statistical analyses in comparison to aged-matched normal controls (Herholz et al., 2002; Minoshima et al., 1995), which have become state of the art in recent years. PET studies should always be interpreted with parallel inspection of a recent CT or MRI scan to detect structural defects (e.g., ischemia, atrophy, subdural hematoma) that cause regional hypometabolism.
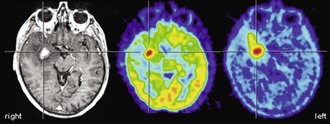
The typical finding in Alzheimer disease (AD), the most frequent neurodegenerative dementia, is bilateral hypometabolism of the temporal and parietal association cortices, with the temporoparietal junction being the center of impairment. As the disease progress, frontal association cortices also get involved (Figs. 33C.1 and 33C.2). The magnitude and extent of the hypometabolism increases with progressing disease, with relative sparing of the primary motor and visual cortices, the basal ganglia, and the cerebellum (often used as reference regions). The degree of hypometabolism is usually well correlated with the dementia severity (Herholz et al., 2002; Minoshima et al., 1997; Salmon et al., 2005). Furthermore, cortical hypometabolism is often asymmetrical, corresponding to predominant clinical symptoms (language impairment if dominant or visuospatial impairment if non-dominant hemisphere is affected, respectively). Voxel-based statistical analyses consistently show that the posterior cingulate gyrus and precuneus are also affected even in the earliest AD stages (Minoshima et al., 1997). It is unclear whether the hypometabolism in this rather circumscribed area is in fact particularly pronounced in early AD or more narrowly and consistently localized (compared to other regions) and thus preferentially detected by statistical methods (Herholz et al., 2002). In any case, it is an important diagnostic clue in early AD that should not be missed. The hippocampus is particularly affected by AD pathology and, consequently, neurodegeneration. However, studies on hippocampal metabolism in AD yielded conflicting results, mostly showing no significant hypometabolism. This may be due to the relatively low-normal [18F]FDG uptake, small size, and AD-related atrophy of this structure, which render visual and voxel-based statistical analyses insensitive. Region-based analyses like a recently proposed automated hippocampal masking technique can help overcome these limitations and provide valuable incremental diagnostic information (Mosconi et al., 2005).
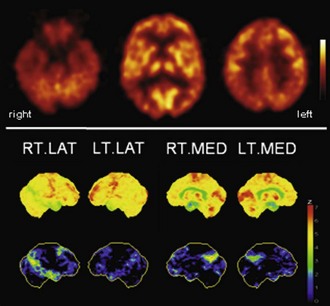
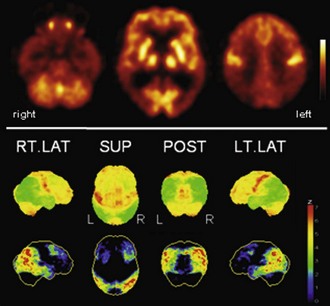
Fig. 33C.2 [18F]FDG PET in advanced Alzheimer disease. Advanced disease stage is characterized by severe hypometabolism of temporal and parietal cortices and posterior cingulate gyrus and precuneus. Frontal cortex is also involved, while sensorimotor and occipital cortex, basal ganglia, thalamus, and cerebellum are spared. Mesiotemporal hypometabolism is also apparent. Upper panel, Transaxial PET images of [18F]FDG uptake. Lower panel, Results of voxel-based statistical analysis using Neurostat/3D-SSP. Given are right and left lateral, superior, and posterior views (see Fig. 33C.1 for additional details).
(Neurostat/3D-SSP analysis based on Minoshima, S., Frey, K.A., Koeppe, R.A., et al., 1995. A diagnostic approach in Alzheimer’s disease using three-dimensional stereotactic surface projections of fluorine-18-FDG PET. J Nucl Med 36, 1238-1248.)
In [18F]FDG PET studies on autopsy-confirmed AD patients with memory complaints, the pattern of temporoparietal hypometabolism as assessed by visual readings alone showed a high sensitivity of 84% to 94% for detecting pathologically confirmed AD, with a specificity of 63% to 74% (Hoffman et al., 2000; Jagust et al., 2007; Silverman et al., 2001). As a diagnostic tool, visual inspection of [18F]FDG PET was found to be of similar accuracy as a clinical follow-up examination performed 4 years after PET (Jagust et al., 2007). In two recent large multicenter trials, voxel-based statistical analyses of cortical [18F]FDG uptake provided a sensitivity of 93% to 99% and a specificity of 93% to 98% for the distinction between mild to moderate AD (clinical diagnosis) and normal controls (Herholz et al., 2002; Mosconi et al., 2008). The specificity of the differentiation between AD and dementia with Lewy bodies (DLB) and frontotemporal dementia (FTD) was lower (71% and 65%, respectively) if done by voxel-based cortical analyses alone. However, the use of an additional hippocampal analysis greatly improved specificity (100% and 94%, respectively), yielding an overall classification accuracy of 96% for the aforementioned patient groups and controls (Mosconi et al., 2008). Patterns of hypoperfusion observed with CBF SPECT in AD are very similar, but according to a SPECT meta-analysis (Dougall et al., 2004) and direct comparisons (Herholz et al., 2002), [18F]FDG PET provides higher diagnostic accuracy (also see recommendation in Dubois et al., 2007).
The syndrome of mild cognitive impairment (MCI) (Petersen et al., 1999) represents a risk state for dementia. More than half of subjects progress to manifest dementia within 5 years, with AD being the most frequent underlying cause, particularly in the group with amnestic MCI (Gauthier et al., 2006). Several studies demonstrated that an AD-like [18F]FDG PET pattern can be observed in high frequency among MCI patients (e.g., 79% and 31% of multidomain and amnestic MCI patients, respectively; Mosconi et al., 2008), and that this pattern is highly predictive of subsequent progression to manifest dementia, with a sensitivity of 92% to 93% and a specificity of 82% to 89% in two recent studies in which overall accuracy of [18F]FDG PET for prediction of progression was higher than of ApoE genotype or in-depth memory assessment (Anchisi et al., 2005; Drzezga et al., 2005). In addition, a recent meta-analysis showed that [18F]FDG PET performs better on prediction of rapid progression to AD than CBF SPECT and MRI (Yuan et al., 2009). Finally, it has been demonstrated that cognitively normal healthy controls at risk for AD owing to being an ApoE ε4 carrier and/or having a positive family history (maternal in particular) exhibited significantly reduced glucose metabolism in those cortical areas typically affected by AD (Mosconi et al., 2007; Reiman et al., 1996; Small et al., 1995). This was also found in young ApoE ε4 carriers (mean age of 30 years) and thus decades before the possible onset of AD (Reiman et al., 2004). Follow-up studies in subjects at risk for AD also demonstrated that the subsequent decline in cerebral glucose metabolism in AD-typical regions was significantly greater compared to non-at-risk subjects (Mosconi et al., 2009; Reiman et al., 2001; Small et al., 2000). Taken together, these results emphasize that [18F]FDG PET is not only a very powerful method for accurate diagnosis of manifest AD and prediction of progression in possibly prodromal AD (MCI) but may also be useful to investigate preclinical stages of AD (e.g., in prevention and treatment trials).
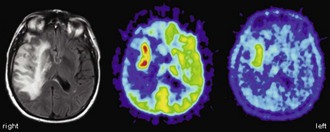
Dementia with Lewy bodies is considered the second most frequent cause of dementia. The typical [18F]FDG PET pattern observed in DLB resembles the pattern observed in AD, with the exception of additional hypometabolism of the primary visual cortex and the occipital association cortex (Albin et al., 1996) (Fig. 33C.3). The latter has been linked to the occurrence of typical visual hallucinations in DLB patients (particularly in those with relatively preserved posterior temporal and parietal metabolism) (Imamura et al., 1999). Occipital hypometabolism was found to be a valuable diagnostic feature to separate clinically diagnosed patients with AD and DLB (sensitivity 86%-92%, specificity 91%-92%) (Higuchi et al., 2000; Ishii et al., 1998a). This was confirmed in a study with autopsy confirmation (sensitivity 90%, specificity 80%) (Minoshima et al., 2001). Recent studies have demonstrated that hippocampal metabolism is preserved in DLB but reduced in AD (Ishii et al., 2007; Mosconi et al., 2008). The aforementioned multicenter study (Mosconi et al., 2008) found considerably enhanced accuracy of [18F]FDG PET for differentiating DLB from AD, FTD, and controls if an additional hippocampal analyses were included (92%). It has to be mentioned that differences may be hard to appreciate in routine clinical examination of individual patients. In this situation, PET or SPECT examinations of nigrostriatal integrity (e.g., using [18F]FDOPA or a dopamine transporter ligand like [123I]FP-CIT) can be very helpful in differentiating between AD and DLB (McKeith et al., 2007). One has to bear in mind that nigrostriatal projections may also be damaged in FTD (Rinne et al., 2002) and atypical parkinsonian syndromes with dementia (e.g., PSP and CBD; see below). DLB is clinically distinguished from Parkinson disease with dementia (PDD) by the so-called 1-year rule, referring to the duration of parkinsonism prior to dementia. Although the separation between DLB and PDD is controversial, it is still recommended for several reasons (Lippa et al., 2007; McKeith, 2007). In line with the notion that both diseases most likely represent manifestations of the same disease process (Lewy body disease), [18F]FDG PET studies in PDD (Peppard et al., 1992; Vander Borght et al., 1997) found very similar results to those in DLB. In a recent direct comparison, there were only minor differences between both groups (barely significant lower metabolism in DLB compared to PDD in the anterior cingulate cortex) (Yong et al., 2007). Of note, however, in a recent [11C]PIB PET study, the majority of DLB patients (11/13) showed increased Aβ binding, while the majority of PDD patients (10/12) did not (Edison et al., 2008).
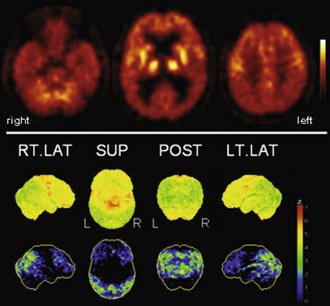
Fig. 33C.3 [18F]FDG PET in dementia with Lewy bodies (DLB). This disorder affects similar areas as those affected by Alzheimer disease (AD). Occipital cortex is also involved, which may distinguish DLB from AD; mesiotemporal lobe is relatively spared in DLB. A very similar, if not identical, pattern is observed in Parkinson disease with dementia (PDD). Upper panel, Transaxial PET images of [18F]FDG uptake. Lower panel, Results of voxel-based statistical analysis using Neurostat/3D-SSP. Given are right and left lateral, superior, and posterior views (see Fig. 33C.1 for additional details).
(Neurostat/3D-SSP analysis based on Minoshima, S., Frey, K.A., Koeppe, R.A., et al., 1995. A diagnostic approach in Alzheimer’s disease using three-dimensional stereotactic surface projections of fluorine-18-FDG PET. J Nucl Med 36, 1238-1248.)
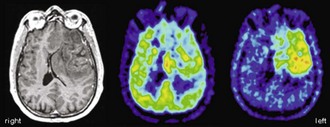
Frontotemporal lobar degeneration (FTLD) probably represents the third most common cause of dementia. It comprises the three prototypical syndromes: frontotemporal dementia (FTD), semantic dementia (SD), and progressive nonfluent aphasia (PA) (Neary et al., 1998). FTLD is caused by a spectrum of underlying, possibly related, pathologies (also including corticobasal degeneration [CBD] and progressive supranuclear palsy [PSP]) which lead to a variety of overlapping clinical presentations that hinder predicting the underlying pathology by the clinical phenotype (so-called Pick complex) (Kertesz et al., 2005). FTD is usually associated with a bilateral, sometimes asymmetrical, frontal hypometabolism which is most pronounced in the mesial (polar) frontal cortex (Fig. 33C.4) (Garraux et al., 1999; Salmon et al., 2003). The putamen, thalamus, and temporal and parietal cortices are also affected, although to a lesser extent (Garraux et al., 1999; Ishii et al., 1998). Despite the fact that FTD and AD affect overlapping cortical areas, the predominance of frontal and temporoparietal deficits, respectively, is usually very apparent and allows a clear distinction between FTD and AD. In line with this, a voxel-based statistical analysis provided a diagnostic accuracy of 90% (sensitivity 98%, specificity 86%) for separating FTD and AD in an autopsy-confirmed study, which was clearly superior to clinical diagnosis alone (Foster et al., 2007). As mentioned, additional hippocampal analyses may enable an even higher diagnostic accuracy (94%) for distinguishing FTD from AD, DLB, and control subjects (Mosconi et al., 2008). SD and PA are rather rare disorders, and PET studies are less abundant. Unlike FTD patients, SD patients usually show a predominant hypometabolism of the temporal lobes, most pronounced for the temporal poles, which is usually leftward asymmetrical (Fig. 33C.5) (Diehl et al., 2004; Rabinovici et al., 2008). In contrast, a strikingly greater left than right perisylvian hypometabolism of frontal, temporal, and parietal cortices is found in PA (Fig. 33C.6), with left insular/frontal opercular involvement being particularly associated with nonfluent aphasic features (Josephs et al., 2010; Nestor et al., 2003; Panegyres et al., 2008; Rabinovici et al., 2008). Given the relatively rare incidence of these syndromes and the controversy regarding their classification (Knibb et al., 2006), studies are missing that address the diagnostic value of [18F]FDG PET to distinguish between FTLD subgroups (including additional entities not discussed here) and to separate these from other dementias.
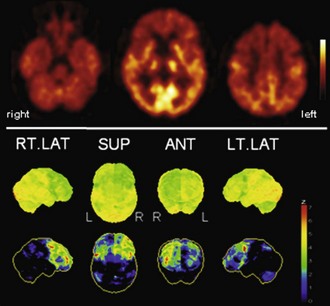
Fig. 33C.4 [18F]FDG PET in frontotemporal dementia (FTD). Bifrontal hypometabolism is usually found in FTD, sometimes in a somewhat asymmetrical distribution, as in this case. At early stages, frontomesial and frontopolar involvement is most pronounced, while parietal cortices are affected later in disease course. Upper panel, Transaxial PET images of [18F]FDG uptake. Lower panel, Results of voxel-based statistical analysis using Neurostat/3D-SSP. Given are right and left lateral, superior, and posterior views (see Fig. 33C.1 for additional details).
(Neurostat/3D-SSP analysis based on Minoshima, S., Frey, K.A., Koeppe, R.A., et al., 1995. A diagnostic approach in Alzheimer’s disease using three-dimensional stereotactic surface projections of fluorine-18-FDG PET. J Nucl Med 36, 1238-1248.)
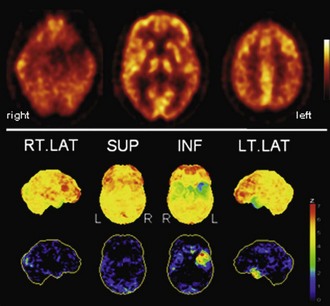
Fig. 33C.5 [18F]FDG PET in semantic dementia (SD). [18F]FDG PET scans in SD may initially appear normal because SD leads to hypometabolism of temporal poles, sometimes hard to recognize by visual inspection alone. Voxel-based statistical analyses can be particularly helpful. Usually, both temporal poles are affected (left greater than right), but sometimes degeneration is very asymmetrical, as in this case. Upper panel, Transaxial PET images of [18F]FDG uptake. Lower panel, Results of voxel-based statistical analysis using Neurostat/3D-SSP. Given are right and left lateral, superior, and inferior views (see Fig. 33C.1 for additional details).
(Neurostat/3D-SSP analysis based on Minoshima, S., Frey, K.A., Koeppe, R.A., et al., 1995. A diagnostic approach in Alzheimer’s disease using three-dimensional stereotactic surface projections of fluorine-18-FDG PET. J Nucl Med 36, 1238-1248.)
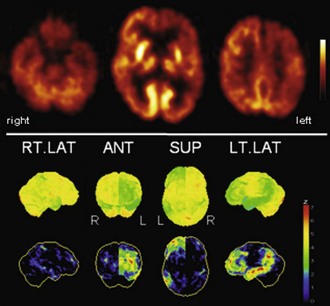
Fig. 33C.6 [18F]FDG PET in progressive aphasia (PA). [18F]FDG PET finding in PA is a very asymmetrical hypometabolism of left (speech dominant) hemisphere, which is usually already fairly pronounced when PA is first diagnosed. Both more frontal and more temporoparietal involvements have been described. In this case, there is also a pronounced striatal involvement. Upper panel, Transaxial PET images of [18F]FDG uptake. Lower panel, Results of voxel-based statistical analysis using Neurostat/3D-SSP. Given are right and left lateral, superior, and posterior views (see Fig. 33C.1 for additional details).
(Neurostat/3D-SSP analysis based on Minoshima, S., Frey, K.A., Koeppe, R.A., et al., 1995. A diagnostic approach in Alzheimer’s disease using three-dimensional stereotactic surface projections of fluorine-18-FDG PET. J Nucl Med 36, 1238-1248.)
Finally, pure vascular dementia (VD) seems to be rather rare in North America and Europe and more prevalent in Japan; [18F]FDG PET adds little to the diagnosis of VD. In agreement with CT and MRI, PET may show defects of [18F]FDG uptake corresponding to ischemic infarcts in all cerebral regions, including primary cortices, striatum/thalamus, and cerebellum. Since the latter are usually well preserved in AD, defects in these regions can be an important diagnostic clue. Deficits due to vascular lesions can be considerably larger or cause remote deficits of [18F]FDG uptake due to diaschisis. Furthermore, cerebral glucose metabolism was reported to be globally reduced (Mielke et al., 1992), but without absolute quantification this finding cannot be reliably assessed.
Parkinsonism
Most studies using quantitative [18F]FDG PET in idiopathic Parkinson disease (PD) reported a global decrease of gray-matter CMRglc in nondemented PD patients compared to controls (Hu et al., 2000; Kuhl et al., 1984; Peppard et al., 1992). This global hypometabolism was more pronounced in demented PD patients, with accentuation in temporo-parieto-occipital cortices (Kuhl et al., 1984; Peppard et al., 1992; Vander Borght et al., 1997). Cerebral hypometabolism correlated with dementia severity (Piert et al., 1996). Interestingly, temporo-parieto-occipital hypometabolism may also been seen in nondemented PD patients (Hu et al., 2000), raising the important and so far unresolved question of whether this finding indicates an increased risk of subsequent dementia.
In addition, several studies investigated abnormalities in relative regional glucose metabolism (regional [18F]FDG uptake normalized to global [18F]FDG uptake), either by direct comparison between PD patients and controls or by more sophisticated methods like spatial covariance analyses. Both approaches yielded very similar findings in terms of affected regions and local effects (Eckert et al., 2005; Eidelberg et al., 1994; Tang et al., 2010a): relatively increased activity is usually observed in putamen, globus pallidus, thalamus, pons, cerebellum, and primary motor cortex, whereas decreased activity is detected in bilateral parietal, occipital, and frontal cortices (dorsolateral prefrontal, premotor, and supplementary motor areas) (Fig. 33C.7). Of note, however, since global normalization is performed, the aforementioned relative changes do not necessarily imply corresponding changes in absolute glucose metabolism (Borghammer et al., 2009). Spatial covariance analyses can be powerful methods to identify abnormal cerebral networks as biomarkers for assessment of disease severity, progression, treatment efficacy, and differential diagnosis (Hirano et al., 2009). The expression of two distinctive spatial covariance patterns characterize PD: one related to motor manifestations and one related to cognitive manifestations. Alteration of metabolic brain network activity has been found to correlate with the cardinal motor symptoms of PD (PDRP), and a PD-related cognitive pattern (PDCP) has been described that correlates with cognitive impairment and affective disorder. A recent study showed that abnormal PDRP activity may precede motor symptom onset by 2 years (Tang et al., 2010b). Such analyses can also be useful for early diagnosis of suspected PD (separating PD from controls) (Eckert et al., 2005; Eidelberg et al., 1994, 1995), but it is unlikely that they will be superior to PET and SPECT examinations using molecular probes to investigate integrity of nigrostriatal dopaminergic projections like [18F]FDOPA or [123I]FP-CIT (Brooks, 2010; Piccini and Whone, 2004). The strength of [18F]FDG PET in parkinsonism lies in the differential diagnosis of PD and atypical parkinsonian syndromes (APS) like multiple system atrophy (MSA), PSP, and CBD, that cannot be reliably differentiated on an individual patient basis by the aforementioned studies of nigrostriatal integrity, but present with distinct metabolic patterns on [18F]FDG PET.
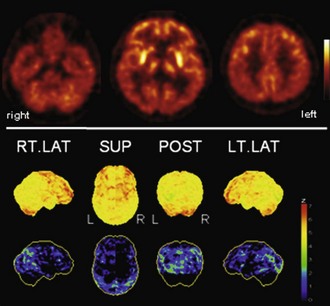
Fig. 33C.7 [18F]FDG PET in Parkinson disease (PD). PD is typically characterized by (relative) striatal hypermetabolism. Temporoparietal hypometabolism can be observed in a significant fraction of PD patients without apparent cognitive impairment. As shown here, hypometabolism can be fairly pronounced, strongly resembling the typical finding in dementia with Lewy bodies/PD with dementia. However, it still unclear whether this represents preclinical dementia. Upper panel, Transaxial PET images of [18F]FDG uptake. Lower panel, Results of voxel-based statistical analysis using Neurostat/3D-SSP. Given are right and left lateral, superior, and posterior views (see Fig. 33C.1 for additional details).
(Neurostat/3D-SSP analysis based on Minoshima, S., Frey, K.A., Koeppe, R.A., et al., 1995. A diagnostic approach in Alzheimer’s disease using three-dimensional stereotactic surface projections of fluorine-18-FDG PET. J Nucl Med 36, 1238-1248.)
In a very recent large clinicopathological study (Ling et al., 2010) with extensive review of all medical records available, the sensitivity the clinical diagnosis was report to be 92.8% for PD, while the sensitivity was only 70.1% for MSA, 73.1% for PSP, and 26.3% for CBD. Specificity was 85.8% for PD and better than 95% for MSA, PSP, and CBD (Ling et al., 2010). In line with the fact that decisive diagnostic features tend to develop over time (often years) and that a considerable fraction of APS patients show some initial response to l-dopa, the sensitivity of the initial clinical diagnosis was reported to be lower: 73.5% for PD (Litvan et al., 1998), approximately 60% for MSA (Litvan et al., 1997, Osaki et al., 2002), and less than 50% for PSP (Osaki et al., 2004). Consequently, for appropriate therapy selection (including therapy trials), prognosis, and counseling of patients and caregivers, improving early differential diagnosis is essential, and [18F]FDG PET can significantly contribute to this endeavor by providing disease-specific patterns of cerebral glucose metabolism. In MSA, decreased glucose metabolism is commonly found in striatum, brainstem, and cerebellum (Fig. 33C.8), which can be used as a reliable discriminator from PD (Antonini et al., 1997; Eidelberg et al., 1993; Ghaemi et al., 2002; Otsuka et al., 1997; Taniwaki et al., 2002). While patients with olivopontocerebellar atrophy have predominant cerebellar hypometabolism, predominant striatal hypometabolism is found in striatonigral degeneration (Perani et al., 1995). In addition, there is a reduction of cerebral glucose metabolism in the frontal cortices, which appears to spread to temporal and parietal cortices during the disease course, with subsequent cognitive decline (Lyoo et al., 2008; Otsuka et al., 1996). In PSP, glucose metabolism was consistently reported to be reduced in caudate nucleus and putamen, thalamus, pons/midbrain, and the mesial and dorsal frontal cortex (most notably in anterior cingulate cortex, precentral, dorso- and ventrolateral premotor and prefrontal areas) (Foster et al., 1988; Garraux et al., 1999; Hosaka et al., 2002; Juh et al., 2005; Karbe et al., 1992) (Fig. 33C.9). Comparing FTD and PSP, which both show frontal lobe involvement, striatofrontal metabolic impairment is greater in FTD, whereas mesencephalothalamic impairment was only observed in PSP (Garraux et al., 1999). Finally, the hallmark [18F]FDG PET of clinically diagnosed CBD is a highly asymmetrical cerebral hypometabolism in the thalamus, striatum, and predominantly parietal cortex but also frontal cortex (including cingulate cortex, precentral, premotor, and prefrontal areas) of the hemisphere contralateral to the side most clinically affected (Eidelberg et al., 1991; Garraux et al., 2000; Hosaka et al., 2002; Juh et al., 2005; Nagahama et al., 1997) (Fig. 33C.10). In a direct comparison of PSP and CBD, midbrain, thalamus, and cingulate cortex hypometabolism is greater in PSP, whereas asymmetry of the parietal lobes, sensorimotor area, and striatal involvement was more pronounced in clinical CBD (Garraux et al., 2000; Hosaka et al., 2002; Juh et al., 2005; Nagahama et al., 1997).
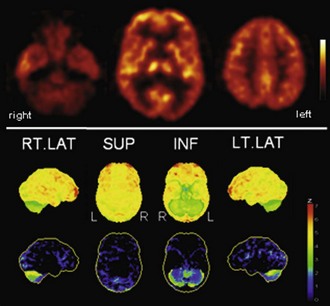
Fig. 33C.8 [18F]FDG PET in multiple system atrophy (MSA). In contrast to Parkinson disease, striatal hypometabolism is commonly found in MSA, particularly in those patients with striatonigral degeneration (SND, or MSA-P). In patients with olivopontocerebellar degeneration (OPCA, or MSA-C), cerebellar hypometabolism particularly evident, as shown here. Upper panel, Transaxial PET images of [18F]FDG uptake. Lower panel, Results of voxel-based statistical analysis using Neurostat/3D-SSP. Given are right and left lateral, superior, and inferior views (see Fig. 33C.1 for additional details).
(Neurostat/3D-SSP analysis based on Minoshima, S., Frey, K.A., Koeppe, R.A., et al., 1995. A diagnostic approach in Alzheimer’s disease using three-dimensional stereotactic surface projections of fluorine-18-FDG PET. J Nucl Med 36, 1238-1248.)
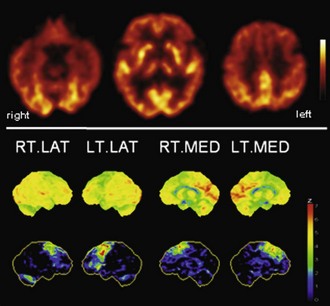
Fig. 33C.9 [18F]FDG PET in progressive supranuclear palsy (PSP). Typical finding in PSP is bilateral hypometabolism of mesial frontal and premotor/prefrontal areas. Thalamic and midbrain hypometabolism is usually also present. In line with overlapping pathologies in FTD and PSP, patients with clinical FTD can show a very PSP-like pattern, and vice versa. Upper panel, Transaxial PET images of [18F]FDG uptake. Lower panel, Results of voxel-based statistical analysis using Neurostat/3D-SSP. Given are right and left lateral and mesial views (see Fig. 33C.1 for additional details).
(Neurostat/3D-SSP analysis based on Minoshima, S., Frey, K.A., Koeppe, R.A., et al., 1995. A diagnostic approach in Alzheimer’s disease using three-dimensional stereotactic surface projections of fluorine-18-FDG PET. J Nucl Med 36, 1238-1248.)
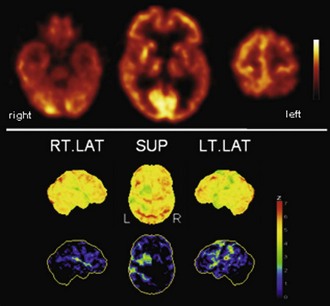
Fig. 33C.10 [18F]FDG PET in corticobasal degeneration (CBD). In line with the clinical presentation, CBD is characterized by a strongly asymmetrical hypometabolism of frontal and parietal areas, striatum, and thalamus. Most pronounced hypometabolism is often found in parietal lobe, but patients with the clinical syndrome of CBD may also show a one-sided PSP-like pattern on [18F]FDG PET. Upper panel, Transaxial PET images of [18F]FDG uptake. Lower panel, Results of voxel-based statistical analysis using Neurostat/3D-SSP. Given are right and left lateral and superior views (see Fig. 33C.1 for additional details).
(Neurostat/3D-SSP analysis based on Minoshima, S., Frey, K.A., Koeppe, R.A., et al., 1995. A diagnostic approach in Alzheimer’s disease using three-dimensional stereotactic surface projections of fluorine-18-FDG PET. J Nucl Med 36, 1238-1248.)
Few large-scale studies have explored the diagnostic value of [18F]FDG PET for differential diagnosis of uncertain parkinsonism. In one study, qualitative readings assisted by voxel-based statistical analyses were used to differentiate between PD, MSA, PSP, CBD, and healthy controls, using clinical diagnosis after a 2-year follow-up as reference. Disease-characteristic templates were used for data interpretation, which were generated by direct comparison of subsets of patients and controls (diagnostically most relevant features: PD, hypermetabolism in putamen; MSA, hypometabolism in putamen and cerebellum; PSP, hypometabolism in brainstem and midline frontal cortex; CBD, cortex and basal ganglia hypometabolism contralateral to the most affected body side) (Eckert et al., 2005). The following diagnostic accuracies were achieved in the individual groups: 97.7% in early PD, 91.6% in late PD, 96.0% in MSA, 85.0% in PSP, 90.1% in CBD, and 86.5% in controls. Except for the sensitivity in classifying PSP (85%) and controls (86%), sensitivity and specificity exceeded 90% in all other groups (Eckert et al., 2005). In a subsequent very recent study by the same group (Tang et al., 2010a), an automated image-based classification procedure relying on spatial covariance analyses was used to classify a large cohort of clinically diagnosed patients with PD, MSA, and PSP (follow-up > 6 months; on average, 2.6 years). The authors used a two-level analysis (first level: APS versus PD; second level: MSA versus PSP) to automatically classify patients according to disease-related metabolic patterns (see earlier discussion). Again, a high diagnostic accuracy was achieved in classifying PD (sensitivity/specificity 84%/97%), MSA (85%/96%), and PSP (88%/94%) (Tang et al., 2010a). However, it has to be acknowledged that this does not necessarily reflect the clinical situation. A typical clinical population also includes patients with CBD and possibly also patients with DLB, AD, and FTD, and finally, a relevant fraction of subjects without neurodegenerative parkinsonism (if not excluded beforehand by a preceding [123I]FP-CIT SPECT or [18F]FDOPA PET). Thus, an automated classification approach will probably result in a less optimal outcome in a typical clinical population. The overall classification accuracy in a four-class categorization (76%-84%; PD, MSA, PSP, and controls) was inferior to a three-class categorization (92%-94%; PD, MSA, and PSP only) using an automated classification based on principal component analysis (Spetsieris et al., 2009). On the other hand, an experienced observer will probably correctly recognize the majority of “unexpected” cases as such (e.g., AD and non-neurodegenerative patients).
As mentioned, an important caveat exists regarding the use of the clinical diagnosis of MSA, PSP, and even more so, CBD (Ling et al., 2010) as gold standards in diagnostic trials. In particular, the clinical distinction of CBD from PSP is questionable, since PSP is a common clinical misdiagnosis of pathologically verified CBD and a common pathological substrate of clinical CBD (Ling et al., 2010; Wadia and Lang, 2007). This issue gets even more complex if one considers that FTLD is often caused by PSP and CBD pathology (Kertesz et al., 2005). Thus, autopsy-confirmed imaging studies are ultimately needed to unravel this uncertainty and validate the use of [18F]FDG PET in parkinsonism.
Brain Tumors
Imaging with [18F]FDG PET or PET/CT is a well-established and often indispensable modality for diagnosis, staging, treatment monitoring, and follow-up of oncological patients with various malignancies of virtually all organs. Imaging of brain tumors was actually the first oncological application of [18F]FDG PET (Chen, 2007; Di Chiro et al., 1982; Herholz et al., 2007; Patronas et al., 1982). The degree of [18F]FDG uptake in brain tumors correlates with the grade of malignancy. The basis of this observation is not fully understood. As with other malignancies, both increased hexokinase activity and an increased glucose transport into the cell have been proposed. The use of [18F]FDG PET in brain tumors was recently reviewed by a National Comprehensive Cancer Network (NCCN) panel. Based on current lower-level evidence (lack of randomized studies) and panel consensus (corresponding to category 2A), a role for [18F]FDG PET in managing brain tumors was proposed for diagnosis/staging, restaging/recurrence, prognosis, and possibly also for treatment planning/response monitoring (Podoloff et al., 2009).
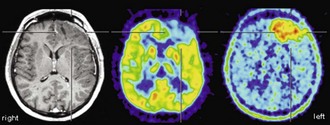
The use of [18F]FDG PET in brain tumor imaging is complicated by the high physiological uptake of [18F]FDG in gray matter. Thus, unlike tumors of other organs that are usually visualized as areas of intense [18F]FDG uptake compared to the surrounding tissue, brain tumors with little [18F]FDG uptake present as uptake deficits in cortex or are hardly discernable when localized in white matter. In turn, tumors with high [18F]FDG uptake may be masked by physiological [18F]FDG uptake of the cortex. Thus, co-registration of the [18F]FDG PET scan to a recent MRI scan is mandatory for sufficient [18F]FDG PET interpretation to accurately delineate the area of interest (Borgwardt et al., 2005; Chao et al., 2001; Wong et al., 2004). This is of particular importance in tumors with low and heterogenous uptake as is often the case after therapy. Other PET radiotracers like 3’-deoxy-3’-18F-fluorothymidine ([18F]FLT; a marker of cell proliferation/DNA synthesis) or [11C]methionine and O-(2-[18F]fluoroethyl)-l-tyrosine ([18F]FET; markers of amino acid transport into the cell) offer the advantage of very low physiological brain uptake. The radiotracers [11C]methionine and O-(2-[18F]fluoroethyl)-l-tyrosine ([18F]FET) have been particularly well evaluated and represent very promising alternatives to [18F]FDG. They enable a very high lesion–to–normal brain contrast, particularly in high-grade gliomas but also in the majority of low-grade gliomas without contrast enhancement on MRI. Thus, they are particularly well suited for tumor delineation for treatment planning (surgery and radiation therapy) and biopsy guidance, comparing favorably with [18F]FDG (Goldman et al., 1997; Kaschten et al., 1998; Pauleit et al., 2009; Pirotte et al., 2004). Although some studies suggests that [18F]FET may also be a suitable tracer of brain tumor grading and therefore of prognostic relevance, this is still a matter of debate, particularly in comparison to [18F]FDG. Finally, the aforementioned tracers appear to be very suitable for the detection of persistent or recurrent brain tumors after therapy. However, given the limited availability of these tracers in routine clinical practice, we direct the interested reader to recent reviews (Chen, 2007; Herholz et al., 2007; Langen et al., 2006).
From the very early days of [18F]FDG PET scanning, it was known that high-grade gliomas (World Health Organization [WHO] grade III-IV) show a significantly higher [18F]FDG uptake than low-grade gliomas (WHO grade I-II) (Di Chiro et al., 1982). Low-grade gliomas usually have an [18F]FDG uptake that is below or roughly comparable to white matter (Fig. 33C.11), while high-grade gliomas commonly exhibit an [18F]FDG uptake that is distinctly higher than white matter. In fact, glioblastomas (WHO grade IV) commonly show areas of increased [18F]FDG uptake similar to or above that of gray matter, while uptake of anaplastic gliomas (WHO grade III) often falls below gray matter but noticeably above white matter (Fig. 33C.12). Several studies reported a high accuracy of [18F]FDG PET in differentiating low- and high-grade brain tumors, with a diagnostic sensitivity and specificity ranging from 84% to 94% and 77% to 95%, respectively (Delbeke et al., 1995; Meyer et al., 2001; Padma et al., 2003). Qualitative readings were found to be at least as accurate as semiquantitative region-of-interest analyses (Meyer et al., 2001), and such differentiation is also possible in gliomatous and nongliomatous tumors (e.g., meningioma, angioma, etc.) (Delbeke et al., 1995; Meyer et al., 2001). Common causes of false-positive [18F]FDG PET scans mimicking malignancy include brain abscesses, pituitary adenomas, juvenile pilocytic astrocytomas, choroid plexus papillomas, and gangliogliomas. High [18F]FDG uptake in benign brain tumors is particularly often found in children, but [18F]FDG PET has nevertheless been demonstrated to be a powerful method for tumor grading of childhood CNS tumors (Borgwardt et al., 2005). Finally, cerebral lymphomas usually possess extraordinary high [18F]FDG uptake, making [18F]FDG PET a powerful method to detect cerebral lymphoma (Fig. 33C.13). This can be particularly useful in differentiating nonmalignant CNS lesions in patients with acquired immunodeficiency syndrome (AIDS) (Hoffman et al., 1993).
It has been shown that the degree of [18F]FDG uptake strongly predicts overall survival of patients with gliomas. Patients with increased tumor [18F]FDG uptake had a significantly shorter survival (Alavi et al., 1988; Kim et al., 1991; Patronas et al., 1985). Importantly, this was also true within histological groups of high-grade tumors (in particular glioblastoma multiforme), indicating that [18F]FDG PET provides prognostic information beyond histological grading and may represent a more accurate marker of tumor aggressiveness (De Witte et al., 2000; Hölzer et al., 1993; Kim et al., 1991; Patronas et al., 1985). In a more recent large retrospective analysis, 94% of patients with low uptake (less or equal to white matter) survived for more than 1 year (median survival 28 months), while only 29% of patients with higher uptake (more than white matter) survived for more than 1 year (median survival 11 months) (Padma et al., 2003). Patients with primary brain tumors that exhibited persistent low [18F]FDG uptake on follow-up studies had a significantly longer survival than those with increased [18F]FDG uptake (Schifter et al., 1993). This is of particular relevance for follow-up and management of patients with low-grade gliomas that commonly show a malignant transformation during follow-up. Earlier studies demonstrated that malignant transformation of low-grade glioma is accompanied by focal hypermetabolism (Francavilla et al., 1989), which is associated with a considerably worse prognosis (De Witte et al., 1996). Thus, the diagnostic and prognostic information gained from [18F]FDG PET can be of high therapeutic relevance (e.g., by selecting a more aggressive treatment).
Based on the observation that tumor areas with the highest [18F]FDG uptake represent the most aggressive portions of the tumor, [18F]FDG PET can also be used to direct stereotactic biopsies and tumor resections. It was demonstrated that incorporation of [18F]FDG PET in biopsy planning considerably increased the diagnostic yield of biopsies, particularly in high-grade tumors with heterogenic tissue composition (Goldman et al., 1997; Pirotte et al., 1994). Furthermore, [18F]FDG and [11C]methionine PET was found to be helpful in targeting the resection to hypermetabolic/anaplastic tumor areas in high-grade gliomas (Pirotte et al., 2006). Complete removal of hypermetabolic tissue was associated with an increased survival in anaplastic gliomas and glioblastomas, whereas a total resection of MRI contrast-enhancing areas was not (Pirotte et al., 2009). With the same rationale, information on active tumor tissue from [18F]FDG PET was also incorporated into radiation treatment planning (Douglas et al., 2006; Gross et al., 1998; Solberg et al., 2004; Tralins et al., 2002). Based on the few available studies, however, neither tumor volume definition nor targeting dose escalation by [18F]FDG PET had a noticeable impact on survival of patients with high-grade gliomas, compared to literature data and historical controls (Douglas et al., 2006; Gross et al., 1998). However, volumes of abnormal [18F]FDG uptake were of higher predictive value regarding time to progression and survival than MRI (Tralins et al., 2002).
Another important, albeit controversial, use of [18F]FDG PET imaging in brain tumors is the evaluation of persistent or recurrent disease—in particular, differentiation from radiation necrosis. In earlier studies, the sensitivity and specificity of differentiating recurrent brain tumors (including gliomas and metastases of various origins) from radiation necrosis was 80% to 100% and 40% to 100%, respectively (Langleben und Segall, 2000). False-negative findings may result from very recent radiation therapy, pretreatment low FDG uptake (e.g. in low-grade gliomas or metastases with low FDG avidity), and small tumor volumes (due to partial volume effects). Conversely, intense inflammatory reaction after (stereotactic) radiation therapy and seizure activity (possibly unnoticed) may result in false-positive PET findings. Earlier studies were done without PET/MRI co-registration, which can be a relevant source of error. Since [18F]FDG uptake in recurrent brain tumors and neighboring tissue is often lower than the uptake before radiation therapy, it is crucial to evaluate tumor uptake with reference to the expected background uptake in adjacent brain tissue (Chen, 2007). This is hardly possible without accurate anatomical information from MRI. In more recent reports, the sensitivity and specificity for detecting recurrent brain tumors was reported to be 76% to 78% and 95% to 96%, respectively, for gliomas (low and high grade) (Gómez-Río et al., 2008; Wang et al., 2006) and 82% to 86% and 80% to 97%, respectively, for brain metastases (Chao et al., 2001; Wang et al., 2006). Despite these fairly good results, the use of [18F]FDG PET for the purpose of detecting recurrent brain tumors remains controversial, and PET studies with amino acid tracers are probably superior (Fig. 33C.14).
Magnetic resonance spectroscopy (MRS) has been suggested in addition to MRI to help in the characterization of brain tumors by detecting metabolic alterations that may be indicative of the tumor class (Callot et al., 2008). MRS emerged as a clinical research tool in the 1990s, but it has not yet entered clinical practice. Of the principal metabolites that can be analyzed, N-acetylaspartate (NAA) is present in almost all neurons. Its decrease corresponds to neuronal death or injury or the replacement of healthy neurons by other cells (e.g., tumor). Choline-containing compounds increase whenever there is cellular proliferation. Creatine is a marker of overall cellular density. Myoinositol is a sugar only present in glia. Lactate concentrations reflect hypoxic conditions as well as hypermetabolic glucose consumption. The most frequently studied chemical ratios to distinguish tumors from other brain lesions with MRS are choline/creatine, choline/NAA and lactate/creatine. Specifically, a choline/NAA ratio greater than 1 is considered to be indicative of neoplasm. The differentiation between astrocytoma WHO grade II and III is especially difficult. MRS in conjunction with structural MRI has been used to differentiate cystic tumor versus brain abscess (Chang et al., 1998), low-grade glioma versus gliomatosis cerebri, and edema versus infiltration (Nelson et al., 2002). Recent studies have shown that positive responses to radiotherapy or chemotherapy may be associated with a decrease of choline (Lichy et al., 2005; Murphy et al., 2004).
Epilepsy
In drug-refractory focal epilepsy, surgical resection of an epileptogenic focus offers patients the opportunity for a seizure-free outcome or greatly reduced seizure frequency, making epilepsy surgery the treatment method of choice in these patients. Accurate focus localization as a prerequisite for successful surgery is commonly accomplished by a comprehensive presurgical evaluation including neurological history and examination, neuropsychological testing, interictal and ictal electroencephalogram (EEG) depth recordings, high-resolution MRI, and video-EEG monitoring. To circumvent the necessity or, if necessary, to target invasive EEG recordings, [18F]FDG PET and CBF SPECT are often used to gain valuable information about the location of seizure onset. In contrast to the aforementioned PET and SPECT indications in which PET is superior to SPECT, both modalities are equally essential and often complementary in presurgical assessment of patients with drug-refractory focal epilepsy (Goffin et al., 2008). In general, PET and SPECT are of particular diagnostic value if surface EEG and MRI yield inconclusive or normal results (Casse et al., 2002; Knowlton et al., 2008; Willmann et al., 2007). Several neurotransmitter receptor ligands (most notably [11C]/[18F]flumazenil) have been proposed for diagnostic imaging in epilepsy. However, their use is still rather experimental, and their superiority compared to [18F]FDG PET and ictal SPECT have not been validated (Goffin et al., 2008).
Although ictal SPECT alone may show a well-defined region of hyperperfusion corresponding to the seizure onset zone, it is generally recommended to acquire an additional interictal SPECT scan (also under EEG monitoring to exclude seizure activity). By comparison of both scans, even areas with low ictal CBF increases or CBF increases from an interictally hypoperfused state to an apparent “normal” perfused ictal state can be reliably defined. In addition to visual inspection, quantitative analysis of both scans (e.g., SPECT image subtraction with statistical thresholding after accurate co-registration, global count rate normalization, and filtering for noise reduction) and overlay of areas of significant CBF changes onto a corresponding MRI are optimal for focus localization. Such analyses (e.g., subtraction ictal SPECT co-registered to MRI [SISCOM]) have been demonstrated to improve the accuracy and inter-rater agreement of seizure focus localization with ictal SPECT, particularly in frontoparietal neocortical epilepsy (Lee et al., 2006; O’Brien et al., 1998; Spanaki et al., 1999) (Fig. 33C.15). The area with the most intense and extensive ictal CBF increase is commonly assumed to represent the seizure onset zone. However, depending on the time gap between seizure onset and cerebral tracer fixation, ictal SPECT not only depicts the onset zone but also the propagation zone. Therefore, accurate knowledge about the time of tracer injection relative to seizure onset is crucial for ictal SPECT interpretation. CBF increases may propagate to various cortical areas during seizure progression, including the contralateral temporal lobe, insula, basal ganglia, and frontal lobe in patients with temporal lobe epilepsy (TLE), reflecting seizure semiology (Shin et al., 2002). In patients with focal dysplastic lesions, four distinct ictal SPECT perfusion patterns have been observed depending on seizure propagation, during which the area of most intense CBF increase may actually migrate away from the seizure onset zone (Dupont et al., 2006). This underlines the need for rapid tracer injection after seizure onset to localize the onset zone most clearly. An injection delay of 20 to 45 seconds enables optimal localization results (O’Brien et al., 1998; Lee et al., 2006). At later time points and after seizure termination, a so-called postictal switch occurs, leading to hypoperfusion of the onset zone. Thus, within 100 seconds from seizure onset, about two-thirds of ictal SPECT studies can be expected to show hyperperfusion; after that (>100 seconds postictally), hypoperfusion will be observed (Avery et al., 1999).
The diagnostic sensitivity of ictal SPECT to correctly localize the seizure focus (usually with reference to surgical outcome) has been described to be 84% to 97% in TLE and 66% to 92% in extratemporal lobe epilepsy (ETLE) (Devous et al., 1998; Newton et al., 1995; Weil et al., 2001; Zaknun et al., 2008). Focus localization can also be successful by postictal tracer injection, capturing postictal hypoperfusion. However, localization accuracy will be lower (about 70%-75% in TLE and 50% in ETLE) (Devous et al., 1998; Newton et al., 1995). In contrast, interictal SPECT to detect (possibly mild) interictal hypoperfusion is insufficient for focus localization (sensitivity about 50% in TLE; of no diagnostic value in ETLE) (Newton et al., 1995; Spanaki et al., 1999; Zakun et al., 2008).
In contrast to ictal SPECT, [18F]FDG PET studies are regularly performed in the interictal state to image the functional deficit zone, which shows abnormal metabolism between seizures and is generally assumed to contain also the seizure onset zone. The etiology of this hypometabolism is not fully understood and probably relates to functional (e.g., surround inhibition of areas of seizure onset and propagation as a defense mechanism) and structural changes (e.g., neuronal or synaptic loss due to repeated seizures). Therefore, the hypometabolism found on interictal [18F]FDG PET usually extends considerably beyond the actual seizure onset zone. A direct comparison of ictal perfusion abnormalities detected by SISCOM and interictal [18F]FDG PET hypometabolism in TLE patients demonstrated high concordance, suggesting that seizures are generated and spread in metabolically abnormal regions (Bouilleret et al., 2002). To ensure an interictal state, the patient should ideally be seizure free for at least 24 hours before PET and be monitored by EEG after [18F]FDG injection to rule out possible subclinical epileptic activity. The use of a voxel-wise statistical analysis to supplement visual analysis is recommended. Visual analysis by an experienced observer is at least as accurate in TLE patients (Fig. 33C.16), but accuracy and interobserver agreement of focus localization is considerably improved by additional voxel-wise statistical analyses in ETLE (Drzezga et al., 1999) (Fig. 33C.17). Since PET imaging in epilepsy patients relies on hypometabolic areas, its diagnostic value can be severely compromised if a hypometabolic structural abnormality or lesion is present (e.g., low-grade tumor, infarct, contusion). In such cases, ictal SPECT should be preferred to directly image the area of seizure onset.
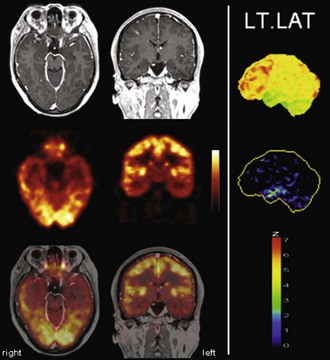
Fig. 33C.16 [18F]FDG PET in left temporal lobe epilepsy. Diagnostic benefit of [18F]FDG PET is greatest in patients with normal MRI (left panel, top row) in which [18F]FDG PET still detects well-lateralized temporal lobe hypometabolism (second row: left temporal lobe hypometabolism). As in this patient with left mesial temporal lobe epilepsy, the area of hypometabolism often extends to the lateral cortex (functional deficit zone; third row: PET/MRI fusion). Right panel, Results of voxel-based statistical analysis of [18F]FDG PET scan using Neurostat/3D-SSP. Given are left lateral views (top image: [18F]FDG uptake; bottom image: statistical deviation of uptake from healthy controls, color-coded as z score; see Fig. 33C.1 for additional details).
(Neurostat/3D-SSP analysis based on Minoshima, S., Frey, K.A., Koeppe, R.A., et al., 1995. A diagnostic approach in Alzheimer’s disease using three-dimensional stereotactic surface projections of fluorine-18-FDG PET. J Nucl Med 36, 1238-1248.)
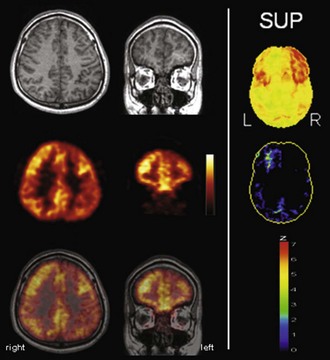
Fig. 33C.17 [18F]FDG PET in left frontal lobe epilepsy. Despite normal MRI scan (left panel, top row), [18F]FDG PET (second row) depicts a circumscribed area of left frontal hypometabolism (i.e., functional deficit zone; third row: PET/MRI fusion). Additional voxel-based statistical analysis of [18F]FDG PET scan is strongly recommended in extratemporal lobe epilepsy to improve sensitivity and reliability (right panel: results of a Neurostat/3D-SSP analysis. Given are views from superior of [18F]FDG uptake (top) and of statistical deviation of uptake from healthy controls, color-coded as z score (bottom); see Fig. 33C.1 for additional details.
(Neurostat/3D-SSP analysis based on Minoshima, S., Frey, K.A., Koeppe, R.A., et al., 1995. A diagnostic approach in Alzheimer’s disease using three-dimensional stereotactic surface projections of fluorine-18-FDG PET. J Nucl Med 36, 1238-1248.)
In recent meta-analyses, the sensitivity of [18F]FDG PET for focus lateralization (rather than localization given the extent of hypometabolism) in TLE was reported to be around 86%, whereas false lateralizations to the contralateral side of the epileptogenic focus rarely occur (<5%) (Casse et al., 2002; Willmann et al., 2007). Consequently, presurgical unilateral temporal hypometabolism predicts a good surgical outcome (Engel Class I-II) in 82% to 86% of total TLE cases and even 80% and 72% in TLE patients with normal MRI and nonlocalized ictal scalp EEG, respectively (Casse et al., 2002; Willmann et al., 2007). In contrast, asymmetrical thalamic metabolism (particularly in reverse direction to temporal lobe asymmetry) and extratemporal cortical hypometabolism (in particular of the contralateral hemisphere) are associated with poor postoperative seizure control (Choi et al., 2003; Newberg et al., 2000). In ETLE, the sensitivity of [18F]FDG PET is lower, providing a seizure focus localization in about 67% of ETLE patients (Casse et al., 2002; Drzezga et al., 1999). Again, correct localization by [18F]FDG PET was demonstrated to be a significant predictor of a good surgical outcome in a recent large study in patients with neocortical epilepsy (Yun et al., 2006).
Few large-scale studies directly compared ictal SPECT and interictal [18F]FDG PET. Comparing rates of correct lateralizations provided by [18F]FDG PET and [99mTc]HMPAO SPECT in patients with good surgical outcome revealed that the overall performance of [18F]FDG PET was slightly better (86%, compared to 78% for SPECT), mainly because of higher accuracy in TLE cases (90% versus 83%; 64% versus 62% in ETLE) (Won et al., 1999). In patients with focal cortical dysplasia (FCD), [18F]FDG PET showed a corresponding focal hypometabolism in 71% and SPECT an ictal hyperperfusion in 60% of cases. However, unlike the extent of lesion resection and pathological features, neither PET nor SPECT findings predicted good surgical outcome in FCD (Kim et al., 2009a). A prospective study was recently performed in patients who had ETLE in the majority of cases and in which seizure onsets could not be localized by scalp EEG and MRI. In this challenging patient population, the sensitivity/specificity (with respect to surgical outcome) of PET and SPECT were 59%/79% and 50%/72%, respectively (Knowlton et al., 2008). Finally, in pediatric patients, [18F]FDG PET was found particularly valuable in TLE (correct lateralization/localization 96%/73%), whereas ictal CBF SPECT with SISCOM was more accurate in ETLE (correct lateralization/localization 92%/85%) (Kim et al., 2009).
Presurgical Brain Mapping
The use of BOLD-based fMRI for presurgical mapping has been one of the first clinical applications for fMRI. Despite multiple efforts to develop standardized and reproducible paradigms for routine use, there has been a certain reluctance to use fMRI as a presurgical tool. There is uncertainty about the origin and basis for the BOLD signal and about the physiological meaning of “activation” foci measured with fMRI. In a scientific research environment, in which the pros and cons of fMRI can be carefully weighed, information from fMRI has been extremely helpful. But is the technique foolproof enough for widespread use in clinical diagnostic and therapeutic decision making? An absolute requirement on the part of the treating physician is a profound and detailed understanding of the potentials and pitfalls of this technique. As brain function is organized in networks, sparing a “focus of activation” during operation does not necessarily mean preservation of function, and vice versa. The reason for this is the “the trouble with cognitive subtraction” (Friston et al., 1996). Subtracting an “easy” control task from a more difficult one does not reflect the way the brain works, as interaction analyses have shown. In addition, fMRI data are usually thresholded to dissociate true activations from spurious “activations,” thus minimizing type I errors. Unfortunately, this is not absolute, since statistical thresholding can only reduce the errors but not completely avoid them. Using fMRI for presurgical planning poses a different problem, namely that of sensitivity minimizing type II error (false negative results). This is a difficult task because when using very low thresholds in fMRI analyses, many areas of the brain are seen as activated. Furthermore, the BOLD signal differs significantly between individuals, and therefore absolute thresholds set for a whole population are unreliable (Klöppel and Büchel, 2005). Nevertheless, the potential use seems very attractive for clinicians, and every effort should be made to improve the quality and interpretation of these measurements. Paradigms involving verbal fluency, semantic decisions, or verb generation activate frontal language areas. The combination with auditory comprehension tasks can increase the validity of lateralization testing (Carpentier et al., 2001). Lehéricy et al. (2000) found no significant correlation between Wada test lateralization and fMRI activation patterns in temporal areas but did find correlations in frontal areas and the anterior insula for semantic fluency and story-listening tasks. Prediction of postsurgical naming ability is more reliable with fMRI than with Wada testing (Sabsevitz et al., 2003). Verbal memory is reduced on the side of the seizure focus in mesial temporal lobe epilepsy (Jokeit et al., 2001). On a single subject level, Janszky et al. (2005) found a high correlation between lateralization in fMRI and memory outcome. Standard procedures for presurgical mapping with fMRI (e.g., in epilepsy surgery) have been developed (Fernández et al., 2001) that include fiber tracking as well as BOLD-based fMRI. Robust fiber tracking with definite-endpoint tools should significantly facilitate this application (Kreher et al., 2007, 2008). Moreover, maps of fiber connections in the human brain may be used as a priori knowledge for the interpretation of functional neuroimaging data. These approaches are expected to contribute significantly to the development of models of brain function but have not really been used thus far.
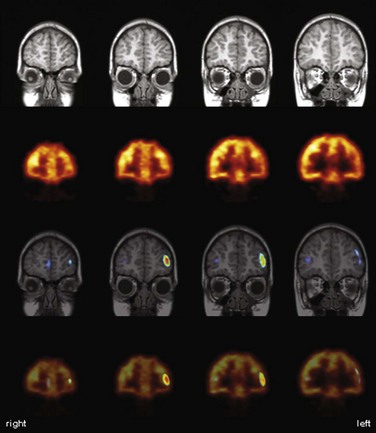
Imaging with [18F]FDG PET has also been employed for preoperative functional mapping of eloquent cortices using language or motor activation tasks. By contrasting an activation scan with a rest scan, a sensitivity of 94% and a specificity of 95% for identification of motor-associated brain areas have been reported in comparison to direct cortical electrostimulation (DCES) (Schreckenberger et al., 2001). Of note, the rest scan can also be used for diagnostic brain tumor workup. Despite the fact that such studies yield strong and robust activation signals (e.g., 21% and 17% metabolism increases for hand and foot movement, respectively) (Schreckenberger et al., 2001), presurgical PET activation studies assessing CBF changes with [15O]water offer the advantage of allowing multiple studies covering several eloquent areas in shorter time because of the short half-life of oxygen-15. In conjunction with statistical parametric mapping (SPM), such [15O]water PET activation studies were demonstrated to be a suitable method for mapping of motor and language functions and possible detection of functional reorganization processes in brain tumor patients (Meyer et al., 2003a, 2003b). Functional MRI offers the advantage of being widely available (in contrast to [15O]water PET, which is dependent on an onsite cyclotron) and easily implemented in clinical practice. Presurgical fMRI has been validated against [18F]FDG and [15O]water activation PET and DCES (Krings et al., 2001; Reinges et al., 2004). Functional MRI provides comparable results in motor activation tasks, but in speech activation tasks, PET offers the advantages of greater activation signals (higher sensitivity), lower susceptibility to motion artifacts (e.g., during overt articulation, important to verify adequate task performance), and considerably lower ambient noise.
Recovery from Stroke
During the last 20 years, the application of functional brain imaging to stroke patients has brought new insights into the field of rehabilitation (Rijntjes and Weiller, 2002). We understand better what happens in the brain after stroke. For example, we “see an active ipsilateral motor cortex” when we notice mirror movements of the healthy hand during ward rounds, or we assume the resolution of diaschisis when language performance improves abruptly from one day to the next within the first week after a stroke.
Imaging the acute phase of stroke (i.e., the first days after stroke onset) offers the opportunity for unique insights into the function and dysfunction of the brain. Various effects may be differentiated, resulting in the observed clinical deficit (Fig. 33C.18, A).
Ischemia directly affects functionally relevant gray- or white-matter structures, resulting in either complete or incomplete infarction (Weiller et al., 1993b). In the acute phase, symptoms often fluctuate owing to the instability of the lesion. This is mainly caused by changes in cerebral perfusion and the extension of the peri-infarct edema. For example, reperfusion of the left posterior middle temporal and frontal areas may be associated with early improvement in picture naming (Hillis et al., 2006).
The structural lesion itself may cause a dysfunction in remote noninfarcted but connected areas. The concept of “diaschisis” was introduced by von Monakow (1906). Diaschisis is seen as a temporary disturbance of function through disconnection. Von Monakow thereby integrated localist ideas with holistic views. Taken together, the lesion of a critical network component may result in an acute global network breakdown. In this situation, we typically observe a more severe functional deficit.
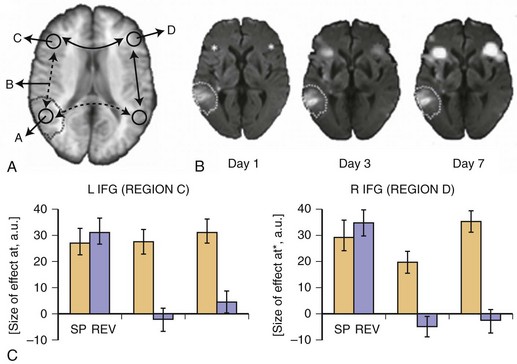
Reversal of diaschisis may explain acute functional improvements. Von Monakow related this phenomenon predominantly to higher cortical functions such as language. Fig. 33C.19 shows an example of early fMRI activation in a patient with acute global aphasia due to a left temporal middle cerebral artery (MCA) infarction. In an auditory language comprehension task, the patient listened to three sentences of intelligible speech (SP) and also listened to sentences of reversed speech (REV). Extraction of condition-wise effect sizes (see Fig. 33C.19, B) showed that in the hyperacute phase about 10 hours after onset, remote left and right inferior frontal gyrus (IFG) were dysfunctional. Although a strong effect for both the SP and REV conditions was observed, neither area distinguished between intelligible SP and unintelligible REV, inasmuch as activation was the same for both tasks. However, 3 and 7 days later, in parallel with improvements in language behavior, a clear differentiation between conditions returned to both brain areas, indicating functional recovery of these remote areas, which most likely might be explained by a resolution of diaschisis. That is, injury to the left temporal language areas produced diaschisis in bilateral IFG, which produced dysfunction and inability to distinguish SP from REV. With resolution of diaschisis, bilateral IFG function returned, and these language network areas were able to function and thereby contribute to effective language behavior and thus compensate for the deficit (Saur et al., 2006b).
Imaging the acute state in patients with aphasia may offer another lesson related to our understanding of subcortical aphasia. Aphasia in striatocapsular infarction was related to the cortical hypoperfusion caused by an occlusion of the proximal segment of the MCA, rather than the subcortical infarction itself. This cortical hypoperfusion led to a subsequent cortical atrophy 1 year later (Weiller et al., 1990), interpreted as selective neuronal loss (Weiller et al., 1993), which is typically invisible on conventional MRI but detectable with [123I]iomazenil SPECT (Saur et al., 2006a). This observation was later confirmed by a perfusion imaging study by Hillis et al. (2002), who demonstrated that aphasia due to acute subcortical infarction can be largely explained by concurrent cortical hypoperfusion. These findings underline the importance of accurately characterizing acute ischemia, including registration of hypoperfused tissue by performing multiparametric MRI sequences.
A note of caution is warranted here. Obviously fMRI is only associated with relative changes in cerebral perfusion performed with the BOLD technique. This may and will produce misleading results in patients with altered global blood flow, as in the acute or subacute state of stroke (e.g., hypoperfusion, hyperemia). The BOLD response is affected by internal carotid artery occlusion (Altamura et al., 2009; Hamzei et al., 2003). In these situations, currently the only reliable approach is to use absolute measurements performed with PET. In the future, arterial spin labeling may be used for fMRI studies as a means to ultimately obtain absolute quantification for perfusion studies (Hernandez-Garcia et al., 2010; Kelly et al., 2010). The infarct does affect the normalization procedure, BOLD responses vary with age, making the use of age-matched controls mandatory, and finally, the relation of function (e.g., force) to rCBF may be different in stroke patients from normals requiring different approaches in data analysis (Dettmers et al., 1997).
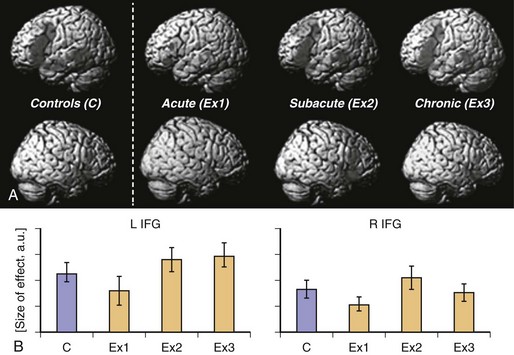
Neural reorganization of language functions may be better understood by imaging the recovery process throughout all phases after stroke, which allows one to relate changes in language performance to changes in language-related brain activation. Saur et al. (2006) performed the same auditory comprehension task as described earlier for the single subject study on a heterogeneous group of 14 aphasic patients suffering from a left MCA stroke affecting temporal, frontal, and subcortical brain regions. The fMRI data were collected in the acute (<4 days after stroke, Exam 1), subacute (about 2 weeks after stroke, Exam 2), and chronic (4-12 months after stroke, Exam 3) phases of recovery. Across these three fMRI exams, patients recovered from aphasia. Group analysis of the fMRI data (see Fig. 33C.19, A) revealed little or no left hemisphere (see Fig. 33C.19, A, top row) activation in the acute stage, followed by a strong bilateral increase in activation in the subacute stage, peaking in the right hemisphere (see Fig. 33C.19, A, bottom row), the homolog of the Broca area. In the chronic phase, a consolidation and gradual normalization emerged, with a “re-shift” to the left hemisphere. Language-specific effect sizes (see Fig. 33C.19, B; SP contrasted with REV) showed a continuous increase throughout all phases in left inferior frontal gyrus, while in the right hemisphere homologue, a more biphasic course with a temporary increase in the subacute stage was observed. The early increase of activation in right hemisphere homolog of the Broca area correlated with early improvement of language function. Since in this study, an overall pattern of reorganization was derived from a heterogeneous group of stroke patients, relating of the group activation to the lesion site was not possible. Consequently, Saur et al. (2009) investigated a homogeneous group of eight patients who all suffered from a left temporal infarction. The greatest lesion overlap in this group was found in the anterior temporal lobe. The longitudinal study design was the same as described earlier. Again, in the acute phase, reduced activation in the entire language network was found, including the uninfarcted left frontal cortex. Since in all patients, left inferior frontal cortex was intact, we interpreted the reduced activation in this area as a demonstration of diaschisis due to disconnection of left temporal cortex and left frontal cortex. In the subacute phase, an increase in bilateral frontal region was observed. Finally, in the chronic phase, perilesional activation in posterior temporal areas emerged. This perilesional activation was found in areas also activated in healthy subjects, indicating a reactivation of temporarily dysfunctional tissue rather than a true recruitment of novel brain areas. From these studies, a longitudinal three-phase model of brain reorganization during recovery from aphasia was derived (Rijntjes and Weiller, 2002; Saur et al., 2006). In the acute phase, nearly complete abolishment of language function is reflected by little if any activation in brain regions which later can be activated by language tasks. In this acute phase, there is a global network breakdown in which “diaschisis” or ischemic stunning (Alexandrov et al., 2004) is the key factor. A second “hyperactive” stage of brain activation follows in which the altered function recovers at a rapid pace. It is characterized by a sudden return of activation in the left hemisphere and often a hyperactivation of homolog right hemisphere areas and may include reversal from diaschisis. In the third stage, a consolidation of activation resembling the patterns in healthy controls follows. It is unclear whether similar patterns occur in the motor system following infarction.
The majority of imaging studies on language recovery were performed in the chronic phase after stroke. In these studies, patients who recovered to various degrees were examined one or more times with PET or fMRI to identify the pattern of the activation in the lesioned brain. These studies with very heterogeneous designs, methods, and patients have shown that brain reorganization after stroke comprises areas that are also activated under normal conditions during language tasks, involve both the lesioned and the contralesional hemisphere, and often require compensatory mechanisms (Heiss et al., 1999; Leff et al., 2002; Musso et al., 1999; Rosen et al., 2000; Sharp et al., 2004; Warburton et al., 1999; Weiller et al., 1995; Zahn et al., 2006). More specific conclusions can be drawn by correlating the proficiency of a particular function with task-related activation in a cross-sectional design. For instance, Crinion and Price, (2005) demonstrated in a group of 17 patients with left temporal lobe stroke that performance in auditory sentence comprehension was positively correlated with activation in the right lateral superior temporal gyrus. These results demonstrate that in the chronic phase, too, right hemisphere activation might be beneficial. Additional evidence comes from a dynamic challenge in which repetitive behavioral studies are performed. Musso et al. (1999) showed that after repeated 8-minute sessions of language comprehension training, subsequent behavioral improvement correlated with an increase of activation in the right temporal cortex, supporting a role for right hemisphere language homolog areas in language function after stroke.
Several studies have shown task-related activation changes from pre- to posttreatment scans. Even short-term treatment may influence the neural basis of language processing. Studies by Musso et al. (1999) and Blasi et al. (2002) demonstrated increased activity in the right frontal cortex associated with learning a word retrieval task. Studies performing long-term training found left (Cornelissen et al., 2003; Leger et al., 2002; Meinzer et al., 2008; Vitali et al., 2007), right (Crosson et al., 2005; Raboyeau et al., 2008), or bilateral activation to be associated with treatment-induced improvement (Fridriksson et al., 2006, 2007; Meinzer et al., 2007). In contrast, Richter et al. (2008) found no significant changes of fMRI activation at all after 2 weeks of “constraint-induced aphasia therapy.” This heterogeneity of results is best explained by differences in treatment strategies and language impairments, as well as differences in lesion sites and sizes. In post-stroke brain reorganization, as with many aspects of stroke recovery, many factors can contribute to differences between patients. However, these studies do demonstrate clearly that remodeling of cortical functions is possible even years after stroke and typically occurs in both the left and right hemispheres as well as perilesional language zones, similar to what has been described in the motor system (Liepert et al., 2000).
Most brain functions are organized in distributed, segregated, and interconnected networks, and brain reorganization due to lesions or interventions mainly takes place within the framework of these networks (Rijntjes and Weiller, 2002; Weiller and Rijntjes, 1999). Language is a brain function especially suited to assessing a network approach during recovery after injury, as it is represented in a widespread bilateral fashion. Recent combinations of fMRI with probabilistic fiber tracking, integrating pairwise point-to-point anatomical connections along with measurements of functional connectivity, resulted in a relatively complete network description of language processing around the sylvian fissure (Saur et al., 2008, 2010). In contrast to classical diagrams that suppose speech comprehension to be localized in the temporal lobe, speech production in the inferior frontal lobe, and both regions connected through the arcuate fascicle, the modern anatomical view proposes that the left temporal lobe connects to most of the frontal lobe along two segregated and integrating large association tracts (Anwander et al., 2007; Frey et al., 2009; Makris et al., 2008; Saur et al., 2008) (Fig. 33C.20). A dorsal route along the arcuate fasciculus/superior longitudinal fasciculus mainly projects to premotor cortices for automated sensory-motor mapping, while several aspects of language comprehension utilize a ventral route via the extreme capsule mainly projecting to the prefrontal cortex. These new findings not only require a new description of anatomical correlation of language functions and dysfunctions but also imply various routes of compensation after stroke.
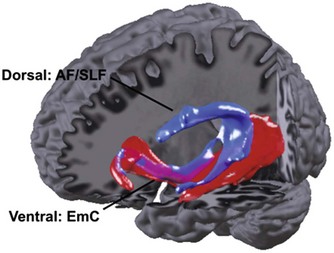
The network view addresses another frequent misconception, namely the assumption of functional independence of brain “centers.” As an example, conduction aphasia, which is often defined as an isolated repetition failure with preserved comprehension and spontaneous speech, is supposed to result from a destruction of the pathway (i.e., the arcuate fascicle) connecting the sensory and the motor speech centers, which themselves are intact. Such a conclusion assumes that the temporal lobe suffices for comprehension, and the inferior frontal cortex for language production, and that a disruption of the connecting pathway does not affect the function of either area. We know from imaging experiments that this is not true. Semantic tasks activate the Broca area and propositional speech as well as the temporal lobe (Vigneau et al., 2006). The various constituents of language circuitry are not independent from each other; interruptions in the network have an impact on the remaining parts of the network. In other words, the functions of the Broca or Wernicke areas with an intact arcuate fascicle may not be the same as after that fascicle’s destruction. The network view takes this into account when interpreting symptoms and activations in patients with aphasia.
If the individual nodes of the network influence each other through their connections, the importance of a network node might be determined by the number of its connections used for a certain task. This leads directly to the concept of critical lesions. The more important a network node is to a behavior, the more behavioral effects its lesioning will have. Using a combination of functional and anatomical connectivity to identify networks subserving auditory language comprehension within a temporofrontal network, the posterior part of the middle temporal gyrus and the inferior frontal gyrus in the left hemisphere were identified as having the most functionally relevant connections (Saur et al., 2008). Therefore, both regions are especially important in comprehension. One question posed was how much of the left hemisphere network had to be spared to prevent right hemisphere recruitment (Rijntjes and Weiller, 2002). The network approach described previously would focus this question to critical lesions of the left hemisphere (i.e., those that affect the regions with most connections). For example, in patients with temporal lesions sparing the posterior temporal region, it is exactly this posterior region which shows the best correlation with language performance over time (Sauer et al., 2010). In contrast, if this posterior region is spared, the contralateral hemisphere comes into play (Weiller et al., 1995). However, there is also a clear hierarchy between the nodes of a network such as the Broca area, which is indispensable for grammar (Musso et al., 2003).
Combining functional and structural network identification procedures is a promising approach to improve our understanding of loss and recovery of brain functions. However, beyond this more theoretical interest, we suggest that a precise description of the lesioned network might be useful to guide the application of focal brain stimulation techniques such as transcranial direct current stimulation, or rTMS (e.g. Naeser et al., 2005; see also Chapter 32C). In future settings, patients will be investigated with fMRI and diffusion tensor imaging prior to brain stimulation. Processing of the impaired language function will be analyzed with the earlier-mentioned network identification procedures. Subsequent brain stimulation and adjuvant therapies might then be applied to the identified central processing nodes to support behavioral training.
Three phases of reorganization after stroke with aphasia or hemiparesis can now be described in some detail, and it is probable that therapies should be adjusted depending on the phase the patient is in. For example, to stimulate the second phase in motor stroke, characterized by bilateral activations, it might be opportune to offer therapies that also involve the ipsilateral contralesional hemisphere (Winhuisen et al., 2005). However, there is still a complete lack of relating the phase of recovery with overt performance. At the moment, no clinical correlate is known for determining, for example, whether a patient is in the second phase or third phase of recovery.
Functional imaging has shown that improvement can be associated with different patterns of reorganization (Feydy et al., 2002; Weiller et al., 1993). For example, in motor stroke, improvement after CIMT can be associated either with an increase or a decrease of activation in the primary motor cortex, depending on the size of the pyramidal tract lesion (Hamzei et al., 2006, 2008). However, it is unclear whether one pattern is more beneficial than the other in the long term, or if patients with one pattern need more or different therapy.
In rehabilitation from stroke, information about the relationship between the amount of therapy and the amount of improvement is scarce. Similar to pharmacological studies, dose-response curves should be developed (Dobkin, 2005). Functional imaging could point to the appropriate time for the application of certain therapies and might be helpful to see whether a plateau of activation is reached, which could indicate that a change of strategy is required.
The relationship between changes in motor or language scores and BOLD signal is not fully understood. Scores are not continuous and were developed for interobserver reliability, consistency over time, or for comparisons between patients, not for comparison with brain activity. If one patient on a clinical scale improves from grade 2 to grade 4 and another one from grade 4 to grade 6, should they show similar increases in activation? Already, early studies have shown that the relationship between performance and activation is not necessarily a linear one (Dettmers et al., 1995).
In summary, it is probable that therapies should be tailored to the anatomical lesion, clinical deficit, and maybe even the activation patterns of individual patients. Currently, many new therapies are being investigated with the intention of stimulating the remaining network after stroke (Liepert, 2008). Functional imaging is very well suited to assess which therapies might be appropriate for which patient, and when an increase or a change of therapy is indicated. However, to achieve this, the clinical correlate of activation patterns should be better known, and therapies should be verified in randomized controlled studies.
Multiple Sclerosis
In recent years, there have been a number of functional imaging studies in patients with MS that have shown cortical reorganization similar to that observed in stroke patients. It is worthwhile to compare data from these two diseases, because the process can lead to new ideas about symptoms and therapies in each of them. The present comparison is limited to the motor system, which has been studied most extensively. Two recent reviews summarize the principal findings of patterns of brain reorganization in patients with MS (Pantano et al., 2006; Rocca and Filippi, 2007). Like in ischemic stroke (Ward et al., 2003), the first reaction of the sensorimotor system to an MS lesion that leads to paresis is an up-regulation of the whole network, with a subsequent gradual decrease toward normal levels as the paresis improves (Reddy et al., 2000).
In cross-sectional studies in relapsing-remitting (Pantano et al., 2002; Saini et al., 2004), primary progressive (Rocca et al., 2002), and secondary progressive MS patients (Rocca et al., 2003), the patients activate the sensorimotor network more than healthy controls. In all three variants of the disease, there is a strong association with the lesion burden, measured by standard T2-weighted imaging, by fractional anisotropy in diffusion tensor MRI data, or by spectroscopic assessment of NAA levels using MRS. Prominent examples of up-regulation have been found in the premotor cortex, SMA, ipsilateral or contralateral sensorimotor cortex, and cerebellum (Lee et al., 2000; Pantano et al., 2006; Rocca and Filippi, 2007). There has been some variability in these observations, although this seems to be more related to the activation magnitude than to the overall pattern, while increased recruitment of the bilateral motor system correlates with lesion load (Giorgio et al., 2010; Rocca et al., 2002, 2003). Variations probably depend more on the lesion localization than on the type of MS, which is also well documented in stroke patients (Rijntjes, 2006).
As in stroke (Foltys et al., 2003), simple movements elicit activation patterns in patients that are normally associated with the performance of difficult movements in healthy controls (Filippi et al., 2004). Whether MS patients regain complete function after hemiparesis seems to depend on the ability to involve motor areas of the affected hemisphere (Mezzapesa et al., 2008), a finding also reported in stroke patients (Rijntjes, 2006).
One interesting recent finding is that in patients with MS in which reorganization of the motor system has taken place, learning a new task is not accompanied by training-dependent reductions in activation, as is known from healthy subjects (Morgen et al., 2004). This question has not yet been investigated in stroke patients.
The adaptive changes in the brain probably limit the symptoms of MS, but the eventual exhaustion of these plastic capabilities may lead to clinical manifestations of the respective deficit (Pantano et al., 2006; Rocca and Filippi, 2007). It is tempting to suggest that fatigue, which is a common symptom in MS patients, occurs when this capacity for recruitment of additional parts of the network is exhausted. Two studies in MS patients found a clear-cut correlation between the degree of fatigue and the amount of activation in the sensorimotor system (Filippi et al., 2002; Tartaglia et al., 2004).
Lessons from Stroke Relevant to Multiple Sclerosis
Several centrally acting drugs have been successfully employed in stroke patients, inducing reorganizational changes in the motor system and correlating with clinical improvement (Liepert, 2008). It might be worthwhile to consider whether one or more of them might also be beneficial for MS patients.
Physical therapy is a basic strategy for treating the motor deficits in both diseases. In stroke patients, CIMT (Taub et al., 2002) has been proven to induce cortical reorganization, and there is probably no reason not to try this form of therapy in MS patients with hemiparesis.
Studies that investigate reorganization in stroke usually include patients with a single lesion, but the size and extent of the lesion generally correlates poorly with the functional disability (Binkofski et al., 2001). However, if precise anatomical information on the posterior limb of the internal capsule is available (Wenzelburger et al., 2005), a rough prognosis can be made. In MS studies, a different approach is usually taken, where the complete lesion load in the brain is correlated with motor performance. Although a correlation is commonly found in these studies, a more precise anatomical delineation of lesions would perhaps lead to an even better correlation with clinical deficits. Of course, the possibility of spinal cord lesions in MS patients should be taken into account using this approach.
Lessons from Multiple Sclerosis Relevant to Stroke
Fatigue is a well-known problem in MS patients but not commonly diagnosed in stroke patients, maybe because therapists tend to focus on the focal deficit. However, older anecdotal (Brodal, 1973) and recent multisubject reports indicate that fatigue might also be common in stroke patients (Carlsson et al., 2003, 2004; Choi-Kwon et al., 2005). It would be interesting to investigate whether the same principles apply as have been shown in MS.
So-called silent reorganization—changes in the organization of the sensorimotor system that possibly prevent clinical deficits in MS—might also prevent patients with microangiopathy from developing symptoms in the early stage. In one study in patients with cerebral autosomal-dominant arteriopathy with subcortical infarcts and leukoencephalopathy (CADASIL), a similar pattern of silent reorganization has been demonstrated (Reddy et al., 2002).
Reorganization of the motor system in MS patients interferes with the normal activation changes seen in healthy subjects during learning a new task (Morgen et al., 2004). It should be investigated whether this phenomenon is also present in stroke patients and whether it correlates with the ability to maintain performance.
Conscious and Unconscious Processes
Sleeping subjects show enhanced activity in those parts of the brain that were active while the individual was awake (Maquet et al., 2000). Patients with apallic syndromes (vegetative states) do not show meaningful responses to outside stimuli, which is usually interpreted to mean that they are not capable of conscious thought. However, surprisingly, some of them still seem to understand at least some tasks: when lying in a scanner and instructed to image walking around at home, they sometimes show activations in areas that are similar to healthy subjects doing the same task (Owen et al., 2006). It should be asked, therefore, to what extent is consciousness preserved in these patients. In conscious persons, unconscious processes can be visualized with functional imaging. For example, in patients with chronic pain, the so-called placebo-effect leads to activations in regions in the brainstem and spinal cord that correlate with the pain-relieving impact of the placebo (Eippert et al., 2009a, 2009b).
Functional imaging has also been used to investigate moral questions. It is possible to correlate activation patterns with deliberate lying (Langleben et al., 2005) or with psychopathic traits (Fullam et al., 2009). Some investigators call this forensic imaging. In certain experimental settings, an investigator can recognize from the pattern of activation whether a promise will subsequently be broken, even if subjects report that they had not yet reached a decision at that time point (Baumgartner et al., 2009).
At the moment, there is hardly a state of mind in disease and health that is not investigated with functional imaging. Even religious feelings have been “captured” in the scanner. It has long been known that some patients with temporal epilepsy report strong religious experiences, and it is possible to evoke such feelings with magnetic fields in healthy subjects (Booth et al., 2005). Using functional imaging, it appears that brain areas active during a religious experience in believers (Azari et al., 2001; Beauregard and Paquette, 2006; Kapogiannis et al., 2009) are also involved in ethical decisions, empathy for the feelings of other persons (“theory of mind”), and strong emotions (Greene et al., 2004; Hein and Singer, 2008; Young et al., 2007). Again, very divergent conclusions from these findings are possible. For some, they point to the possibility that religion evolved from processes that developed during evolution and that have to be applied in daily life for a person functioning properly as a member of society (Boyer, 2008). In this interpretation, religion could be a product of evolution. However, for those who believe in divine revelation, the information that religious feelings are processed by brain areas that are competent for them will be wholly unspectacular.
Alavi J.B., Alavi A., Chawluk J., et al. Positron emission tomography in patients with glioma. A predictor of prognosis. Cancer. 1988;62:1074-1078.
Albin R.L., Minoshima S., D’Amato C.J., et al. Fluoro-deoxyglucose positron emission tomography in diffuse Lewy body disease. Neurology. 1996;47:462-466.
Alexandrov A.V., Hall C.E., Labiche L.A., et al. Ischemic stunning of the brain: early recanalization without immediate clinical improvement in acute ischemic stroke. Stroke. 2004;35:449-452.
Altamura C., Reinhard M., Vry M.S., et al. The longitudinal changes of BOLD response and cerebral hemodynamics from acute to subacute stroke. A fMRI and TCD study. BMC Neurosci. 2009;10:151.
Anchisi D., Borroni B., Franceschi M., et al. Heterogeneity of brain glucose metabolism in mild cognitive impairment and clinical progression to Alzheimer disease. Arch Neurol. 2005;62:1728-1733.
Antonini A., Leenders K.L., Vontobel P., et al. Complementary PET studies of striatal neuronal function in the differential diagnosis between multiple system atrophy and Parkinson’s disease. Brain. 1997;120:2187-2195.
Anwander A., Tittgemeyer M., von Cramon D.Y., et al. Connectivity-based parcellation of Broca’s area. Cereb Cortex. 2007;17:816-825.
Avery R.A., Spencer S.S., Spanaki M.V., et al. Effect of injection time on postictal SPET perfusion changes in medically refractory epilepsy. Eur J Nucl Med. 1999;26:830-836.
Azari N.P., Nickel J., Wunderlich G., et al. Neural correlates of religious experience. Eur J Neurosci. 2001;13:1649-1652.
Baumgartner T., Fischbacher U., Feierabend A., et al. The neural circuitry of a broken promise. Neuron. 2009;64:756-770.
Beauregard M., Paquette V. Neural correlates of a mystical experience in Carmelite nuns. Neurosci Lett. 2006;405:186-190.
Binkofski F., Seitz R.J., Hacklander T., et al. Recovery of motor functions following hemiparetic stroke: a clinical and magnetic resonance-morphometric study. Cerebrovasc Dis. 2001;11:273-281.
Blasi V., Young A.C., Tansy A.P., et al. Word retrieval learning modulates right frontal cortex in patients with left frontal damage. Neuron. 2002;36:159-170.
Booth J.N., Koren S.A., Persinger M.A. Increased feelings of the sensed presence and increased geomagnetic activity at the time of the experience during exposures to transcerebral weak complex magnetic fields. Int J Neurosci. 2005;115:1053-1079.
Borghammer P., Cumming P., Aanerud J., et al. Artefactual subcortical hyperperfusion in PET studies normalized to global mean: lessons from Parkinson’s disease. Neuroimage. 2009;45:249-257.
Borgwardt L., Højgaard L., Carstensen H., et al. Increased fluorine-18 2-fluoro-2-deoxy-d-glucose (FDG) uptake in childhood CNS tumors is correlated with malignancy grade: a study with FDG positron emission tomography/magnetic resonance imaging coregistration and image fusion. J Clin Oncol. 2005;23:3030-3037.
Bouilleret V., Valenti M.P., Hirsch E., et al. Correlation between PET and SISCOM in temporal lobe epilepsy. J Nucl Med. 2002;43:991-998.
Boyer P. Being human: Religion: bound to believe? Nature. 2008;455:1038-1039.
Brodal A. Self-observations and neuro-anatomical considerations after a stroke. Brain. 1973;96:675-694.
Brooks D.J. Imaging approaches to Parkinson disease. J Nucl Med. 2010;51:596-609.
Callot V., Galanaud D., Le Fur Y., et al. (1)H MR spectroscopy of human brain tumours: a practical approach. Eur J Radiol. 2008;67:268-274.
Carlsson G.E., Moller A., Blomstrand C. Consequences of mild stroke in persons <75 years–a 1-year follow-up. Cerebrovasc Dis. 2003;16:383-388.
Carlsson G.E., Moller A., Blomstrand C. A qualitative study of the consequences of “hidden dysfunctions” one year after a mild stroke in persons <75 years. Disabil Rehabil. 2004;26:1373-1380.
Carpentier A., Pugh K.R., Westerveld M., et al. Functional MRI of language processing: dependence on input modality and temporal lobe epilepsy. Epilepsia. 2001;42:1241-1254.
Casse R., Rowe C.C., Newton M., et al. Positron emission tomography and epilepsy. Mol Imaging Biol. 2002;4:338-351.
Chang K.H., Song I.C., Kim S.H., et al. In vivo single-voxel proton MR spectroscopy in intracranial cystic masses. AJNR Am J Neuroradiol. 1998;19:401-405.
Chao S.T., Suh J.H., Raja S., et al. The sensitivity and specificity of FDG PET in distinguishing recurrent brain tumor from radionecrosis in patients treated with stereotactic radiosurgery. Int J Cancer. 2001;96:191-197.
Chen W. Clinical applications of PET in brain tumors. J Nucl Med. 2007;48:1468-1481.
Cherry S.R., Blowey R.W., Phelps M.E. Physics in Nuclear Medicine, third edition. Saunders; 2003.
Choi J.Y., Kim S.J., Hong S.B., et al. Extratemporal hypometabolism on FDG PET in temporal lobe epilepsy as a predictor of seizure outcome after temporal lobectomy. Eur J Nucl Med Mol Imaging. 2003;30:581-587.
Choi-Kwon S., Han S.W., Kwon S.U., et al. Poststroke fatigue: characteristics and related factors. Cerebrovasc Dis. 2005;19:84-90.
Cornelissen K., Laine M., Tarkiainen A., et al. Adult brain plasticity elicited by anomia treatment. J Cogn Neurosci. 2003;15:444-461.
Crinion J., Price C.J. Right anterior superior temporal activation predicts auditory sentence comprehension following aphasic stroke. Brain. 2005;128:2858-2871.
Crosson B., Moore A.B., Gopinath K., et al. Role of the right and left hemispheres in recovery of function during treatment of intention in aphasia. J Cogn Neurosci. 2005;17:392-406.
De Witte O., Lefranc F., Levivier M., et al. FDG-PET as a prognostic factor in high-grade astrocytoma. J Neurooncol. 2000;49:157-163.
De Witte O., Levivier M., Violon P., et al. Prognostic value positron emission tomography with [18F]fluoro-2-deoxy-d-glucose in the low-grade glioma. Neurosurgery. 1996;39:470-476.
Delbeke D., Meyerowitz C., Lapidus R.L., et al. Optimal cutoff levels of F-18 fluorodeoxyglucose uptake in the differentiation of low-grade from high-grade brain tumors with PET. Radiology. 1995;195:47-52.
Dettmers C., Fink G.R., Lemon R.N., et al. Relation between cerebral activity and force in the motor areas of the human brain. J Neurophysiol. 1995;74:802-815.
Dettmers C., Stephan K.M., Lemon R.N., et al. Reorganization of the executive motor system afte stroke. Cerebrovasc Dis. 1997;7:187-200.
Devous M.D.Sr., Thisted R.A., Morgan G.F., et al. SPECT brain imaging in epilepsy: a meta-analysis. J Nucl Med. 1998;39:285-293.
Di Chiro G., DeLaPaz R.L., Brooks R.A., et al. Glucose utilization of cerebral gliomas measured by [18F] fluorodeoxyglucose and positron emission tomography. Neurology. 1982;32:1323-1329.
Diehl J., Grimmer T., Drzezga A., et al. Cerebral metabolic patterns at early stages of frontotemporal dementia and semantic dementia. A PET study. Neurobiol Aging. 2004;25:1051-1056.
Dobkin B.H. Rehabilitation and functional neuroimaging dose-response trajectories for clinical trials. Neurorehabil Neural Repair. 2005;19:276-282.
Dougall N.J., Bruggink S., Ebmeier K.P. Systematic review of the diagnostic accuracy of 99mTc-HMPAO-SPECT in dementia. Am J Geriatr Psychiatry. 2004;12:554-570.
Douglas J.G., Stelzer K.J., Mankoff D.A., et al. [F-18]-fluorodeoxyglucose positron emission tomography for targeting radiation dose escalation for patients with glioblastoma multiforme: clinical outcomes and patterns of failure. Int J Radiat Oncol Biol Phys. 2006;64:886-891.
Draganski B., Gaser C., Busch V., et al. Neuroplasticity: changes in grey matter induced by training. Nature. 2004;427:311-312.
Drzezga A., Arnold S., Minoshima S., et al. 18F-FDG PET studies in patients with extratemporal and temporal epilepsy: evaluation of an observer-independent analysis. J Nucl Med. 1999;40:737-746.
Drzezga A., Grimmer T., Riemenschneider M., et al. Prediction of individual clinical outcome in MCI by means of genetic assessment and (18)F-FDG PET. J Nucl Med. 2005;46:1625-1632.
Dubois B., Feldman H.H., Jacova C., et al. Research criteria for the diagnosis of Alzheimer’s disease: revising the NINCDS-ADRDA criteria. Lancet Neurol. 2007;6:734-746.
Dupont P., Van Paesschen W., Palmini A., et al. Ictal perfusion patterns associated with single MRI-visible focal dysplastic lesions: implications for the noninvasive delineation of the epileptogenic zone. Epilepsia. 2006;47:1550-1557.
Eckert T., Barnes A., Dhawan V., et al. FDG PET in the differential diagnosis of parkinsonian disorders. Neuroimage. 2005;26:912-921.
Edison P., Rowe C.C., Rinne J.O., et al. Amyloid load in Parkinson’s disease dementia and Lewy body dementia measured with [11C]PIB positron emission tomography. J Neurol Neurosurg Psychiatry. 2008;79:1331-1338.
Eidelberg D., Dhawan V., Moeller J.R., et al. The metabolic landscape of cortico-basal ganglionic degeneration: regional asymmetries studied with positron emission tomography. J Neurol Neurosurg Psychiatry. 1991;54:856-862.
Eidelberg D., Moeller J.R., Dhawan V., et al. The metabolic topography of parkinsonism. J Cereb Blood Flow Metab. 1994;14:783-801.
Eidelberg D., Moeller J.R., Ishikawa T., et al. Early differential diagnosis of Parkinson’s disease with 18F-fluorodeoxyglucose and positron emission tomography. Neurology. 1995;45:1995-2004.
Eidelberg D., Takikawa S., Moeller J.R., et al. Striatal hypometabolism distinguishes striatonigral degeneration from Parkinson’s disease. Ann Neurol. 1993;33:518-527.
Eippert F., Bingel U., Schoell E.D., et al. Activation of the opioidergic descending pain control system underlies placebo analgesia. Neuron. 2009;63:533-543.
Eippert F., Finsterbusch J., Bingel U., et al. Direct evidence for spinal cord involvement in placebo analgesia. Science. 2009;326:404.
Fernández G., de Greiff A., von Oertzen J., et al. Language mapping in less than 15 minutes: real-time functional MRI during routine clinical investigation. Neuroimage. 2001;14:585-594.
Feydy A., Carlier R., Roby-Brami A., et al. Longitudinal study of motor recovery after stroke: recruitment and focusing of brain activation. Stroke. 2002;33:1610-1617.
Filippi M., Rocca M.A., Colombo B., et al. Functional magnetic resonance imaging correlates of fatigue in multiple sclerosis. Neuroimage. 2002;15:559-567.
Filippi M., Rocca M.A., Mezzapesa D.M., et al. Simple and complex movement-associated functional MRI changes in patients at presentation with clinically isolated syndromes suggestive of multiple sclerosis. Hum Brain Mapp. 2004;21:108-117.
Foltys H., Krings T., Meister I.G., et al. Motor representation in patients rapidly recovering after stroke: a functional magnetic resonance imaging and transcranial magnetic stimulation study. Clin Neurophysiol. 2003;114:2404-2415.
Foster N.L., Gilman S., Berent S., et al. Cerebral hypometabolism in progressive supranuclear palsy studied with positron emission tomography. Ann Neurol. 1988;24:399-406.
Foster N.L., Heidebrink J.L., Clark C.M., et al. FDG-PET improves accuracy in distinguishing frontotemporal dementia and Alzheimer’s disease. Brain. 2007;130:2616-2635.
Francavilla T.L., Miletich R.S., Di Chiro G., et al. Positron emission tomography in the detection of malignant degeneration of low-grade gliomas. Neurosurgery. 1989;24:1-5.
Frey S., Campbell J.S., Pike G.B., et al. Dissociating the human language pathways with high angular resolution diffusion fiber tractography. J Neurosci. 2008;28:11435-11444.
Fridriksson J., Morrow-Odom L., Moser D., et al. Neural recruitment associated with anomia treatment in aphasia. Neuroimage. 2006;32:1403-1412.
Fridriksson J., Moser D., Bonilha L., et al. Neural correlates of phonological and semantic-based anomia treatment in aphasia. Neuropsychologia. 2007;45:1812-1822.
Friston K.J., Price C.J., Fletcher P., et al. The trouble with cognitive subtraction. Neuroimage. 1996;4:97-104.
Fullam R.S., McKie S., Dolan M.C. Psychopathic traits and deception: functional magnetic resonance imaging study. Br J Psychiatry. 2009;194:229-235.
Garraux G., Salmon E., Degueldre C., et al. Comparison of impaired subcortico-frontal metabolic networks in normal aging, subcortico-frontal dementia, and cortical frontal dementia. Neuroimage. 1999;10:149-162.
Garraux G., Salmon E., Peigneux P., et al. Voxel-based distribution of metabolic impairment in corticobasal degeneration. Mov Disord. 2000;15:894-904.
Gauthier S., Reisberg B., Zaudig M., et al. International Psychogeriatric Association Expert Conference on mild cognitive impairment. Mild cognitive impairment. Lancet. 2006;367:1262-1270.
Ghaemi M., Hilker R., Rudolf J., et al. Differentiating multiple system atrophy from Parkinson’s disease: contribution of striatal and midbrain MRI volumetry and multi-tracer PET imaging. J Neurol Neurosurg Psychiatry. 2002;73:517-523.
Giorgio A., Portaccio E., Stromillo M.L., et al. Cortical functional reorganisation and its relationship with brain structural damage in patients with benign multiple sclerosis. Mult Scler. 2010 Jul 29. (Epub ahead of print)
Greene J.D., Nystrom L.E., Engell A.D., et al. The neural bases of cognitive conflict and control in moral judgment. Neuron. 2004;44:389-400.
Goffin K., Dedeurwaerdere S., Van Laere K., et al. Neuronuclear assessment of patients with epilepsy. Semin Nucl Med. 2008;38:227-239.
Goldman S., Levivier M., Pirotte B., et al. Regional methionine and glucose uptake in high-grade gliomas: a comparative study on PET-guided stereotactic biopsy. J Nucl Med. 1997;38:1459-1462.
Gómez-Río M., Rodríguez-Fernández A., Ramos-Font C., et al. Diagnostic accuracy of 201Thallium-SPECT and 18F-FDG-PET in the clinical assessment of glioma recurrence. Eur J Nucl Med Mol Imaging. 2008;35:966-975.
Gross M.W., Weber W.A., Feldmann H.J., et al. The value of F-18-fluorodeoxyglucose PET for the 3-D radiation treatment planning of malignant gliomas. Int J Radiat Oncol Biol Phys. 1998;41:989-995.
Hamzei F., Dettmers C., Rijntjes M., et al. The effect of cortico-spinal tract damage on primary sensorimotor cortex activation after rehabilitation therapy. Exp Brain Res. 2008;190:329-336.
Hamzei F., Knab R., Weiller C., et al. The influence of extra- and intracranial artery disease on the BOLD signal in FMRI. Neuroimage. 2003;20:1393-1399.
Hamzei F., Liepert J., Dettmers C., et al. Two different reorganization patterns after rehabilitative therapy: An exploratory study with fMRI and TMS. Neuroimage. 2006;31:710-720.
Hein G., Singer T. I feel how you feel but not always: the empathic brain and its modulation. Curr Opin Neurobiol. 2008;18:153-158.
Heiss W.D., Kessler J., Thiel A., et al. Differential capacity of left and right hemispheric areas for compensation of poststroke aphasia. Ann Neurol. 1999;45:430-438.
Herholz K. PET studies in dementia. Ann Nucl Med. 2003;17:79-89.
Herholz K., Coope D., Jackson A. Metabolic and molecular imaging in neuro-oncology. Lancet Neurol. 2007;6:711-724.
Herholz K., Salmon E., Perani D., et al. Discrimination between Alzheimer dementia and controls by automated analysis of multicenter FDG PET. Neuroimage. 2002;17:302-316.
Herholz K., Schopphoff H., Schmidt M., et al. Direct comparison of spatially normalized PET and SPECT scans in Alzheimer’s disease. J Nucl Med. 2002;43:21-26.
Hernandez-Garcia L., Jahanian H., Rowe D.B. Quantitative analysis of arterial spin labeling FMRI data using a general linear model. Magn Reson Imaging. 2010;28:919-927.
Higuchi M., Tashiro M., Arai H., et al. Glucose hypometabolism and neuropathological correlates in brains of dementia with Lewy bodies. Exp Neurol. 2000;162:247-256.
Hillis A.E., Kleinman J.T., Newhart M., et al. Restoring cerebral blood flow reveals neural regions critical for naming. J Neurosci. 2006;26:8069-8073.
Hillis A.E., Wityk R.J., Barker P.B., et al. Subcortical aphasia and neglect in acute stroke: the role of cortical hypoperfusion. Brain. 2002;125:1094-1104.
Hirano S., Eckert T., Flanagan T., et al. Metabolic networks for assessment of therapy and diagnosis in Parkinson’s disease. Mov Disord. 2009;24:S725-S731.
Hoffman J.M., Waskin H.A., Schifter T., et al. FDG-PET in differentiating lymphoma from nonmalignant central nervous system lesions in patients with AIDS. J Nucl Med. 1993;34:567-575.
Hoffman J.M., Welsh-Bohmer K.A., Hanson M., et al. FDG PET imaging in patients with pathologically verified dementia. J Nucl Med. 2000;41:1920-1928.
Hölzer T., Herholz K., Jeske J., et al. FDG-PET as a prognostic indicator in radiochemotherapy of glioblastoma. J Comput Assist Tomogr. 1993;17:681-687.
Hosaka K., Ishii K., Sakamoto S., et al. Voxel-based comparison of regional cerebral glucose metabolism between PSP and corticobasal degeneration. J Neurol Sci. 2002;199:67-71.
Hu M.T., Taylor-Robinson S.D., Chaudhuri K.R., et al. Cortical dysfunction in non-demented Parkinson’s disease patients: a combined (31)P-MRS and (18)FDG-PET study. Brain. 2000;123:340-352.
Imamura T., Ishii K., Hirono N., et al. Visual hallucinations and regional cerebral metabolism in dementia with Lewy bodies (DLB). Neuroreport. 1999;10:1903-1907.
Ishii K., Imamura T., Sasaki M., et al. Regional cerebral glucose metabolism in dementia with Lewy bodies and Alzheimer’s disease. Neurology. 1998;51:125-130.
Ishii K., Sakamoto S., Sasaki M., et al. Cerebral glucose metabolism in patients with frontotemporal dementia. J Nucl Med. 1998;39:1875-1878.
Ishii K., Soma T., Kono A.K., et al. Comparison of regional brain volume and glucose metabolism between patients with mild dementia with Lewy bodies and those with mild Alzheimer’s disease. J Nucl Med. 2007;48:704-711.
Jagust W., Reed B., Mungas D., et al. What does fluorodeoxyglucose PET imaging add to a clinical diagnosis of dementia? Neurology. 2007;69:871-877.
Jansen F.P., Vanderheyden J.L. The future of SPECT in a time of PET. Nucl Med Biol. 2007;34:733-735.
Janszky J., Jokeit H., Kontopoulou K., et al. Functional MRI predicts memory performance after right mesiotemporal epilepsy surgery. Epilepsia. 2005;46:244-250.
Jokeit H., Okujava M., Woermann F.G. Memory fMRI lateralizes temporal lobe epilepsy. Neurology. 2001;57:1786-1793.
Josephs K.A., Duffy J.R., Fossett T.R., et al. Fluorodeoxyglucose F18 positron emission tomography in progressive apraxia of speech and primary progressive aphasia variants. Arch Neurol. 2010;67:596-605.
Juh R., Pae C.U., Kim T.S., et al. Cerebral glucose metabolism in corticobasal degeneration comparison with progressive supranuclear palsy using statistical mapping analysis. Neurosci Lett. 2005;383:22-27.
Kapogiannis D., Barbey A.K., Su M., et al. Cognitive and neural foundations of religious belief. Proc Natl Acad Sci U S A. 2009;106:4876-4881.
Karbe H., Grond M., Huber M., et al. Subcortical damage and cortical dysfunction in progressive supranuclear palsy demonstrated by positron emission tomography. J Neurol. 1992;239:98-102.
Kaschten B., Stevenaert A., Sadzot B., et al. Preoperative evaluation of 54 gliomas by PET with fluorine-18-fluorodeoxyglucose and/or carbon-11-methionine. J Nucl Med. 1998;39:778-785.
Kelly M.E., Blau C.W., Griffin K.M., et al. Quantitative functional magnetic resonance imaging of brain activity using bolus-tracking arterial spin labeling. J Cereb Blood Flow Metab. 2010;30:913-922.
Kertesz A., McMonagle P., Blair M., et al. The evolution and pathology of frontotemporal dementia. Brain. 2005;128:1996-2005.
Kim C.K., Alavi J.B., Alavi A., et al. New grading system of cerebral gliomas using positron emission tomography with F-18 fluorodeoxyglucose. J Neurooncol. 1991;10:85-91.
Kim D.W., Lee S.K., Chu K., et al. Predictors of surgical outcome and pathologic considerations in focal cortical dysplasia. Neurology. 2009;72:211-216.
Kim J.T., Bai S.J., Choi K.O., et al. Comparison of various imaging modalities in localization of epileptogenic lesion using epilepsy surgery outcome in pediatric patients. Seizure. 2009;18:504-510.
Klöppel S., Büchel C. Alternatives to the Wada test: a critical view of functional magnetic resonance imaging in preoperative use. Curr Opin Neurol. 2005;18:418-423.
Knibb J.A., Xuereb J.H., Patterson K., et al. Clinical and pathological characterization of progressive aphasia. Ann Neurol. 2006;59:156-165.
Knowlton R.C., Elgavish R.A., Bartolucci A., et al. Functional imaging: II. Prediction of epilepsy surgery outcome. Ann Neurol. 2008;64:35-41.
Kreher, B.W., Hennig, J., Il’yasov, K.A., 2007. Reduction of false-positive valued areas by combining probability maps. Joint Annual Meeting ISMRM- ESMRMB. Berlin; 2007. page 1554.
Kreher B.W., Schnell S., Mader I., et al. Connecting and merging fibres: pathway extraction by combining probability maps. Neuroimage. 2008;43:81-89.
Krings T., Schreckenberger M., Rohde V., et al. Metabolic and electrophysiological validation of functional MRI. J Neurol Neurosurg Psychiatry. 2001;71:762-771.
Kuhl D.E., Edwards R.Q. Cylindrical and section radioisotope scanning of the liver and brain. Radiology. 1964;83:926-936.
Kuhl D.E., Metter E.J., Riege W.H. Patterns of local cerebral glucose utilization determined in Parkinson’s disease by the [18F]fluorodeoxyglucose method. Ann Neurol. 1984;15:419-424.
Langen K.J., Hamacher K., Weckesser M., et al. O-(2-[18F]fluoroethyl)-l-tyrosine: uptake mechanisms and clinical applications. Nucl Med Biol. 2006;33:287-294.
Langleben D.D., Loughead J.W., Bilker W.B., et al. Telling truth from lie in individual subjects with fast event-related fMRI. Hum Brain Mapp. 2005;26:262-272.
Langleben D.D., Segall G.M. PET in differentiation of recurrent brain tumor from radiation injury. J Nucl Med. 2000;41:1861-1867.
Lee M., Reddy H., Johansen-Berg H., et al. The motor cortex shows adaptive functional changes to brain injury from multiple sclerosis. Ann Neurol. 2000;47:606-613.
Lee S.K., Lee S.Y., Yun C.H., et al. Ictal SPECT in neocortical epilepsies: clinical usefulness and factors affecting the pattern of hyperperfusion. Neuroradiology. 2006;48:678-684.
Leff A., Crinion J., Scott S., et al. A physiological change in the homotopic cortex following left posterior temporal lobe infarction. Ann Neurol. 2002;51:553-558.
Leger A., Demonet J.F., Ruff S., et al. Neural substrates of spoken language rehabilitation in an aphasic patient: an fMRI study. Neuroimage. 2002;17:174-183.
Lehéricy S., Cohen L., Bazin B., et al. Functional MR evaluation of temporal and frontal language dominance compared with the Wada test. Neurology. 2000;54:1625-1633.
Lichy M.P., Plathow C., Schulz-Ertner D., et al. Follow-up gliomas after radiotherapy: 1H MR spectroscopic imaging for increasing diagnostic accuracy. Neuroradiology. 2005;47:826-834.
Liepert J. Pharmacotherapy in restorative neurology. Curr Opin Neurol. 2008;21:639-643.
Liepert L., Bauder H., Miltner W.H.R., et al. Treatment-induced cortical reorganisation after stroke in humans. Stroke. 2000;31:1210-1216.
Ling H., O’Sullivan S.S., Holton J.L., et al. Does corticobasal degeneration exist? A clinicopathological re-evaluation. Brain. 2010;133:2045-2057.
Lippa C.F., Duda J.E., Grossman M., et al. DLB and PDD boundary issues: diagnosis, treatment, molecular pathology, and biomarkers. Neurology. 2007;68:812-819.
Litvan I., Goetz C.G., Jankovic J., et al. What is the accuracy of the clinical diagnosis of multiple system atrophy? A clinicopathologic study. Arch Neurol. 1997;54:937-944.
Litvan I., MacIntyre A., Goetz C.G., et al. Accuracy of the clinical diagnoses of Lewy body disease, Parkinson disease, and dementia with Lewy bodies: a clinicopathologic study. Arch Neurol. 1998;55:969-978.
Lyoo C.H., Jeong Y., Ryu Y.H., et al. Effects of disease duration on the clinical features and brain glucose metabolism in patients with mixed type multiple system atrophy. Brain. 2008;131:438-446.
Makris N., Pandya D.N. The extreme capsule in humans and rethinking of the language circuitry. Brain Struct Funct. 2009;213:343-358.
Maquet P., Laureys S., Peigneux P., et al. Experience-dependent changes in cerebral activation during human REM sleep. Nat Neurosci. 2000;3:831-836.
McKeith I. Dementia with Lewy bodies and Parkinson’s disease with dementia: where two worlds collide. Pract Neurol. 2007;7:374-382.
McKeith I., O’Brien J., Walker Z., et al. Sensitivity and specificity of dopamine transporter imaging with 123I-FP-CIT SPECT in dementia with Lewy bodies: a phase III, multicentre study. Lancet Neurol. 2007;6:305-313.
Meinzer M., Flaisch T., Breitenstein C., et al. Functional rerecruitment of dysfunctional brain areas predicts language recovery in chronic aphasia. Neuroimage. 2008;39:2038-2046.
Meinzer M., Obleser J., Flaisch T., et al. Recovery from aphasia as a function of language therapy in an early bilingual patient demonstrated by fMRI. Neuropsychologia. 2007;45:1247-1256.
Meyer P.T., Sattler B., Winz O.H., et al. Kinetic analyses of [123I]IBZM SPECT for quantification of striatal dopamine D2 receptor binding: a critical evaluation of the single-scan approach. Neuroimage. 2008;42:548-558.
Meyer P.T., Schreckenberger M., Spetzger U., et al. Comparison of visual and ROI-based brain tumour grading using 18F-FDG PET: ROC analyses. Eur J Nucl Med. 2001;28:165-174.
Meyer P.T., Sturz L., Sabri O., et al. Preoperative motor system brain mapping using positron emission tomography and statistical parametric mapping: hints on cortical reorganisation. J Neurol Neurosurg Psychiatry. 2003;74:471-478.
Meyer P.T., Sturz L., Schreckenberger M., et al. Preoperative mapping of cortical language areas in adult brain tumour patients using PET and individual non-normalised SPM analyses. Eur J Nucl Med Mol Imaging. 2003;30:951-960.
Mezzapesa D.M., Rocca M.A., Rodegher M., et al. Functional cortical changes of the sensorimotor network are associated with clinical recovery in multiple sclerosis. Hum Brain Mapp. 2008;29:562-573.
Mielke R., Herholz K., Grond M., et al. Severity of vascular dementia is related to volume of metabolically impaired tissue. Arch Neurol. 1992;49:909-913.
Minoshima S., Foster N.L., Sima A.A., et al. Alzheimer’s disease versus dementia with Lewy bodies: cerebral metabolic distinction with autopsy confirmation. Ann Neurol. 2001;50:358-365.
Minoshima S., Frey K.A., Koeppe R.A., et al. A diagnostic approach in Alzheimer’s disease using three-dimensional stereotactic surface projections of fluorine-18-FDG PET. J Nucl Med. 1995;36:1238-1248.
Minoshima S., Giordani B., Berent S., et al. Metabolic reduction in the posterior cingulate cortex in very early Alzheimer’s disease. Ann Neurol. 1997;42:85-94.
Monakow C.V. Aphasie und Diaschisis. Neurologisches Centralblatt. 1906;25:1026-1038.
Morgen K., Kadom N., Sawaki L., et al. Training-dependent plasticity in patients with multiple sclerosis. Brain. 2004;127:2506-2517.
Mosconi L., Brys M., Switalski R., et al. Maternal family history of Alzheimer’s disease predisposes to reduced brain glucose metabolism. Proc Natl Acad Sci U S A. 2007;104:19067-19072.
Mosconi L., Mistur R., Switalski R., et al. Declining brain glucose metabolism in normal individuals with a maternal history of Alzheimer disease. Neurology. 2009;72:513-520.
Mosconi L., Tsui W.H., De Santi S., et al. Reduced hippocampal metabolism in MCI and AD: automated FDG-PET image analysis. Neurology. 2005;64:1860-1867.
Mosconi L., Tsui W.H., Herholz K., et al. Multicenter standardized 18F-FDG PET diagnosis of mild cognitive impairment, Alzheimer’s disease, and other dementias. J Nucl Med. 2008;49:390-398.
Murphy P.S., Viviers L., Abson C., et al. Monitoring temozolomide treatment of low-grade glioma with proton magnetic resonance spectroscopy. Br J Cancer. 2004;90:781-786.
Musso M., Moro A., Glauche V., et al. Broca’s area and the language instinct. Nat Neurosci. 2003;6:774-781.
Musso M., Weiller C., Kiebel S., et al. Training-induced brain plasticity in aphasia. Brain. 1999;122:1781-1790.
Naeser M.A., Martin P.I., Nicholas M., et al. Improved picture naming in chronic aphasia after TMS to part of right Broca’s area: an open-protocol study. Brain Lang. 2005;93:95-105.
Nagahama Y., Fukuyama H., Turjanski N., et al. Cerebral glucose metabolism in corticobasal degeneration: comparison with progressive supranuclear palsy and normal controls. Mov Disord. 1997;12:691-696.
Neary D., Snowden J.S., Gustafson L., et al. Frontotemporal lobar degeneration: a consensus on clinical diagnostic criteria. Neurology. 1998;51:1546-1554.
Nelson S.J., Graves E., Pirzkall A., et al. In vivo molecular imaging for planning radiation therapy of gliomas: an application of 1H MRSI. J Magn Reson Imaging. 2002;16:464-476.
Nestor P.J., Graham N.L., Fryer T.D., et al. Progressive non-fluent aphasia is associated with hypometabolism centered on the left anterior insula. Brain. 2003;126:2406-2418.
Newberg A.B., Alavi A., Berlin J., et al. Ipsilateral and contralateral thalamic hypometabolism as a predictor of outcome after temporal lobectomy for seizures. J Nucl Med. 2000;41:1964-1968.
Newton M.R., Berkovic S.F., Austin M.C., et al. SPECT in the localisation of extratemporal and temporal seizure foci. J Neurol Neurosurg Psychiatry. 1995;59:26-30.
O’Brien T.J., So E.L., Mullan B.P., et al. Subtraction ictal SPECT co-registered to MRI improves clinical usefulness of SPECT in localizing the surgical seizure focus. Neurology. 1998;50:445-454.
Osaki Y., Ben-Shlomo Y., Lees A.J., et al. Accuracy of clinical diagnosis of progressive supranuclear palsy. Mov Disord. 2004;19:181-189.
Osaki Y., Wenning G.K., Daniel S.E., et al. Do published criteria improve clinical diagnostic accuracy in multiple system atrophy? Neurology. 2002;59:1486-1491.
Otsuka M., Ichiya Y., Kuwabara Y., et al. Glucose metabolism in the cortical and subcortical brain structures in multiple system atrophy and Parkinson’s disease: a positron emission tomographic study. J Neurol Sci. 1996;144:77-83.
Otsuka M., Kuwabara Y., Ichiya Y., et al. Differentiating between multiple system atrophy and Parkinson’s disease by positron emission tomography with 18F-dopa and 18F-FDG. Ann Nucl Med. 1997;11:251-257.
Owen A.M., Coleman M.R., Boly M., et al. Detecting awareness in the vegetative state. Science. 2006;313:1402.
Padma M.V., Said S., Jacobs M., et al. Prediction of pathology and survival by FDG PET in gliomas. J Neurooncol. 2003;64:227-237.
Panegyres P.K., McCarthy M., Campbell A., et al. Correlative studies of structural and functional imaging in primary progressive aphasia. Am J Alzheimers Dis Other Demen. 2008;23:184-191.
Pantano P., Iannetti G.D., Caramia F., et al. Cortical motor reorganization after a single clinical attack of multiple sclerosis. Brain. 2002;125:1607-1615.
Pantano P., Mainero C., Caramia F. Functional brain reorganization in multiple sclerosis: evidence from fMRI studies. J Neuroimaging. 2006;16:104-114.
Patronas N.J., Di Chiro G., Brooks R.A., et al. Work in progress: [18F] fluorodeoxyglucose and positron emission tomography in the evaluation of radiation necrosis of the brain. Radiology. 1982;144:885-889.
Patronas N.J., Di Chiro G., Kufta C., et al. Prediction of survival in glioma patients by means of positron emission tomography. J Neurosurg. 1985;62:816-822.
Pauleit D., Stoffels G., Bachofner A., et al. Comparison of (18)F-FET and (18)F-FDG PET in brain tumors. Nucl Med Biol. 2009;36:779-787.
Peppard R.F., Martin W.R., Carr G.D., et al. Cerebral glucose metabolism in Parkinson’s disease with and without dementia. Arch Neurol. 1992;49:1262-1268.
Perani D., Bressi S., Testa D., et al. Clinical/metabolic correlations in multiple system atrophy. A fludeoxyglucose F 18 positron emission tomographic study. Arch Neurol. 1995;52:179-185.
Petersen R.C., Smith G.E., Waring S.C., et al. Mild cognitive impairment: clinical characterization and outcome. Arch Neurol. 1999;56:303-308.
Phelps M.E., Hoffman E.J., Mullani N.A., et al. Application of annihilation coincidence detection to transaxial reconstruction tomography. J Nucl Med. 1975;16:210-224.
Piccini P., Whone A. Functional brain imaging in the differential diagnosis of Parkinson’s disease. Lancet Neurol. 2004;3:284-290.
Piert M., Koeppe R.A., Giordani B., et al. Determination of regional rate constants from dynamic FDG-PET studies in Parkinson’s disease. J Nucl Med. 1996;37:1115-1122.
Pirotte B., Goldman S., Brucher J.M., et al. PET in stereotactic conditions increases the diagnostic yield of brain biopsy. Stereotact Funct Neurosurg. 1994;63:144-149.
Pirotte B., Goldman S., Dewitte O., et al. Integrated positron emission tomography and magnetic resonance imaging-guided resection of brain tumors: a report of 103 consecutive procedures. J Neurosurg. 2006;104:238-253.
Pirotte B., Goldman S., Massager N., et al. Combined use of 18F-fluorodeoxyglucose and 11C-methionine in 45 positron emission tomography-guided stereotactic brain biopsies. J Neurosurg. 2004;101:476-483.
Pirotte B.J., Levivier M., Goldman S., et al. Positron emission tomography-guided volumetric resection of supratentorial high-grade gliomas: a survival analysis in 66 consecutive patients. Neurosurgery. 2009;64:471-481.
Podoloff D.A., Ball D.W., Ben-Josef E., et al. NCCN task force: clinical utility of PET in a variety of tumor types. J Natl Compr Canc Netw. 2009;7:S1-26.
Rabinovici G.D., Jagust W.J., Furst A.J., et al. A-beta amyloid and glucose metabolism in three variants of primary progressive aphasia. Ann Neurol. 2008;64:388-401.
Raboyeau G., De Boissezon X., Marie N., et al. Right hemisphere activation in recovery from aphasia: lesion effect or function recruitment? Neurology. 2008;70:290-298.
Reddy H., De Stefano N., Mortilla M., et al. Functional reorganization of motor cortex increases with greater axonal injury from CADASIL. Stroke. 2002;33:502-508.
Reddy H., Narayanan S., Arnoutelis R., et al. Evidence for adaptive functional changes in the cerebral cortex with axonal injury from multiple sclerosis. Brain. 2000;123:2314-2320.
Reiman E.M., Caselli R.J., Chen K., et al. Declining brain activity in cognitively normal apolipoprotein E epsilon 4 heterozygotes: A foundation for using positron emission tomography to efficiently test treatments to prevent Alzheimer’s disease. Proc Natl Acad Sci U S A. 2001;98:3334-3339.
Reiman E.M., Caselli R.J., Yun L.S., et al. Preclinical evidence of Alzheimer’s disease in persons homozygous for the epsilon 4 allele for apolipoprotein E. N Engl J Med. 1996;334:752-758.
Reiman E.M., Chen K., Alexander G.E., et al. Functional brain abnormalities in young adults at genetic risk for late-onset Alzheimer’s dementia. Proc Natl Acad Sci U S A. 2004;101:284-289.
Reinges M.H., Krings T., Meyer P.T., et al. Preoperative mapping of cortical motor function: prospective comparison of functional magnetic resonance imaging and [15O]-H2O-positron emission tomography in the same co-ordinate system. Nucl Med Commun. 2004;25:987-997.
Richter M., Miltner W.H., Straube T. Association between therapy outcome and right hemispheric activation in chronic aphasia. Brain. 2008;131:1391-1401.
Rijntjes M. Mechanisms of recovery in stroke patients with hemiparesis or aphasia: new insights, old questions and the meaning of therapies. Curr Opin Neurol. 2006;19:76-83.
Rijntjes M., Weiller C. Recovery of motor and language abilities after stroke: the contribution of functional imaging. Prog Neurobiol. 2002;66:109-122.
Rinne J.O., Laine M., Kaasinen V., et al. Striatal dopamine transporter and extrapyramidal symptoms in frontotemporal dementia. Neurology. 2002;58:1489-1493.
Rocca M.A., Matthews P.M., Caputo D. Evidence for widespread movement-associated functional MRI changes in patients with PPMS. Neurology. 2002;58:866-872.
Rocca M.A., Gavazzi C., Mezzapesa D.M., et al. A functional magnetic resonance imaging study of patients with secondary progressive multiple sclerosis. Neuroimage. 2003;19:1770-1777.
Rocca M.A., Filippi M. Functional MRI in multiple sclerosis. J Neuroimaging. 2007;17(Suppl 1):36S-41S.
Rosen H.J., Petersen S.E., Linenweber M.R., et al. Neural correlates of recovery from aphasia after damage to left inferior frontal cortex. Neurology. 2000;55:1883-1894.
Sabsevitz D.S., Swanson S.J., Hammeke T.A., et al. Use of preoperative functional neuroimaging to predict language deficits from epilepsy surgery. Neurology. 2003;60:1788-1792.
Saini S., DeStefano N., Smith S., et al. Altered cerebellar functional connectivity mediates potential adaptive plasticity in patients with multiple sclerosis. J Neurol Neurosurg Psychiatry. 2004;75:840-846.
Salmon E., Garraux G., Delbeuck X., et al. Predominant ventromedial frontopolar metabolic impairment in frontotemporal dementia. Neuroimage. 2003;20:435-440.
Salmon E., Lespagnard S., Marique P., et al. Cerebral metabolic correlates of four dementia scales in Alzheimer’s disease. J Neurol. 2005;252:283-290.
Saur D., Buchert R., Knab R., et al. Iomazenil single-photon emission computed tomography reveals selective neuronal loss in magnetic resonance-defined mismatch areas. Stroke. 2006;37:2713-2719.
Saur D., Kreher B.W., Schnell S., et al. Ventral and dorsal pathways for language. Proc Natl Acad Sci U S A. 2008;105:18035-18040.
Saur, D., Kummerer, D., Kellmeyer, P., et al., 2009. Dynamics of language reorganization in left temporal stroke. 15th Annual Meeting of the Organization for Human Brain Mapping. San Francisco, USA.
Saur D., Lange R., Baumgaetner A., et al. Dynamics of language reorganization after stroke. Brain. 2006;129:1371-1384.
Saur D., Schelter B., Schnell S., et al. Combining functional and anatomical connectivity reveals brain networks for auditory language comprehension. Neuroimage. 2010;49:3187-3197.
Schifter T., Hoffman J.M., Hanson M.W., et al. Serial FDG-PET studies in the prediction of survival in patients with primary brain tumors. J Comput Assist Tomogr. 1993;17:509-561.
Schreckenberger M., Spetzger U., Sabri O., et al. Localisation of motor areas in brain tumour patients: a comparison of preoperative [18F]FDG-PET and intraoperative cortical electrostimulation. Eur J Nucl Med. 2001;28:1394-1403.
Sharp D.J., Scott S.K., Wise R.J. Retrieving meaning after temporal lobe infarction: the role of the basal language area. Ann Neurol. 2004;56:836-846.
Shin W.C., Hong S.B., Tae W.S., et al. Ictal hyperperfusion patterns according to the progression of temporal lobe seizures. Neurology. 2002;58:373-380.
Silverman D.H., Small G.W., Chang C.Y., et al. Positron emission tomography in evaluation of dementia: Regional brain metabolism and long-term outcome. JAMA. 2001;286:2120-2127.
Small G.W., Ercoli L.M., Silverman D.H., et al. Cerebral metabolic and cognitive decline in persons at genetic risk for Alzheimer’s disease. Proc Natl Acad Sci U S A. 2000;97:6037-6042.
Small G.W., Mazziotta J.C., Collins M.T., et al. Apolipoprotein E type 4 allele and cerebral glucose metabolism in relatives at risk for familial Alzheimer disease. JAMA. 1995;273:942-947.
Sokoloff L. Relation between physiological function and energy metabolism in the central nervous system. J Neurochem. 1977;29:13-26.
Solberg T.D., Agazaryan N., Goss B.W., et al. A feasibility study of 18F-fluorodeoxyglucose positron emission tomography targeting and simultaneous integrated boost for intensity-modulated radiosurgery and radiotherapy. J Neurosurg. 2004;101:381-389.
Sommer M., Koch M.A., Paulus W., et al. Disconnection of speech-relevant brain areas in persistent developmental stuttering. Lancet. 2002;360:380-383.
Spanaki M.V., Spencer S.S., Corsi M., et al. Sensitivity and specificity of quantitative difference SPECT analysis in seizure localization. J Nucl Med. 1999;40:730-736.
Spetsieris P.G., Ma Y., Dhawan V., et al. Differential diagnosis of parkinsonian syndromes using PCA-based functional imaging features. Neuroimage. 2009;45:1241-1252.
Tang C.C., Poston K.L., Dhawan V., et al. Abnormalities in metabolic network activity precede the onset of motor symptoms in Parkinson’s disease. J Neurosci. 2010;30:1049-1056.
Tang C.C., Poston K.L., Eckert T., et al. Differential diagnosis of parkinsonism: a metabolic imaging study using pattern analysis. Lancet Neurol. 2010;9:149-158.
Taniwaki T., Nakagawa M., Yamada T., et al. Cerebral metabolic changes in early multiple system atrophy: a PET study. J Neurol Sci. 2002;200:79-84.
Tartaglia M.C., Narayanan S., Francis S.J., et al. The relationship between diffuse axonal damage and fatigue in multiple sclerosis. Arch Neurol. 2004;61:201-207.
Taub E., Uswatte G., Elbert T. New treatments in neurorehabilitation founded on basic research. Nat Rev Neurosci. 2002;3:228-236.
Tralins K.S., Douglas J.G., Stelzer K.J., et al. Volumetric analysis of 18F-FDG PET in glioblastoma multiforme: prognostic information and possible role in definition of target volumes in radiation dose escalation. J Nucl Med. 2002;43:1667-1673.
Vander Borght T., Minoshima S., Giordani B., et al. Cerebral metabolic differences in Parkinson’s and Alzheimer’s diseases matched for dementia severity. J Nucl Med. 1997;38:797-802.
Vigneau M., Beaucousin V., Herve P.Y., et al. Meta-analyzing left hemisphere language areas: phonology, semantics, and sentence processing. Neuroimage. 2006;30:1414-1432.
Vitali P., Abutalebi J., Tettamanti M., et al. Training-induced brain remapping in chronic aphasia: a pilot study. Neurorehabil Neural Repair. 2007;21:152-160.
Wadia P.M., Lang A.E. The many faces of corticobasal degeneration. Parkinsonism Relat Disord. 2007;13:S336-S340.
Wang S.X., Boethius J., Ericson K. FDG-PET on irradiated brain tumor: ten years’ summary. Acta Radiol. 2006;47:85-90.
Warburton E., Price C.J., Swinburn K., et al. Mechanisms of recovery from aphasia: evidence from positron emission tomography studies. J Neurol Neurosurg Psychiatry. 1999;66:155-161.
Ward N.S., Brown M.M., Thompson A.J., et al. Neural correlates of motor recovery after stroke: a longitudinal fMRI study. Brain. 2003;126:2476-2496.
Weil S., Noachtar S., Arnold S., et al. Ictal ECD-SPECT differentiates between temporal and extratemporal epilepsy: confirmation by excellent postoperative seizure control. Nucl Med Commun. 2001;22:233-237.
Weiller C., Isensee C., Rijntjes M., et al. Recovery from Wernicke’s aphasia: a positron emission tomographic study. Ann Neurol. 1995;37:723-732.
Weiller C., Ramsay S.C., Wise R.J., et al. Individual patterns of functional reorganization in the human cerebral cortex after capsular infarction. Ann Neurol. 1993;33:181-189.
Weiller C., Rijntjes M. Learning, plasticity, and recovery in the central nervous system. Exp Brain Res. 1999;128:134-138.
Weiller C., Ringelstein E.B., Reiche W., et al. The large striatocapsular infarct. Arch Neurol. 1990;47:1085-1091.
Weiller C., Willmes K., Reiche W., et al. The case of aphasia of neglect after striatocapsular infarction. Brain. 1993;116:1509-1525.
Wenzelburger R., Kopper F., Frenzel A., et al. Hand coordination following capsular stroke. Brain. 2005;128:64-74.
Willmann O., Wennberg R., May T., et al. The contribution of 18F-FDG PET in preoperative epilepsy surgery evaluation for patients with temporal lobe epilepsy A meta-analysis. Seizure. 2007;16:509-520.
Winhuisen L., Thiel A., Schumacher B., et al. Role of the contralateral inferior frontal gyrus in recovery of language function in poststroke aphasia: a combined repetitive transcranial magnetic stimulation and positron emission tomography study. Stroke. 2005;36:1759-1763.
Won H.J., Chang K.H., Cheon J.E., et al. Comparison of MR imaging with PET and ictal SPECT in 118 patients with intractable epilepsy. AJNR Am J Neuroradiol. 1999;20:593-599.
Wong T.Z., Turkington T.G., Hawk T.C., et al. PET and brain tumor image fusion. Cancer J. 2004;10:234-242.
Yong S.W., Yoon J.K., An Y.S., et al. A comparison of cerebral glucose metabolism in Parkinson’s disease, Parkinson’s disease dementia and dementia with Lewy bodies. Eur J Neurol. 2007;14:1357-1362.
Young L., Cushman F., Hauser M., et al. The neural basis of the interaction between theory of mind and moral judgment. Proc Natl Acad Sci U S A. 2007;104:8235-8240.
Yuan Y., Gu Z.X., Wei W.S. Fluorodeoxyglucose-positron-emission tomography, single-photon emission tomography, and structural MR imaging for prediction of rapid conversion to Alzheimer disease in patients with mild cognitive impairment: a meta-analysis. AJNR Am J Neuroradiol. 2009;30:404-410.
Yun C.H., Lee S.K., Lee S.Y., et al. Prognostic factors in neocortical epilepsy surgery: multivariate analysis. Epilepsia. 2006;47:574-579.
Zahn R., Schwarz M., Huber W. Functional activation studies of word processing in the recovery from aphasia. J Physiol Paris. 2006;99:370-385.
Zaknun J.J., Bal C., Maes A., et al. Comparative analysis of MR imaging, ictal SPECT and EEG in temporal lobe epilepsy: a prospective IAEA multi-center study. Eur J Nucl Med Mol Imaging. 2008;35:107-115.