Chapter 39 Neuroepidemiology
Population-Based Rates
The incidence or attack rate is the number of new cases over a defined study period divided by the population at risk. This usually is given as an annual incidence rate in cases per 100,000 population per year. The date of onset of clinical symptoms typically dictates the time of accession, although occasionally the date of first diagnosis is used. The (point) prevalence rate is more properly called a ratio, but it refers to the number of those affected, both old and new cases, at one point in time within the community per unit of population. The lifetime prevalence rate refers to the proportion of persons manifesting a disorder of interest during the period of their life up to the survey date. It typically is reported per 1000 of the population at risk. If no change in case-fatality ratios occurs over time and no change in annual incidence rates (and no migration) occurs, then the average annual incidence rate times the average duration of illness in years equals the point prevalence rate. When numerator and denominator for a rate each refer to an entire community, their quotient is a crude rate, for all ages. When both terms of the ratio are delimited by age or sex, these are age-specific or sex-specific rates, respectively. Such rates for consecutive age groups, from birth to the oldest group of each sex, provide the best description of a disease within a community. In comparing morbidity or mortality rates between two communities for an age-related disorder (such as stroke or epilepsy), differences in crude rates may be observed solely because of differences in the age distributions of the denominator populations. This can be avoided by comparing only the individual age-specific rates between the two, but this approach rapidly becomes unwieldy. Methods exist for adjusting the crude rates for all ages to permit such comparisons. One such method involves taking community age-specific rates and multiplying them by the proportion of a “standard” population within the same age group. The sum of all such products provides an age-adjusted (to a standard) rate, or a rate for all ages adjusted to a standard population. One common standard in the United States is its population for a given census year. The mortality or death rate is the number of deaths in a population in a period with a particular disease as the underlying cause, such as an annual death rate per 100,000 population. Deaths by cause are provided by official government agencies, based on standard death certificates. At times, deaths listed as other than underlying cause on the certificate are added to give a count of total deaths for the disease. The standardized mortality ratio (SMR) is the observed number of deaths in the study group of interest divided by the expected number of deaths based on the standard population rates applied to the study group. The great advantage of death rates is their current availability over time and geographical area for many disorders, whereas morbidity rates require specific community surveys. Geographical distributions from death data are especially informative because most population studies available are, of necessity, spot surveys that may tell little about areas that were not investigated. Most often, too, the numbers are larger by orders of magnitude than those that prevalence studies can provide. The principal disadvantage, and it is a major one, is the question of diagnostic accuracy. In clinical practice, the diagnostic code used for mortality rates is a three- or four-digit number representing a specific diagnosis in the International Statistical Classification of Diseases, Injuries and Causes of Death (ICD), which is revised periodically. The changes in the 10th revision (ICD-10) were major. ICD-10 was published in 1992 and adopted for use in the United States in 1999. It introduced the innovation of an alphanumerical coding scheme of one letter followed by three numbers (e.g., I63.1, cerebral infarction due to thrombosis of precerebral arteries). One drawback of the ICD system of classification is that different diseases frequently are subserved under the same primary code. To provide a more refined classification for individual diseases, several disciplines have published specialty-related expansions of the primary ICD structure. ICD-10-NA is the expansion of the codes relating to neurological diseases, so that virtually every known neurological disease or condition has a unique alphanumerical identifier (van Drimmelen-Krabbe et al., 1998; World Health Organization, 1997). In the United States, the Department of Health and Human Services has mandated conversion to ICD-10 for all healthcare organizations by 2013. Lack of space here precludes attention to community survey methods, risk factors and analytic epidemiology, treatment comparisons, and statistical methods—all intrinsic aspects of epidemiology. This chapter highlights the descriptive epidemiological analysis for a few major neurological diseases selected as representative of those most likely to be encountered in clinical neurology.
Cerebrovascular Disease
Stroke (see Chapter 51) is the third leading cause of death and a major cause of disability in the United States (Miniño et al., 2009). Most recent epidemiological studies have subdivided stroke into subarachnoid hemorrhage (SAH), intracerebral hemorrhage, and cerebral infarction. Subdural hemorrhage is not included in this category. Cerebral infarction is the most common type of stroke in developed countries, making up more than 70% of cases. Intracerebral hemorrhages account for approximately 10% to 15% of strokes, and SAHs make up less than 5%, while the remainder are of undetermined etiology.
Mortality Rates
Since the late 1960s, U.S. stroke death rates have declined by 60% overall (Howard et al., 2001). The largest declines in stroke mortality were seen in white men and the smallest in black men. Similar decreasing rates in stroke mortality are reported for other countries including Japan, Australia, New Zealand, Canada, and all of Western Europe. Recent annual age-standardized mortality rates in Europe ranged between 26 and 50 per 100,000 for men and between 18 and 23 per 100,000 for women. Reported mortality rates over recent decades have actually increased for Eastern Europe (Sarti et al., 2003).
The geographic differences in stroke mortality within the United States are notable, with the highest rates in the southeastern region since the 1940s. The so-called stroke belt states of Georgia, North Carolina, and South Carolina have consistently demonstrated mortality rates above the U.S. average. The Reasons for Geographic and Racial Difference in Stroke (REGARDS) Study was launched in 2001 to better understand demographic differences in stroke. Recent data from this project have shown that geographic differences in risk factors contribute little to explaining geographic variations in stroke mortality (Howard et al., 2009).
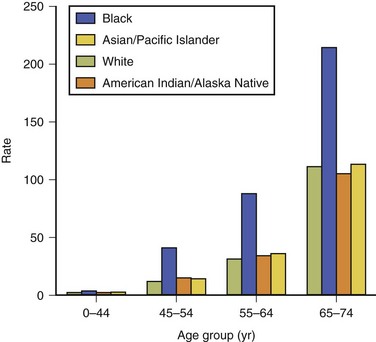
In general, age-specific death rates for stroke exhibit a logarithmic increase with increasing age. Racial and ethnic disparities in mortality from stroke have been recorded in many studies in the United States. The Centers for Disease Control and Prevention (CDC) examined this issue by evaluating 2002 U.S. mortality and death certificate data. During 2002, 12% of all stroke deaths occurred among persons younger than 65 years of age (Centers for Disease Control and Prevention [CDC], 2005). Age-specific death rates were notably higher in blacks than in whites by factors of 2.5, 3.5, 2.8, and 1.9 for the successive age groups 0 to 44, 45 to 54, 55 to 64, and 65 to 74 years. For all other groups (Asian/Pacific Islanders, American Indians/Native Americans, Hispanics), little consistent difference from the whites was observed in any age group (Fig. 39.1). United States racial and ethnic disparities in mortality by stroke type have been reported for the period 1995 to 1998 (Ayala et al., 2001). National Vital Statistics death certificate data were used to calculate age-standardized rates for ischemic stroke, intracerebral hemorrhage, and SAH among Hispanics, blacks, American Indians/Alaska Natives, Asians/Pacific Islanders, and whites. For ischemic stroke, the ratio of the age-standardized death rate among blacks (96 per 100,000) compared with whites was 1.30; all other groups had lower rates than the whites. Death rates for intracerebral hemorrhage were highest for blacks (23 per 100,000) and Asian/Pacific Islanders (20 per 100,000), with corresponding risk ratios compared with whites of 1.70 and 1.52. Subarachnoid hemorrhage death rates were higher in whites than for all minority groups.
Morbidity Rates
Like mortality rates, stroke incidence has declined rapidly over the past 50 years. Within the past 2 decades, however, the incidence rates have seemed to plateau or decrease only slightly in industrialized countries (Kleindorfer et al., 2010). Stroke incidence increases logarithmically with increasing age but with a lesser increase beyond age 74. Average annual age-adjusted incidence rates by sex show a modest, but possibly increasing, male excess. In recent years, the annual stroke incidence rate in Europe and North America has been between 100 and 300 per 100,000 population, and mostly near 150.
The most recent trends in stroke incidence were reported from population-based stroke registries in six European countries (Heuschmann et al., 2009). Total stroke incidence for any first stroke between 2004 and 2006 and adjusted to the European population was 141 per 100,000 for men and 95 per 100,000 for women. Stroke incidence ranged in men from 101 per 100,000 in Sesto Fiorentino to 239 per 100,000 in Kaunas; and in women, from 63 per 100,000 in Sesto Fiorentino to 159 per 100,000 in Kaunas. The median age for first stroke was 73 years, with 51% occurring in females. On average, the highest rates were observed in Eastern Europe and the lowest in Southern Europe. Incidence rates in the United States for blacks remain higher than those for whites. The Greater Cincinnati and Northern Kentucky Stroke Study was the first large metropolitan-based study of stroke trends among blacks (Kleindorfer et al., 2010). The incidence for stroke between 1993 and 2005 decreased significantly for whites but was stable for blacks. These changes were driven by a drop in ischemic stroke among whites but stable ischemic stroke rates among blacks. Case fatality ratios did not differ by race. In the United States, age-, race-, and sex-adjusted stroke prevalence rates increased from 1.41% in the period 1971 to 1975 to 1.87% in the period 1988 to 1994 (Muntner et al., 2002). This corresponded with an increase of 930,000 noninstitutionalized stroke survivors, with increases observed in all age, race, and gender groups. With decreasing mortality trends and relatively stable stroke incidence rates during the 1980s, these data point to a decreasing stroke case-fatality ratio as a major reason for the increasing prevalence.
Transient Ischemic Attacks
Although clearly a subset of cerebrovascular disease, transient ischemic attacks (TIAs) generally have been excluded from most morbidity and mortality surveys of stroke. As with stroke incidence and prevalence rates, a marked increase in TIA rates occurs with age. The Oxford Vascular Project found a slight increase in the incidence of TIAs between 1981 and 1984 and between 2002 and 2004, with overall rates rising from 0.33 per 1000 to 0.51 per 1000 (Rothwell et al., 2004). TIAs in persons older than 65 years of age accounted for the major part of this rate increase between time periods. This trend was also confirmed in a community-based study of older adults in Korea, where an age- and education-adjusted prevalence of TIA of 8.9% (age 65+) was found (Han et al., 2009).
The new tissue-based definition for TIA takes into account recent neuroimaging findings, as well as providing a much shorter duration for the diagnosis (Albers et al., 2002). If the new definition were to be used in epidemiological studies, the estimated annual incidence of TIA would be lowered by 33% and the incidence of ischemic stroke increased by 7% (Ovbiagele et al., 2003). However, a major underascertainment of TIA is probable in all surveys, with undefined differences among them. This also may give spuriously high frequencies for completed stroke after TIA because in many studies of stroke, only a retrospective history of TIA occurrence is given.
Primary Neoplasms
Three large centralized U.S. databases have been created that provide descriptive epidemiological data on primary brain tumors (see Chapter 52A). These databases include the Central Brain Tumor Registry of the United States (CBTRUS); the Surveillance, Epidemiology and End Results (SEER) database; and the National Cancer Database (NCDB). According to the CBTRUS database, a total of 158,088 persons were diagnosed with a primary brain or central nervous system (CNS) tumor in the United States in the years 2004-2006 (CBTRUS, 2010). The lifetime risk of developing a CNS tumor is estimated to be 0.65% for men and 0.50% for women (Ries et al., 2005). Little is known of the causes of most primary brain tumors, but their epidemiological features may provide clues for more definitive studies.
Mortality Rates and Survival
In the United States for 1995-1999, malignant CNS tumor deaths by age showed a steep rise from very low rates in early adult life to a peak of approximately 20 per 100,000 per year by age 75, followed by a steep decline with further increasing age (Davis et al., 2001). These rates presumably are chiefly for glioblastoma multiforme. A notable excess of whites over nonwhites was seen in this group, with rates two to three times higher in the white patients. An excess of male deaths occurred in all racial groups.
Reported 5-year survival ratios have been approximately 60% for clinically diagnosed meningioma and 20% for gliomas as a group. When these two tumor types are taken together, median survival for benign brain tumors may be estimated at 6 years. The relative 5-year survival rate for children younger than 15 years of age with brain and other nervous system tumors is now 61%, compared with 35% some 20 years ago (Parker et al., 1997). Population-based data between 1990 and 2001 from the United Kingdom showed that 5-year survival rates for all CNS tumors for those 15 to 29 years of age were slightly worse than for those 0 to 14 years of age (62% versus 67%) (Feltbower et al., 2004). Glioblastoma is the most common primary brain tumor in adults, with a uniformly poor prognosis. Median survival for glioblastoma remains approximately 1 year after diagnosis. Several studies from cancer registries have indicated that the 5-year survival rate, typically reported at 4% to 10% over the past 3 decades, may be too optimistic (Tran and Rosenthal, 2010). Series from Canada, Sweden, and the United States that reviewed clinical and histological data from registries found that in half of all reported cases of glioblastoma, the tumor had been misclassified and on close inspection was found to be a less aggressive tumor (McLendon and Halperin, 2003). Corrected 5-year survival rates are more likely to be in the 2% to 3% range. Some positive news for a subgroup of glioblastoma patients with the MGMT (O6-methylguanine-DNA methyltransferase) DNA repair gene was recently reported (Hegi et al., 2005). Irrespective of treatment, patients with glioblastoma with a methylated MGMT promoter survived approximately 55% longer than patients with an unmethylated MGMT promoter. The gain, although real, was therefore only some 6 months. The methylation of the MGMT promoter gene compromises DNA repair and triggers cytotoxicity. In addition, patients with glioblastoma and the MGMT promoter also demonstrated an improved treatment response to alkylating chemotherapy agents. The epidemiology of metastatic brain tumors is that of the primary cancer. Survival for patients with metastatic brain tumors is poor. Even after whole-brain irradiation, median survival is approximately 6 months (Andrews et al., 2004). Adjuvant therapy with sterotactic radiosurgery boost may extend survival for patients with a small number of metastases. Survival for 740 patients with brain metastases was reviewed by Hall and colleagues (2000). For all tumor types, the actuarial survival rate was 8.1% at 2 years, 4.8% at 3 years, and 2.4% at 5 years. At 2 years from diagnosis, ovarian carcinoma had the highest survival rate (23.9%) and small cell lung cancer (SCLC) the lowest (1.7%). Favorable prognostic variables for survival included a single metastatic lesion, surgical resection, and whole-brain irradiation.
Morbidity Rates
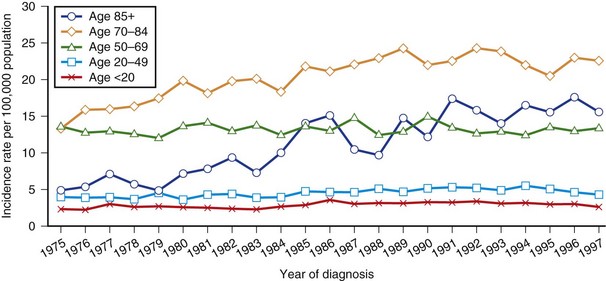
Using the SEER database, Gurney and Kadan-Lottick (2001) calculated incidence trends by age group for malignant brain tumors for 1975 to 1997 (Fig. 39.2). Incidence rates remained stable for persons 20 to 69 years of age during the period. A 35% increase in rates for children 0 to 14 years old was seen in the mid-1980s. A gradual increase in malignant tumor rates was observed for persons older than 70 years between 1975 and 1990. During the 1990s, the rates for most groups remained essentially stable. Increasing incidence trends must be interpreted with caution. At least some of these changes can be attributed to the dramatic improvements in neuroimaging seen from the 1980s on. In meningioma, age-specific rates continue to rise with age to the oldest group, and a female preponderance is found. The suspected excess in blacks was borne out in a survey in the Los Angeles County Cancer Surveillance program. Age-adjusted average annual incidence rates for meningiomas were 1.8 per 100,000 males and 2.7 per 100,000 females. Respective non-Hispanic white rates were 1.8 per 100,000 and 2.5 per 100,000; for blacks, they were 2.5 per 100,000 and 3.6 per 100,000. In Rochester, Minnesota, annual incidence rates were 4.9 per 100,000 males and 5.8 per 100,000 females for the years 1935 to 1977, but only 1.2 and 2.6 per 100,000 respectively for cases diagnosed before death.
The most recent overall incidence estimate for malignant intracranial tumors in the United States is 7.2 per 100,000 person-years population for 2004-2006 (CBTRUS, 2010). For benign brain tumors for the same period, the figure is 11.5 per 100,000 person-years, including 6.3 per 100,000 for meningiomas and 2.5 for tumors of the sella region.
Metastatic brain tumors are more common than primary malignant brain tumors, with incidence rates of approximately 10 per 100,000. The relative frequencies of brain metastases, called incidence proportions (IPs), in patients diagnosed in the Metropolitan Detroit Cancer Surveillance System between 1972 and 2001 were reported by Barnholtz-Sloan and associates (2004). Total IP of brain metastases was 9.6% for all primary sites combined, with highest IPs for lung (19.9%), melanoma (6.9%), renal (6.5%), breast (5.1%), and colorectal (1.8%) cancers. African Americans demonstrated higher IPs than other racial groups. This total IP is lower than in earlier reports, which had ranged from 20% to 50%.
Although some CNS tumors have a clear genetic character, less than 5% can be attributed to inheritance. Many risk factors have been implicated in human brain tumors, the vast majority of which are unsubstantiated by scientific evidence. High-dose irradiation leads to an increased incidence of primary brain tumors, but the association of higher brain tumor risk with low doses of radiation is more controversial. Prolonged cell phone use and risk for brain tumors has been the subject of several studies over the past decade, with mixed results (Ahlbom et al., 2009). Overall, cell phone use studies to date do not demonstrate an increased risk of brain tumors within 10 years. For slow-growing tumors such as meningiomas or acoustic neuromas, the absence of an association is less conclusive with such a limited observation period.
Recent epidemiological studies suggest prenatal and early childhood environmental factors that may alter the risk of brain tumors. Increased risk for brain tumors was identified in persons born in late fall through early spring in one report (Brenner et al., 2004) and has been associated with maternal smoking during pregnancy in another (Brooks et al., 2004). The protective effects of vitamin supplementation during pregnancy have been borne out in several studies (Preston-Martin et al., 1998).
Convulsive Disorders
Epilepsy is defined as recurrent seizures (i.e., two or more distinct seizure episodes) that are unprovoked by any immediate cause (see Chapter 67). The International League Against Epilepsy (ILAE) classification system divides the epilepsies into four broad groups: (1) localization-related; (2) generalized; (3) undetermined whether localized or generalized; and (4) special syndromes (Everitt and Sander, 1999). Within the localization-related and generalized groups, further subdivisions into symptomatic (known cause), idiopathic (presumed genetic origin), and cryptogenic (no clear cause) are recognized. The major clinical types of seizures are generalized tonic-clonic, absence, incomplete convulsive (myoclonic), simple partial (focal), and complex partial (temporal lobe or psychomotor). Status epilepticus is defined as any seizure lasting for 30 minutes or longer, or recurrent seizures for more than 30 minutes during which the patient does not regain consciousness.
Mortality Rates
Reported mortality rates with epilepsy are on average two to three times greater than those in the general population. Shackleton and colleagues performed a meta-analysis on 21 studies of epilepsy mortality and found overall SMRs between 1.2 and 9.3 (Shackleton et al., 2002). Population-based studies with long-term follow-up give SMRs between 2 and 4, which seem the more accurate estimates.
As to evaluating cause of death, the proportionate mortality (PMR) is frequently used. The PMR for conditions related to epilepsy range between 1% and 13% for population-based studies (Hitiris et al, 2007). Etiologies include status epilepticus and seizure-related causes (PMR 0% to 10%), sudden unexplained death in epilepsy (SUDEP; PMR 0% to 4%), suicide (PMR 0% to 7%), and accidents (0% to 12%). Causes of nonepilepsy-related death include ischemic heart disease (PMR 12% to37%), cerebrovascular disease (PMR 12% to 17%), cancer (PMR 18% to 40%), pneumonia (PMR 0% to 7%), suicides (PMR 0% to 12%), and accidents (0% to 4%).
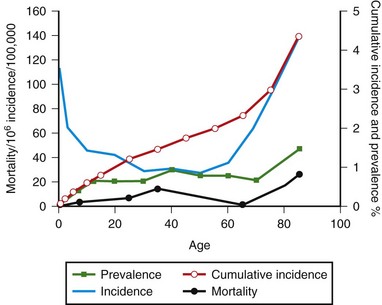
SUDEP generally is considered to be the most common cause of epilepsy-related death, with a relative frequency of 1 per 1000 epilepsy cases (Opeskin and Berkovic, 2003). Risk factors that have been consistent across studies include male sex, generalized tonic-clonic seizures, early age of onset of seizures, refractory treatment, and being in bed at the time of death. Proposed mechanisms for SUDEP include central apnea, acute neurogenic pulmonary edema, and cardiac arrhythmia precipitated by seizure discharges acting via the autonomic nervous system. Other causes of death in epilepsy can be classified as those in which epilepsy is secondary to an underlying disease (cerebrovascular disease) or is an unrelated disorder (ischemic heart disease). Age-specific mortality rates for Rochester, Minnesota, are shown in Fig. 39.3. Graphed curves for mortality data were similar in configuration to those for age-specific prevalence data, but rates were 1000-fold lower. This finding suggests that each year, 0.1% of the patients with epilepsy die of causes directly related to their epilepsy. Status epilepticus affects 105,000 to 152,000 persons annually in the United States (DeLorenzo et al., 1996). Status epilepticus represents a neurological emergency, and despite improvements in treatment, the mortality rate is still high. Population-based studies have reported 30-day case-fatality ratios between 8% and 22%. Short-term fatality after status epilepticus is associated with the presence of an underlying acute etiological disorder. Fatality ratios are lowest in children (short-term mortality rate 3% to 9%) and highest in the elderly (short-term mortality rate 22% to 38%). Case-fatality ratios for those surviving the initial 30 days after status epilepticus are 40% within the next 10 years.
Morbidity Rates
Fig. 39.3 also shows morbidity measures for epilepsy in Rochester, Minnesota, by age group. Age-specific incidence of epilepsy was high during the first year of life, declined during childhood and adolescence, and then increased again after age 55. The cumulative incidence of epilepsy was 1.2% through age 24 and steadily increased to 4.4% through age 85 years. Age-specific prevalence increased with advancing age; nearly 1.5% of the population older than 75 years had active epilepsy.
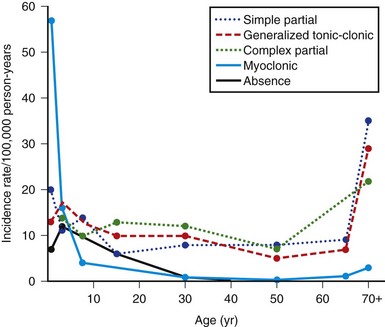
Point prevalence and average age-adjusted annual incidence rates for epilepsy are available from a number of community surveys (Banerjee et al., 2009). In general, the prevalence of convulsive disorders is about 3 to 9 per 1000 population in industrialized countries. Some of the variation can be attributed to methodological differences in studies. Developing countries have reported higher prevalence rates of up to 41 per 1000. In general, males have higher rates than females, and recent studies have found no significant racial predilection. The overall lifetime prevalence of a nonfebrile seizure, as opposed to active epilepsy, is 5% in both industrialized and developing countries. Average annual age-adjusted incidence rates for epilepsy are about 50 per 100,000, with a range of 16 to 70 per 100,000 population in industrialized countries. A slight male excess is reported, which averages about 1.2 to 1. Surveys from developing countries are fewer and less rigorous and report much higher incidence rates, ranging between 43 and 190 cases per 100,000 per year. Within industrialized countries, temporal trends in epilepsy over the past 30 years have shown a decrease in incidence in children and an increase in incidence rates for the elderly. Improved prenatal care and immunization may explain the changes for the former, and perhaps longer life expectancy with more concomitant CNS disease for the latter. Overall prognosis for controlling seizures is good, with more than 70% of patients achieving long-term remission. Age-specific incidence rates for epilepsy from several surveys showed a sharp decrease from maximal rates in infancy to adolescence and thereafter a slow decline for new cases throughout life. In other studies, rates were essentially constant after infancy or showed an irregular rise with age. In Rochester, Minnesota, however, the configuration was U-shaped, with a marked increase in incidence rates at the age of 75 and older (Fig. 39.4). This configuration reflects generalized tonic-clonic disorders, together with absence and myoclonic seizures for the left arm of the U and complex partial and generalized tonic-clonic epilepsies for the right arm. Myoclonic seizures were the major type diagnosed during the first year of life; they also were the most common in the 1 to 4 year age group but rarely occurred after 4 years of age. Absence (petit mal) seizures peaked in the 1 to 4 year age group and did not begin in patients older than 20. Complex partial and generalized tonic-clonic seizures both had fairly consistent incidence rates of 5 to 15 per 100,000 in persons 5 to 69 years of age, after low maxima at ages 1 to 4 years; for age 70 and older, the rates of each were sharply higher. Generalized tonic-clonic seizure rates had a similar configuration for both primary and secondary seizures. Simple partial seizures increased only slightly with age.
Multiple Sclerosis
Mortality Rates and Survival
Over the past 4 decades, mortality for multiple sclerosis (MS; see Chapter 54) declined steadily in North America and Western Europe and remained stable or increased in Eastern Europe. Data from Spain for the period 1981 to 1997 indicate annual age-adjusted mortality rates of 0.3 per 100,000 for men and 0.4 per 100,000 for women. A north-south gradient in age-adjusted mortality rates between 1971 and 1998 was observed in Spain. For both sexes, provinces with SMRs higher than the mean tended to be in the northern third of Spain, whereas those with SMRs lower than the mean were predominantly in the southern half (Llorca et al., 2005).
As to cause of death, many patients with MS die of complications related to their disease. Koch-Henriksen and colleagues (1998) in Denmark, as well as Smestad and colleagues (2009) in Norway, attributed more than half of all deaths in a large population cohort to MS or its complications. An overall SMR of 2.5 for all causes was calculated for the Norwegian cohort (Smestad et al., 2009). Infections were the most common cause of death; survival was age dependent and not related to disease course. As more patients with MS survive to older ages, however, a greater proportion of them can be expected to die of causes unrelated to MS and thus will not be coded as dying from MS (underlying cause). This last point is supported by analysis of contributory causes of death for patients with MS in Denmark and in the United States. The estimated 25-year survival of the population with MS in Rochester, Minnesota, was 76.2%, compared with 87.7% for the general U.S. white population of similar age and gender. Survival for men was less than for women. This survival figure was slightly greater than earlier estimates for Rochester. The Danish National MS Registry data provided a median survival of 30 years from onset of the disease. Median survival times for U.S. World War II veterans from MS disease onset were 43 years (white females), 30 years (black males), and 34 years (white males) (Wallin et al., 2000). The male rates did not differ significantly, and when relative survival ratios were calculated, none of the three groups were significantly different, indicating the excess for the white females was more attributable to gender than to disease.
Morbidity Rates
Prevalence rates for Europe and the Mediterranean basin as of 1980 are plotted against geographical latitude in Fig. 39.5. The surveys then appeared to separate into clusters within two zones: one to the north, with rates of 30 per 100,000 and higher, considered to represent high frequency, and the other to the south, with rates less than 30 per 100,000 but greater than 4 per 100,000 population, classified as medium frequency.
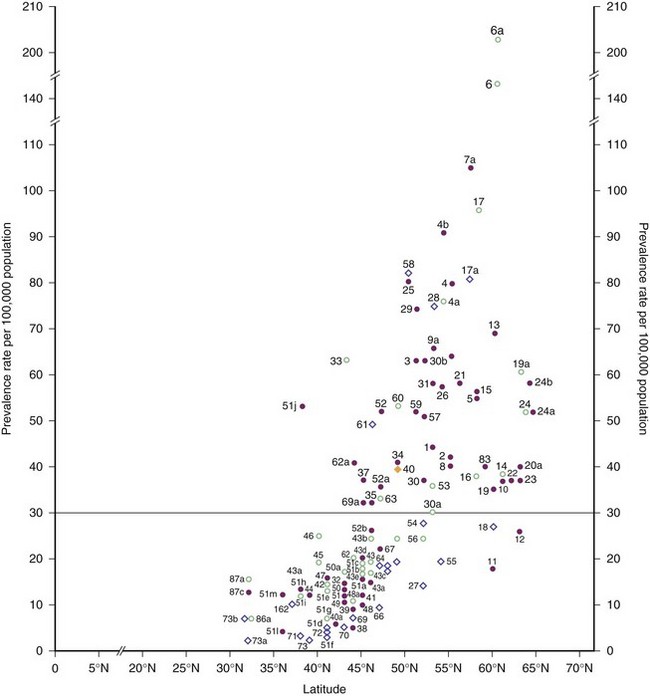
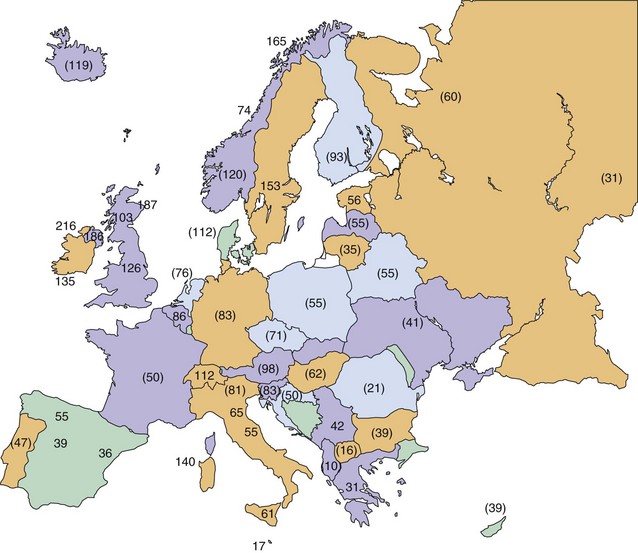
The northernmost parts of Scandinavia and the Mediterranean basin were medium-prevalence regions in 1980. More recent surveys of Italy and its islands, however, have documented prevalence rates of 60 per 100,000 and higher; therefore, this country is now clearly within the high-frequency band (Kurtzke, 2005). This increase in prevalence appears to be recent, because some of the earlier Italian surveys with lower rates were well done. This change is not limited to Italy—indeed, all of Europe from northernmost Norway to the Mediterranean regions now fall in the high-frequency zone, as documented by Pugliatti et al. (2006) in Fig. 39.6.
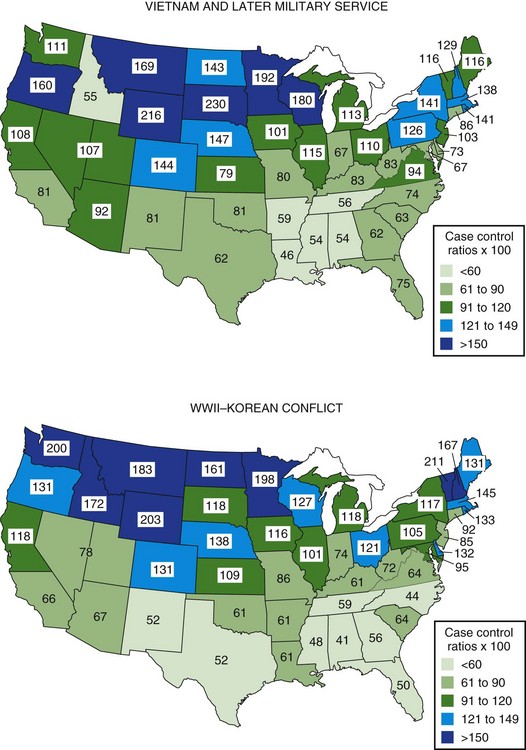
Although clearly intra- and international diffusion of this disease has occurred in recent years, the general worldwide distribution of MS may still be described within three zones of frequency or risk. As of 2004, the high-risk zone, with prevalence rates of 30 per 100,000 population and above, included essentially all of Europe, the United States, Canada, Israel, and New Zealand, plus southeastern Australia and easternmost Russia. These regions are bounded by areas of medium frequency, with prevalence rates between 5 and 29 per 100,000, consisting now of Russia from the Ural mountains into Siberia, as well as the Ukraine. Also in the medium zone still fall most of Australia and perhaps Hawaii, all of Latin America, the North African littoral, and whites in South Africa; even northern Japan seems now to be of medium prevalence. Low-frequency areas, with prevalence rates below 5 per 100,000, still comprise all other known areas of Asia, Africa, Alaska, and Greenland (Kurtzke, 2005). MS clearly is a place-related disorder. All of the high- and medium-risk areas are found in Europe or the European colonies: Canada, the United States, Australia, New Zealand, Israel, South Africa, and probably Latin America. MS probably originated in northwestern Europe and was brought to the other lands by European settlers. In Europe itself, although the disease clearly has shown geographical clustering in some countries, there is evidence even within these clusters of diffusion over time, as well as the notable spread throughout the continent. The annual incidence rate for MS in high-risk areas at present is approximately 3 to 6 per 100,000 population, whereas in low-risk areas it is approximately 1 per 1,000,000. Medium-risk areas have an incidence near 1 per 100,000. In Denmark during the years 1939 to 1945, age-specific incidence rates rose rapidly, from essentially zero in childhood to a peak at about age 27 of more than 9 per 100,000 for females and almost 7 per 100,000 for males. Beyond age 40, little difference between the sexes was seen; in both, rates declined equally to zero by age 65. The most recent evidence indicates that women of all races in the United States now have higher rates than white males, whereas black males have increased their risk to two-thirds that of the white males; men of other races still have but one-fourth the risk of white men (Wallin et al., 2004). The U.S. World War II veteran series showed a markedly elevated risk for residents who lived in the northern region of the country (Fig. 39.7). This was seen for both sexes among whites and for black men, with a north-to-south difference of almost 3 to 1. Veterans of the Vietnam War and later conflicts still showed a gradient, but it was much less. All southern states then were calculated to lie within the high-frequency zone, with prevalence rates that were estimated at well over 30 per 100,000 population. For all races and both sexes, the north-to-south difference was only 2 to 1. This is not a “regression to the mean” with a decreased prevalence in the north, but rather reflects an even greater increase in the south. This diffusion is in accord with the intra- and international changes for Europe as noted. MS is geographically a slowly spreading disease, the reason(s) for which must be environmental.
Genetic Studies
1. An excess of MS-concordant monozygous twins in most twin studies. The difference in concordance rates between monozygotic and dizygotic twins is attributable primarily to genetic factors. Moreover, a recent study found no evidence for genetic, epigenetic, or transcriptome differences in identical twins discordant for MS (Baranzini et al., 2010). The maximum concordance rate for MS in monozygotic twins in high-risk areas is approximately 30%. This indicates that although genes play a role in MS, the maximal effect of genes is at most 30%.
2. The association of HLA alleles (specifically the HLA DR2 haplotype) and MS, and the higher frequency of HLA sharing in affected sibling pairs. There is a dose effect of the DRB1*1501 on MS susceptibility.
3. Population groups relatively resistant to MS in high-frequency areas (Asians and Amerindians in North America, Lapps in Scandinavia, and Gypsies in Hungary).
Multiple sclerosis is a genetically complex disease that does not have a uniform mode of transmission. Genes are likely to play a role in both susceptibility and progression of MS. High linkage scores and significant allelic association with the HLA-DRB1*1501-DQB1*0602 haplotype have lent support to the major histocompatibility complex (MHC) region as the strongest genetic determinant of MS (Oksenberg et al., 2008). Large non-MHC genome-wide association studies have led to the discovery of several other MS susceptibility genes. These include the interleukin 2 (IL2RA) and interleukin 7 (IL7RA) receptor genes. Newer gene loci have relatively low risk ratios (<1.5) for determining MS susceptibility. Like other complex genetic diseases, many more genes will be discovered but likely not add significantly to the models of disease risk for individual patients.
Migration in Multiple Sclerosis
Kurtzke and associates (1998) identified North African immigrants among 7500 patients with MS in a nationwide survey in France in 1986. A total of 260 had immigrated from North Africa, mostly between 1960 and 1965. Two-thirds were from Algeria, where virtually its entire European population had emigrated in 1962 at the end of the Algerian war for independence. The migrants were younger at both prevalence day in 1986 and at onset of MS than the French-born persons with MS. The 225 with onset more than 1 year after migration presumably acquired their MS in France. They provided an age-adjusted (to the U.S. 1960 population) MS prevalence rate 1.5 times that for all of France. If the latter is 50 per 100,000 population, their estimated adjusted rate is 77. At each year of age at immigration, there was a mean interval of 13 years and a minimum of 3 years to clinical onset from either age 11 or age at immigration if that was older than 11. The other 27 migrants with presumed acquisition in North Africa had an estimated adjusted prevalence of 17 per 100,000, the same as expected in their native lands. Disease frequencies among immigrants that are higher than among natives are typical of their exposure to a new infection. The study also suggested that 3 years of exposure from age 11 were needed for immigrants from medium-risk areas to acquire MS, and that susceptibility extended to about age 45 or so.
Epidemics of Multiple Sclerosis
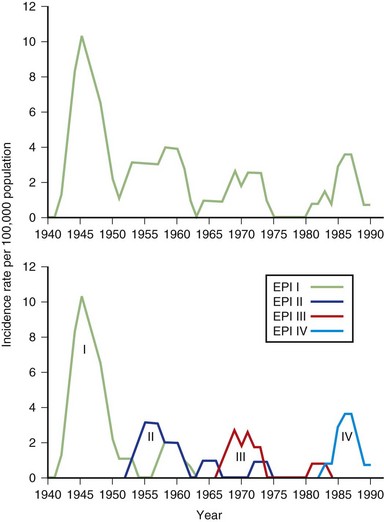
We divided the other 33 patients (the 34th heralded a possible epidemic V) according to when they reached age 11, which then provided three more (type 2) epidemics of 10, 10, and 13 patients each—epidemics II, III, and IV (data as of 1991 are shown in Fig. 39.8) (Kurtzke and Heltberg, 2001).
Movement Disorders
Movement disorders as a group (see Chapters 21 and 71) span multiple unique conditions within neurology. The most common adult-onset movement disorder is essential tremor. A recent review estimated the pooled prevalence of essential tremor to be 0.9% for all ages (Louis and Ferreira, 2010). There was a marked increase in essential tremor with increasing age, with a pooled rate of 4.6% for individuals older than 65 years.
The cause of PD remains unclear. Age is the most important risk for developing the disease. Genetic studies have linked dopa-responsive parkinsonism to a variety of mutations in seven genes (Lees et al., 2009). Environmental risk factors that appear to be protective in developing PD include intake of caffeine and smoking. Weaker associations have been shown between PD and head injury, consumption of well water, and exposure to pesticides.
Morbidity Rates
The prevalence of PD ranges between 100 and 200 per 100,000 population in most studies from Western nations. Prevalence increases with increasing age, with rates for those older than aged 80 between 3% and 6%. In terms of age at onset, a population-based study from the United Kingdom reported 5.4% of PD cases had onset at younger than 50 years of age, and 33% at younger than 65 (Wickremaratchi et al., 2009). The sex ratio for PD prevalence has been mixed, with some studies showing a higher proportion of males with the disease and some showing no significant sex difference.
Recent prospective incidence studies have reported PD age-adjusted annual rates per 100,000 population between 9 and 22.5 (Linder et al., 2010). Incidence rates are slightly higher for men than women in many Western country studies, with a male-to-female rate of about 1.5. The rates by sex for PD among Asian countries have been similar. Like prevalence rates, incidence rates for PD rise exponentially with increasing age.
Incidence rates have been relatively stable in studies that have tracked trends over several decades. In Olmsted County, Minnesota, the incidence of PD remained stable between 1935 and 1990 (Rocca et al., 2001). For the most recent period, 1976 to 1990, incidence rates in men ranged between 10.6 and 15.9 per 100,000 person-years, and for women between 7.3 and 11.6. There were no significant birth cohort effects in this population. These results suggest there were no major environmental risk agents introduced into the population during the period of study.
Mortality Rates
Parkinson disease has been generally shown to increase mortality in a number of studies, with risk ratios for death between 0.8 and 3.5. Studies evaluating incident PD with long follow-up have produced the best data on mortality. Recent studies with follow-up extending beyond 10 years have shown relative risk for death of PD ranging between 1.5 and 2.5. Patients who developed PD in the Physicians Health Study had a 2.3 relative risk of dying after adjustment for age at onset and smoking (Driver et al., 2008). This study matched controls on comorbidities and found PD patients were at increased risk for dying from stroke, psychiatric disease, and cardiac disease but were less likely to die from cancer. The risk of PD death was apparent across all categories of PD duration. This is in contrast to data from a European mortality study showing that the mortality burden in PD increased only after the first decade of the disease (Diem-Zangerl et al., 2009). Standardized mortality ratios in this study at 5 years after disease onset was 0.9, and by 20 to 30 years after onset was 1.3. Overall, PD independently increases the risk for death. Confirming modifiable risk factors for mortality will be important in the preventive care of patients with PD.
Selected Infections and Neurological Disease
Human Immunodeficiency Virus Infection
Human immunodeficiency virus (HIV; see Chapter 53A) infection has become a global epidemic since it was first identified in 1981 as the cause of the acquired immunodeficiency syndrome (AIDS). The virus is a member of the retrovirus family and selectively infects T-helper cells (TH4, CD4+), causing a defect in cell-mediated immunity. It is spread through contact with blood and bodily fluids. After acute infection, most people enter an asymptomatic period of 8 to 10 years before the virus infection manifests clinically through immune dysregulation (Harrison and McArthur, 1995).
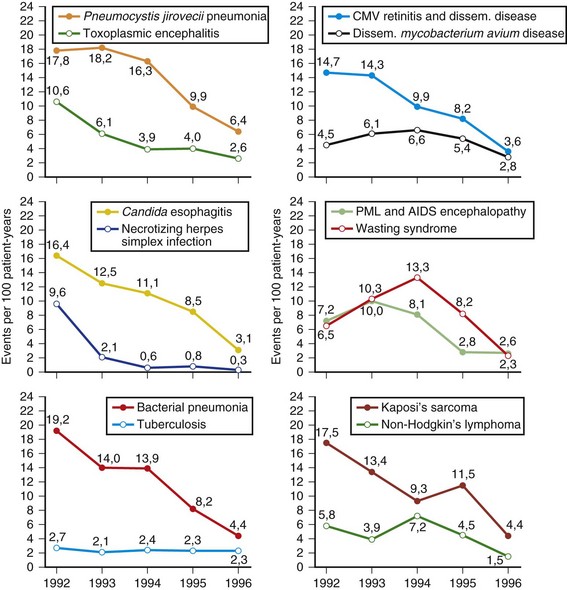
Despite recent advances in treatment and prevention, the scope of the HIV epidemic remains daunting. As of 2008, 33 million people worldwide were living with HIV, and 2.7 million more were infected (UNAIDS, 2010). The infection killed 2 million in 2008 and has been the cause of death for greater than 20 million since the first AIDS cases were identified (UNAIDS, 2010). Sixty-eight percent of HIV cases occur in sub-Saharan Africa, where some 22 million persons are affected. During the first 6 months of 1996, the first reported decline in AIDS mortality rates occurred in the United States (CDC, 1997). Compared with estimates for the period January to June of 1995 (24,900), a 13% drop in AIDS deaths was observed in January to June of 1996 (22,000). This decline occurred in all racial and ethnic groups and in all regions of the United States. Mortality rates have continued to decline in many HIV-infected cohorts after the introduction of highly active antiretroviral therapy (HAART) in 1996. For example, Crum et al. (2006) noted an 80% decrease in deaths between 1990 and 2003 in their Department of Defense HIV cohort. Median survival times after HIV seroconversion in 1994-1996 were 8 years compared with 12 years during the late HAART era. Infections remained the leading cause of death in AIDS, followed by cancer. HIV disease can produce a variety of effects on both the CNS and the peripheral nervous system (PNS) (Price, 1996). A useful way of classifying these complications is to use the temporal profile of HIV infection on the immune system. Box 39.1 illustrates a simplified classification scheme. Early neurological complications include acute aseptic meningitis, acute and chronic demyelinating polyneuropathy, and multiple mononeuropathy. These early complications are autoimmune in nature and occur at CD4+ cell counts greater than 200 cells/mm3. Late complications typically appear when a severe depression in cellular immunity occurs, with CD4+ counts less than 200 cells/mm3. Most of these disorders are opportunistic infections (cryptococcal meningitis) or represent reactivation of a prior infection (toxoplasmosis and progressive multifocal leukoencephalopathy [PML]). In the late 1980s and early 1990s, we also had personally encountered notable frequencies of tuberculosis and neurosyphilis among AIDS patients; these excesses have since disappeared. In sub-Saharan Africa, tuberculosis and malaria remain at excessively high frequencies among the HIV infected. HIV dementia, distal sensory polyneuropathy, and vacuolar myopathy are directly related to late stages of HIV infection itself. Other complications affecting the nervous system involve metabolic and toxic effects of treatment, including zidovudine myopathy and nucleoside neuropathy. Six AIDS-indicator neurological illnesses are defined by the CDC: HIV dementia, CNS cryptococcal infection, cytomegalovirus (CMV) infection, primary CNS lymphoma, CNS toxoplasmosis, and PML. The CDC records data on these illnesses primarily if they are the initial AIDS diagnosis. Occurrence of these illnesses during the course of HIV infection must therefore be studied in other series. One such population is the HIV Outpatient Study, which is a prospective cohort study of 7155 patients in 10 U.S. HIV clinics. Hospitalization rates for HIV-infected patients declined for the years 1994-2005, due predominantly to reductions in AIDS opportunistic infections including neurological illnesses (Buchacz et al., 2008). Compared to the years 1994-1997, patients in the era of HAART were hospitalized with higher CD4+ cell counts and more frequent chronic end-organ conditions. Brodt and co-workers (1997) reported on the changing incidence of AIDS-defining illnesses in the Frankfurt AIDS Cohort Study, consisting of approximately 1000 homosexual men. The major illnesses decreased between 1992 and 1996 (Fig. 39.9). Included in the decline were toxoplasmic encephalitis, CMV disease, PML, and AIDS encephalopathy, all of which reached attack rates of less than 5 per 100 patient-years. Treatment with combination antiretroviral therapy and with protease inhibitors increased during the study period. Undoubtedly, these new combination therapies have had a role in the declining incidence rates in this cohort.
Box 39.1 Neurological Complications of Human Immunodeficiency Virus Infection
West Nile Virus Infection
The West Nile virus (WNV) is a mosquito-borne flavivirus that initially was isolated in 1937 from a symptomatic patient in Uganda (Tyler, 2009). The virus was rarely studied until 1999, when it first appeared in New York City as the cause of a naturally acquired meningitis and encephalitis. Over the next several years, a dramatic westward spread of WNV across the United States has been recognized. Most human infections occur through the bite of an infected mosquito of the Culex genus during the summer months. Wild birds, particularly crows, sparrows, and jays, serve as the natural reservoir. Symptoms begin after an average incubation period of approximately 1 week. WNV is now the leading cause of arboviral encephalitis in the United States.
A spectrum of clinical presentations may be seen with WNV infection, but approximately 80% of cases remain asymptomatic. Among symptomatic cases, West Nile fever is the most common illness. This traditionally has been characterized by fever, rash, and lymphadenopathy. Headache, fatigue, and gastrointestinal (GI) symptoms also are variably present. In a proportion of symptomatic cases, neurological illness develops, which may manifest as aseptic meningitis, encephalitis, or acute flaccid paralysis. A follow-up survey of New York City residents with WNV meningitis or encephalitis found that only 37% achieved a full recovery at 1 year (Klee et al., 2004). Deficits were found in physical, cognitive, and functional performance.
In 2009, the incidence of WNV neuroinvasive disease in the United States was 0.13 per 100,000 population, the lowest reported since 2001 (CDC, 2010). Between 2004 and 2007, WNV neuroinvasive disease incidence stabilized at 0.4 per 100,000 population. Evidence for WNV human disease continues to be detected in all geographic regions of the United States, with the highest rates in west-central states. The two major risk factors for neuroinvasive disease are increasing age and immunosuppression. Therapy for WNV infection is primarily supportive because no treatment has been found to be effective in altering morbidity or mortality rates. Preventive efforts constitute the major focus of controlling this illness. These involve environmental control of mosquito breeding areas, wearing insect repellants and protective clothing, and screening the blood supply. Horses remain the major animal vector for WNV, and an effective vaccine has been in use for several years. Vaccine trials for human WNV are underway, and a safe and effective vaccine for humans is expected to be developed soon. In view of the high recurrence rates from 1999 to 2004, the transmission of WNV will continue to be an issue for many years to come.
Neurocysticercosis
Neurocysticercosis (NCC) is caused by an infection of the human CNS by the larval stage of the pork tapeworm, Taenia solium (Garcia and Del Brutto, 2005). Currently, the most common parasitic disease of the human CNS, NCC has become a major public health problem for most of the developing world, as well as in industrialized countries with a high immigration rate of people from endemic countries in Latin America, Asia, and Africa. It is the most common cause of symptomatic epilepsy worldwide.
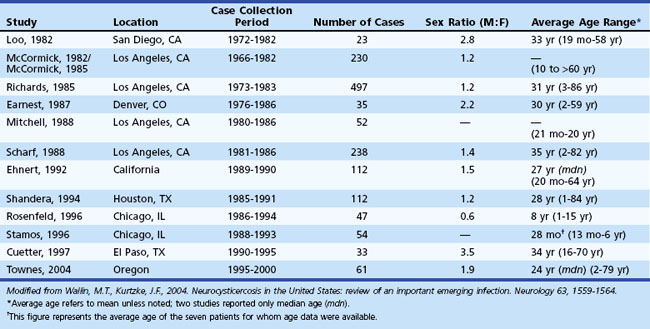
Neurocysticercosis has become an increasingly important emerging infection in the United States. The number of cases of imported NCC is higher in the United States than in all other developed countries combined. These numbers have been driven largely by the influx of immigrants from endemic regions into the United States and ease of international travel, while widespread access to neuroimaging has permitted easier diagnosis. A total of 1494 patients with NCC were reported in the United States between 1980 and 2004 among large case series (i.e., N >20) (Wallin and Kurtzke, 2004). Table 39.1 lists the 13 largest case series that have been published on NCC within the United States over this period. These reports are largely concentrated in the southwestern United States but include NCC cases from every region of the country. Among the case series, a slight male bias was observed, and the average age ranged between 24 and 35 years. Common onset symptoms for NCC patients within the United States include seizures (66%), hydrocephalus (16%), and headaches (15%). A majority of patients present with parenchymal disease (91%); ventricular cysts, subarachnoid cysts, and spinal cysts are the presenting manifestations in the remaining patients. Treatment with antiparasitic drugs has been shown to be beneficial in the early stages of parenchymal NCC. Seizures typically are controlled with standard anticonvulsants. Therapy directed at the parasite, however, varies according to the stage, location, and number of parasites within the CNS. An increasing number of NCC cases have been reported in the U.S. literature over the past 50 years. Currently, California and Oregon are the only states with mandatory reporting requirements. A national reporting network would be helpful in the control and eventual elimination of this disease. Because neurologists often are involved with the diagnosis and management of NCC in the United States, they must become familiar with the disorder.
Overview of the Frequency of Neurological Disorders
What follows are the best estimates of the numerical impact of neurological diseases. The data refer primarily to whites in western countries. Some modifications of the cited references have been made, but the authors have not found reasons to change most of these figures. For the 66 disorders listed in Tables 39.2 and 39.3, the average annual incidence rates add up to greater than 2500 per 100,000 population, or 2.5%. Included in these tables are eight disorders for which only one-tenth of the incident cases were thought to require neurological attention: the two vertebrogenic pain syndromes, nonmigrainous headache, head injury without brain trauma, alcoholism, psychosis, nonsevere mental retardation, and deafness. Total blindness numbers were taken as an estimate for the proportion of all visually impaired patients the neurologist might encounter. Even if all headaches, trauma, vertebrogenic pain, vision loss, deafness, and psychosis are excluded from consideration, it is estimated that more than 1100 new cases of neurological disease will appear each year in every 100,000 of the population, or more than 1 case for every 100 people (Tables 39.4 and 39.5).
| Disorder | Rate |
|---|---|
| Herpes zoster | 400 |
| Migraine | 250 |
| Brain trauma | 200 |
| Other severe headache | 200† |
| Acute cerebrovascular disease | 150 |
| Head injury without brain trauma | 150† |
| Transient postconcussive syndrome | 150 |
| Lumbosacral herniated nucleus pulposus | 150 |
| Lumbosacral pain syndrome | 150† |
| Neurological symptoms (with no defined disease) | 75 |
| Epilepsy | 50 |
| Febrile fits | 50 |
| Dementia | 50 |
| Meniere disease | 50 |
| Transient ischemic attacks | 40 |
| Mononeuropathies | 40 |
| Polyneuropathy | 50 |
| Bell palsy | 25 |
| Single seizures | 20 |
| Parkinsonism | 20 |
| Cervical pain syndrome | 20† |
| Persistent postconcussive syndrome | 20 |
| Alcoholism | 20† |
| Meningitides | 15 |
| Encephalitides | 15 |
| Sleep disorders‡ | 15 |
| Subarachnoid hemorrhage | 15 |
| Cervical herniated nucleus pulposus | 15 |
| Peripheral nerve trauma | 15 |
| Blindness | 15 |
| Metastatic brain tumor | 10 |
| Benign brain tumor | 10 |
| Deafness | 10 |
* Approximate average annual incidence rates per 100,000 population, all ages.
† Cited rates are 10% of actual rates, as proportions of patients likely to need care by a physician competent in neurology.
‡ Narcolepsies and hypersomnias (with sleep apnea).
Modified from Kurtzke, J.F., 1982. The current neurologic burden of illness and injury in the United States. Neurology 32, 1207-1214.
Table 39.3 Less Common Neurological Disorders: Incidence*
| Disorder | Rate* |
|---|---|
| Cerebral palsy | 9.0 |
| Congenital malformations of central nervous system | 7.0 |
| Malignant primary brain tumor | 7.0 |
| Mental retardation, severe | 6.0 |
| Mental retardation, other | 6.0† |
| Metastatic cord tumor | 5.0 |
| Tic douloureux | 4.0 |
| Multiple sclerosis | 3.0‡ |
| Optic neuritis | 3.0† |
| Dorsolateral sclerosis | 3.0 |
| Functional psychosis | 3.0† |
| Spinal cord injury | 3.0 |
| Motor neuron disease | 2.0 |
| Down syndrome | 2.0 |
| Guillain-Barré syndrome | 2.0 |
| Intracranial abscess | 1.0 |
| Benign cord tumor | 1.0 |
| Cranial nerve trauma | 1.0 |
| Acute transverse myelopathy | 0.8 |
| All muscular dystrophies | 0.7 |
| Chronic progressive myelopathy | 0.5 |
| Polymyositis | 0.5 |
| Syringomyelia | 0.4 |
| Hereditary ataxias | 0.4 |
| Huntington disease | 0.4 |
| Myasthenia gravis | 0.4 |
| Acute disseminated encephalomyelitis | 0.2 |
| Charcot-Marie-Tooth disease | 0.2 |
| Spinal muscular atrophy | 0.2 |
| Familial spastic paraplegia | 0.1 |
| Wilson disease | 0.1 |
| Malignant primary cord tumor | 0.1 |
| Vascular disease of cord | 0.1 |
* Approximate average annual incidence rates per 100,000 population, all ages.
† Cited rates are 10% of actual rates, as proportions of patients likely to need care by a physician competent in neurology.
Modified from Kurtzke, J.F., 1982. The current neurologic burden of illness and injury in the United States. Neurology 32, 1207-1214; and from Kurtzke, J.F., Kurland, L.T., 1983. The epidemiology of neurologic disease, In: Baker A.B., Baker, L.H. (Eds.), Clinical Neurology, vol. 4. Harper & Row, Philadelphia.
Table 39.4 Most Common Neurological Disorders: Prevalence*
| Disorder | Rate |
|---|---|
| Migraine | 2,000† |
| Other severe headache | 1,500‡ |
| Brain trauma | 800 |
| Epilepsy | 650 |
| Acute cerebrovascular disease | 600 |
| Lumbosacral pain syndrome | 500‡ |
| Alcoholism | 500‡ |
| Sleep disorders§ | 300 |
| Meniere disease | 300 |
| Lumbosacral herniated nucleus pulposus | 300 |
| Cerebral palsy | 250 |
| Dementia | 250 |
| Parkinsonism | 200 |
| Transient ischemic attacks | 150 |
| Febrile fits | 100 |
| Persistent postconcussive syndrome | 80 |
| Herpes zoster | 80 |
| Congenital malformations of central nervous system | 70 |
| Single seizures | 60 |
| Multiple sclerosis | 60¶ |
| Benign brain tumor | 60 |
| Cervical pain syndrome | 60‡ |
| Down syndrome | 50 |
| Subarachnoid hemorrhage | 50 |
| Cervical herniated nucleus pulposus | 50 |
| Transient postconcussive syndrome | 50 |
| Spinal cord injury | 50 |
* Approximate point prevalence rates per 100,000 population, all ages.
† Cited rate is 20% of actual prevalence rate, as a proportion of patients likely to need care by a physician competent in neurology.
‡ Cited rates are 10% of actual rates, as proportions of patients likely to need care by a physician competent in neurology.
§ Narcolepsies and hypersomnias (with sleep apnea).
Modified from Kurtzke, J.F., 1982. The current neurologic burden of illness and injury in the United States. Neurology 32, 1207-1214.
Table 39.5 Less Common Neurological Disorders: Prevalence*
| Disorder | Rate |
|---|---|
| Tic douloureux | 40 |
| Neurological symptoms without defined disease | 40 |
| Mononeuropathies | 40 |
| Polyneuropathies | 40 |
| Dorsolateral sclerosis | 30 |
| Peripheral nerve trauma | 30 |
| Other head injury | 30† |
| Acute transverse myelopathy | 15 |
| Metastatic brain tumor | 15 |
| Chronic progressive myelopathy | 10 |
| Benign cord tumor | 10 |
| Optic neuritis | 10 |
| Encephalitides | 10 |
| Vascular disease of spinal cord | 9 |
| Hereditary ataxias | 8 |
| Syringomyelia | 7 |
| Motor neuron disease | 6 |
| Polymyositis | 6 |
| Progressive muscular dystrophy | 6 |
| Malignant primary brain tumor | 5 |
| Metastatic cord tumor | 5 |
| Meningitides | 5 |
| Bell palsy | 5 |
| Huntington disease | 5 |
| Charcot-Marie-Tooth disease | 5 |
| Myasthenia gravis | 4 |
| Familial spastic paraplegia | 3 |
| Intracranial abscess | 2 |
| Cranial nerve trauma | 2 |
| Myotonic dystrophy | 2 |
| Spinal muscular atrophy | 2 |
| Guillain-Barré syndrome | 1 |
| Wilson disease | 1 |
| Acute disseminated encephalomyelitis | 0.6 |
| Dystonia musculorum deformans | 0.3 |
| Primary malignant cord tumor | 0.1 |
* Approximate point prevalence rates per 100,000 population, all ages.
† Cited rate is 10% of actual rate, as a proportion of patients likely to need care by a physician competent in neurology.
Modified from Kurtzke, J.F., 1982. The current neurologic burden of illness and injury in the United States. Neurology 32, 1207-1214; and from Kurtzke, J.F., Kurland, L.T., 1983. The epidemiology of neurologic disease, In: Baker A.B., Baker, L.H. (Eds.), Clinical Neurology, vol. 4. Harper & Row, Philadelphia.
Neurological practice, of course, varies widely among countries and even within the United States. The concept of the neurologist as a physician directly responsible for both acute and chronic care of patients with neurological diseases has evolved only over the last 3 decades in the United States. But such responsibilities, as well as provisions for continuity of care, are explicit statements in the current special requirements for residency training programs in neurology and child neurology. Regardless of the type of practice a given country deems appropriate for neurologists, patients with neurological disease will continue to require care. The data in Tables 39.2 through 39.5 could therefore well serve as at least a basis for rational allocation of available resources for teaching, research, and care of patients with neurological disorders in any country.
Albers G.W., Caplan L.R., Easton J.D., et al. Transient ischemic attack—proposal for a new definition. N Engl J Med. 2002;347:1713-1716.
Ahlbom A., Feychting M., Green A., et al. Epidemiologic evidence on mobile phones and tumor risk: a review. Epidemiology. 2009;20(5):639-652.
Andrews D.W., Scott C.B., Sperduto P.W., et al. Whole brain radiation therapy with or without stereotactic radiosurgery boost for patients with one to three brain metastases: phase III results of the RTOG 9508 randomised trial. Lancet. 2004;363:1665-1672.
Ayala C., Greenlund K.J., Croft J.B., et al. Racial/ethnic disparities in mortality by stroke subtype in the United States, 1995-1998. Am J Epidemiol. 2001;154:1057-1063.
Banerjee P.N., Filippi D., Hauser A.W. The descriptive epidemiology of epilepsy–a review. Epilepsy Res. 2009;85(1):31-45.
Baranzini S.E., Mudge J., van Velkinburgh J.C., et al. Genome, epigenome and RNA sequences of monozygotic twins discordant for multiple sclerosis. Nature. 2010;464(7293):1351-1356.
Barnholtz-Sloan J.S., Sloan A.E., Davis F.G., et al. Incidence proportions of brain metastases in patients diagnosed (1973 to 2001) in the Metropolitan Detroit Cancer Surveillance System. J Clin Oncol. 2004;22:2865-2872.
Brenner A.V., Linet M.S., Shapiro W.R., et al. Season of birth and risk of brain tumors in adults. Neurology. 2004;63:276-281.
Brodt H.R., Kamps B.S., Gute P., et al. Changing incidence of AIDS-defining illnesses in the era of antiretroviral combination therapy. AIDS. 1997;11:1731-1738.
Brooks D.R., Mucci L.A., Hatch E.E., et al. Maternal smoking during pregnancy and risk of brain tumors in the offspring. A prospective study of 1.4 million Swedish births. Cancer Causes Control. 2004;15:997-1005.
Buchacz K., Baker R.K., Moorman A.C., et al. Rates of hospitalizations and associated diagnoses in a large multisite cohort of HIV patients in the United States, 1994-2005. AIDS. 2008;22(11):1345-1354.
CBTRUS. 2009-2010 CBTRUS Statistical Report: primary brain and central nervous system tumors diagnosed in the United States in 2004-2006. Hinsdale, IL: Source: Central Brain Tumor Registry of the United States; 2010. Available at www.cbtrus.org Accessed July 2010
Centers for Disease Control and Prevention (CDC). Update: trends in AIDS incidence United States, 1996. MMWR Morb Mortal Wkly Rep. 1997;46:861-867.
Centers for Disease Control and Prevention (CDC). Regional and racial differences in prevalence of stroke 23 states and District of Columbia, 2003. MMWR Morb Mortal Wkly Rep. 2005;54:481-484.
Centers for Disease Control and Prevention (CDC). West Nile virus activity–United States, 2009. MMWR Morb Mortal Wkly Rep. 2010;59(25):769-772.
Crum N.F., Riffenburgh R.H., Wegner S., et al. Comparisons of causes of death and mortality rates among HIV-infected persons: analysis of the pre-, early, and late HAART (highly active antiretroviral therapy) eras. J Acquir Immune Defic Syndr. 2006;41:194-200.
Davis F.G., Kupelian V., Freels S., et al. Prevalence estimates for primary brain tumors in the United States by behavior and major histology groups. Neurooncol. 2001;3:152-158.
DeLorenzo R.J., Hauser W.A., Towne A.R., et al. A prospective, population-based epidemiologic study of status epilepticus in Richmond, Virginia. Neurology. 1996;46:1029-1035.
Diem-Zangerl A., Seppi K., Wenning G.K., et al. Mortality in Parkinson’s disease: a 20-year follow-up study. Mov Disord. 2009;24(6):819-825.
Driver J.A., Kurth T., Buring J.E., et al. Parkinson disease and risk of mortality: a prospective comorbidity-matched cohort study. Neurology. 2008;70(16 Pt 2):1423-1430.
Everitt A.D., Sander J.W. Classification of the epilepsies: time for a change? A critical review of the International Classification of the Epilepsies and Epileptic Syndromes (ICEES) and its usefulness in clinical practice and epidemiological studies of epilepsy. Eur Neurol. 1999;42:1-10. Part 1
Feltbower R.G., Picton S., Bridges L.R., et al. Epidemiology of central nervous system tumors in children and young adults (0-29 years), Yorkshire, United Kingdom. Pediatr Hematol Oncol. 2004;21:647-660.
Garcia H.H., Del Brutto O.H. Neurocysticercosis: updated concepts about an old disease. Lancet Neurol. 2005;4(10):653-661.
Gurney J., Kadan-Lottick N. Brain and other central nervous system tumors: rates, trends, and epidemiology. Curr Opin Oncol. 2001;13:160-166.
Hall W.A., Djalilian H.R., Nussbaum E.S., et al. Long-term survival with metastatic cancer to the brain. Med Oncol. 2000;17:279-286.
Han M.K., Huh Y, Lee S.B., et al. Prevalence of stroke and transient ischemic attack in Korean elders: findings from the Korean Longitudinal Study on Health and Aging (KLoSHA). Stroke. 2009;40(3):966-969.
Harrison M.J.G., McArthur J.C. AIDS and Neurology. New York: Churchill Livingstone; 1995.
Hegi M.E., Diserens A.C., Gorlia T., et al. MGMT gene silencing and benefit from temozolomide in glioblastoma. N Engl J Med. 2005;352:997-1003.
Hitiris N., Mohanraj R., Norrie J., et al. Mortality in epilepsy. Epilepsy Behav. 2007;10(3):363-376.
Howard G., Cushman M., Prineas R.J., et al. Advancing the hypothesis that geographic variations in risk factors contribute relatively little to observed geographic variations in heart disease and stroke mortality. Prev Med. 2009;49(2-3):129-132.
Howard G., Howard V.J., Katholi C., et al. Decline in US stroke mortality: an analysis of temporal patterns by sex, race, and geographic region. Stroke. 2001;32(10):2213-2220.
Heuschmann P.U., Di Carlo A., Bejot Y., et al. Incidence of stroke in Europe at the beginning of the 21st century. Stroke. 2009;40(5):1557-1563.
Klee A.L., Maidin B., Edwin B., et al. Long-term prognosis for clinical West Nile virus infection. Emerg Infect Dis. 2004;10:1405-1411.
Kleindorfer D.O., Khoury J., Moomaw C.J., et al. Stroke incidence is decreasing in whites but not in blacks: a population-based estimate of temporal trends in stroke incidence from the Greater Cincinnati/Northern Kentucky Stroke Study. Stroke. 2010;41(7):1326-1331.
Koch-Henriksen N., Bronnum-Hansen H., Stenager E. Underlying cause of death in Danish patients with multiple sclerosis: results from the Danish Multiple Sclerosis Registry. J Neurol Neurosurg Psychiatry. 1998;65:56-59.
Kurtzke J.F. Epidemiology and etiology of multiple sclerosis. Phys Med Rehabil Clin North Am. 2005;16:327-349.
Kurtzke J.F., Delasnerie-Laupretre N., Wallin M.T. Multiple sclerosis in North African migrants to France. Acta Neurol Scand. 1998;98:302-309.
Kurtzke J.F., Heltberg A. Multiple sclerosis in the Faroe Islands. An epitome. J Clin Epidemiol. 2001;54:1-22.
Lees A.J., Hardy J., Revesz T. Parkinson’s disease. Lancet. 2009;373(9680):2055-2066.
Linder J., Stenlund H., Forsgren L. Incidence of Parkinson’s disease and parkinsonism in northern Sweden: a population-based study. Mov Disord. 2010;25(3):341-348.
Llorca J., Guerrero-Alonso P., Prieto-Salceda D. Mortality trends of multiple sclerosis in Spain, 1951-1997: an age-period–cohort analysis. Neuroepidemiology. 2005;24:129-134.
Louis E.D., Ferreira J.J. How common is the most common adult movement disorder? Update on the worldwide prevalence of essential tremor. Mov Disord. 2010;25(5):534-541.
McLendon R.E., Halperin E.C. Is the long-term survival of patients with intracranial glioblastoma multiforme overstated? Cancer. 2003;98:1745-1748.
Miniño A.M., Xu J., Kochanek K.D., et al. Death in the United States, 2007. NCHS Data Brief. 2009;26:1-8.
Muntner P., Garrett E., Klag M.J., Coresh J. Trends in stroke prevalence between 1973 and 1991 in the U.S. population 25 to 74 years of age. Stroke. 2002;33:1209-1213.
Oksenberg J.R., Baranzini S.E., Sawcer S., et al. The genetics of multiple sclerosis: SNPs to pathways to pathogenesis. Nat Rev Genet. 2008;9(7):516-526.
Opeskin K., Berkovic S.F. Risk factors for sudden unexpected death in epilepsy: a controlled prospective study based on coroners cases. Seizure. 2003;12:456-464.
Ovbiagele B., Kidwell C.S., Saver J.L. Epidemiological impact in the United States of a tissue-based definition of transient ischemic attack. Stroke. 2003;34:919-924.
Parker S.L., Tong T., Bolden S., et al. Cancer statistics, 1997. CA Cancer J Clin. 1997;47:5-27.
Preston-Martin S., Pogoda J.M., Mueller B.A., et al. Results from an international case-control study of childhood brain tumors: the role of prenatal vitamin supplementation. Environ Health Perspect. 1998;106(Suppl. 3):887-892.
Price R.W. Neurological complications of HIV infection. Lancet. 1996;348:445-452.
Pugliatti M., Rosati G., Carton H., et al. The epidemiology of multiple sclerosis in Europe. Eur J Neurol. 2006;13:700-722.
Ries E.M., Kosary C.L., Hankey B.F., et al. SEER Cancer Statistics Review, 1975-2002. Bethesda, MD: National Cancer Institute, 2005. Available at http://seer.cancer.gov/csr/1975_2002/ based on November 2004 SEER data submission, posted to the SEER website 2005
Rocca W.A., Bower J.H., McDonnell S.K., et al. Time trends in the incidence of parkinsonism in Olmsted County, Minnesota. Neurology. 2001;57(3):462-467.
Rothwell P.M., Coull A.J., Giles M.F., et al. Change in stroke incidence, mortality, case-fatality, severity, and risk factors in Oxfordshire, UK, from 1981 to 2004 (Oxford Vascular Study). Lancet. 2004;363:1925-1933.
Sarti C., Stegmayr B., Tolonen H., et al. Are changes in mortality from stroke caused by changes in stroke event rates or case fatality? Results from the WHO MONICA Project. Stroke. 2003;34:1833-1840.
Shackleton D.P., Westendorp R.G., Kasteleijn-Nolst Trenite D.G., et al. Survival of patients with epilepsy: an estimate of the mortality risk. Epilepsia. 2002;43(4):445-450.
Smestad C., Sandvik L., Celius E.G. Excess mortality and cause of death in a cohort of Norwegian multiple sclerosis patients. Mult Scler. 2009;15(11):1263-1270.
Tran B., Rosenthal M.A. Survival comparison between glioblastoma multiforme and other incurable cancers. J Clin Neurosci. 2010;17(4):417-421.
Tyler K.L. Emerging viral infections of the central nervous system: part 1. Arch Neurol. 2009;66:939-948.
UNAIDS. Joint United Nations Programme on HIV/AIDS, 2009 AIDS Epidemic Update, UN, Geneva. Available at www.unaids.org, 2010. Accessed July 2010
van Drimmelen-Krabbe J.J., Bradley W.G., Orgogozo J.M., et al. The application of the International Statistical Classification of Diseases to neurology: ICD-10 NA. J Neurol Sci. 1998;161:2-9.
Wallin M.T., Kurtzke J.F. Neurocysticercosis in the United States: review of an important emerging infection. Neurology. 2004;63:1559-1564.
Wallin M.T., Page W.F., Kurtzke J.F. Epidemiology of multiple sclerosis in U.S. veterans. VIII. Long-term survival after onset of multiple sclerosis. Brain. 2000;123:1677-1687. Part 8
Wallin M.T., Page W.F., Kurtzke J.F. Multiple sclerosis in U.S. veterans of the Vietnam era and later military service: race, sex, and geography. Ann Neurol. 2004;55:65-71.
Wickremaratchi M.M., Perera D., O’Loghlen C., et al. Prevalence and age of onset of Parkinson’s disease in Cardiff: a community based cross sectional study and meta-analysis. J Neurol Neurosurg Psychiatry. 2009;80(7):805-807.
World Health Organization. Application of the International Classification of Diseases to Neurology (ICD10NA), second ed. Geneva: World Health Association; 1997.