Chapter 49 Monitoring the Airway and Pulmonary Function
I Introduction
Although most monitoring devices provide useful information, some are easier to use than others. Some data suggest that the devices that are easiest to use and for which the data are easiest to interpret are the most clinically useful devices.1 In many situations, the information provided by monitors that is thought to be straightforward requires a comprehensive understanding of its physiologic basis. For example, although the pulse oximeter provides a straightforward measurement of oxygen (O2) saturation, which can be easily interpreted in most cases, the information in many clinical situations does not accurately reflect the O2 saturation (in the presence of carbon monoxide) or O2 tension (when the patient is severely acidotic or alkalotic).2,3 Interpretation requires an understanding of the patient’s physiology and the method by which the monitor reports the data. The same caveats are true for almost every monitor that is used clinically to guide diagnosis, management, and response to therapy. The clinician must know what monitors are available and when the information provided by the monitor is clinically useful and must know how to interpret the data and understand the limitations of each device.
This chapter describes techniques for monitoring and evaluating the airway, gas exchange, and pulmonary function. It provides an overview of the monitors used to assess the patient and describes specific monitors that are useful in assessing the appropriateness of mechanical ventilatory support. Because the modes of ventilation have changed considerably and the options for providing mandatory and spontaneously initiated modes of ventilation have become available, monitoring pulmonary function and the patient-ventilator interface has become increasingly important.4 The benefits and limitations of each monitoring technique are discussed.
II Monitoring the Airway
A Non-intubated Patient
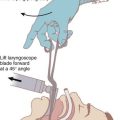
Monitoring the airway is a critical component of clinical assessment for any patient requiring sedation, analgesia, or ventilatory support. As a result of underlying anatomic abnormalities, physiologic alterations in the level of consciousness, edema of the airway, or administration of respiratory depressants, a patient can develop upper airway dysfunction with life-threatening consequences. Assessment of the airway should include the clinical evaluation that is routinely performed by the anesthesiologist before initiating anesthesia or by the critical care practitioner before performing endotracheal intubation. In many cases, the assessment must be performed rapidly under challenging circumstances, but if possible, the evaluation should include a brief and focused history and physical examination. The patient should be asked about snoring or episodes of airway obstruction during sleep; previous experiences with endotracheal intubation, including difficult intubation, hoarseness after airway manipulation, and hoarseness with exercise; previous lengthy endotracheal intubation; and a history of tracheostomy or tracheal abnormalities, including stenosis or tracheomalacia. Patients with rheumatoid arthritis should be questioned about upper airway problems, particularly those related to potential arthritic changes in the cricoarytenoid joints. Patients who have had previous neck or mediastinal surgery should be carefully evaluated for evidence of unilateral or bilateral vocal cord dysfunction. For patients unable to provide a history, discussion with family members or the nurse caring for the patient, a review of the medical record, or direct observation of the airway and ventilatory pattern while preparing equipment for intubation or other interventions can provide useful information to guide management decisions. In selected patients, a lateral neck radiograph can provide useful information about the upper airway and presence of masses in the airway or epiglottic edema, although in most cases, upper airway compromise necessitates emergent intubation without the benefit of a radiologic evaluation.5
B During Endotracheal Intubation
Although a variety of masks and other devices are available to facilitate ventilatory support without tracheal instrumentation, the patient requiring airway protection or positive-pressure ventilation usually undergoes endotracheal intubation through transoral or transnasal routes or through a surgical airway (see Chapter 17). When endotracheal intubation is required, confirmation of correct placement is essential. The most reliable method to assess the location of an artificial airway within the trachea is direct visualization of the tube passing through the vocal cords at the time of intubation. Physical examination is also important to ensure that both lungs are being ventilated after placement of the airway. Auscultation over the lung fields (particularly the apices of the lungs) and stomach should routinely be performed to assess ETT placement. When the ETT is within the trachea, equal breath sounds should be heard over both lung fields while listening over the apices. Auscultation over the upper lung fields minimizes the likelihood of hearing sounds transmitted from the stomach. For most adult patients, if the ETT is located within the trachea, no breath sounds should be heard over the stomach. Unfortunately, auscultation can be misleading. Occasionally, particularly in children, breath sounds are transmitted to the stomach even when the ETT is properly positioned. For patients with extensive parenchymal lung disease, effusions, or endobronchial lesions, breath sounds may not be heard equally over both lung fields even when the ETT is properly positioned within the trachea.
Other clinical signs can be useful in determining whether the ETT is within the trachea. They include identifying mist within the lumen of the ETT during exhalation, palpation of the cuff of the ETT in the suprasternal notch, and the normal “feel” of a reservoir bag during manual ventilation. Despite the clinical usefulness of these methods, none is infallible, and false-positive and false-negative evaluations have been reported.6
A more reliable monitor for confirming that the artificial airway is within the trachea is identification of carbon dioxide (CO2) in exhaled gas. If the airway is within the trachea and the patient is ventilating spontaneously or receiving positive-pressure ventilation, CO2 should be eliminated by the lungs. The presence of CO2 or measurement of CO2 concentration can be used to determine the location of the ETT. Several devices are available to monitor CO2 in expired gases. In the OR, CO2 can be measured using an infrared device,7 Raman effect scattering, or mass spectrometry. In the ICU, emergency department (ED), or other settings, including out-of-hospital locations, colorimetric techniques can successfully estimate the CO2 concentration, or infrared devices can accurately measure the CO2 concentration in expired gases.8,9 As a result of the ease of use and widespread availability of these devices, the documentation of CO2 in exhaled gas after placement of an artificial airway (i.e., capnography) has become the standard of care in anesthesia practice and is routinely used during emergency airway management in many hospitals and emergency settings. A detailed description of capnography is provided on page 1011. Unfortunately, even these devices can provide misleading information, and the information they provide is not foolproof.10,11
Capnography is a useful monitor to confirm correct placement of the ETT, but it is not uniformly reliable and can be misleading.12 For example, when the patient has been ventilated by mask before intubation, CO2-containing gas may remain in the stomach. A capnograph may indicate the presence of CO2 in the expired gas, but it does not reflect CO2 from the airway. This problem is even more common when capnography is used to monitor the patient who has recently received bicarbonate-containing solutions or has been drinking CO2-containing beverages before placement of the artificial airway. In these situations, CO2 is eliminated from the stomach during the first few breaths provided through the ETT. The presence of CO2 from exhaled gas therefore should be monitored for at least a few breaths. If CO2 continues to be eliminated through the ETT after four or five breaths, endotracheal placement of the tube can be ensured.11 Another problem with capnography when used to confirm ETT placement is that CO2 elimination occurs only if the patient has sufficient cardiac output to deliver CO2 to the lungs. If the patient has suffered a cardiac arrest and cardiac output is very low or absent, no CO2 is delivered to the lung. The capnogram reveals neither a digital display of CO2 from exhaled gas nor, if the CO2 waveform is being monitored, a capnographic display, even when the ETT is within the trachea.13–16 During cardiopulmonary resuscitation, the presence of CO2 in exhaled gas provides confirmation that the cardiac output has improved and CO2 is being eliminated from the lungs. Sometimes, even when cardiac output is inadequate, chest compressions are effective at eliminating enough CO2 from the lungs to confirm ETT placement.
Another technique to confirm placement of the ETT in the trachea at the time of intubation is use of a self-inflating bulb. This technique was advocated as an easy way to confirm the proper position of the ETT in out-of-hospital intubations. The technique uses a bulb that is applied to the ETT. Self-inflation of the bulb within 4 seconds determines that the ETT is in proper position. Although the technique has some proponents, most studies are unable to confirm that this is a reliable method to verify ETT placement.17
When the position of the ETT within the trachea has been confirmed, it is important to assess the exact location of the tube within the trachea to avoid placement too proximal (increasing the risk of accidental extubation) or too distal (endobronchial). Incorrect positioning of the ETT has been associated with several complications, including pneumothorax and death.18 The location of the ETT should be confirmed at the time of placement and be regularly assessed while the artificial airway remains in place, because the position can change even after the ETT is secured. Flexion of the neck moves the ETT toward the carina, and extension moves the tube up toward the vocal cords. In adult patients, flexion and extension of the head changes the position of the ETT tip by as much as 2 cm.18 As the ETT softens or the patient manipulates the ETT with the tongue, the tube position changes. As a result of changes in ETT position, patients are at risk for self-extubation, even when the tube is secured at the mouth and the extremities are restrained.
Several techniques can be used to assess the correct position of the ETT within the trachea. For example, placement of the ETT to a predetermined distance has been advocated as a way to minimize the likelihood of endobronchial intubation. Owen and Cheney suggested that the tube be placed to a depth of 21 cm in women and 23 cm in men when referenced to the anterior alveolar ridge or the front teeth. In their study using this approach, endobronchial intubation was avoided.19 Subsequent studies have not confirmed that this technique prevents endobronchial intubation in critically ill adults or that it is predictive of the relationship between the position of the ETT at the teeth and the tube’s position relative to the carina.20–22
Fiberoptic bronchoscopy has been used to determine proper positioning of the ETT.23 When a flexible fiberoptic bronchoscope is readily available, it can be used to confirm the location of the tip of the ETT within the trachea.24 Because many ORs and ICUs have “difficult airway carts” readily available, the use of the flexible fiberoptic bronchoscope to assist with intubation and confirm the tubes’s location has become more common. The technique is useful, although it is not without some risk. Insertion of the flexible fiberoptic bronchoscope reduces the effective cross-sectional area of the ETT, potentially compromising ventilation and oxygenation.25 Peak inspiratory pressure increases. Partial obstruction of the ETT results in an increase in airway resistance, which may lead to the development of occult end-expiratory pressure and increase the risk of pneumothorax or cause hemodynamic compromise.26 Despite these limitations, in experienced hands, the assessment can be completed rapidly and without complications. It is a particularly useful way of documenting the location of the ETT within the trachea in the patient for whom the specific location of the tube is critically important, such as one with abnormal tracheal anatomy, the patient at risk for obstruction of the right upper lobe bronchus, or one with specific needs related to the planned surgical procedure.
Capnography can be used to identify endobronchial migration of an ETT.27 With distal migration of the tube, the EtCO2 falls. The change is usually associated with an increase in peak inspiratory pressure. These changes, although not always reliable, can provide early evidence of ETT migration because the CO2 changes precede a change in arterial blood gases (ABGs) or other signs of displacement.
Probably the most commonly used method to assess the location of the ETT within the trachea is the routine post-intubation chest radiograph. The distance of the ETT from the carina can be measured from a portable anteroposterior radiograph obtained at the bedside. Although many clinicians have questioned whether the cost of chest radiography warrants its routine use for documentation of ETT placement, it remains the most useful and reliable method to determine the appropriate depth of the ETT within the trachea.20–22
One special clinical situation warrants additional monitoring of the artificial airway. Some patients require placement of a double-lumen tube to facilitate a unilateral surgical procedure of the lung, to provide differential lung ventilation, or to protect one lung from contamination with blood or infected secretions from the other lung. In these cases, proper placement of the double-lumen tube must be ensured. Physical examination alone and other monitoring techniques are usually insufficient to confirm proper positioning. Fiberoptic evaluation is most often required to confirm the ETT position after initial placement and to reevaluate placement after the patient is repositioned for a surgical procedure or while requiring differential lung ventilation in the ICU.28 Direct visualization of the tip of the double-lumen tube and the relationship between the tracheal and bronchial lumens ensures that the tube is in the proper position and that the two lungs are isolated. Other techniques can be used to diagnose malpositioning of double-lumen tubes, although there are few studies that confirm their value. Capnography, which has been useful in identifying endobronchial migration of a single-lumen ETT,27 may provide information about the location of a double-lumen tube, particularly if only one lung is being ventilated at the time of evaluation. Spirometry, which can be obtained from in-line monitoring devices added to the anesthesia circuit or monitoring techniques provided by critical care ventilators, can also provide early detection of double-lumen tube malpositioning.29 As the ETT migrates, expiratory flow obstruction, as can occur with malpositioning of the tube, can be detected as a change in the shape of the expiratory limb of the flow-volume loop. Inspiratory obstruction is best diagnosed by a change in the pressure-volume loop.
C During Weaning
Careful evaluation and monitoring of the patient’s airway are required before and immediately after tracheal extubation. After the patient is weaned from ventilatory support and is being prepared for extubation, the patient’s ability to protect and maintain the airway after tracheal extubation must be assessed, although it can be difficult to do so with the ETT in place. Various clinical criteria have been used to determine whether the intubated patient can protect the airway. The most common criteria are a normal gag response and a strong cough. If the patient gags when the back of the throat is stimulated and coughs during suctioning, most clinicians feel confident that the patient will be able to prevent aspiration after extubation. These criteria, however, have never been subjected to scientific evaluation. Some patients who have a poor gag or cough with the ETT in place are able to handle secretions and to cough effectively after endotracheal extubation. Others, who seem to have a satisfactory cough or gag before extubation, are still unable to protect the airway when extubated. The problem with airway protection may become clinically apparent only when the patient begins to eat, because pharyngeal function may remain abnormal for several hours to days after endotracheal intubation.30 Nonetheless, these criteria continue to be the most commonly used to determine whether the patient can be extubated safely.
Many patients cannot breathe around the occluded ETT because of the increased resistance with the tube in place. As a result, alternative methods have been suggested. The leak test assesses the airway pressure required for a leak to develop around the cuff when positive-pressure ventilation is applied through the ETT with the cuff deflated.31 Although the specific pressure at which the leak develops has not been well correlated with successful extubation, some clinicians require that a leak occur when the airway pressure is low, usually less than 15 cm H2O, before extubation. Unfortunately, some studies, including a systematic review of the literature that included more than 2300 patients, have been unable to confirm the value of the leak test at all nor a specific leak pressure or volume above which extubation is contraindicated.32 If the airway pressure required to identify a leak during positive-pressure inspiration is high, probably 20 to 25 cm H2O, the patient may have sufficient upper airway edema to warrant leaving the ETT in place until the edema resolves.
D After Tracheal Decannulation
Vocal cord function can be impaired after surgery. Postoperative vocal cord dysfunction can be caused by direct trauma at the time of endotracheal intubation or edema. Recurrent laryngeal nerve dysfunction can also occur, most commonly caused by nerve retraction or transection during surgery or direct trauma from high intratracheal pressure transmitted from the ETT cuff.33 Unfortunately, it is difficult to assess vocal cord function with the ETT in place. The evaluation usually requires that the ETT be removed (see Chapter 50). After extubation, evaluation of laryngeal and vocal cord function can be assessed fiberoptically. In some patients, evaluation of the airway can be performed by inserting the fiberoptic device through the ETT and then removing the tube over the fiberoptic shaft to allow visualization of the airway. Assessment requires that the patient breathe spontaneously, so that the movement of the vocal cords can be visualized. Although the assessment can be performed in the ICU, the more common approach is to perform the evaluation under more controlled conditions in the OR, where all of the emergency airway and surgical equipment is available to secure the airway. Evaluation and extubation can be performed after the patient is anesthetized with a volatile anesthetic agent and is breathing spontaneously. If severe stridor or airway obstruction develops with removal of the ETT, the patient can be reintubated or have a tracheostomy performed for long-term airway maintenance (see also Chapter 31). In most cases, even when there is injury to a recurrent laryngeal nerve or one vocal cord, the patient is able to breathe normally without stridor, unless the patient’s inspiratory flows are excessive. The greater risk exists for the patient who suffers bilateral vocal cord palsies. While still sedated, the patient may not have stridor or evidence of airway obstruction. However, as the patient awakens and inspiratory flows increase, the stridor becomes obvious and usually requires emergent endotracheal intubation or, more commonly, tracheostomy.
III Monitoring Respiratory Function
A Clinical Assessment
The clinical examination remains one of the most important and valuable methods to monitor a patient’s respiratory status. Too often, attention is placed on technologically sophisticated monitoring devices, and the physical examination is cursory, or the clinical findings are undervalued. Nonetheless, much information about actual or potential airway problems and abnormalities in pulmonary mechanical function or gas exchange can be obtained from a carefully performed and thorough examination. Many of the early signs of respiratory failure are apparent on physical assessment (see Chapter 9) before the abnormalities are apparent by other means. For example, the respiratory rate provides important information about respiratory reserve, dead space, and respiratory drive, particularly when interpreted in conjunction with arterial carbon dioxide tension (PaCO2). Tachypnea is frequently the earliest sign of impending respiratory failure. The patient’s pattern of breathing should be evaluated. Subtle changes in the respiratory rate, VT, and pattern of breathing may provide an early indication of increased work of breathing (as may occur with reduced lung compliance, increased airway resistance, or phrenic nerve dysfunction) or altered ventilatory drive. Although inspiratory flow and minute ventilation ( ) are difficult to quantify by clinical examination alone, respiratory distress often manifests as the patient attempts to increase alveolar ventilation by taking larger, more rapid inspirations.
Upper airway obstruction, as may occur after manipulation of the airway, in association with epiglottitis or a mass in or around the airway can be assessed by careful clinical evaluation. Nasal flaring, stridor, and chest wall movement in the absence of airflow suggest upper airway obstruction. If the patient is making respiratory efforts and has abdominal expansion during inspiration without chest excursions, he or she has upper airway obstruction and may require manipulation of the upper airway, including a jaw thrust, initiation of positive-pressure ventilation support with continuous positive airway pressure (CPAP) or bi-level positive airway pressure (BiPAP), and endotracheal intubation. When the patient presents with stridor, the physical evaluation is also useful in identifying the location of airway compromise. When the stridor occurs primarily during inspiration, it is caused by extrathoracic obstruction; when it occurs during exhalation, it reflects an intrathoracic obstruction. If the stridor occurs during both inspiration and exhalation, the obstruction is fixed, such as may occur with tracheal stenosis. The fixed obstruction is rarely amenable to conservative treatment, and endotracheal intubation is most likely to be required until a more definitive therapy can be provided. In selected patients, helium therapy can be used as a temporizing intervention until a more definitive treatment can be provided.34
Respiratory dyssynchrony is an early and critical indicator of respiratory muscle fatigue and impending respiratory failure.35,36 Respiratory dyssynchrony (when the patient has no evidence of upper airway obstruction) is identified by assessing chest wall and abdominal movement during normal tidal breathing. A paradoxical respiratory pattern suggests that the patient may have inadequate muscle strength to sustain spontaneous respiration and that positive-pressure ventilation support may be required. Tobin and colleagues found that respiratory muscle dyssynchrony could occur before the development of fatigue,37,38 although fatigue of the respiratory muscles did not always result in the development of dyssynchrony.39
Clinical observation of the patient should include careful assessment of the respiratory muscles as a way of assessing the patient’s respiratory reserve. Use of accessory muscles, including the sternocleidomastoid and scalene muscles, is commonly seen in patients with long-standing respiratory failure associated with chronic obstructive pulmonary disease (COPD).40 The position of the diaphragm and diaphragmatic motion are also affected in patients with severe COPD. The patient who relies on accessory muscles and has minimal diaphragmatic excursion does not have any respiratory reserve. The patient is at risk for recurrent respiratory failure and presents a significant challenge during weaning when mechanical ventilatory support is required.
B Radiologic Evaluation
The chest radiograph is another important monitor of the pulmonary status, although it represents a static picture of the clinical situation. The chest radiograph can confirm proper placement of central venous and other catheters, the ETT,22 and pacemakers. Routine portable chest radiography usually provides evidence of pulmonary infiltrates and pulmonary edema. Radiographic findings that suggest pulmonary edema include bronchial cuffing, perihilar pulmonary infiltrates, and Kerley B lines. Although these findings are helpful, in many critically ill patients, differentiation of diffuse, bilateral infiltrates caused by infection from pulmonary edema can be difficult. When underlying pulmonary diseases such as COPD coexist with acute pulmonary edema, the classic bilateral, fluffy pulmonary infiltrates may not be present. In these circumstances, the x-ray findings must be correlated with other clinical data to explain the radiographic findings.
 ) scans have been used to detect pulmonary emboli, although the
  scans are often inadequate or impossible when assessing a mechanically ventilated, critically ill patient for possible pulmonary emboli. For the ICU patient with suspected pulmonary emboli, pulmonary arteriograms or, more commonly, spiral CT scans are performed because they can be completed quickly and provide better diagnostic information than the
  scan alone.
C Assessment of Gas Exchange
One of the most important goals in monitoring pulmonary function is to determine whether the lung is able to sustain satisfactory oxygenation and ventilation. Invasive and noninvasive monitors of gas exchange are used routinely. Although noninvasive devices are useful and provide important information about oxygenation and ventilation, the ABG determination remains the most frequently used monitor of oxygenation, ventilation, and acid-base abnormalities.41
1 Blood Gas Monitoring
 ), oxygen saturation (Sa
 mismatch, shunt, or inadequate cardiac output (i.e., low mixed venous oxygen tension [
 ]). Documentation of an acceptable Pa
 is appropriate and is not an indication of respiratory failure. Similarly, the patient who has a significant metabolic acidosis should increase
  to normalize the pH. In interpreting whether the patient is ventilating appropriately and has a normal ventilatory drive, the Pa
 is small, and
  can be used as an estimate of Pa
 cannot be used as a substitute for Pa
Although monitoring gas exchange using ABG measurements is important, the technique has some limitations. Blood gas monitoring is invasive, and samples must be drawn from an indwelling arterial catheter or an arterial puncture. Frequent blood gas sampling can result in significant blood loss, which may be a clinical problem for any unstable patient, particularly the pediatric patient or anemic adult. Placement and maintenance of an arterial catheter have associated risks, including hemorrhage, hand ischemia, arterial thrombosis and embolism, infection,42,43 and development of a radial artery aneurysm.44
Blood gas monitoring usually is obtained by intermittent sampling from an arterial puncture or indwelling arterial catheter. When a patient’s respiratory status is unstable or is rapidly evolving or when frequent adjustments in ventilatory support are required, intermittent monitoring may be insufficient. In these clinical situations, continuous monitoring is preferable. Continuous intra-atrial blood gas monitors can provide useful real-time data regarding gas exchange and acid-base status,45,46 although the clinical utility of these monitors has not been validated, and the technology is not widely available.47,48 These monitors use fluorescence-based probes placed through an arterial catheter to provide a continuous assessment of PaO2, PaCO2, and pH. The information obtained from these instruments should provide more immediate information about changes in gas exchange or acid-base balance. However, the probes and monitors are more expensive than intermittent blood gas analysis and have not become routine monitors.
2 Noninvasive Monitoring
Assessment of gas exchange using noninvasive techniques has revolutionized clinical care, particularly for anesthesiologists and intensive care providers. Because clinical evaluation of gas exchange is unreliable and often a late sign of deterioration,49 noninvasive devices that continuously monitor oxygenation and ventilation are valuable tools. Several noninvasive methods are available for evaluating oxygenation and ventilation. The most commonly used devices include the pulse oximeter for monitoring oxygenation and the capnograph for evaluating ventilation.
a Pulse Oximetry
Pulse oximetry provides a rapid, continuous, and noninvasive estimation of the O2 saturation of hemoglobin in arterial blood, and it is used routinely to monitor clinical care involving airway management in the OR, ED, and ICU.50–53 It has become the standard monitor of oxygenation during administration of sedation for procedures and during general medical care.54–57 With routine use of this monitor, a high prevalence of clinically undetected hypoxemia in adults and children has been demonstrated.50,57–59 These episodes of desaturation may affect morbidity and mortality.60,61 With severe and sustained hypoxemia (i.e., oxygen saturation from pulse oximetry [SpO2] is less than 85% for more than 5 minutes), patients with known cardiac disease were twice as likely to have perioperative ischemia after noncardiac surgery.61 Among medical patients, those who experienced episodes of hypoxemia within the first 24 hours of hospitalization were three times more likely to die 4 to 7 months after discharge.60
It is logical to assume that the routine use of pulse oximetry has made caring for patients safer by increasing the detection of hypoxemia, better understanding its causes, and allowing more rapid and effective interventions to correct the pathophysiologic causes. Some clinicians have suggested that the early detection of arterial oxygen desaturation with the use of pulse oximetry may improve outcomes.61–64 Although clinical studies do not confirm this belief, they do not negate the presumed benefit of this monitoring tool.65–68 A systematic review of the Cochrane database found no evidence of an outcome benefit of the use of pulse oximetry in anesthesia practice.69 Despite the lack of good outcome data to document that value of pulse oximetry, its use is considered standard of care for critically ill patients and patients receiving moderate or deep sedation or anesthesia.
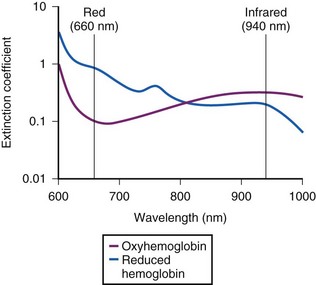
To measure the O2 saturation of hemoglobin in arterial blood, pulse oximetry uses two fundamental principles: the differential light absorption of oxyhemoglobin (O2Hb) and reduced hemoglobin (Hb) and the increase in light absorption produced by pulsatile blood flow compared with that of a background of connective tissue, skin, bone, and venous blood.56,70 The spectrophotometric principle that forms the basis for oximetry is the Lambert-Beer law (Equation 1), which allows determination of the concentration of an unknown solute in a solvent by light absorption.
 (1)
(1)I1 = intensity of the light out of the sample
I0 = intensity of the incident light
a = absorption coefficient of the substance
l = distance the light travels through the material (i.e., path length)
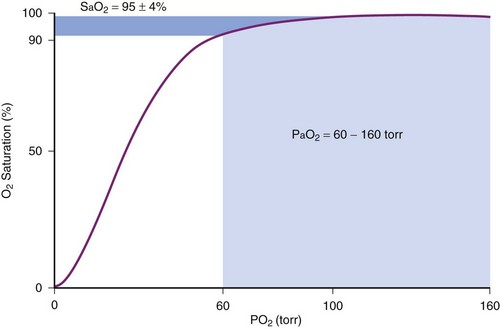
The commercially available pulse oximeters use light-emitting diodes (LEDs) that transmit light at specific wavelengths: 660 nm (red) and 940 nm (infrared). These wavelengths were selected because the absorption characteristics of O2Hb and reduced Hb are sufficiently different at these wavelengths to allow differentiation of O2Hb and Hb (Fig. 49-1).
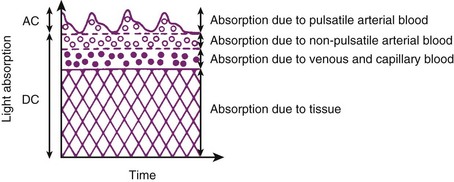
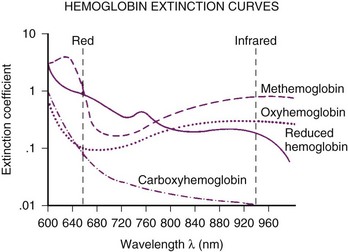
The pulse oximeter determines arterial saturation by timing the measurement to pulsations in the arterial system. During pulsatile flow, the vascular bed expands and contracts, creating a change in the light path length.51 These pulsations alter the quantity of light transmitted to the sensor and provide a plethysmographic waveform.71 This timing of the signal allows the pulse oximeter to differentiate arterial oxygen saturation from venous saturation on the basis of the ratio of pulsatile and baseline absorption of red and infrared light (Fig. 49-2).
 (2)
(2)The O2 saturation displayed by the pulse oximeter is empirically related to this calculated value on the basis of calibration curves derived for healthy, nonsmoking adult men breathing O2 at various concentrations. Most commercially available pulse oximeters are calibrated over the range of 70% to 100%. The accuracy of pulse oximetry in determining the SaO2 of Hb has been excellent over this range,51 with an error of ±3% to 4%.57
Although pulse oximetry has become a ubiquitous monitoring device, particularly to confirm adequacy of oxygenation during airway management, it has limitations. First, the measurement of O2 saturation does not provide a direct assessment of oxygen tension. Because of the shape of the oxygen-hemoglobin dissociation curve, at higher levels of oxygenation measurements of SpO2 are insensitive in detecting significant changes in PaO2 (Fig. 49-3). Second, the pulse oximeter is not accurate when oxygen saturation is less than 70%. The inaccuracy results from the limited range of O2 saturations used in the calibration process and the difficulty in obtaining reliable human data at these low oxygen saturations.71,72
The accuracy of pulse oximeters during hypoxemia has been extensively studied and reviewed.37,73–76 Most of these studies have been performed on healthy volunteers who had desaturation induced by breathing hypoxic gas mixtures for short periods. Pulse oximeters from different manufacturers varied in their accuracy during hypoxemia; the direction of error differs among these devices, with some overestimating and some underestimating true arterial O2 saturation. Some study results documented problems with the calibration curves and caused revision of the algorithms by the manufacturers.72–77 These modifications to the algorithms have improved performance of the oximeters.57
Other factors affect the performance of pulse oximeters. The response characteristics of pulse oximeters are clinically important, particularly in situations in which the saturation may be changing rapidly, as can occur during management of the difficult airway. Investigators have studied the response characteristics of pulse oximetry in clinical practice.72–77 West and colleagues studied five obese, nonsmoking men with sleep apnea syndrome.78 During spontaneous desaturation, the pulse oximeter underestimated the minimum SaO2, and during spontaneous resaturation, there was an overshoot of the maximum SpO2. The location of the probe also influences the response time for the pulse oximeter. Probes placed on the ear respond more quickly to sudden decrease in SaO2 than probes placed on a digit.75 The response time to changes in O2 saturation of the pulse oximeter also depends on heart rate. For fingertip sensors, as heart rate increases, the response to an acute change in saturation is faster; for ear or nasal probes, the relationship is reversed, and as heart rate increases, the response to changes in SaO2 is slower.78
Accuracy of the pulse oximeter is altered in several situations (Box 49-1). Excessive light, such as fluorescent or xenon arc surgical lights, bilirubin lights, and heating lamps, can cause falsely low or high SpO2 values.57,72,79 Covering the probe with an opaque material helps to eliminate this problem. Electrocautery devices can produce significant electrical interference, which results in improper functioning of the pulse oximeter.56 The infrared pulse waves used by neurosurgical image guidance systems interfere with the signal quality and O2 saturation detection by pulse oximetry.80 The use of aluminum foil as a shield was effective in restoring the accuracy of six brands of pulse oximeters when exposed to the infrared signal generated by a neuronavigation device.81 Misalignment of disposable pulse oximeter probes may cause falsely low O2 saturation to be displayed by pulse oximeters, even though the plethysmographic tracing is of excellent quality, and this can change anesthetic management.82 In 100 patients entering the postanesthesia care unit (PACU) at Massachusetts General Hospital, only 6 had perfect placement of the probes, and for the remaining 94, the average misalignment distance was 5.4 mm (range, 0 to 23 mm).82 In a single case report, a Massimo Signal Extraction Technology (Massimo SET; Irvine, CA) pulse oximeter using SatShare technology with a Datex-Ohmeda AS/3 monitor displayed an uninterrupted waveform and normal O2 saturation during asystole in a patient undergoing abdominal surgery.83
Motion of the probe, such as when a patient or caregiver moves the digit on which the oximeter probe is placed, can cause artifactual readings from the pulse oximeter. Vibration of the sensor delays the detection time for hypoxemia and causes spurious decreases in SpO2.84 Movement can result in errors of as much as 20%.85 In a large, prospective study, patients’ motion was the major reason for abandoning the use of a pulse oximeter in the PACU.86 In pediatric patients, 71% of all alarms were false.87 Attempts have been made to minimize the effect of motion by timing the measurement of SpO2 to the electrocardiogram (ECG). Pulse oximeters that possess ECG linkage and time the measurement of arterial saturation to the ECG have performed better during vibration than those without this feature.84 Although this ECG interface is helpful, it has not completely eliminated motion as a problem, particularly in very active or agitated patients. Another approach to decreasing the effect of patients’ motion on the accuracy of oximetric data has been to reject motion artifact retrospectively using changes in the plethysmographic waveform that immediately preceded the questionable event.85 This results in fewer detected episodes of false O2 desaturation, although at the price of missing true events.88
Several manufacturers have added technology designed to minimize motion artifact and to extract a more accurate (true) signal. The Masimo SET uses unique sensor designs and software algorithms to reduce the incidence of false alarms. When the performance of oximeters using this technology was compared in volunteers with that of the Nellcor N-3000 Symphony with improved low-signal performance (Oxismart) and the older Nellcor N-200, the oximeters using Masimo SET were superior in error and signal dropout rate.89 Baker and colleagues compared the functioning and accuracy of 20 pulse oximeter models in volunteers with hypoxemia during motion and found that the Masimo SET had the best overall performance.90 When used in the neonatal ICU, Masimo SET resulted in dramatically fewer false alarms and captured more true events than the Nellcor N-200.91 Oximeters using Masimo SET were more reliable in detecting bradycardia and hypoxemic episodes in patients in the neonatal ICU than the N-3000.92 This is evidence that more reliable data from oximetry can improve the process of care in a cost-effective manner. In adults after cardiac surgery, the use of more reliable oximeters (those with Masimo SET) compared with conventional oximeters resulted in a more rapid reduction in fraction of inspired oxygen (FIO2) and the need for fewer ABG determinations during mechanical ventilation.93 Petterson and colleagues have reviewed the various technologies used to prevent the effects of motion artifacts on the accuracy of pulse oximeters.94
Another problem with the pulse oximeter is its inability to differentiate oxyhemoglobin from other hemoglobins, such as methemoglobin and carboxyhemoglobin. An oximeter is able to differentiate only as many substances as the number of wavelengths of light it emits.56,77 Commercially available oximeters can detect only two types of hemoglobin, reduced and oxygenated (Hb and O2Hb). Pulse oximeters derive a functional saturation of hemoglobin, which is defined in Equation 3:
 (3)
(3) (4)
(4)When COHb or MetHb is present, the pulse oximeter does not provide a true measurement of oxygen saturation.95,96 The presence of COHb causes a false elevation in the SpO2 measurement.95 As shown in Figure 49-4, COHb has minimal light absorption at 940 nm, and at 660 nm, its absorption coefficient is almost identical to that of O2Hb. The pulse oximeter cannot differentiate COHb from O2Hb; it overestimates the O2Hb.95 The SpO2 displayed by the pulse oximeter approximates the sums of COHb and O2Hb. This problem with pulse oximeters is important to consider when assessing oxygenation in patients who have sustained smoke inhalation or patients who have smoked just before proposed airway management. COHb can also be present in long-term ICU patients because carbon monoxide (CO) is a metabolic product of heme metabolism.97,98 The influence of this potential endogenous source of CO on the accuracy of SpO2 in the critically ill patient requires further evaluation. In any case, when high CO levels are suspected, O2 saturation should be measured using a CO-oximeter rather than a pulse oximeter.
MetHb also interferes with pulse oximeter measurements.96,99 As MetHb levels exceed 30% to 35%, SpO2 becomes independent of the MetHb level, approaching 85%. This inaccuracy occurs because the MetHb absorption coefficient at 660 nm is almost identical to that of reduced hemoglobin, whereas at 940 nm, it is greater than that of other hemoglobins (see Fig. 49-4). The pulse oximeter therefore overestimates or underestimates the true SaO2, depending on the level of MetHb.77 Some causes of high MetHb levels include administration of nitrates, local anesthetics (e.g., lidocaine, benzocaine), metoclopramide, sulfa-containing drugs, ethylenediaminetetraacetic acid (EDTA), and diaminodiphenylsulfone (Dapsone) and primaquine phosphate used to treat patients with acquired immunodeficiency syndrome (AIDS). Some patients can also have congenitally high MetHb levels.
The continuous and noninvasive detection of oxygenated and deoxygenated hemoglobin, as well as COHb, MetHb, and total hemoglobin, has become possible with the development of oximetric technology. The devices used to monitor these parameters are referred to as pulse CO-oximeters. These newer devices use 8 to 12 wavelengths of light. Devices developed by Massimo Corporation, the Rainbow Set Radical 7 pulse CO-oximeter and the Rad 57 pulse CO-oximeter, can detect and accurately measure the concentrations of COHb and MetHb.100 An advantage of these devices is the ability to continuously monitor the level of dyshemoglobinemia and monitor the response to treatment.101–105 The clinical value of this technology has been documented in numerous case reports of detection of carboxyhemoglobinemia and methemoglobinemia. However, the specific algorithms used to detect the dyshemoglobins impacts the accuracy of these devices. For example, the accuracy of the Massimo Radical 7 Pulse CO-oximeter in measuring MetHb during coincident hypoxemia (SaO2 < 95%) was poor in 14 healthy adults with overestimation of MetHb levels by 10% to 40%.106 After the company made modifications of the software and separated the optical sensors for MetHb and COHb, the accuracy for measuring MetHb concentrations improved considerably.107
Pulse CO-oximetry can also be used to continuously determine the hemoglobin concentration in arterial blood (SpHb).108 Macknet and colleagues used a Masimo Radical 7 with a spectrophotometric adhesive sensor using 12 wavelengths of light to measure SpHb in 20 healthy volunteers undergoing hemodilution (with removal of 500 mL of whole blood) compared with the standard total hemoglobin (tHb) measurement using a laboratory CO-oximeter.109 The investigators found that the average difference between SpHb and tHb to be −0.15 g/dL, with a standard deviation of 0.92 g/dL, and they concluded that SpHb is accurate within 1.0 g/dL. In 20 patients undergoing spinal surgery, Miller and colleagues compared SpHb with tHb and with hemoglobin measured with a point-of-care device, the HemoCue.110 There was an overall tendency for the SpHb to overestimate the corresponding tHb, especially when the perfusion index (PI) was higher than 1.4, the manufacturer’s threshold value for accuracy of SpHb. This study also calls into question the utility of using SpHb in making clinical decisions, because 22% of the pulse CO-oximeter tests determined hemoglobin values were more than 2.0 g/dL different from the tHb values.110 However, other investigators have found the monitor to be a useful guide to clinical decision making. In a preliminary study of 350 patients undergoing orthopedic surgery, the use of noninvasive, continuous hemoglobin monitoring reduced the frequency of blood transfusions and decreased the number of units of blood transfused compared with standard hemoglobin measurement.111 Although these studies have documented the value of SpHb monitoring in some clinical situations, the clinical value for guiding transfusion decisions for the patient with rapid, acute blood loss, large fluid shifts, or poor PI will require further investigation.
Fetal Hb does not affect the accuracy of the pulse oximeter.56,57,79 The effect of other dyshemoglobinemias, such as sulfhemoglobin, on the accuracy of pulse oximetry has not been investigated.79 Other pigments that interfere with the accuracy of pulse oximeter measurements include indocyanine green, methylene blue, and indigo carmine.79 These dyes cause transient artifactual falls in saturation; the extent of the problem depends on the absorption characteristics of the dye. Skin pigmentation has minimal effect on pulse oximeter readings, although very dark pigmentation can result in a slight decrease in accuracy.112,113 Jaundice has caused artificially low and artificially high pulse oximeter readings.94 In most studies, however, even very high bilirubin levels have had no effect on the accuracy of the SpO2.103,114
Certain shades of nail polish can alter significantly the accuracy of pulse oximetry when the sensor is placed directly over the nail bed. The extent to which accuracy is affected depends on the absorption characteristics of the nail polish at 660 and 940 nm. Black, blue, and green polishes can falsely lower the measured SpO2 by up to 6%; red nail polish has little effect on pulse oximeter measurements.79,115,116 If a patient has a darkly pigmented polish, it should be removed from the nail bed that is going to receive the probe, or the probe should be placed over the sides of the digit, thereby avoiding transmission of the signal through the nail bed.79,116 Darker skin pigments can produce falsely high readings of arterial O2 saturation by many pulse oximeters during hypoxemia. The positive bias in patients with dark skin may be as much as 8% when arterial O2 saturation is less than 80%, and it is less pronounced in patients with intermediate pigmentation and smallest in those with the lightest skin.117 This may be explained by the use of light-skinned individuals for the testing and calibration of pulse oximeters. However, not all oximeters produce this result. The Masimo Radical oximeter with an adhesive, disposable probe was found to underestimate oxygen saturation in hypoxic subjects.118
Severe anemia can affect the accuracy of the pulse oximeter. Lee and coworkers demonstrated that the pulse oximeter was inaccurate when the hematocrit was less than 10%.119 Vegfors and colleagues also found that the pulse oximeter is not accurate when the hematocrit is very low,120 but they suggested that the problem was caused by poor perfusion rather than the hematocrit level alone. Of more importance in the management of the severely anemic patient is the assessment of O2 delivery, rather than O2 saturation, even when the pulse oximeter is accurate. SpO2 reflects only O2 saturation and does not provide a guide to adequacy of the oxygen-carrying capacity of the blood or O2 delivery. In patients with sickle cell anemia, pulse oximetry correlates well with SaO2 measured by CO-oximeter, although with a clinically insignificant bias toward underestimation.121
When patients become hypotensive, hypovolemic, or markedly vasoconstricted, the peripheral pulse diminishes. This results in an additional problem with the performance of the pulse oximeter because the monitor works only when the patient has adequate arterial pulsations. When the patient’s peripheral perfusion is poor, the pulse oximeter may be unable to measure SpO2. In one study of patients with poor perfusion after cardiopulmonary bypass, only 2 of 20 brands of pulse oximeters were able to give SpO2 values within 4% of that obtained using a CO-oximeter.122 Attempts to improve the accuracy of pulse oximeters in hypoperfused conditions have not adequately solved the problem. Alternative probe locations, such as the nose or ear, and reflectance, rather than transmittance, techniques have been tried with various degrees of success.123,124 Investigators have evaluated pulse oximetry using probes placed in the esophagus.125–127 When placed esophageally or in other internal tissue sites, the measurement of SpO2 depends on reflectance and not on detection of the transmitted signal on the side opposite the emitter, as in standard transmission pulse oximetry.128,129 Esophageal location of the pulse oximeter probe in critically ill surgical patients results in more consistent SaO2 readings than with standard surface probes, and the function of probes was not affected by changes in perfusion or temperature.127 Esophageal pulse oximetry has also been used successfully in neonatal and older pediatric patients.130 Fetal pulse oximetry uses reflectance technology.131 Unfortunately, the expected reduction in the rate of cesarean delivery with the use of fetal oximetry has not occurred.132 In patients with peripheral vascular disease undergoing vascular surgery, the use of a forehead reflectance probe was shown to be an acceptable alternative to the standard transmission probe placed on the earlobe.128
The accuracy of SpO2 measurements in hypothermic patients has not been rigorously evaluated, but it seems to depend primarily on the presence or absence of an adequate pulse signal rather than temperature itself.133 In one study, active warming of patients improved the ability of pulse oximeters to detect a signal and decreased the incidence of false alarms.134
Pulsations other than arterial pulsations interfere with the performance of the pulse oximeter. When venous pulsations are pronounced, for example, the pulse oximeter may underestimate the true arterial oxygen saturation of hemoglobin.135 In a group of patients with severe tricuspid insufficiency, pulse oximetry underestimated the O2 saturation by up to 11%. Other clinical situations in which venous pulsations may be important include patients with severe congestive heart failure and patients who require very high venous pressure, such as after a Fontan procedure performed as treatment for tricuspid atresia.
Severe burns and injury to the digits of both hands and feet have been reported from the application of pulse oximeter probes.136–138 Frequently rotating the site of application and increasing vigilance can minimize these events. Burns of the skin have occurred with the application of pulse oximeters to patients after photodynamic therapy with the porfimer sodium (Photofrin).139 During intraoperative photochemotherapy with verteporfin, frequent rotation of the site of the pulse oximeter at intervals of 7 to 15 minutes during the 6-hour procedure prevented cutaneous injury.140
The plethysmographic waveforms produced by many pulse oximeters have been evaluated as a noninvasive method to determine blood pressure, intravascular volume, and perfusion.115,141–147 Respiratory-induced changes in photoplethysmography, as a predictor for volume responsiveness in mechanically ventilated patients, is similar to that seen in the arterial pressure waveform, and these dynamic measurements are superior to the static measurements obtained from intravascular catheters.148–150 Some patient conditions may limit the use of these dynamic indicators of volume responsiveness, including dysrhythmias, a requirement for positive-pressure ventilation with a VT greater than 8 mL/kg, and low levels of positive end-expiratory pressure (PEEP).151 Plethysmographic variations induced by the use of positive-pressure ventilation were more reliable in predicting fluid responsiveness than central venous pressure or pulmonary artery occlusion pressure in mechanically ventilated cardiac surgery patients postoperatively.152 Photoplethysmographic pulse variation of more than 9% produced by mechanical ventilation identified patients who were likely to respond to fluid administration with an increase in cardiac output.148 In this study, there was no relationship between arterial pressure measured directly and the amplitude of the photoplethysmogram. Respiratory changes in the amplitude of the plethysmographic pulse were found to be as accurate as changes in pulse pressure from an arterial catheter produced by mechanical ventilation in septic patients for the prediction of fluid responsiveness.153 The use of respiratory variations in photoplethysmography has been as reliable and as accurate an indicator of mild hypovolemia (up to a 20% decrease in estimated circulating blood volume) as the use of arterial waveform analysis in hemodynamically stable, mechanically ventilated patients undergoing autologous hemodilution.154 On the contrary, Landsverk and colleagues found that there are larger intraindividual and interindividual variability in critically ill patients in indices derived from pulse oximeter technology than from those using arterial waveforms and that this may limit the reliability of predicting volume responsiveness using the pulse oximeter.155
The use of the respiratory-induced waveform variation (RIWV) in photoplethysmography may be useful in detecting hypovolemia in spontaneously breathing humans.156,157 In a study of trauma patients in the prehospital setting, Chen and colleagues found that photoplethysmography RIWV was independently correlated with major hemorrhage and that it may enhance detection of hypovolemia beyond the use of standard vital signs.156 In a study of volunteers, McGrath and colleagues progressively reduced central blood volume using lower body negative pressure up to −100 mm Hg and investigated the pulse shape features of the photoplethysmographic patter obtained from sensors placed on the finger, forehead, and ear to determine which might serve as indicator of hypovolemia.157 The investigators found that reductions in pulse amplitude, width, and area under the curve of the pulse oximeter waveform from the ear and forehead were strongly correlated with reductions in stroke volume with the forehead sensor having the best performance. These changes in waveform were seen before reductions in arterial blood pressure. The increased sympathetic activity that accompanies hypovolemia and the concomitant peripheral vasoconstriction were thought by the investigators to reduce the ability of the photoplethysmogram obtained from the finger probe to function as well as the probes in other locations in detecting hypovolemia.
The Massimo Corporation developed a proprietary algorithm, the Pleth Variability Index (PVI), which allows continuous and automated calculation of respiratory-induced variations of the photoplethysmographic waveform. PVI is a dynamic measure of the changes in the perfusion index (PI) that occur over a complete respiratory cycle. The PI is the ratio of pulsatile absorption of the pulse oximeter signal (AC) to that obtained during the baseline nonpulsatile signal (DC), and it reflects the amplitude of the plethysmographic waveform.115 To calculate PI, the pulsatile signal is indexed to the nonpulsatile blood flow and expressed as a percentage: PI = (AC/DC) × 100. The PVI calculation uses the maximal (PImax) and minimal (PImin) PI values over the respiratory cycle: PVI = [(PImax − PImin)/PImax] × 100, expressed as a percentage.158
Studies have investigated the usefulness of the PVI to predict fluid responsiveness in patients and guide patient management.159–161 In patients after cardiac surgery, PVI was able to predict the reduction in cardiac output produced by the application of PEEP of 10 cm H2O when patients were mechanically ventilated with a VT greater than 8 mL/kg.158 When patients were ventilated with a VT of 6 mL/kg, the PVI and the change in respiratory variation in arterial pulse pressure (ΔPP) were unable to accurately assess the hemodynamic effects of PEEP. In a study of goal-directed fluid management, PVI was used to assess volume responsiveness in 82 patients undergoing abdominal surgery. The use of PVI resulted in a decrease in the volume of fluid administered in the OR and reduced lactate levels in the intraoperative and postoperative periods.160 Zimmermann and colleagues found that PVI is comparable to stroke volume variation as an indicator of volume responsiveness.162 PVI also can predict fluid responsiveness (i.e., increase in cardiac output of ≥15%) in mechanically ventilated critically ill patients with circulatory insufficiency after a 500-mL colloid bolus.161 In this study, a higher PVI at baseline was associated with a larger change in cardiac output after fluid administration.
The PI that is provided in some pulse oximetric monitoring systems correlates with peripheral perfusion. Lima and colleagues found that the PI correlated with changes in the core-to-toe temperature difference in critically ill patients and suggested that it might be clinically helpful to monitor changes in PI in this population of patients.144
In the postoperative period, continuous pulse oximetry can be a useful surveillance monitor, and it can reduce respiratory complications. One commercially available system uses a paging system to alert the nursing staff when preset physiologic alarm limits are breached. In one study that evaluated the clinical benefits of the Patient SafetyNet System (Massimo Corp.), careful selection of the alarm limits reduced the number of false alarms but provided notification to the nurse of changes in physiologic parameters, including O2 saturation. The investigators demonstrated a decrease in ICU transfers and reduced need for rescue events (i.e., activation of rapid response team, cardiac arrest team, or stat airway team) compared with before implementation of the system.163 Further investigation of the clinical value of these systems is needed to justify widespread implementation.
b Capnography
Capnography provides a noninvasive method to assess ventilation and ventilation-perfusion relationships.164–166 A capnograph provides a continuous display of the CO2 concentration of gases from the airways. The CO2 concentration at the end of normal exhalation (EtCO2, PETCO2) is a reflection of gas from the distal alveoli; it therefore represents an estimate of the alveolar CO2 concentration (PACO2). When ventilation and perfusion are well matched, the PACO2 closely approximates the PaCO2, and PACO2 ≅ PaCO2 ≅ PETCO2. The normal gradient between PaCO2 and PETCO2 (P[a − ET]CO2) is more than 6 mm Hg. The gradient between PaCO2 and PETCO2 increases when pulmonary perfusion is reduced or ventilation is maldistributed.
The capnogram is a waveform that graphically represents the CO2 concentration over time. The capnogram provides information about adequacy of ventilation, potential airflow obstruction, and in conjunction with other monitors,  relationships. A normal capnogram has four components, the ascending limb, alveolar plateau, descending limb, and baseline (Fig. 49-5). The ascending limb represents the CO2 concentration of the gas in rapidly emptying alveoli. The alveolar plateau occurs because the CO2 concentration from uniformly ventilated alveoli is relatively constant. The PETCO2 is the point at which the CO2 concentration is highest, representing the CO2 concentration approximating true alveolar gas. The rapid, descending limb of the capnogram signals inspiration. The baseline represents the CO2 concentration of inspired gas.
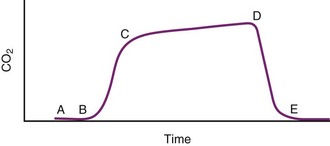
The capnographic waveform provides a graphic display of the CO2 concentration over time. The waveform can be used to identify significant inspiratory or expiratory airway obstruction, including intrinsic airway obstruction or a kinked ETT (Fig. 49-6). With expiratory obstruction, the waveform does not have a normal alveolar plateau. By continuously monitoring the capnographic waveform, the response to bronchodilator therapy can be visually confirmed. The capnographic waveform can also be used to diagnose rebreathing of CO2; with rebreathing, as can occur when fresh gas flow is inadequate, the baseline (inspired) CO2 concentration increases.
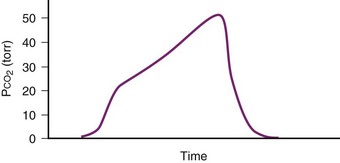
Figure 49-6 Capnograph waveform in a patient with airflow obstruction demonstrates lack of an alveolar plateau.
Despite its clinical utility, capnography has significant limitations as a monitor of ventilation for patients with impaired pulmonary function or hemodynamic instability. The biggest problem is that the correlation between PaCO2 and PETCO2 varies and is sometimes poor in patients with low cardiac output or altered  relationships. The correlation varies as the patient’s clinical condition changes, making interpretations of ventilation from PETCO2 measurements alone unreliable. This has been documented in patients suffering severe traumatic injury, particularly those with traumatic brain injury for whom hypocapnia and hypercapnia should be avoided.167,168 In a study of 180 trauma patients presenting to an ED, the correlation between PETCO2 and PaCO2 was poor (R2 = 0.277).169 Following common recommendations for ventilation in these patients to maintain PETCO2 values between 35 and 39 mm Hg resulted in significant hypoventilation. The PaCO2 was more than 40 mm Hg in 80% of cases and more than 50 mm Hg in 30% of cases. The correlation between PETCO2 and PaCO2 was best for patients with only traumatic brain injury and poor for those with chest injuries or decreased perfusion. An increased difference between PaCO2 and PETCO2 in patients with traumatic brain injury was observed for those with coexistent severe chest trauma, hypotension, and metabolic acidosis. For patients without significant extracranial trauma, the PaCO2 and PETCO2 were 100% concordant.170 Capnography may be used to guide ventilatory therapy in patients with traumatic brain injury, but only if there is limited injury to other organ systems. It can provide useful noninvasive information in patients undergoing apnea testing to confirm brain death,171 although most clinicians perform confirmatory ABG analysis to document the PaCO2 before declaring brain death.
IV Monitoring Respiratory Function during Mechanical Ventilatory Support
Assessment of pulmonary mechanical function can be performed using a variety of monitoring techniques for the patient who is breathing spontaneously and for the mechanically ventilated patient.172–175 The techniques are useful for optimizing ventilatory support in the critically ill patient, determining the extent to which the patient can initiate spontaneous ventilation, guiding the use of supportive modes of ventilation (e.g., pressure support ventilation), and determining when and how to initiate weaning from mechanical ventilatory support. With several new modes of ventilation and supportive techniques to augment patient-initiated breaths, these monitoring techniques have become an essential component of respiratory management.
A Assessment of Pulmonary Mechanical Function
 ) is critical to understanding the nature of a patient’s respiratory dysfunction and defining the ventilatory needs of the patient. The
  represents wasted ventilation in that it increases the work of breathing without contributing to gas exchange.
 ). Evaluating the adequacy of ventilation requires an understanding of
  and
and  . The determinants of Pa
 = carbon dioxide production (mL/min)
 = alveolar ventilation (L/min)
The equation assumes that inspired CO2 is zero. CO2 elimination through the lung depends solely on the  , the area within the lung where gas exchange occurs.175 The remainder of the lung and large airways represent dead space, the volume of gas that does not participate in gas exchange;
  has no effect on CO2 elimination.
 to maintain CO2 homeostasis depends on the relationship between
  and
and  . As the dead space increases, the work of breathing (respiratory rate or VT) must increase to compensate for the wasted ventilation and maintain a normal Pa
 that is required to maintain a normal Pa
 is the sum of
  and
and  , as shown in Equation 6:
Dead space is composed of anatomic dead space, alveolar dead space, and dead space imposed by equipment used to maintain the airway and ensure ventilation. The anatomic dead space is the volume of gas within the conducting airways; in a normal, 70-kg man, it averages about 156 mL (about 1 mL/lb).176 The volume of the anatomic dead space increases with increases in lung volume and decreases in the supine position.177–180 Intubation of the airway with an ETT decreases the anatomic dead space by about 50% because of the elimination of the extrathoracic airway (the nose and mouth, which do not contribute to gas exchange).179,181 Depending on the intraluminal volume of the ETT and any additional apparatus dead space, the actual reduction of the anatomic dead space that occurs after endotracheal intubation may be inconsequential. Alveolar dead space is defined as the amount of gas that penetrates to the alveolar level but does not participate in gas exchange. In healthy individuals, this volume is minimal; however, alveolar dead space is increased in patients with  inequalities, such as those with pulmonary emboli or severe lung injury. The physiologic dead space is the sum of the anatomic and alveolar dead spaces and is represented by the total volume of gas in each breath that does not participate in gas exchange.

The VD/VT can be estimated more easily by assuming that PICO2 is zero and estimating alveolar CO2 as arterial CO2. This simplified formula represents the Enghoff modification of the Bohr equation70,72,181:

The normal VD/VT is 0.3 at rest; it decreases during exercise, primarily as a result of an increase in VT, a more efficient way to increase alveolar ventilation with increasing O2 consumption and CO2 production.179,181 Patients with severe respiratory failure may have a VD/VT value as high as 0.75, even with an ETT in place. In this situation, the patient’s work of breathing is so high that discontinuation of some level of ventilatory support is not possible,182 although modes of ventilation that increase VT without an accompanying increase in work of breathing, such as pressure support ventilation, may facilitate spontaneous ventilatory work.
From a measurement of PECO2 and PaCO2, the VD/VT can be calculated. PECO2 can be measured by collecting expired gas in a large-volume reservoir (e.g., Douglas bag, meteorologic balloon) for 3 to 5 minutes (depending on the  ) and measuring the CO2 tension of a sample of this gas.181,183 PaCO2 is measured from blood gas obtained simultaneously during the collection of the expired gas.
Some technical factors must be taken into account when measuring VD/VT in mechanically ventilated patients. A correction must be made for gas compression within the ventilator, connecting tubing, and any additional dead space from the apparatus.184 If the compression volume is ignored, the true physiologic dead space is underestimated by as much as 16%. Newer ventilators adjust the VT to take into account the compression volume of the ventilator circuit. Several ventilator parameters can influence the accuracy of the measurement of VD. For example, physiologic dead space was found to increase markedly when the duration of inspiration during mechanical ventilation was decreased from 1 to 0.5 second in paralyzed patients.185 A nomogram of the relationship between  , VD/VT, and PaCO2 in mechanically ventilated patients was developed to aid in the titration of ventilatory support, assess the response to medical therapy, and increase the precision of the therapeutic management of critically ill patients.186
A simpler method for estimating VD/VT has been described. Measurement of the carbon dioxide pressure (PCO2) in the condensate of expired gas in the collection bottle from the expiratory limb of the mechanical ventilator is equivalent to the cumbersome technique of collecting the mixed expired gas.183 This PCO2 value can be substituted for PECO2, greatly simplifying the measurement of physiologic dead space in mechanically ventilated patients.
Another approach to the noninvasive assessment of the physiologic VD/VT ratio substitutes PETCO2 for PaCO2. For normal subjects, the relationship between PETCO2 and PaCO2 is well established.187,188 At rest, PETCO2 underestimates PaCO2 by 2 to 3 mm Hg. However, with exercise, PETCO2 can overestimate PaCO2. The difference between PETCO2 and PaCO2 varies directly with VT and cardiac output and inversely with respiratory rate.
For patients undergoing general anesthesia or with respiratory failure, the gradient between arterial and end-tidal CO2 (P[a − ET]CO2) increases.179,189 This increase reflects more ventilation to lung units with high  relationships. For patients with normal pulmonary function who are mechanically ventilated during general anesthesia, the P[a − ET]CO2 averages 5 mm Hg; the P[a − ET]CO2 can be as high as 15 mm Hg in the supine position. The average P[a − ET]CO2 increases to 8 mm Hg when these patients are placed in the lateral decubitus position.190 In patients with respiratory failure, the P[a − ET]CO2 can be even greater. In patients with respiratory failure, there is a close correlation between P[a − ET]CO2 and VD/VT.189 The P[a − ET]CO2 can therefore be used as an indicator of the efficiency of ventilation.
In patients with acute lung injury, an increase in VD/VT correlates with increased mortality and with a decrease in ventilator free days. As a result, the VD/VT can be used as a marker of severity of disease.191,192 Frankenfield and colleagues193 developed and validated an equation that uses clinically available data to estimate V/VT: VD/VT = 0.32 + 0.0106 (PaCO2 − EtCO2) + 0.003 (respiratory rate) + 0.0015 (age in years). The equation was constructed from data obtained from 135 patients and validated on an additional 50 patients (R2 = 0.67). Volumetric capnography, also called the single-breath test for CO2, can be used to estimate physiologic dead space.189 Volumetric capnography enlists a plot of the expired CO2 against the exhaled volume of a single breath. Volumetric capnography in combination with D-dimer testing has been used in the ED to help evaluate patients with suspected pulmonary emboli and to select the optimal level of PEEP in anesthetized, morbidly obese patients.194,195
1 Airway Resistance and Lung-Thorax Compliance
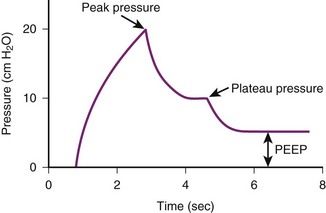
In the intubated, ventilated patient, airway resistance and lung-thorax compliance can be differentiated by evaluating peak and plateau pressures and by the difference between them (Fig. 49-7). The peak airway pressure generated by the ventilator reflects the pressure necessary to overcome airway resistance and compliance of the lung and chest wall. The peak pressure is elevated when airway resistance is increased, as may occur with increased pulmonary secretions or a kinked ETT or when lung-thorax compliance is reduced.196 The peak pressure is influenced by other factors, including ventilator parameters, such as inspiratory flow rate and pattern, VT, and the ETT size. The ratio of the VT delivered divided by the pressure change, the difference between the peak inspiratory pressure and PEEP, is the dynamic compliance. Dynamic compliance is reduced when airway resistance is increased or lung-thorax compliance is reduced.
2 Intrinsic Positive End-Expiratory Pressure
Hyperinflation (overdistention) of the lung occurs in some mechanically ventilated patients because of air trapping. Gas can be trapped within the lung during the expiratory phase because of dynamic airflow limitation (e.g., associated with asthma) or inadequate expiratory time, as may occur when the inspiratory flow is so low that it causes a high inspiratory-to-expiratory (I : E) ratio. The hyperinflation that results has been called auto-PEEP, intrinsic PEEP (PEEPi), or occult PEEP.26,197 The presence of auto-PEEP increases the risk of barotrauma, compromises hemodynamics by reducing venous return, increases the patient’s work of breathing, and can result in unilateral lung hyperinflation.26,184,197
Identification of PEEPi is difficult. PEEPi is not reflected in the pressure measured on the manometer of the ventilator at the end of exhalation, because at end expiration, the exhalation valve is open to atmospheric pressure (PEEP = 0 cm H2O) or reflects the level of PEEP provided by the ventilator (Fig. 49-8). PEEPi can be quantitated by occluding the expiratory port of the ventilator circuit at the end of exhalation immediately before the next breath is delivered. The pressure in the lungs and ventilator circuit equilibrates. The level of PEEPi is then displayed on the manometer. Although this approach provides an estimate of the magnitude of gas trapping, it is technically difficult and hard to reproduce. Another method to determine whether PEEPi is present, but not to quantitate it, uses evaluation of the expiratory flow waveform. If expiratory flow does not fall to zero before the next inspiration, gas is trapped within the lung, creating PEEPi (Fig. 49-9). When PEEPi is identified using this method, the flow waveform can be monitored while adjusting ventilator parameters to minimize PEEPi.
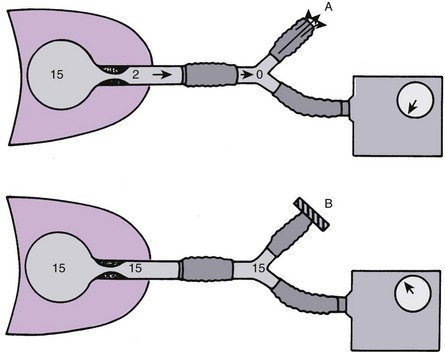
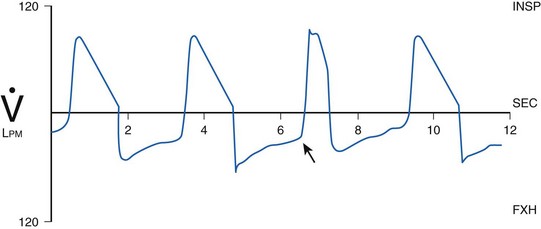
3 Ventilatory Waveform Analysis
Ventilatory waveform analysis is a useful method to assess airway patency, pulmonary function, and the patient-ventilator interface. Most critical care ventilators have a variety of waveform monitoring capabilities; for applications in which the ventilators do not have integrated waveform monitoring capability, separate monitors are available to assess waveform, work of breathing, capnography, and other useful monitoring parameters, such as O2 consumption, CO2 production, and calculated energy expenditure. Although all of these measures help in the care of critically ill patients, the waveforms are particularly useful in assessing the patient’s air movement, identifying the presence of gas trapping, and for many patients, providing critically important information about the adequacy of the ventilatory parameters used to optimize gas exchange. Evaluating the flow-time and pressure-time curves can provide information about whether the patient is able to trigger the ventilator to initiate spontaneously supported breaths (e.g., pressure support) and to determine whether the peak inspiratory flow and flow pattern are adequate to meet the patient’s needs.198–200 When the patient appears agitated or dyssynchronous with the ventilator, the waveforms can be useful in giving direct feedback about whether the problem is related to inappropriately low inspiratory flow or other ventilator-dependent parameters or inadequate analgesia or sedation.201–203
In many cases, modifications to the ventilator can improve the clinical situation and minimize the need for excessive sedation. In addition to displaying inspiratory and expiratory flow patterns, the ventilator displays pressure-volume and flow-volume loops, both of which can be useful in assessing whether the peak inspiratory flow is too high or too low or the VT is too high, putting the patient at risk for pulmonary volutrauma.204 For patients with adult respiratory distress syndrome, in whom we recognize the deleterious effects of high VT and high airway pressures, analysis of the waveforms can help in adjusting ventilator parameters to optimize gas exchange without increasing the risk of lung disruption.205 Figure 49-10 illustrates waveforms that identify excessive work of breathing during patient-initiated breaths. While monitoring the waveforms, adjustments can be made in ventilator parameters to optimize flow patterns and minimize airway pressures, PEEPi, and work of breathing.
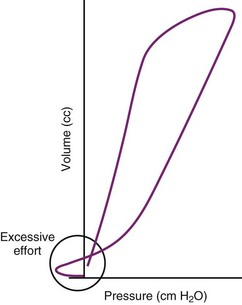
4 Work of Breathing
The work of breathing is another important monitor of a patient’s respiratory status, respiratory reserve, and likelihood of being successfully weaned from mechanical ventilatory support. The patient’s work of breathing (WOBp) can be assessed by clinical evaluation at the bedside or calculated using data obtained from an esophageal balloon and flow transducer at the airway.177,206 The clinical evaluation of WOBp, although useful, can be misleading. Some patients who appear to have excessive WOBp indicate that they are comfortable. Others with a low  and slow respiratory rate are already working maximally, and although they appear comfortable at the current level of ventilatory support, they cannot tolerate any further increase in their WOBp.
B Assessment of Pulmonary Function During Weaning
Several measures of pulmonary mechanical function are used to evaluate the likelihood of weaning success in the mechanically ventilated ICU patient.182 Vital capacity (VC) and maximum inspiratory pressure (MIP or PImax) are commonly employed to evaluate pulmonary mechanical function. A VC of 10 mL/kg and PImax more negative than −20 cm H2O have been useful predictors of weaning success for some patients. Other measures of mechanical function that have been used to predict weaning success include maximum voluntary ventilation (MVV) greater than two times the resting level and  less than 10 L/min. A VD/VT greater than 0.6 has predicted weaning failure consistently. Unfortunately, although each of these parameters can be used to assess pulmonary mechanical function, several studies have demonstrated that none predicts weaning success.
Other monitoring techniques have been employed to predict weaning success, including continuous measurement of O2 consumption.207 Although many studies have attempted to define key factors in predicting weaning success, changes in mechanical ventilatory capabilities and our understanding of the risks and benefits of mechanical ventilatory support have had a major impact on methods for assessment and monitoring of patients. The use of pressure support ventilation and noninvasive modes of ventilatory support have made interpretation of the studies and recommendations difficult. One of the key components in the decision-making process about weaning and discontinuation of mechanical ventilatory support is related to the patient’s ability to protect the airway and the need for intensive respiratory care rather than specific respiratory mechanical parameters. Many patients previously thought to be unweanable can be weaned from mandatory ventilatory support and provided with ventilatory assistance using pressure-support ventilation through an ETT or using noninvasive ventilation, BiPAP by mask, or mask CPAP. The traditional methods for assessing weaning may no longer apply. Nonetheless, an understanding of the various methods that have been used to assess weaning potential is critical to defining the most effective way to have a patient make the transition from positive-pressure ventilation to spontaneous ventilation.
1 Weaning Indices
Several indices have been developed to predict when a patient can be successfully weaned from mechanical ventilatory support. These indices combine multiple individual parameters to predict weaning success; some incorporate indices of gas exchange. One study evaluated multiparameter indices, including the rapid shallow breathing (RSB) index, the ratio of respiratory frequency divided by VT in liters, and the CROP index (i.e., thoracic compliance, respiratory rate, arterial oxygenation, PImax), which incorporates measures of dynamic lung compliance, respiratory rate, gas exchange, and inspiratory pressure.208 An RSB index of less than 105 was shown to have a high predictive value for weaning success, whereas the CROP index and more traditional indices had poor predictive values. A study could not confirm these findings and demonstrated that an RSB index of less than 105 did not predict failed weaning.209
2 Breathing Pattern Analysis
Respiratory impedance plethysmography (RIP) can be used to assess the breathing pattern by measuring VT, respiratory frequency, inspiratory time, and the contribution of the rib cage and abdomen to lung volume changes.37,38 Using RIP, the relationship between rib cage and abdominal contributions to VT (i.e., respiratory muscle dyssynchrony) has been quantitated. RIP is useful for evaluating changes in functional residual capacity and level of PEEPi as ventilator parameters are adjusted. As a method for predicting weaning success, the technique has had variable success.
3 Airway Occlusion Pressure
The airway occlusion pressure has been used as an index of respiratory drive, although it is rarely used as a routine monitor of ventilatory drive. Airway occlusion pressure is the pressure generated 0.1 second (P0.1) after initiating an inspiratory effort against an occluded airway. The P0.1 in normal subjects usually is less than 2 cm H2O. Some studies suggest that a P0.1 value greater than 6 cm H2O is incompatible with successful weaning for patients with COPD.210 Few studies have confirmed the value of airway occlusion pressure as a predictor of successful weaning success,211,212 and its clinical utility remains unclear.
VI Clinical Pearls
• The most reliable method for determining the intratracheal location of an artificial airway is direct visualization of the device passing through the vocal cords; fiberoptic assessment can define the specific location of the endotracheal tube in the airways.
• When using CO2 detection in exhaled gas from an artificial airway to document whether the endotracheal tube is within the trachea, CO2 should be present for four or five breaths.
• Respiratory dyssynchrony (i.e., abdominal expansion during inspiration without chest excursions) in a patient without upper airway obstruction is an early and critical indicator of respiratory muscle fatigue and impending respiratory failure.
• The accuracy of pulse oximetry is altered by several factors, including external light sources, motion, poor perfusion, and dyshemoglobinemias.
• Analysis of the plethysmographic waveform from a pulse oximeter has clinical utility in the hemodynamic assessment of patients and evaluation of intravascular volume status.
• In patients with traumatic brain injury, adjustment of ventilatory parameters based on end-tidal CO2 values may be unreliable.
• VD/VT can be used as a marker of disease severity in patients with acute lung injury.
All references can be found online at expertconsult.com.
1 Tobin MJ. Respiratory monitoring. JAMA. 1990;264:244–251.
4 deWit M. Monitoring of patient-ventilator interaction at the bedside. Respir Care. 2011;56:61–72.
24 Salem MR. Verification of endotracheal tube position. Anesthesiol Clin North Am. 2001;19:813–839.
56 Schnapp LM, Cohen NH. Pulse oximetry: Uses and abuses. Chest. 1990;98:1244–1250.
166 Szaflarski NL, Cohen NH. Use of capnography in critically ill adults. Heart Lung. 1991;20:363–372.
181 Nunn JF. Nunn’s applied respiratory physiology. Oxford, UK: Butterworth-Heinemann; 1993.
193 Frankenfield DC, Alam S, Bekteshi E, et al. Predicting dead space ventilation in critically ill patients using clinically available data. Crit Care Med. 2010;38:288–291.
199 Hess DR. Ventilator waveforms and the physiology of pressure support ventilation. Respir Care. 2005;50:166–186.
200 Fernandez-Perez ER, Hubmayr RD. Interpretation of airway pressure waveforms. Intensive Care Med. 2006;32:658–659.
203 Nilsestuen O, Hargett KD. Using ventilator graphics to identify patient-ventilator asynchrony. Respir Care. 2005;50:202–234.
1 Tobin MJ. Respiratory monitoring. JAMA. 1990;264:244–251.
2 Rudraraju P, Eisen LA. Confirmation of endotracheal tube position: A narrative review. J Intensive Care Med. 2009;24:283–292.
3 Schwartz DE, Matthay MA, Cohen NH. Death and other complications of emergency airway management in critically ill adults. A prospective investigation of 297 tracheal intubations. Anesthesiology. 1995;82:367–376.
4 deWit M. Monitoring of patient-ventilator interaction at the bedside. Respir Care. 2011;56:61–72.
5 Solomon P, Weisbrod M, Irish JC, et al. Adult epiglottitis: The Toronoto Hospital experience. J Otolaryngol. 1998;27:332–336.
6 Birmingham PK, Cheney FW, Ward RJ. Esophageal intubation: A review of detection techniques. Anesth Analg. 1986;65:886–891.
7 Jaffe MD. Infrared measurement of carbon dioxide in the human breath: “breathe-through” devices from Tyndall to the present day. Anesth Analg. 2008;107:890–904.
8 Goldberg JS, Rawle PR, Zehnder JL, et al. Colorimetric end-tidal carbon dioxide monitoring for tracheal intubation. Anesth Analg. 1990;70:191–194.
9 MacLeod BA, Heller MB, Yealy DM, et al. Verification of endotracheal tube placement with colorimetric end-tidal CO2 detection. Ann Emerg Med. 1991;20:267–270.
10 Dunn SM, Mushlin PS, Lind LJ, et al. Tracheal intubation is not invariably confirmed by capnography. Anesthesiology. 1990;73:1285–1287.
11 Garnett AR, Gervin CA, Gervin AS. Capnographic waveforms in esophageal intubation: Effect of carbonated beverages. Ann Emerg Med. 1989;18:387–390.
12 Neumar RW, Otto CW, Link MS, et al. Adult cardiovascular life support: 2010 American Heart Association Guidelines for Cardiopulmonary Resuscitation and Emergency Cardiovascular Care. Circulation. 2010;122(Suppl 3):S729–S767.
13 Falk JL, Rackow EC, Weil MH. End-tidal carbon dioxide concentration during cardiopulmonary resuscitation. N Engl J Med. 1988;318:607–611.
14 Higgins D, Hayes M, Denman W, et al. Effectiveness of using end-tidal carbon dioxide concentration to monitor cardiopulmonary resuscitation. BMJ. 1990;300:581.
15 Lepilin MG, Vasilyev AV, Bildinov OA, et al. End-tidal carbon dioxide as a noninvasive monitor of circulatory status during cardiopulmonary resuscitation: A preliminary clinical study. Crit Care Med. 1987;15:958–959.
16 Sanders AB, Kern KB, Otto CW, et al. End-tidal carbon dioxide monitoring during cardiopulmonary resuscitation: A prognostic indicator for survival. JAMA. 1989;262:1347–1351.
17 Tanigawa K, Takeda T, Goto E, et al. Accuracy and reliability of the self-inflating bulb to verify tracheal intubation in out-of-hospital cardiac arrest patients. Anesthesiology. 2000;93:1432–1436.
18 Conrardy PA, Goodman LR, Lainge F, et al. Alteration of endotracheal tube position. Crit Care Med. 1976;4:7–12.
19 Owen RL, Cheney FW. Endobronchial intubation: A preventable complication. Anesthesiology. 1987;67:255–257.
20 Brunel W, Coleman DL, Schwartz DE, et al. Assessment of routine chest roentgenograms and the physical examination to confirm endotracheal tube position. Chest. 1989;96:1043–1045.
21 Gray P, Sullivan G, Ostryniuk P. Value of postprocedural chest radiographs in the adult intensive care unit. Crit Care Med. 1992;20:1513–1518.
22 Schwartz DE, Lieberman JA, Cohen NH. Women are at greater risk than men for malpositioning of the endotracheal tube after emergent intubation. Crit Care Med. 1994;22:1127–1131.
23 Golden JA, Schwartz DE, Gamsu G, et al. Sheathed FOB for assessing endotracheal tube position. Chest. 1991;100:20S.
24 Salem MR. Verification of endotracheal tube position. Anesthesiol Clin North Am. 2001;19:813–839.
25 Lindholm CE, Ollman B, Snyder JV, et al. Cardiorespiratory effects of flexible fiberoptic bronchoscopy in critically ill patients. Chest. 1978;74:362–368.
26 Pepe PE, Marini JJ. Occult positive end-expiratory pressure in mechanically ventilated patients with airflow obstruction: The auto-PEEP effect. Am Rev Respir Dis. 1982;126:166–170.
27 Gandhi SK, Munshi CA, Coon R, et al. Capnography for detection of endobronchial migration of an endotracheal tube. J Clin Monit. 1991;7:35–38.
28 Hurford WE, Alfille PH, Bailin MT, et al. Placement and complications of double-lumen endotracheal tubes. Anesth Analg. 1992;74:S141.
29 Simon BA, Hurford WE, Alfille PH, et al. An aid in the diagnosis of malpositioned double-lumen tubes. Anesthesiology. 1992;76:862–863.
30 Habib MP. Physiologic implications of artificial airways. Chest. 1989;96:180–184.
31 Potgieter PD, Hammond JM. “Cuff” test for safe extubation following laryngeal edema. Crit Care Med. 1988;16:818.
32 Ochoa ME, Marín Mdel C, Frutos-Vivar F, et al. Cuff-leak test for the diagnosis of upper airway obstruction in adults: A systematic review and meta-analysis. Intensive Care Med. 2009;35:1171–1179.
33 Cavo JW. True vocal cord paralysis following intubation. Laryngoscope. 1985;95:1352–1359.
34 McGarvey JM, Pollack CV. Heliox in airway management. Emerg Med Clin North Am. 2008;26:905–920.
35 Cohen CA, Zagelbaum G, Gross D, et al. Clinical manifestations of inspiratory muscle fatigue. Am J Med. 1982;73:308–316.
36 Roussos C, Macklem PT. The respiratory muscles. N Engl J Med. 1982;307:786–797.
37 Tobin MJ, Guenther SM, Perez W, et al. Konno-Mead analysis of ribcage-abdominal motion during successful and unsuccessful trials of weaning from mechanical ventilation. Am Rev Respir Dis. 1987;135:1320–1328.
38 Tobin MJ, Perez W, Guenther SM, et al. Does ribcage-abdominal paradox signify respiratory muscle fatigue? J Appl Physiol. 1987;63:851–860.
39 Mandor MJ. Respiratory muscle fatigue and breathing pattern. Chest. 1991;100:1430–1435.
40 Roussos C. Function and fatigue of respiratory muscles. Chest. 1985;88:124S.
41 Walsh TS. Recent advances in gas exchange measurement in intensive care patients. Br J Anaesth. 2003;91:120–131.
42 Band JD, Maki DG. Infections caused by arterial catheters used for hemodynamic monitoring. Am J Med. 1979;67:735–741.
43 Lindsay SL, Kerridge R, Collett BJ. Abscess following cannulation of the radial artery. Anaesthesia. 1987;42:654–657.
44 Wolf S, Mangano DT. Pseudoaneurysm, a late complication of radial-artery catheterization. Anesthesiology. 1980;52:80–81.
45 Ishikawa S, Ohmi S, Nakazawa K, et al. Continuous intra-arterial blood gas monitoring during thoracic surgery. J Anesth. 2000;14:119–123.
46 Menzel M, Soukup J, Henze D, et al. Experiences with continuous intra-arterial blood gas monitoring: Precision and drift of a pure optode-system. Intensive Care Med. 2003;29:2180–2186.
47 Bearden E, Lopez JA, Solis RT. Evaluation of a continuous intraarterial blood gas sensor in critically ill patients. Crit Care Med. 1994;22:A25.
48 Venkatesh B, Clutton-Brock T, Hendry S. Intraoperative use of the Paratrend 7 intravascular blood gas sensor. Crit Care Med. 1994;22:A21.
49 Comroe JH, Botelho S. The unreliability of cyanosis in the recognition of arterial anoxemia. Am J Med Sci. 1947;214:1–6.
50 Mihm FG, Halperin BD. Noninvasive detection of profound atrial desaturations using a pulse oximetry device. Anesthesiology. 1985;62:85–87.
51 Yelderman M, New W. Evaluation of pulse oximetry. Anesthesiology. 1983;59:349–352.
52 Caples SN, Hubmayr RD. Respiratory monitoring tools in the intensive care unit. Curr Opin Crit Care. 2003;9:230–235.
53 Brunel W, Cohen NH. Evaluation of the accuracy of pulse oximetry in critically ill patients. Crit Care Med. 1988;16:432.
54 The use of pulse oximetry during conscious sedation. Council on Scientific Affairs. JAMA. 1993;270:1463–1466.
55 Eichhorn JH, Cooper JB, Cullen DJ, et al. Standards for patient monitoring during anesthesia at Harvard Medical School. JAMA. 1986;256:1017.
56 Schnapp LM, Cohen NH. Pulse oximetry: Uses and abuses. Chest. 1990;98:1244–1250.
57 Severinghaus JW, Kelleher JF. Recent developments in pulse oximetry. Anesthesiology. 1992;76:1018–1038.
58 Moller JT, Johannessen NW, Berg H, et al. Hypoxaemia during anesthesia: An observer study. Br J Anaesth. 1991;66:437–444.
59 Moller JT, Wittrup M, Johansen SH. Hypoxemia in the post-anesthesia care unit: An observer study. Anesthesiology. 1990;73:890–895.
60 Bowton DL, Scuderi PE, Haponik EF. The incidence and effect on outcome of hypoxemia in hospitalized medical patients. Am J Med. 1994;97:38–46.
61 Cullen DJ, Nemeskal AR, Cooper JB, et al. Effect of pulse oximetry, age, and ASA physical status on the frequency of patients admitted unexpectedly to a postoperative intensive care unit and the severity of their anesthesia-related complications. Anesth Analg. 1992;74:181–188.
62 Gil NP, Wright B, Reilly CS. Relationship between hypoxaemic and cardiac ischaemic events in the perioperative period. Br J Anaesth. 1992;68:471–473.
63 Eichhorn JH. Prevention of intraoperative anesthesia accidents and related severe injury through safety monitoring. Anesthesiology. 1989;70:572–577.
64 Moller JT, Jensen PF, Johannessen NW, et al. Hypoxaemia is reduced by pulse oximetry monitoring in the operating theatre and in the recovery room. Br J Anaesth. 1992;68:146–150.
65 Eichhorn JH. Effect of monitoring standards on anesthesia outcome. Int Anesthesiol Clin. 1993;31:181–196.
66 Moller JT, Pedersen T, Rasmussen LS, et al. Randomized evaluation of pulse oximetry in 20,802 patients. I. Design, demography, pulse oximetry failure rate, and overall complication rate. Anesthesiology. 1993;78:436–444.
67 Orkin FK, Cohen MM, Duncan PG. The quest for meaningful outcomes. Anesthesiology. 1993;78:417–422.
68 Pedersen T, Moller AM, Pedersen BD. Pulse oximetry for perioperative monitoring: Systematic review of randomized, controlled trials. Anesth Analg. 2003;96:426–431.
69 Pedersen T, Dyrlund Pedersen B, Moller AM. Pulse oximetry for perioperative monitoring. Cochrane Database Syst Rev. (3):2003. CD002013
70 Tobin MJ. Respiratory monitoring during mechanical ventilation. Crit Care Clin. 1990;6:679–709.
71 Kidd JF, Vickers MD. Pulse oximeters: Essential monitors with limitations. Br J Anaesth. 1989;62:355–357.
72 Tobin MJ. Respiratory monitoring in the intensive care unit. Am Rev Respir Dis. 1988;138:1625–1642.
73 Choe H, Tasiro C, Fukumitsu K, et al. Comparison of recorded values from six pulse oximeters. Crit Care Med. 1989;17:678–681.
74 Hannhart B, Haberer JP, Saunier C, et al. Accuracy and precision of fourteen pulse oximeters. Eur Respir J. 1991;4:115–119.
75 Severinghaus JW, Naifeh KH. Accuracy of response of six pulse oximeters to profound hypoxia. Anesthesiology. 1987;67:551–558.
76 Severinghaus JW, Naifeh KH, Koh SO. Errors in 14 pulse oximeters during profound hypoxemia. J Clin Monit. 1989;5:72–81.
77 Tremper KK, Barker SJ. Pulse oximetry. Anesthesiology. 1989;70:98–108.
78 West P, George CF, Kryger MH. Dynamic in vivo response characteristics of three oximeters: Hewlett-Packard 47201A, Biox III, and Nellcor N-100. Sleep. 1987;10:263–271.
79 Ralston AC, Webb RK, Runciman WB. Potential errors in pulse oximetry. Anaesthesia. 1991;46:291–295.
80 van Oostrom JH, Mahla ME, Gravenstein D. The Stealth Station image guidance system may interfere with pulse oximetry. Can J Anesth. 2005;52:379–382.
81 Mathes AM, Kreuer S, Schneider SO, et al. The performance of six pulse oximeters in the environment of neuronavigation. Anesth Analg. 2008;107:541–544.
82 Guan Z, Baker K, Sandberg WS. Misalignment of disposable pulse oximeter probes results in false saturation readings that influence anesthetic management. Anesth Analg. 2009;109:1530–1533.
83 Kuroda M, Dawamoto M, Yuge O. Undisrupted pulse wave on pulse oximeter display monitor at cardiac arrest in surgical patient. J Anesth. 2005;19:164–166.
84 Langton JA, Hanning CD. Effect of motion artefact on pulse oximeters: Evaluation of four instruments and finger probes. Br J Anaesth. 1990;65:564–570.
85 Plummer JL, Ilsley AH, Fronsko RRL, et al. Identification of movement artifact by the Nellcor N-200 and N-3000 pulse oximeters. J Clin Monit. 1997;13:109–113.
86 Moller JT, Johannessen NW, Espersen K, et al. Randomized evaluation of pulse oximetry in 20,802 patients. II. Perioperative events and postoperative complications. Anesthesiology. 1993;50:445–453.
87 Lawless ST. Crying wolf: False alarms in a pediatric intensive care unit. Crit Care Med. 1994;22:981–985.
88 Visram AR, Jones RDM, Irwin MG, et al. Use of two oximeters to investigate a method of movement artifact rejection using plethysmographic signals. Br J Anaesth. 1994;72:388–392.
89 Barker SJ, Shah NK. The effects of motion on the performance of pulse oximeters in volunteers. Anesthesiology. 1997;86:101–108.
90 Baker SJ. Motion-resistant pulse oximetry: A comparison of new and old models. Anesth Analg. 2002;95:967–972.
91 Hay WW, Rodden DJ, Collins SM, et al. Pulse oximetry in the NICU: Conventional vs Masimo SET. Pediatr Res. 1999;45:304A.
92 Bohnhorst B, Peter CS, Poets CF. Pulse oximeter’s reliability in detecting hypoxemia and bradycardia: Comparison between a conventional and two new generation oximeters. Crit Care Med. 2000;28:1565–1568.
93 Durbin CG, Rostow SK. More reliable oximetry reduces the frequency of arterial blood gas analyses and hastens oxygen weaning after cardiac surgery: A prospective, randomized trial of the clinical impact of a new technology. Crit Care Med. 2002;30:1735–1740.
94 Petterson MT, Begnoche VL, Graybeal JM. The effect of motion on pulse oximetry and its clinical significance. Anesth Analg. 2007;105:S78–S84.
95 Barker SJ, Tremper KK. The effect of carbon monoxide inhalation on pulse oximetry and transcutaneous PO2. Anesthesiology. 1987;66:677–679.
96 Barker SJ, Tremper KK, Hyatt J. Effects of methemoglobinemia on pulse oximetry and mixed venous oximetry. Anesthesiology. 1989;70:112–117.
97 Rodgers PA, Vreman HJ, Dennery PA, et al. Sources of carbon monoxide (CO) in biological systems and applications of CO detection technologies. Semin Perinatol. 1994;18:2–10.
98 Sjöstrand T. Endogenous formation of carbon monoxide in man under normal and pathological conditions. Scand J Clin Lab Invest. 1949;1:201.
99 Eisenkraft JB. Pulse oximeter desaturation due to methemoglobinemia. Anesthesiology. 1988;68:279–282.
100 Barker SJ, Curry J, Redford D, et al. Measurement of carboxyhemoglobin and methemoglobin by pulse oximetry, a human volunteer study. Anesthesiology. 2006;105:892–897.
101 Reddy AP, Zaremba ML, Reddy SP. Noninvasive pulse CO-oximeter as a tool to detect smoking status in an outpatient setting [abstract]. Chest. 2007;132:490.
102 Plante T, Harris D, Savitt J, et al. Carboxyhemoglobin monitored by bedside continuous CO-oximetry. J Trauma. 2007;63:1187–1190.
103 Hostler D, Roth RN, Kaufman RE, et al. The incidence of carbon monoxide poisoning during CO alarm investigations. Prehosp Emerg Care. 2008;12:115.
104 Annabi EH, Barker SJ. Severe methemoglobin detected by pulse oximetry. Anesth Analg. 2009;108:898–899.
105 Soeding P, Deppe M, Gehring H. Pulse-oximetric measurement of prilocaine-induced methemoglobinemia in regional anesthesia. Anesth Analg. 2010;111:1065–1068.
106 Feiner JR, Bickler PE, Mannheimer PD. Accuracy of methemoglobin detection by pulse CO-oximetry during hypoxia. Anesth Analg. 2010;111:143–148.
107 Feiner JR, Bickler PE. Improved accuracy of methemoglobin detection by pulse CO-oximetry during hypoxia. Anesth Analg. 2010;111:1160–1167.
108 Barker SJ, Badal JJ. The measurement of dyshemoglobins and total hemoglobin by pulse oximeter. Curr Opin Anaesthesiol. 2008;21:805–810.
109 Macknet MR, Allard M, Applegate RL, et al. The accuracy of noninvasive and continuous total hemoglobin measurement by pulse CO-oximetry in human subjects undergoing hemodilution. Anesth Analg. 2010;111:1424–1426.
110 Miller RD, Ward TA, Shiboski SC, et al. A comparison of three methods of hemoglobin monitoring in patients undergoing spine surgery. Anesth Analg. 2011;112:858–863.
111 Ehrenfeld JM, Henneman JP, Sandberg WS. Impact of continuous and noninvasive hemoglobin monitoring on intraoperative blood loss. Anesthesiology. 2010. Available at http://www.masimo.com/pdf/cpub/SETBiblio/LAB6539A_Ehrenfeld.pdf accessed March
112 Ries AL, Prewitt LM, Johnson JJ. Skin color and ear oximetry. Chest. 1989;96:287–290.
113 Zeballos RJ, Weisman IM. Reliability of noninvasive oximetry in black subjects during exercise and hypoxia. Am Rev Respir Dis. 1991;144:1240–1244.
114 Veyckemans F, Baele P, Guillaume JE, et al. Hyperbilirubinemia does not interfere with hemoglobin saturation measured by pulse oximetry. Anesthesiology. 1989;70:118–122.
115 Reisner A, Shaltis PA, McCombie D, et al. Utility of photoplethysmogram in circulatory monitoring. Anesthesiology. 2008;108:950–958.
116 White PF, Boyle WA. Nail polish and oximetry. Anesth Analg. 1989;68:546–547.
117 Bickler PE, Feiner JR, Severinghaus JW. Effects of skin pigmentation on pulse oximeter accuracy at low saturation. Anesthesiology. 2005;102:715–719.
118 Feiner JR, Severinghaus JW, Bickler PE. Dark skin decreases the accuracy of pulse oximeters at low oxygen saturation: The effects of oximeter probe type and gender. Anesth Analg. 2007;105:518–523.
119 Lee S, Tremper KK, Barker SJ. Effects of anemia on pulse oximetry and continuous mixed venous hemoglobin saturation monitoring in dogs. Anesthesiology. 1991;75:118–122.
120 Vegfors M, Lindberg LG, Oberg PA, et al. The accuracy of pulse oximetry at two haematocrit levels. Acta Anaesthesiol Scand. 1992;36:454–459.
121 Fitzgerald RK, Johnson A. Pulse oximetry in sickle cell anemia. Crit Care Med. 2001;29:1803.
122 Clayton DG, Webb RK, Ralston AC, et al. A comparison of the performance of 20 pulse oximeters under conditions of poor perfusion. Anaesthesia. 1991;46:3–10.
123 Clayton DG, Webb RK, Ralston AC, et al. Pulse oximeter probes. Anaesthesia. 1991;46:260–265.
124 Mendelson Y, Yocum BL. Noninvasive measurement of arterial oxyhemoglobin saturation with a heated and a non-heated skin reflectance pulse oximeter sensor. Biomed Instrum Technol. 1991;25:472–480.
125 Borum S. Transesophageal pulse oximetry for monitoring patients with extensive burn injury. Anesthesiology. 1998;88:1416–1417.
126 Kyriacou PA, Powell SL, Jones DP, et al. Evaluation of oesophageal pulse oximetry in patients undergoing cardiothoracic surgery. Anaesthesia. 2003;58:422–427.
127 Vicenzi M, Gombotz H, Krenn H, et al. Transesophageal versus surface pulse oximetry in intensive care unit patients. Crit Care Med. 2000;28:2268–2270.
128 Wax DB, Rubin P, Neustein S. A comparison of transmittance and reflectance pulse oximetry during vascular surgery. Anesth Analg. 2009;109:1847–1849.
129 Phillips JP, Kyriacou PA, Jones DP, et al. Pulse oximetry and photoplethysmographic waveform analysis of the esophagus and bowel. Curr Opin Anaesthesiol. 2008;21:779–783.
130 Kyiacou PA, Jones DP, Langford RM, et al. A pilot study of neonatal and pediatric esophageal pulse oximetry. Anesth Analg. 2008;107:905–908.
131 East DE, Colditz PB. Intrapartum oximetry of the fetus. Anesth Anlag. 2007;105:S59–S65.
132 Dildy GA. Fetal pulse oximetry. Clin Obstet Gynecol. 2011;54:66–73.
133 Palve H, Vuori A. Accuracy of three pulse oximeters at low cardiac index and peripheral temperature. Crit Care Med. 1991;19:560–562.
134 Kober A, Scheck T, Lieba F, et al. The influence of active warming on signal quality of pulse oximetry in prehospital trauma care. Anesth Analg. 2002;95:961–966.
135 Stewart KG, Rowbottom SJ. Inaccuracy of pulse oximetry in patients with severe tricuspid regurgitation. Anaesthesia. 1991;46:668–670.
136 Lindo D, Browne D, Lindo J. Toe deformity from prolonged pulse oximetry. Arch Dis Child. 2002;87:533.
137 Murphy KG, Secunda JA, Rockhoff MA. Severe burns from pulse oximeter. Anesthesiology. 1990;73:358–359.
138 Wille J, Braams R, van Haren WH, et al. Pulse oximeter–induced digital injury: Frequency rate and possible causative factors. Crit Care Med. 2000;28:3555–3557.
139 Farber NE, McNeely J, Rosner D. Skin burn associated with pulse oximetry during perioperative photodynamic therapy. Anesthesiology. 1996;84:983–985.
140 Woehlck H, Herrmann D, Kaslow O. Safe use of pulse oximetry during verteporphin therapy. Anesth Analg. 2003;96:177–178.
141 Awad AA, Ghosbashy AM, Stout RG, et al. How does the plethysmogram derived from the pulse oximeter relate to arterial blood pressure in coronary artery bypass graft patients? Anesth Analg. 2001;93:1466.
142 Cook LB. Extracting arterial flow waveforms from pulse oximeter waveforms. Anaesthesia. 2001;56:551.
143 Golparvar M, Naddafnia H, Saghaei M. Evaluating the relationship between arterial blood pressure changes and indices of pulse oximetric plethysmography. Anesth Analg. 2002;95:1681–1690.
144 Lima AP, Beelen P, Bakker J. Use of a peripheral perfusion index derived from the pulse oximetry signal as a noninvasive indicator of perfusion. Crit Care Med. 2002;30:1210–1213.
145 Shamir M, Eidelman LA, Floman Y, et al. Pulse oximetry plethysmographic waveform changes in blood volume. Br J Anaesth. 1999;82:178–181.
146 Wisely NA, Cook LB. Arterial flow waveforms from pulse oximetry compared with measured Doppler flow waveforms. Anaesthesia. 2001;56:556–561.
147 Bendjelid K. The pulse oximetry plethysmographic curve revisited. Curr Opin Crit Care. 2008;14:348–353.
148 Natalini G, Rosano A, Franceschetti ME, et al. Variations in arterial blood pressure and photoplethysmography during mechanical ventilation. Anesth Analg. 2006;103:1182–1188.
149 Natalini G, Rosano A, Taranto M, et al. Arterial versus plethysmographic dynamic indices to test responsiveness for testing fluid administration in hypotensive patients: A clinical trial. Anesth Analg. 2006;103:1478–1484.
150 Michard F. Volume management using dynamic parameters: The good, the bad, and the ugly. Chest. 2005;128:1902–1903.
151 Maguire S, Rinehart J, Vakharia S, et al. Respiratory variation in pulse pressure plethysmographic waveforms: Intraoperative applicability in a North American academic center. Anesth Analg. 2011;112:94–96.
152 Wyffels PAH, Durnez PJ, Helderweirt J, et al. Ventilation-induced plethysmographic variations predict fluid responsiveness in ventilated postoperative cardiac surgery patients. Anesth Analg. 2007;105:448–452.
153 Feissel M, Teboul JL, Merlani P, et al. Plethysmographic dynamic indices predict fluid responsiveness in septic ventilated patients. Intensive Care Med. 2007;33:993–999.
154 Pizov R, Eden A, Bystritski D, et al. Arterial and plethysmographic waveform analysis in anesthetized patients with hypovolemia. Anesthesiology. 2010;113:83–91.
155 Landsverk SA, Hoiseth LO, Kvandal P, et al. Poor agreement between respiratory variations in pulse oximetry photoplethysmographic waveform amplitude and pulse pressure in intensive care patients. Anesthesiology. 2008;109:848–855.
156 Chen L, Reisner AT, Gribok A, et al. Is respiration-induced variation in the photoplethysomogram associated with major hypovolemia in patients with acute traumatic injuries? Shock. 2010;34:455–460.
157 McGrath SP, Ryan KL, Wendelken SM, et al. Pulse oximeter plethysmographic waveform changes in awake, spontaneously breathing, hypovolemic volunteers. Anesth Analg. 2011;112:368–374.
158 Desebbe O, Bocucau C, Farhat F, et al. The ability of the pleth variability index to predict the hemodynamic effects of positive end-expiratory pressure in mechanically ventilated patients under general anesthesia. Anesth Analg. 2010;110:792–798.
159 Cannesson M, Desebbe O, Rosamel P, et al. Pleth variability index to monitor the respiratory variations in the pulse oximeter plethysmographic waveform amplitude and predict fluid responsiveness in the operating theatre. Br J Anaesth. 2008;101:200–206.
160 Forget P, Lois F, de Kock M. Goal-directed fluid management based on the pulse oximeter-derived pleth variability index reduces lactate levels and improves fluid management. Anesth Analg. 2010;111:910–914.
161 Loupec T, Nanadormga H, Frasca D, et al. Pleth variability index predicts fluid responsiveness in critically ill patients. Crit Care Med. 2011;39:294–299.
162 Zimmermann M, Feibicke T, Keyl C, et al. Accuracy of stroke volume variation compared with pleth variability index to predict fluid responsiveness in mechanically ventilated patients undergoing major surgery. Eur J Anaesthesiol. 2010;27:555–561.
163 Taenzer AH, Pyke JB, McGrath SP, et al. Impact of pulse oximetry surveillance on rescue events and intensive care unit transfers: A before and after concurrence study. Anesthesiology. 2010;112:282–287.
164 Morley TF. Capnography in the intensive care unit. J Intensive Care Med. 1990;5:209–223.
165 Niehoff J, DelGuercio C, LaMorte W, et al. Efficacy of pulse oximetry and capnometry in postoperative ventilatory weaning. Crit Care Med. 1988;16:701–705.
166 Szaflarski NL, Cohen NH. Use of capnography in critically ill adults. Heart Lung. 1991;20:363–372.
167 Davis DP, Dunford JV, Poste JC, et al. The impact of hypoxia and hyperventilation on outcome after paramedic rapid sequence intubation of severely head-injured patients. J Trauma. 2004;57:1–10.
168 Warner KJ, Cuschieri J, Copass MK, et al. Emergency department ventilation effects outcome in severe traumatic brain injury. J Trauma. 2008;64:341–347.
169 Warner KJ, Cuschieri J, Garland B, et al. The utility of early end-tidal capnography in monitoring ventilation status after severe injury. J Trauma. 2009;66:26–31.
170 Lee SW, Hong YS, Han C, et al. Concordance of end-tidal carbon dioxide and arterial carbon dioxide in severe traumatic brain injury. J Trauma. 2009;67:526–530.
171 Viven B, Amour J, Nicolas-Robin A, et al. An evaluation of capnography monitoring during the apnoea test in brain-dead patients. Eur J Anaesth. 2007;24:868–875.
172 Kallet RH, Katz JA. Respiratory system mechanics in acute respiratory distress syndrome. Respir Care Clin North Am. 2003;9:321–341.
173 Bekos V, Marini JJ. Monitoring the mechanically ventilated patient. Crit Care Clin. 2007;23:575–611.
174 Pedersen T, Viby-Mogensen J, Ringsted C. Anaesthetic practice and postoperative pulmonary complications. Acta Anaesthesiol Scand. 1992;36:812–818.
175 Stenqvist O. Practical assessment of respiratory mechanics. Br J Anaesth. 2003;91:92–105.
176 Fowler WS. Lung function studies. II. The respiratory dead space. J Appl Physiol. 1948;154:405–416.
177 Banner MJ, Jaeger MJ, Kirby RR. Components of the work of breathing and implication for monitoring ventilator-dependent patients. Crit Care Med. 1994;22:515–523.
178 Nunn JF, Hill DW. Respiratory dead space and arterial to end-tidal CO2 tension difference in anesthetized man. J Appl Physiol. 1960;15:383–389.
179 de Chazal I, Hubmayr RD. Novel aspects of pulmonary mechanics in intensive care. Br J Anaesth. 2003;91:81–91.
180 Fowler WS. Lung function studies. IV. Postural changes in respiratory dead space and functional residual capacity. J Clin Invest. 1950;29:1437–1438.
181 Nunn JF. Nunn’s applied respiratory physiology. Oxford, UK: Butterworth-Heinemann; 1993.
182 Krieger BP, Ershowsky PF, Becker DA, et al. Evaluation of conventional criteria for predicting successful weaning from mechanical ventilatory support in elderly patients. Crit Care Med. 1989;17:858–861.
183 Von Pohle WR, Anholm JD, McMillan J. Carbon dioxide and oxygen partial pressure in expiratory water condensate are equivalent to mixed expired carbon dioxide and oxygen. Chest. 1992;101:1601–1604.
184 Crossman PF, Bushnell LS, Hedley-Whyte J. Dead space during artificial ventilation: Gas compression and mechanical dead space. J Appl Physiol. 1970;28:94–97.
185 Watson WE. Observations on physiological deadspace during intermittent positive pressure respiration. Br J Anaesth. 1962;34:502–508.
186 Selecky PA, Wasserman K, Klein M, et al. A graphic approach to assessing interrelationships among minute ventilation, arterial carbon dioxide tension, and ratio of physiologic deadspace to tidal volume in patients on respirators. Am Rev Respir Dis. 1978;117:181–184.
187 Jones NL, Robertson DG, Kane JW. Difference between end-tidal and arterial PCO2 in exercise. J Appl Physiol. 1979;47:954–960.
188 Robbins PA, Conway J, Cunningham DA, et al. A comparison of indirect methods for continuous estimation of arterial PCO2 in men. J Appl Physiol. 1990;68:1727–1731.
189 Yamanaka MK, Sue DY. Comparison of arterial-end-tidal PCO2 difference and dead space/tidal volume ratio in respiratory failure. Chest. 1987;92:832–835.
190 Pansard JL, Cholley B, Devilliers C, et al. Variation in arterial to end-tidal CO2 tension differences during anesthesia in the “kidney rest” lateral decubitus position. Anesth Analg. 1992;75:506–510.
191 Nuckton TJ, Alonso JA, Kallet RH, et al. Pulmonary dead-space fraction as a risk factor for death in the acute respiratory distress syndrome. N Engl J Med. 2002;346:1281–1286.
192 Cepkova M, Kapur V, Ren X, et al. Pulmonary dead space fraction and pulmonary artery systolic pressure as early predictors of clinical outcome in acute lung injury. Chest. 2007;132:836–842.
193 Frankenfield DC, Alam S, Bekteshi E, et al. Predicting dead space ventilation in critically ill patients using clinically available data. Crit Care Med. 2010;38:288–291.
194 Verschuren F, Liistro G, Coffeng R, et al. Volumetric capnography as a screening test for pulmonary embolism. Chest. 2004;125:841–850.
195 Bohm SH, Maisch S, von Sandersleben A, et al. The effects of lung recruitment on the phase III slope of volumetric capnography in morbidly obese patients. Anesth Analg. 2009;109:151–159.
196 Haberthur C, Lichtwarck-Aschoff M, Guttmann J. Continuous monitoring of tracheal pressure including spot-check of endotracheal tube resistance. Technol Health Care. 2003;11:413–424.
197 Fernandez R, Benito S, Blanch LI, et al. Intrinsic PEEP: A cause of inspiratory muscle ineffectivity. Intensive Care Med. 1988;15:51–52.
198 De Wit M, Miller KB, Green DA, et al. Ineffective triggering predicts increased duration of mechanical ventilation. Crit Care Med. 2009;37:2740–2745.
199 Hess DR. Ventilator waveforms and the physiology of pressure support ventilation. Respir Care. 2005;50:166–186.
200 Fernandez-Perez ER, Hubmayr RD. Interpretation of airway pressure waveforms. Intensive Care Med. 2006;32:658–659.
201 Kondili E, Xirouchaki N, Georgopoulos D. Modulation and treatment of patient-ventilator dyssynchrony. Curr Opin Crit Care. 2007;13:84–89.
202 Georgopoulos D, Prinianakis G, Kondili E. Bedside waveform interpretation as a tool to identify patient-ventilator asynchronies. Intensive Care Med. 2006;32:34–47.
203 Nilsestuen O, Hargett KD. Using ventilator graphics to identify patient-ventilator asynchrony. Respir Care. 2005;50:202–234.
204 Blanch L, Bernabe F, Lucangelo U. Measurement of air trapping, intrinsic positive end-expiratory pressure, and dynamic hyperinflation in mechanically ventilated patients. Respir Care. 2005;50:110–123.
205 Pohlman MC, McCallister KE, Schweickert WD, et al. Excessive tidal volume from breath stacking during lung-protective ventilation for acute lung injury. Crit Care Med. 2008;36:3019–3023.
206 Lewis WD, Chwals W, Benotti PN, et al. Bedside assessment of work of breathing. Crit Care Med. 1988;16:117–122.
207 Miwa K, Mitsuoka M, Takamori S, et al. Continuous monitoring of oxygen consumption in patients undergoing weaning from mechanical ventilation. Respiration. 2003;70:623–630.
208 Yang KL, Tobin MJ. A prospective study of indexes predicting the outcome of trials of weaning from mechanical ventilation. N Engl J Med. 1991;324:1445–1450.
209 Lee KH, Hui KP, Chan TB, et al. Rapid shallow breathing (frequency-tidal volume ratio) did not predict extubation outcome. Chest. 1994;105:540–543.
210 Yang KL. Reproducibility of weaning parameters—A need for standardization. Chest. 1992;102:1829–1832.
211 Fernandez R, Raurich JM, Mut T, et al. Extubation failure: Diagnostic value of occlusion pressure (P0.1) and P0.1-derived parameters. Intensive Care Med. 2004;30:234–240.
212 Montgomery AB, Holle RHO, Neagley SR, et al. Prediction of successful ventilatory weaning using airway occlusion pressure and hypercapnic challenge. Chest. 1987;91:496–499.