Chapter 8 Monitoring
Monitoring, particularly of the cardiovascular and respiratory systems, is an integral part of the care of critically ill patients. Advances in technology have resulted in the widespread use of integrated monitoring systems capable of displaying multiple parameters simultaneously on bedside screens. Although most observers would agree that patient care is improved by sophisticated monitoring, it has proven difficult to confirm this objectively. For instance, the value of pulse oximetry is almost universally accepted, but a large randomized trial involving more than 20,000 patients was unable to demonstrate a survival benefit from using this monitoring tool.1,2 Thus, it is not surprising that for complex, user-dependent monitors such as echocardiography and the pulmonary artery catheter (PAC), an outcome benefit has not been clearly demonstrated and, at least in the case of the PAC, considerable controversy has resulted regarding its ongoing use.3–5
In this chapter, a number of monitors that are used in the intensive care unit (ICU) are discussed. Additional topics are discussed elsewhere: blood gas monitoring in Chapter 31; respiratory monitoring in Chapter 27; echocardiography in Chapter 7; neuromuscular monitoring in Chapter 4; and routine postoperative monitoring in Chapter 17. The techniques of insertion and the complications of intravascular catheters are outlined in Chapter 40.
PULSE OXIMETRY
Despite the absence of a demonstrable survival advantage, pulse oximetry has been identified as the single most useful monitor for the prevention of adverse patient events,6 and it is used routinely on virtually all patients in the ICU. Pulse oximetry utilizes the fact that the absorption spectra of blood vary depending on its oxygen saturation: oxygenated blood appears red, and deoxygenated blood appears blue. A standard oximeter probe contains two light-emitting diodes: one that emits red light (wavelength 660 nm) and one that emits near-infrared light (wavelength 940 nm). The ratio of light absorption at the two wavelengths is detected and used to calculate oxygen saturation. Light that passes through tissues is absorbed by arterial blood, capillary blood, venous blood, and nonblood components (bone, muscle, etc.). By eliminating the nonpulsatile component of light absorption, the oxygen saturation of arterial blood can be estimated. Arterial oxygen saturation obtained from a pulse oximeter is designated SPO2 to distinguish it from arterial oxygen saturation obtained from a blood gas analyzer, which is designated Sao2. In addition to SPo2, pulse oximeters measure heart rate and generate a pulse waveform, which provides a crude measure of peripheral perfusion. These secondary functions are useful when the pulse oximeter is used as the sole monitor.
Despite the obvious advantages of being able to rapidly and noninvasively assess arterial oxygen saturation, it must be remembered that pulse oximetry does not guarantee the adequacy of either oxygen delivery (see Equation 1-14) or ventilation (see Equation 1-17). In the presence of profound anemia, marked tissue hypoxemia can arise despite a normal SPo2. In patients to whom supplemental oxygen is being administered, profound hypoventilation and respiratory acidosis can be present in spite of a normal SPo2.
ELECTROCARDIOGRAPHY
The electrocardiograph (ECG) is essential for the diagnosis of cardiac arrhythmias and is extremely useful for the identification of myocardial ischemia and infarction. Also, specific ECG abnormalities provide supporting evidence for a wide range of cardiac disorders. The physiologic basis of the ECG and its relationship to the action potential is discussed in Chapter 1. Specific ECG abnormalities are covered in the relevant chapters, particularly 8 and 21.
Leads and Electrodes
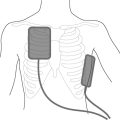
The standard 12-lead ECG involves the placement of 10 electrodes on the patient in specific positions: one on each limb and six across the chest (Fig. 8-1). To ensure good contact between skin and electrode, the skin should be first cleaned with alcohol, gently abraded with fine sandpaper and, if necessary, shaved. From these 10 electrodes, 12 leads are recorded. A lead is obtained by recording the difference in electrical potential between two electrodes. Leads may be either bipolar or unipolar. With a bipolar lead, the signal is obtained from two active electrodes: one connected to the positive pole and one connected to the negative terminal of the ECG machine. With a unipolar lead, the signal is obtained using one active electrode (connected to the positive pole of the ECG machine) and an indifferent electrode, recorded at zero potential by connecting two or three limb electrodes through a resistor to the negative terminal of the electrocardiograph.
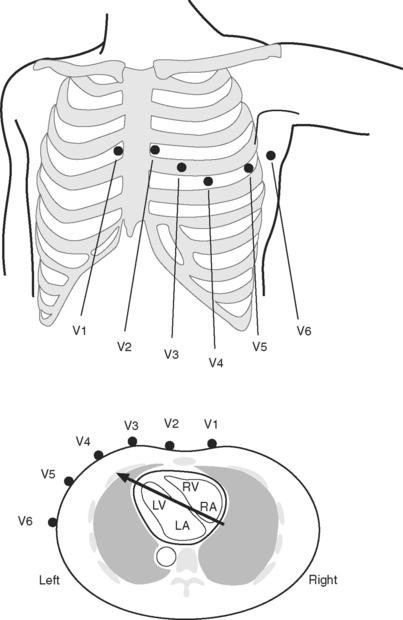
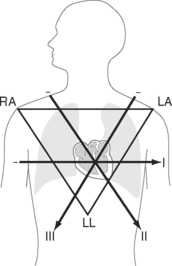
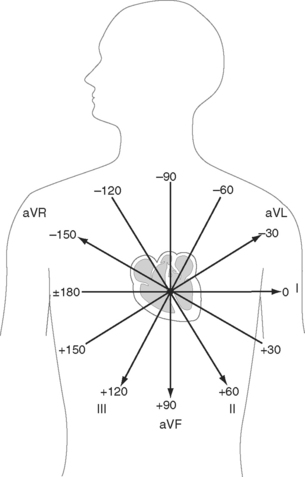
Six leads view the heart in the frontal plane (I, II, III, aVR, aVL, aVF) and six leads (V1 through V6) view the heart in the horizontal plane. The three standard leads (I, II, III) are bipolar leads; each lead records the potential difference between two limbs (Fig. 8-2). The augmented limb leads (aVR, aVL, aVF) are unipolar leads that record the potential difference between one limb and an indifferent composite electrode: aVR is obtained from the right arm; aVL from the left arm, and aVF from the left leg. The standard and augmented limb leads record the magnitude of the electrical signal in specific directions within the frontal plane, as shown in Fig. 8-3. The chest leads are unipolar leads that record the potential difference between the surface of the chest and an indifferent composite electrode. The orientation of the chest leads to the heart in the horizontal plane is shown in Figure 8-1.
Types of Electrocardiograms: 12-Lead, 5-Lead, and 3-Lead Systems
For accurate diagnosis of myocardial ischemia or cardiac arrhythmias, a standard 12-lead ECG should always be obtained. In patients who have undergone recent cardiac surgery, the sternal dressing may preclude obtaining leads V1, V2, and V3. For continuous ECG monitoring in the intensive care unit (ICU) or coronary care unit it is usual to use a 5-electrode system involving electrodes attached to each of the four limbs and a chest electrode attached at the V5 position. For convenience and to reduce motion artifact, the limb leads are normally placed on the shoulders and hips. From these five electrodes, seven leads can potentially be obtained (I, II, III, aVR, aVL, aVF, V5); it is usual to display simultaneously leads II and V5 on the patient monitor. (Somewhat confusingly, this arrangement is commonly referred to as a 5-lead ECG.) P waves are usually most clearly identified in lead II, therefore this lead is usually the best for diagnosing cardiac arrhythmias. V5 is the most sensitive lead for diagnosing myocardial ischemia.
Interpretation of the 12-Lead ECG
ECGs are recorded onto a grid pattern composed of large and small squares. Large squares have dimensions of 5 mm by 5 mm and represent 0.5 mV on the vertical axis and 0.2 sec on the horizontal axis, assuming standard sweep and gain settings. Small squares have dimensions of 1 mm by 1 mm and represent 0.04 sec in the horizontal axis and 0.1 mV in the vertical axis. The various components of an individual ECG complex are shown in Figure 8-4. A normal 12-lead ECG is shown in Figure 8-5.
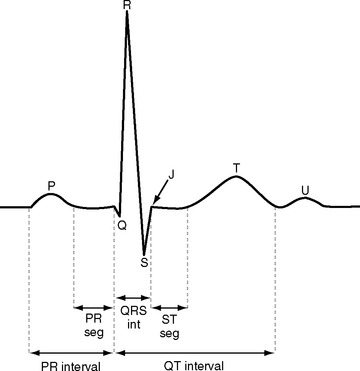
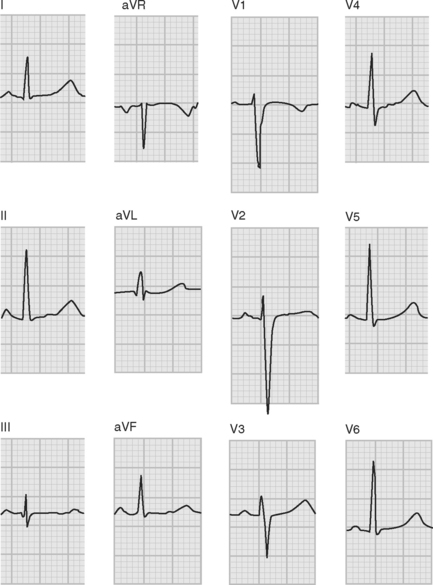
Figure 8.5 A normal 12-lead ECG. The frontal plane axis is 30 degrees; see text for details.
(Image modified from Wagner GS: Marriot’s Practical Electrocardiography, ed. 9. Fig. 2.10, p. 30. Philadelphia, Lippincott Williams and Wilkins, 1994.)
PR Interval
The normal PR interval is 0.10 to 0.22 seconds and is determined by the speed of conduction through the atrioventricular node. The PR interval varies inversely with heart rate and gradually lengthens with increasing age. A short PR interval is seen in some preexcitation syndromes, and a long PR interval is seen in first-degree and Wenckebach-type second-degree heart block (see Chapter 21).
QRS
The Q wave is a small negative deflection that precedes the R wave. Small Q waves (<0.03 seconds in duration) are a normal finding in all leads except V1 through V3, where they are always pathologic. Q waves of any size may be normal in leads III and aVR. Pathologic Q waves are indicative of transmural myocardial infarction (see Chapter 18). They develop within a few hours of infarction and are permanent.
QRS Axis
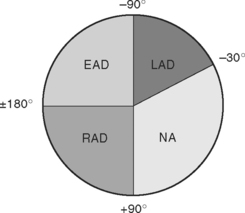
The net direction of current flow in the heart at any moment can be represented as a vector. If the vector is directed toward a particular lead during ventricular depolarization, the QRS complex is predominantly positive (R wave > S wave). If the vector is directed away from that lead, the QRS is predominantly negative (S wave > R wave). If the vector is perpendicular to the lead, the R wave and S wave are equal. The direction of depolarization through the ventricles in the frontal plane is called the QRS axis and is determined by examination of the six limb leads (I, II, III, aVL, aVR, aVF). The following steps can be used to determine the frontal-plane QRS axis (see Fig. 8-3):
Figure 8-6 shows the normal range for the frontal-plane QRS axis along with the criteria for the diagnosis of left, right, and extreme axis deviation. Common causes of axis deviation are listed in Table 8-1.
| Left Axis Deviation |
| Left anterior hemiblock (Table 21-1) |
| Inferior myocardial infarction |
| COPD |
| Left ventricular hypertrophy |
| Wolff-Parkinson-White syndrome |
| Right Axis Deviation |
| Left posterior hemiblock (Table 21-1) |
| Right ventricular hypertrophy (including COPD) |
| Lateral or apical myocardial infarction |
| Wolff-Parkinson-White syndrome |
| Extreme Axis Deviation (rare) |
| Practical |
| Ventricular tachycardia |
| Right ventricular hypertrophy |
| Apical myocardial infarction |
| Hyperkalemia |
COPD, chronic obstructive pulmonary disease.
Ventricular Hypertrophy and Strain
Given that the net direction of current flow during ventricular systole is from the base to the apex of the heart and is dominated by the left ventricle, then based on Figure 8-1 it can be appreciated that the QRS complexes in leads V1 and V2 are normally negative, and the QRS complexes in leads V5 and V6 are normally positive. With right ventricular hypertrophy, the electrical axis in the horizontal plane shifts rightward, resulting in a progressive increase in R wave amplitude in leads V1 and V2 such that with severe right ventricular hypertrophy, the QRS becomes positive in these leads. In contrast, with left ventricular hypertrophy there is accentuation of the normally dominant R wave in V5 and V6 and the development of deep S waves in V1 and V2. Ventricular hypertrophy may also result in ST segment depression and T wave inversion (strain pattern), which may be difficult to distinguish from ischemia. The ECG findings in right and left ventricular hypertrophy are summarized in Table 8-2.
| Abnormality | Left Ventricular Hypertrophy | Right Ventricular Hypertrophy |
|---|---|---|
| QRS conduction | Partial or complete left bundle branch block | Partial or complete right bundle branch block |
| Strain pattern (ST segment depression and T wave inversion) | Leads V3-V6 | Leads V1-V3 |
| Vertical plane | Leftward shift in QRS axis | Rightward shift in QRS axis |
| Horizontal plane | Large S waves in V2 and V3 | Large R waves in V1 and V2 with severe hypertrophy, the QRS complex may become positive |
| Large R waves in V5 and V6 | ||
| Atrial hypertrophy | P-mitrale: bifid P waves in II, II, aVF | P-pulmonale: peaked P waves in II, II, aVF |
ST Segment
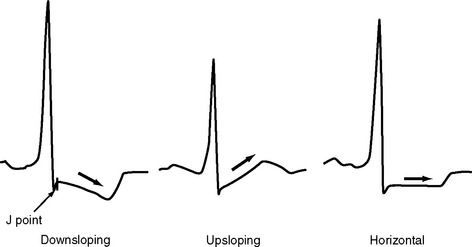
The ST segment is measured from the J point (the point where the ST segment meets the QRS complex) to the beginning of the T wave (see Fig. 8-4). Slight (<1 mm) upsloping, downsloping, or horizontal ST segment depression is a normal variant. Up to 4 mm of ST segment elevation in leads V1 through V3 may also be a normal finding, especially in young males.
Pathologic ST segment elevation may indicate myocardial infarction, left ventricular aneurysm, pericarditis, or bundle branch block. With myocardial infarction, ST segment elevation usually develops within a few minutes and resolves within 24 to 48 hours. The distribution of ST segment elevation can be used to help localize the zone of infarction (see Chapter 18). ST segment elevation across a wide range of leads is common following cardiac surgery and probably represents a pericardial reaction. A clue to this diagnosis is that the ST segment elevation is usually mild and is not limited to a specific coronary territory.
ST segment depression is commonly associated with myocardial ischemia but is also seen with ventricular strain, digoxin therapy, hypokalemia, and conduction abnormalities such as bundle branch block. Mild upsloping ST segment depression is seen with tachycardia. ST segment depression due to ischemia is typically horizontal or downsloping (Fig. 8-7). Upsloping ST depression is not usually indicative of ischemia. Unlike ST segment elevation, the distribution of ST segment depression does not reliably localize the region of ischemia.

Automated ST Segment Monitoring
Most integrated patient monitors have the capability of performing continuous ST segment analysis. The height of the ST segment is measured at some predetermined distance after the J point and is reported as millimeters of positive or negative deviation, with trends over time usually displayed graphically. A low-frequency filter limit of 0.05 Hz is required for accurate ST segment analysis. Automated ST segment analysis has a high degree of agreement with a 12-lead ECG reported by a cardiologist7 and may be useful in detecting clinically and hemodynamically silent myocardial ischemia.
INVASIVE ARTERIAL PRESSURE MONITORING
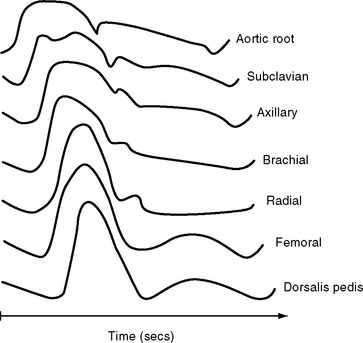
The determinants of the arterial pressure are complex, but in essence, mean arterial pressure (MAP) is determined mainly by stroke volume and systemic vascular resistance, and pulse pressure is determined mainly by stroke volume and arterial compliance. The normal arterial pressure waveform changes in shape as it progresses through the arterial tree (Fig. 8-8) due to alterations in the arterial compliance and reflected pressure waves from the periphery.
Abnormal Waveforms
Cardiac Disease
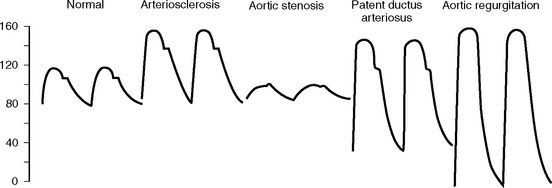
With aortic regurgitation, the reflux of blood back into the left ventricle during diastole results in a low diastolic pressure. Stroke volume is increased due to overfilling of the left ventricle. These effects result in an increased systolic peak and widened pulse pressure (Fig. 8-9). A widened pulse pressure with diastolic hypotension also occurs in pregnancy, patent ductus arteriosus, and vasodilatation. Conditions associated with a low stroke volume, such as pericardial tamponade and cardiogenic shock, result in a narrow pulse pressure, which can be easily mistaken for a problem with the arterial catheter. Aortic stenosis is associated with a slow upstroke and a narrow pulse pressure (see Fig. 8-9). Alterations in the arterial pressure waveform due to an intraaortic balloon pump are described in Chapter 22.
Respiratory Changes
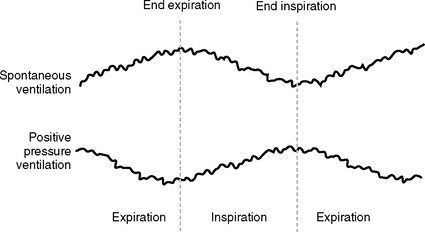
During normal breathing there is a slight fall in systolic pressure with inspiration (mainly due to pooling of blood within the pulmonary circulation) and a slight increase in systolic pressure during expiration. With positive pressure ventilation, systolic pressure normally increases slightly during late inspiration (due to enhanced left ventricular emptying as a result of reduced afterload and direct chamber compression) and falls slightly during late expiration. Large fluctuations (>10 to 15 mmHg) in systolic pressure with respiration are termed pulsus paradoxus (Fig. 8-10). Pulsus paradoxus is associated with a number of conditions encountered in the ICU, including hypovolemia, cardiac tamponade, raised intrathoracic pressure (bronchospasm, pneumothorax, ventilator dysynchrony), raised intraabdominal pressure, and extreme obesity. Pulsus paradoxus is predictive of fluid responsiveness (see later material).

CENTRAL VENOUS PRESSURE MONITORING
Determinants of Central Venous Pressure
Central venous pressure (CVP) is the pressure within the right atrium; it is determined by the balance between systemic venous return and right ventricular output. Thus, CVP is determined by blood volume, peripheral venous tone, intrathoracic pressure, and right ventricular systolic and diastolic function. CVP is widely used as an index of left ventricular preload. However, using CVP for this purpose requires caution. In patients with abnormal left or right ventricular function, changes in right atrial pressure may not change in parallel with changes in left atrial pressure which, in turn, may not reflect changes in left ventricular end-diastolic volume (LVEDV; preload; see later material). In certain situations, CVP and preload may actually change in opposite directions. For instance, with raised intrathoracic pressure (e.g., due to ventilator dysynchrony) or raised intrapericardial pressure (e.g., tamponade) CVP is high despite low left ventricular preload. Even in patients with normal ventricular function, the use of the CVP is limited by the high compliance of the right ventricle, such that over the physiologic range of right ventricular end-diastolic volumes, there is only a modest change in CVP (Figure 1-9).
Interpreting Central Venous Pressure
The Waveform
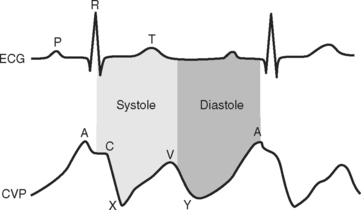
The CVP waveform is explained in Figure 8-11. Atrial fibrillation results in loss of the A wave, whereas atrial flutter causes regular flutter A waves on the CVP trace. Atrioventricular dissociation or junctional rhythm with retrograde atrial conduction can cause large (cannon) A waves due to atrial contraction occurring against a closed tricuspid valve. Irregular cannon waves are seen with atrioventricular dissociation; regular cannon waves, occurring with each heartbeat, are seen with junctional rhythm. Tricuspid regurgitation may cause exaggerated ventricular (V) waves due to elevated atrial pressure during ventricular systole.
Values for Central Venous Pressure in Cardiac Surgery Patients
Although there is no absolute value for CVP that predicts fluid responsiveness,8,9 the following comments are generally true. First, if cardiac function is relatively normal, a CVP of 6 to 12 mmHg is appropriate for most cardiac surgery patients during their early postoperative course. Second, a CVP greater than 15 mmHg is usually indicative of a significant cardiac or respiratory problem and warrants investigation (see Chapter 20). Third, a patient who has a CVP less than 6 mmHg but is otherwise stable requires no intervention. Finally, trends in CVP in response to a fluid challenge are more useful than absolute values. In hypovolemic patients, the usual response to a fluid bolus is a sustained increase in MAP and cardiac output with no change, or only a transient increase, in CVP. The causes of increased CVP are listed in Table 8-3.
| Hypervolemia |
| Increased venous tone |
| Right ventricular systolic dysfunction |
| Right ventricular diastolic dysfunction |
| Elevated pulmonary vascular resistance |
| Severe left ventricular dilatation causing impairment of right ventricular diastolic filling |
| Tricuspid valve stenosis or regurgitation |
| Pulmonary valve stenosis |
| High pericardial pressure (tamponade, constriction) |
| High intrathoracic pressure (ventilatory dysynchrony, bronchospasm, pneumothorax) |
| High intraabdominal pressure |
Respiratory Changes in Central Venous Pressure
The CVP normally fluctuates slightly throughout the respiratory cycle. With positive pressure ventilation, CVP increases slightly during inspiration and falls during expiration (see Fig. 8-10). These changes are reversed with normal spontaneous breathing. An inspiratory fall in CVP of more than 1 mmHg has been shown to be predictive of fluid responsiveness in extubated patients.8 However, respiratory variations in CVP can also occur with abnormal patterns of breathing. In particular, large respiratory swings in CVP are seen in patients with partial airway obstruction, chronic obstructive airways disease, and marked obesity. CVP is often very difficult to interpret in grossly obese patients, particularly following extubation.
THE PULMONARY ARTERY CATHETER
The balloon-tipped, flow-directed PAC was originally described by Swan and Ganz in 1970,10 and it remains in widespread use today. Multiple measured and derived variables can be obtained from a PAC. Measured parameters are: (1) CVP; (2) pulmonary artery pressure; (3) pulmonary artery wedge pressure (PAWP); (4) stroke volume and cardiac output; (5) mixed venous oxygen saturation (Svo2); (6) right ventricular ejection fraction (some catheters only); (7) temperature. Some PACs provide continuous measurements of cardiac output and Svo2. Derived values include the transpulmonary gradient, pulmonary and systemic vascular resistances (Equations 1-5 and 1-6), and left and right ventricular stroke work. Cardiac output and vascular resistances are usually indexed to body-surface area.
In the following section the interpretation of PAWP and cardiac output are discussed. The implications of raised pulmonary artery pressure and the transpulmonary gradient are discussed in Chapter 24. SVo2 is discussed in Chapter 1.
Benefits, Risks, and Indications for Pulmonary Artery Catheterization
The indications for pulmonary artery catheterization are contentious, and utilization rates vary widely among institutions. There are a wealth of data examining the impact of pulmonary artery catheterization on patient outcome,11 but this literature is problematic for several reasons. Many studies are nonrandomized and retrospective. Even in randomized studies, including the recently reported, large, multicenter PAC-Man trial,12 PAC use often lacks protocol and involves heterogeneous groups of general ICU patients. The nonprotocolized use of PACs in these studies is problematic for two reasons. First, it is impossible to know how the PAC has influenced patient management. Second, because approximately half of the doctors using PACs are unable to derive simple information from them,13 inappropriate clinical decision making may have occurred in the patents randomized to receive PACs. Underlying all of the data, however, is the inherent difficulty in demonstrating an outcome benefit for any monitoring device (see earlier discussion).
By and large, trials involving heterogeneous groups of ICU patients in whom PAC use was not protocolized have failed to show a benefit or have demonstrated harm resulting from PACs. However, in selected high-risk surgical populations some, but not all, randomized trials have demonstrated a benefit for protocol-guided PAC use.14–17
PULMONARY ARTERY WEDGE PRESSURE
The PAWP waveform is obtained by inflating the balloon at the tip of the PAC such that flow beyond the balloon is interrupted (see Chapter 40). In this situation, the pressure recorded at the catheter tip should be the same as that within the left atrium. At end-diastole, when the mitral valve is open and diastolic filling has ceased, the wedge pressure is the same as the left ventricular end-diastolic pressure (LVEDP). LVEDP is used as a surrogate for LVEDV (preload). (The definition and determinants of preload are discussed in Chapter 1.) However, for PAWP to reflect preload accurately, several assumptions must hold true.
Assumptions
Assumption 1: Pulmonary Artery Wedge Pressure Is Equivalent to Left Atrial Pressure
For PAWP to be accurate, there must be a continuous static column of blood between the tip of the catheter and the left atrium, thus ensuring no pressure difference between the two sites. As outlined in Chapter 1, the lung is divided into three West zones, based on the distribution of pulmonary blood flow. Only when the tip of the PAC lies within West zone 3 (see Fig. 1-11) does a continuous column of blood exist between the tip of the catheter and the left atrium throughout the respiratory cycle. With positive pressure ventilation, areas of lung may alternate between West zones 2 and 3, being zone 2 during inspiration and zone 3 during expiration. This is one of the reasons PAWP is measured at end-expiration. A reduction in the proportion of lung that is in West zone 3 occurs with positive end-expiratory pressure and hypovolemia. When the patient is in the supine position, the majority of the pulmonary vascular bed is likely to be in zone 3. However, if the PAC is inserted when the patient is in the supine position and the patient is then sat upright, the catheter tip may no longer reside in zone 3. PAWP measurements recorded with the catheter tip in West zone 1 or 2 are highly influenced by intrathoracic pressure which, in mechanically ventilated patients, tends to result in an overestimation of left atrial pressure. The position of the catheter tip in a patient in the supine position cannot be determined by a chest radiograph. Clinical indicators of correct zone 3 placement include the presence of a well-defined PAWP trace, with easily identifiable A and V waves, the ability to aspirate blood from the distal lumen of a wedged catheter, and the fact that the PAWP should not be a greater value than the pulmonary artery end-diastolic pressure.
Assumption 3: Left Ventricular End-Diastolic Pressure and Volume Change in Parallel
In the normal heart, over the usual working range of left ventricular volume, the relationship between LVEDP and LVEDV is relatively linear (see Fig. 1-5). However, at high ventricular volumes, the curve becomes very steep such that a small increase in volume results in a large increase in pressure. In disease states affecting ventricular compliance, the diastolic pressure-volume curve may be shifted upward or downward, substantially changing the relationship between LVEDP and LVEDV (see Fig. 1-6).
Interpreting the Pulmonary Artery Wedge Pressure
Waveform
The PAWP waveform is similar to the CVP waveform shown in Figure 8-11. Abnormal waveforms are analogous to those described for the CVP: large V waves with mitral regurgitation and cannon A waves with nodal rhythm or complete heart block. Large A waves may also occur in patients with left ventricular diastolic dysfunction.
Measurement of the Pulmonary Artery Wedge Pressure
The technique of obtaining a PAWP waveform is described in Chapter 40. The PAWP is taken as the average value throughout the cardiac cycle, but if an abnormal waveform is present, the measurement should be timed to the A wave because that is when the mitral valve is open and LVEDV is equivalent to left atrial pressure. With respect respiratory oscillations in the waveform, PAWP is measured at end-expiration using a value averaged over several breaths. End-expiration occurs at the lowest point of the respiratory oscillation in ventilated patients and at the highest point in extubated patients (Fig. 8-12).
Values for Pulmonary Artery Wedge Pressure in Cardiac Surgery Patients
The usual range for PAWP in postoperative cardiac surgery patients is 6 to 15 mmHg, but there is no absolute value that predicts fluid responsiveness.8,9 Indeed, in the presence of diastolic dysfunction, patients may be fluid responsive despite having a PAWP of more than 18 mmHg.18 As with CVP, trends in PAWP in response to a fluid challenge are more useful than the absolute value. The causes of an elevated PAWP are listed in Table 8-4.
| Hypervolemia |
| Left ventricular systolic dysfunction |
| Left ventricular diastolic dysfunction |
| Severe right ventricular dilatation causing compression of the left ventricle |
| Mitral regurgitation or stenosis |
| Increased left ventricular afterload |
| Pulmonary venous obstruction |
| Malposition of catheter tip in West zone 1 or 2 in association with raised intrathoracic pressure |
Other Indexes of Preload
The assessment of hypovolemia is discussed in Chapter 20. Because of the limitations of CVP and PAWP, additional tools for the evaluation of volume status have been sought. These include left ventricular dimensions measured by echocardiography (see Chapter 7) and right ventricular end-diastolic volume measured by a modified PAC. However, none of these parameters provides an absolute measure of fluid responsiveness. In contrast, parameters that rely on the cardiovascular response to respiratory changes, such as cyclic alterations in arterial pulse pressure, stroke volume and, in extubated patients, CVP, do reliably predict fluid responsiveness.8,9 Of these, the cyclic variation in arterial pulse pressure has been the most widely validated and is an extremely useful tool in ventilated cardiac surgery patients.19
MEASUREMENT OF CARDIAC OUTPUT
Cardiac output is a critical determinant of global tissue oxygen delivery (Equation 1-14) and as such is of great interest to clinicians caring for cardiac surgery patients. The average value for cardiac output in awake normotensive subjects is 2.7 l/min/m2, with a range (±30%) of 1.9 to 3.5 l/min/m2.20 However, a cardiac output of 2.2 l/min/m2 is widely used as a lower acceptable limit because values below this have been associated with increased mortality rates following myocardial infarction.21 Whether this lower limit applies in ventilated postoperative cardiac surgery patients is unknown.
The clinical assessment of cardiac output in the early period following cardiac surgery is unreliable. In one small study of uncomplicated cardiac surgery patients, physicians and nurses were asked to estimate whether cardiac output was normal, low, or high, based on clinical assessment.22 In patients whose cardiac outputs were outside the normal range, clinical assessment was usually wrong (13/20 patients). Furthermore, cardiac output was below the lower limit of normal (<1.9 l/min/m2) in 12 of 50 cases. This latter finding raises an important issue: what should be done in response to a low cardiac output in a patient who is otherwise stable? It is possible that inappropriate interventions to increase oxygen delivery, such as the administration of inotropic drugs, fluid, or blood, could actually increase morbidity and mortality rates. This may be part of the explanation for the adverse outcome associated with the use of the PAC identified in some studies. We do not recommend the measurement of cardiac output in all cardiac surgery patients. However, because cardiac output cannot be reliably assessed clinically, formal measurement should be undertaken in patients with hemodynamic instability or signs of inadequate oxygen delivery (acidosis, elevated lactate, oliguria, low superior vena cava oxygen saturation). Also, treatment should not be instituted on the basis of moderately low cardiac output (i.e., 1.8 to 2.2 l/min/m2) in patients who are otherwise stable, particularly in patients who are sedated and mechanically ventilated and are therefore likely to have low oxygen consumption.
Measurement of Cardiac Output by Pulmonary Artery Catheter
A number of factors can cause artefactual errors in thermodilution cardiac output measurements. Injection should be as rapid as possible to produce an easily identifiable change in temperature. Loss of injectate due to leakage from the syringe or a line misconnection results in an overestimation of cardiac output. Simultaneous infusion of intravenous fluids may alter the temperature within the pulmonary artery, leading to inaccuracies. The presence of severe tricuspid regurgitation results in an underestimation of cardiac output,23–25 but the technique is reasonably accurate with lesser degrees of tricuspid regurgitation.24 Intracardiac shunts also lead to inaccuracies in the measurement of cardiac output. Additionally, only right-sided output is measured which, in the case of a left-to-right shunt, greatly overestimates systemic flow.
Other Methods of Measuring Cardiac Output
As outlined in Equation 7-1, stroke volume can be estimated from the Doppler velocity profile across an orifice of known dimensions. Cardiac output can be estimated with echocardiography, but this modality is poorly suited to ongoing measurements over several hours. A number of devices involving a dedicated esophageal Doppler probe have been developed to provide continuous measurement of cardiac output.26,27
Other techniques that are used clinically for the determination of cardiac output include indicator dilution using lithium,28 carbon dioxide rebreathing using the Fick principle,27 and thoracic bioimpedance.29
CAPNOGRAPHY
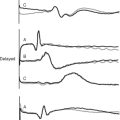
Normal capnograph traces during mechanical ventilation and spontaneous breathing are shown in Fig. 8-13A and C. The peak carbon dioxide concentration at end-expiration is known as the end-tidal carbon dioxide concentration (PETco2) and is normally 1 to 2 mmHg less than the arterial carbon dioxide concentration (Paco2). Thus, PETco2 can be used as a surrogate for PaCO2 and interpreted accordingly. Capnography is useful in a range of circumstances encountered in the ICU. In mechanically ventilated patients, loss of the capnograph trace may indicate a circuit disconnection or inadvertent extubation. PETCO2 can be used to titrate minute ventilation and facilitate weaning.30 Identification of exhaled carbon dioxide is the gold standard for confirming successful placement of an endotracheal tube. During percutaneous tracheostomy or bronchoscopy, capnography is also useful to confirm the adequacy of ventilation. In extubated patients, the tip of the carbon dioxide sampling tube can be placed inside an oxygen face mask to provide a measure of respiratory rate. Failure of the endinspiratory carbon dioxide concentration to return to zero indicates rebreathing within the ventilator circuit (see Fig. 8-13 D). A carbon dioxide concentration that continues to rise throughout expiration (see Figure 8-13 B) is typical of airway obstruction.
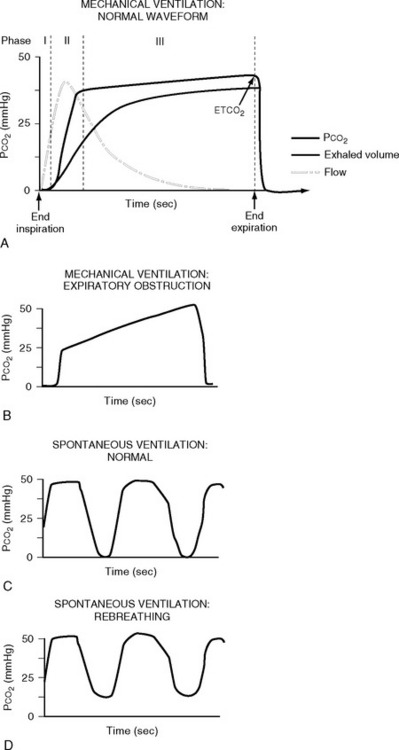
Figure 8.13 Normal and abnormal capnograph traces. A, a normal capnograph trace during mechanical ventilation. The phases of expiration are shown: phase I represents dead space gas; phase II represents a mixture of dead space and alveolar gas; phase III represents alveolar gas. Phase III normally has a slight upward slope due to uneven emptying of lung units with variable ventilation-perfusion (V/Q) ratios (see Chapter 1). Lung units with low V/Q ratios (i.e., underventilated lung units with high carbon dioxide concentration) and a long time constant (i.e., emptying slowly) release a high concentration of carbon dioxide during late expiration. The end-expiratory value is known as the end-tidal carbon dioxide concentration (ETCO2). B, Phase III may have a very steep upslope in the presence of marked airflow obstruction that could be caused by, for example, emphysema. C, a normal capnograph trace during spontaneous ventilation. D, the effect of carbon dioxide rebreathing in the same patient.
(Redrawn from Moon RE, Camporesi EM: Respiratory monitoring. In Miller RD, ed. Anesthesia, ed. 4. Fig. 36.14, p. 1271; Fig. 36.15, p. 1272. Philadelphia, Churchill Livingstone, 1994.)
Several caveats concerning the use of capnography must be considered. Unless the sampling tube is placed close to the patient’s airway, usually on the ventilator side of the endotracheal tube filter, PETCO2 may not reflect PaCO2. This is particularly true for spontaneously breathing and extubated patients. Also, the sampling tube can become blocked or kinked, resulting in loss of or alteration in the shape of the capnograph trace. Finally, in the setting of increased alveolar dead space (see Chapter 1), the PETCO2-PaCO2 difference may greatly exceed 1 to 2 mmHg. This circumstance is most obviously apparent when end-tidal and arterial carbon dioxide concentrations are compared in patients receiving cardiac massage during a cardiac arrest. An abrupt fall in PETCO2 should always alert the clinician to the possibility of a precipitous fall in cardiac output.
TEMPERATURE MONITORING
Methods of measurement of temperature include mercury thermometers, electronic thermometers (containing a thermistor or thermocouple), infrared tympanic thermometers, and thermistors located on devices such as urinary catheters, PACs, and nasopharyngeal probes. Blood temperature measured by a thermistor located on a PAC is considered the gold standard for temperature measurement in the ICU. Compared to pulmonary artery blood, reasonable levels of agreement are obtained in temperature measured in the esophagus, rectum, bladder, and axilla.31 In one study, the mean differences (±95% confidence interval) in blood temperature were −0.21 ± 0.2°C and 0.27 ± 0.45°C for the bladder and axilla, respectively.31 The narrow confidence interval, ease of measurement (a thermistor attached to a urinary catheter), and ability to record temperature continuously make the urinary bladder an attractive site for routine temperature measurement during the early postoperative period. Temperatures obtained from the tympanic membrane appear to be less reliable than those obtained from other sites32,33 but have the advantages of being rapid, noninvasive, and easy to obtain.
TONOMETRY
Gastric tonometry is a technique of measuring gastric mucosal carbon dioxide tension, from which intracellular pH (pHi) and other variables can be derived. The clinical rationale for gastric tonometry is its use as a measure of gastric mucosal hypoxia and, by inference, the hypoxia of other tissues. The technique involves the equilibrium of carbon dioxide between gastric mucosal cells and a saline or air-filled balloon placed in the stomach. If the carbon dioxide tension in the balloon is assumed to be the same as that in the adjacent tissues, and the mucosal bicarbonate concentration is assumed to be the same as the arterial bicarbonate concentration, then pHi can be calculated from the Henderson-Hasselbalch equation (see Chapter 31):
The normal value for pHi is 7.35 and mucosal hypoperfusion is considered to exist when the pHi is less than 7.32. pHi has been widely investigated as a marker of tissue hypoperfusion and as a predictor of adverse patient outcome in critically unwell patients.34 Patients with normal or high pHi show improved survival rates compared to those with low pHi.35,36 However, it has not been clearly established that, in patients with a low pHi, therapy to improve tissue perfusion (fluid, inotropes, blood) improves outcome. Thus, a normal pHi may simply identify patients who are less sick. Furthermore, there are technical and methodologic problems that limit the applicability of the technique. As an alternative to pHi, the PCO2 gap (the difference between the tonometric and either the arterial or the end-tidal PCO2) has been proposed, and it may be a more sensitive marker of tissue hypoperfusion than pHi.37 In automated gas tonometers, tonometric carbon dioxide tension is referenced to PETCO2; a value higher than 1.5 to 2 kPa (10 to 14 mmHg) is considered abnormal.34 Recently, there has been interest in sublingual tonometry, which also provides evidence of tissue hypoperfusion but appears to be associated with fewer technical problems than are associated with gastric tonometry.38
1 Moller JT, Pedersen T, Rasmussen LS, et al. Randomized evaluation of pulse oximetry in 20,802 patients: I. Design, demography, pulse oximetry failure rate, and overall complication rate. Anesthesiology. 1993;78:436-444.
2 Moller JT, Johannessen NW, Espersen K, et al. Randomized evaluation of pulse oximetry in 20,802 patients: I I. Perioperative events and postoperative complications. Anesthesiology. 1993;78:445-453.
3 Dalen JE, Bone RC. Is it time to pull the pulmonary artery catheter ? JAMA. 1996;276:916-918.
4 Leibowitz AB. Who benefits from pulmonary artery catheterization ? Crit Care Med. 2003;31:2805-2806.
5 Simini B. Pulmonary artery catheters in intensive care. Lancet. 2005;366:435-436.
6 Webb RK, Currie M, Morgan CA, et al. The Australian Incident Monitoring Study: an analysis of 2000 incident reports. Anaesth Intensive Care. 1993;21:520-528.
7 Wajon P, Lindsay G. Detection of postoperative myocardial ischemia by bedside ST-segment analysis in coronary artery bypass graft patients. J Cardiothorac Vasc Anesth. 1998;12:620-624.
8 Michard F, Teboul JL. Predicting fluid responsiveness in ICU patients: a critical analysis of the evidence. Chest. 2002;121:2000-2008.
9 Bendjelid K, Romand JA. Fluid responsiveness in mechanically ventilated patients: a review of indices used in intensive care. Intens Care Med. 2003;29:352-360.
10 Swan HJ, Ganz W, Forrester J, et al. Catheterization of the heart in man with use of a flow-directed balloon-tipped catheter. N Engl J Med. 1970;283:447-451.
11 Williams G, Grounds M, Rhodes A. Pulmonary artery catheter. Curr Opin Crit Care. 2002;8:251-256.
12 Harvey S, Harrison DA, Singer M, et al. Assessment of the clinical effectiveness of pulmonary artery catheters in management of patients in intensive care (PAC-Man): a randomised controlled trial. Lancet. 2005;366:472-477.
13 Iberti TJ, Fischer EP, Leibowitz AB, et al. A multicenter study of physicians ’ knowledge of the pulmonary artery catheter. Pulmonary Artery Catheter Study Group. JAMA. 1990;264:2928-2932.
14 Polonen P, Ruokonen E, Hippelainen M, et al. A prospective, randomized study of goal-oriented hemodynamic therapy in cardiac surgical patients. Anesth Analges. 2000;90:1052-1059.
15 Boyd O, Grounds RM, Bennett ED. A randomized clinical trial of the effect of deliberate perioperative increase of oxygen delivery on mortality in high-risk surgical patients. JAMA. 1993;270:2699-2707.
16 Wilson J, Woods I, Fawcett J, et al. Reducing the risk of major elective surgery: randomised controlled trial of preoperative optimisation of oxygen delivery. BMJ. 1999;318:1099-1103.
17 Sandham JD, Hull RD, Brant RF, et al. A randomized, controlled trial of the use of pulmonary-artery catheters in high-risk surgical patients. N Engl J Med. 2003;348:5-14.
18 Cicek S, Demirkilic U, Kuralay E, et al. Prediction of intraoperative hypovolemia in patients with left ventricular hypertrophy: comparison of transesophageal echocardiography and Swan-Ganz monitoring. Echocardiography. 1997;14:257-260.
19 Michard F. Changes in arterial pressure during mechanical ventilation. Anesthesiology. 2005;103:419-428.
20 de Simone G, Devereux RB, Daniels SR, et al. Stroke volume and cardiac output in normotensive children and adults: assessment of relations with body size and impact of overweight. Circulation. 1997;95:1837-1843.
21 Forrester JS, Diamond G, Chatterjee K, et al. Medical therapy of acute myocardial infarction by application of hemodynamic subsets (first of two parts). N Engl J Med. 1976;295:1356-1362.
22 Linton RA, Linton NW, Kelly F. Is clinical assessment of the circulation reliable in postoperative cardiac surgical patients ? J. Cardiothorac Vasc Anesth. 2002;16:4-7.
23 Cigarroa RG, Lange RA, Williams RH, et al. Underestimation of cardiac output by thermodilution in patients with tricuspid regurgitation. Am J Med. 1989;86:417-420.
24 Balik M, Pachl J, Hendl J. Effect of the degree of tricuspid regurgitation on cardiac output measurements by thermodilution. Intens Care Med. 2002;28:1117-1121.
25 Boerboom LE, Kinney TE, Olinger GN, et al. Validity of cardiac output measurement by the thermodilution method in the presence of acute tricuspid regurgitation. J Thorac Cardiovasc Surg. 1993;106:636-642.
26 Dark PM, Singer M. The validity of trans-esophageal Doppler ultrasonography as a measure of cardiac output in critically ill adults. Intens Care Med. 2004;30:2060-2066.
27 Berton C, Cholley B. Equipment review: new techniques for cardiac output measurement—oesophageal Doppler, Fick principle using carbon dioxide, and pulse contour analysis. Crit Care. 2002;6:216-221.
28 Linton R, Band D, O’Brien T, et al. Lithium dilution cardiac output measurement: a comparison with thermodilution. Crit Care Med. 1997;25:1796-1800.
29 Moshkovitz Y, Kaluski E, Milo O, et al. Recent developments in cardiac output determination by bioimpedance: comparison with invasive cardiac output and potential cardiovascular applications. Curr Opin Cardiol. 2004;19:229-237.
30 Saura P, Blanch L, Lucangelo U, et al. Use of capnography to detect hypercapnic episodes during weaning from mechanical ventilation. Intens Care Med. 1996;22:374-381.
31 Lefrant JY, Muller L, de La Coussaye JE, et al. Temperature measurement in intensive care patients: comparison of urinary bladder, oesophageal, rectal, axillary, and inguinal methods versus pulmonary artery core method. Intens Care Med. 2003;29:414-418.
32 Giuliano KK, Scott SS, Elliot S, et al. Temperature measurement in critically ill orally intubated adults: a comparison of pulmonary artery core, tympanic, and oral methods. Crit Care Med. 1999;27:2188-2193.
33 Giuliano KK, Giuliano AJ, Scott SS, et al. Temperature measurement in critically ill adults: a comparison of tympanic and oral methods. Am J Crit Care. 2000;9:254-261.
34 Hamilton MA, Mythen MG. Gastric tonometry: where do we stand ? Curr Opin Crit Care. 2001;7:122-127.
35 Gutierrez G, Palizas F, Doglio G, et al. Gastric intramucosal pH as a therapeutic index of tissue oxygenation in critically ill patients. Lancet. 1992;339:195-199.
36 Doglio GR, Pusajo JF, Egurrola MA, et al. Gastric mucosal pH as a prognostic index of mortality in critically ill patients. Crit Care Med. 1991;19:1037-1040.
37 Hamilton-Davies C, Mythen MG, Salmon JB, et al. Comparison of commonly used clinical indicators of hypovolaemia with gastrointestinal tonometry. Intens Care Med. 1997;23:276-281.
38 Maciel AT, Creteur J, Vincent JL. Tissue capnometry: does the answer lie under the tongue ? Intens Care Med. 2004;30:2157-2165.