CHAPTER 3 Molecular Biology Primer for Neurosurgeons
The Candidate Gene Approach
Lacking any biochemical basis that would aid in purifying gene products associated with a disease state, the candidate gene approach was largely an outgrowth of the efforts of positional cloning strategies in the early 1980s. Using linkage analysis to look at differences in chromosome structure in diseased versus nondiseased individuals often in tandem with linkage disequilibrium mapping to define broad (i.e., <10 centimorgans) and much finer respective chromosomal intervals associated with a priori knowledge of their etiologic role in a disease state enabled molecular geneticists to narrow the number of candidate causative genes. Before completion of the Human Genome Project, identifying these loci was an incredibly arduous and time-consuming task, in large part because of the lack of high-resolution genetic and physical chromosomal maps. The unprecedented efforts to surmount these struggles were most famously recorded in the midst of the pioneering work of Louis Kunkel and Ronald Worton1 in identifying dystrophin as the gene responsible for Duchenne’s muscular dystrophy. In the past several decades, numerous genes with high relative risk for similar “simple” mendelian diseases have been successfully identified with these methods. More than 30% of mendelian disease has neurological manifestations.2 By applying the tools of molecular biology to a gene or the small set of candidate genes identified within a quantitative trait loci it has become possible to facilitate a systematic approach to answering some very basic questions about the organization of a gene and the expression of its gene products.
Emerging from the sequence of methods conceptualized first by Sol Spiegelman3 and most effectively by Edwin Southern,4 molecular biologists have exploited the now well-worn principle of molecular hybridization in which a single-stranded nucleic acid probe (or primer) forms a stable hybrid molecule, as a result of nucleotide complementarity, with a single-stranded target sequence immobilized on a solid support (i.e., nitrocellulose or nylon membranes) or in solution (Fig. 3-1). Under the appropriate experimental conditions, the stability and biochemical kinetics of the hybrid are directly proportional to the length and degree of nucleotide complementarity.
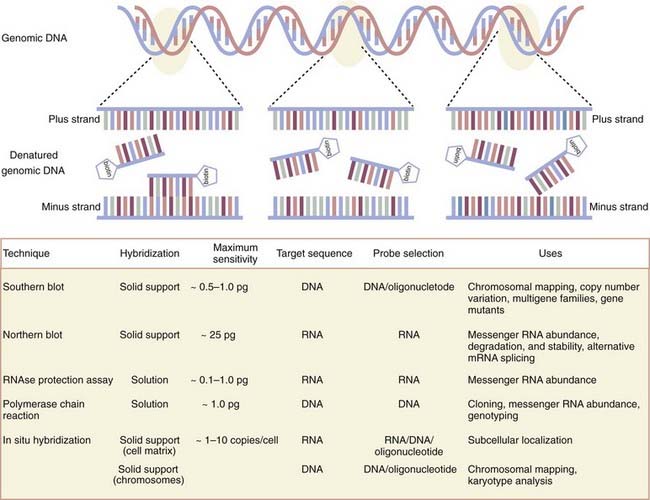
As first applied in Southern blotting whereby genomic DNA was separated according to size by agarose gel electrophoresis, transferred to nitrocellulose, and annealed to complementary DNA probes labeled with a detectable tag hybridized to target genomic DNA, the dosage or deletion analysis, or both, of candidate genes was affirmed. Indeed, Southern blot analysis of the dystrophin gene has identified duplications as well as mapped various exon deletion mutants. Recently, variation in the copy number of genes has received new consideration inasmuch as several new genomic disorders have been shown to be manifested in a gene dosage–dependent manner.5 Such disorders include dup7 (q11.23) syndrome, methyl-CPG-binding protein 2 (MECP2), and adult-onset autosomal dominant leukodystrophy. By reducing the stringency of hybridization conditions, however, differences in hybridization patterns may reveal the existence of certain fragments that are not able to hybridize to the probe under the most stringent hybridization conditions. These data are often the first clues that the gene is part of a larger multigene family that shares significant but not complete nucleotide sequence identity. By using a modification of the Southern blotting method to screen a complementary DNA library at moderate stringency, the dystrophin-like sequence utrophin was identified.6
Traditional Southern blotting has largely been supplanted by the advent of polymerase chain reaction (PCR) protocols. The ability to replicate short fragments of DNA with an enzymatic assay first described by Kleppe and colleagues7 and transformed by Mullis and associates’ use of a thermostable DNA polymerase8,9 has dramatically reduced lead times in comparison to conventional Southern blotting methods. As with Southern blotting, there must be some knowledge of the target DNA sequence for PCR. In practice, PCR typically requires two primers, one of which is complementary to the 5′ DNA region of interest and the other to the 3′ end of the DNA region. The DNA regions can be any part of a gene, exonic or intronic, although amplifications longer than 10 kilobases become increasingly difficult to isolate. Replication of the DNA fragment, or amplicon, occurs processively as part of a series of 20 to 40 repeated temperature cycles in which one cycle consists of denaturation of the DNA target, annealing of the primers to the single-stranded DNA, and enzymatically catalyzed elongation of complementary DNA by a thermostable DNA polymerase. One noteworthy improvement in the past 15 years has been the addition of thermostable DNA polymerases with separate 3′ to 5′ exonuclease proofreading activity, which has resulted in higher sequence fidelity of the amplified product. Among the multiple variants of the basic PCR methodology that have been developed, identification of allele-specific, single nucleotide polymorphisms (SNPs)10 and foci of methylated CpG islands11 in genomic DNA are just two. Because of the dependability and efficiency of amplifying a specific locus within the genome, PCR and its basic multiplex versions, which can amplify several amplicons simultaneously,12 continue to be workhorses for the preparation of genomic samples.
A parallel set of approaches for studying expression of the primary products of gene transcription that involve messenger RNA (mRNA) has enabled neuroscientists to assign critical spatiotemporal information to gene function. The first technique developed to do so, the Northern blot,13 differs from the Southern blot in that the target molecules separated according to size by agarose gel electrophoresis under denaturing conditions and transferred to a membrane support for hybridization consist of RNA, whether total RNA or poly A+ mRNA. At the organ or tissue level, it remains unmatched in its ability to provide an accurate size of the transcript and quantifiable patterns of gene expression during development or disease states, or both. Furthermore, differences in the size of the transcript within or among samples suggest any number of possibilities, including but not limited to alterative splicing, alternative start sites, or differences in polyadenylation. Typically, medium- and high-abundance messages are readily visualized with labeled probes. However, low-abundance messages can be difficult to detect.
The low-throughput methodology, long lead times, and limits of detection dictated by RNA immobilization on solid-phase supports have largely been overcome by the development of solution-based hybridization techniques that provide at least an order of magnitude more sensitive for detecting mRNA transcripts. Detection of mRNA in its native state by the ribonuclease protection assay adapts the Northern blot approach by hybridizing a labeled complementary RNA probe (usually 100 to 500 base pairs) with high specific activity to unlabeled cellular RNA that is freely suspended in solution.14 The resulting RNA duplexes, which are highly stable, are protected from digestion by single-strand–specific ribonucleases and separated by polyacrylamide gel electrophoresis (PAGE). Detection of signal by the isotopic or nonisotopic labels offer sensitive and reliable detection and quantitation of mRNA that is up to 50 times more sensitive than Northern blotting.15 A second solution-based alternative requires conversion of the native mRNA to complementary DNA by reverse transcriptase followed by PCR. Although gene-specific primers can be used for the reverse transcription, a polythymidine oligonucleotide (oligo-dT), random hexamers, or combination of them are most frequently used. Oligo-dT primers readily hybridize to the translationally important poly A+ tails present in most mRNA and thereby bias the start site of reverse transcription toward the 3′ end of the mRNA. Conversely, random hexamers are often used when attempting to obtain a target template closer to the 5′ end of long mRNA sequences. Detection of the target sequence can be achieved by standard PCR protocols, whereas multiplex PCR protocols allow the simultaneous detection of several amplicons.12 However, when quantitation is required, quantitative real-time PCR (qRT-PCR) protocols are necessary.16,17 qRT-PCR requires primers with specific design characteristics and amplicons with no more than 250 base pairs. Before quantitation, it is essential that the primers be exhaustively tested with the target template to ensure that the gene of interest is amplified and is the expected size. Two versions of qRT-PCR are now in use. The most simple qRT-PCR methodology uses a fluorescent dye that emits short wavelengths of ultraviolet spectrum light as a function of the number of amplicons created during each successive cycle when it intercalates with the double-stranded DNA formed during the thermocycling process. The generation of nonspecific, double-stranded PCR products, often referred to as primer-dimers, can interfere with or completely prevent quantitation. A more reliable but more expensive qRT-PCR route uses the addition of a separate sequence-specific RNA- or DNA-based probe modified with a fluorescence reporter at one end of the molecule and a quencher of fluorescence at the other end. In this version of qRT-PCR, the fluorescent reporter probe anneals to the target template somewhere in the target amplicon between the qRT-PCR primers. In intact reporter probes, the fluorescence is quenched. Detection and quantitation occur only as signal is emitted because the fluorescent reporter is physically cleaved from the quencher by the 5′-3′ exonuclease activity of the thermostable polymerase during the elongation step. To ensure accuracy with any of these solution-based mRNA quantitation assays, it is necessary to normalize expression of the target transcript with a stably expressed control gene. These methods are most favored when dealing with low-abundance transcripts and when the cellular RNA material is limited or, in a worst-case scenario, partially degraded.
In the past several years there has been a renaissance in Northern blotting methods for detecting a specific set of small RNA molecules, microRNAs (miRNAs). miRNAs are abundant, single-stranded, 21- to 23-nucleotide RNA molecules processed from endogenous 70-nucleotide pre-miRNAs by two enzymes, Drosha and Dicer.18–20 These small noncoding RNAs are recruited to unique ribonucleoprotein complexes, RNA-induced silencing complexes,21,22 where they mediate the translational suppression or degradation of nascent mRNA transcripts bearing homologous antisense sequence in their 3′ untranslated regions.23 miRNA function appears to have an essential role in neuronal development,24,25 and recent indications suggest that dysregulation of miRNA networks contributes to neurodegenerative disease.26–28 As an analytic tool, the popularity of the Northern blot lies in its continued accuracy in estimating the size of the mature miRNA molecule and the ability to detect the pre-miRNA product simultaneously. Enhanced detection advances consisting of cross-linking small RNA molecules (<100 nucleotides) to nylon membranes,29 as well as the use of locked nucleic acids,30,31 to increase probe specificity are among the most recent contributions.
Originally, detection schemes for in situ hybridization used isotopic labels (33P or 35S) incorporated into the complementary probes. Quantitative methods for converting radioactive signal with silver grain density via photographic emulsion have been widely used since the mid-1990s.32 Nonisotopic detection methods have multiplied over the past 2 decades because they take a considerably shorter time, can have greater signal resolution, and allow the simultaneous detection of multiple different targets by combining various detection methods. Complementary probes labeled with biotin or digoxigenin allow a number of different detection options. Some use colorimetric substrates consisting of horseradish peroxidase or alkaline phosphatase conjugated to streptavidin beads or primary antidigoxigenin antibodies to facilitate detection. Data from the Allen Brain Atlas use just such a colorimetric detection strategy, which provides an increasingly comprehensive data set of expressed gene at the cellular level.33 One continuing technical concern with enzyme-linked amplification schemes is diffusion of the colorimetric signal from the site of localization. Research laboratories have used fluorescence detection schemes within the past several decades that involve new generations of fluorophores with long-term photostability, such as Alexa dyes or quantum dot (Qdot) nanocrystals; these fluorophores have been key components in illuminating the trafficking dynamics of mRNA molecules within the subcellular compartments of dendrites34 and axons35,36 via conventional epifluorescent microscopy or single-photon confocal laser scanning microscopy. Quantitative data analysis of these fluorescent images requires the use of image acquisition and analysis software such as Metamorph or IP Lab. In a typical sample, the total fluorescence intensity for a region of interest, normalized against background noise and any differences in the area of the region of interest, is compared across experiments or among samples and subjected to statistical analysis. In contemporary molecular cytogenetics, fluorescence in situ hybridization (FISH)-based karyotyping and banding methods refer to a rubric of techniques used for both clinical genetics and tumor cytogenetics that can simultaneously characterize several chromosomes or chromosomal subregions (Box 3-1).
Box 3-1
Array of Fluorescence In Situ Hybridization–Based Methods in Molecular Cytogenetics
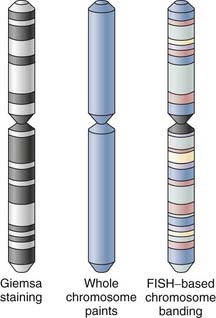
Over the past several decades, G-banding has served as one of the routine standards for chromosome banding. It relies on successful culture of the tissue of investigation, often fetal or tumor tissue, and preparation of metaphase cells. It should be noted that product-of-conception samples in particular suffer relatively high rates of failure (10% to 40%) during the tissue-culturing process37 and poor chromosome morphology.38 Monochrome changes in the visible karyotype of morphologically optimal samples produced by Giemsa staining can provide low but sufficient chromosomal resolution to distinguish changes in chromosome number and large structural rearrangements whether translocations or macrodeletions. Chromosomes with small translocations, cryptic aberrations, microdeletions, and inversions or more complex karyotypes are often beyond the limits of conventional G-banding analysis.39 As a result, complementary fluorescence in situ hybridization (FISH)-based karyotyping and banding methods have been developed to overcome the intrinsic morphologic and technical obstacles in karyotyping associated with G-banding protocols.
In its most basic form, FISH-based karyotyping uses DNA probes hybridizing to a specific gene or chromosome locus in metaphase or, less commonly, interphase chromosome preparations for the straightforward detection of deletion/duplication syndromes and gene fusions or rearrangements. In contrast to metaphase FISH, interphase FISH does not require the growth of viable cells for the preparation of a chromosomal spread. Interphase FISH makes use of preserved tissue and cellular material such as that found in paraffin-embedded biopsy samples. Perhaps the most significant advance in the past decade or so has been the development of multicolor FISH-based karyotyping and banding techniques (Fig. 3-2). The various iterations of multicolor FISH karyotyping methods are all based on the availability of chromosome-specific probe sets developed from degenerate oligonucleotide–primed polymerase chain reaction of flow-sorted chromosomal libraries40,41 labeled in tandem with four to seven spectrally separable fluorochrome labels42 that simultaneously “paint” and distinguish each whole chromosome.43,44 Chromosome painting with chromosome-specific probes can be done combinatorially (e.g., multiplex FISH or spectral karyotyping) or by using an additional ratiometric approach45 (i.e., combined binary ratio–FISH) and has proved to be a powerful adjunct to conventional cytogenetic techniques in the diagnostic analysis of interchromosomal events and characterization of the cytogenetic evolution of tumors, even in complex aberrations. The sensitivity (i.e., whether a translocation can be detected) and specificity (i.e., whether it can classified with assurance) of the analysis are vitally dependent on the fluorochrome combinations used in the target chromosomes.46 The resolution of these whole chromosome–painting techniques is limited by the lack of any additional spatial delineation within a chromosome. For this reason, multicolor karyotyping alone is often not sensitive enough to precisely determine chromosomal breakpoints, subtle chromosome rearrangements, or intrachromosomal aberrations (e.g., inversions, duplications, terminal deletions). Differential hybridization signals obtained with other FISH-based karyotype techniques, such as comparative genomic hybridization, have similar resolving capabilities.47 Efforts to improve the resolution of these assays have used chromosome arm–specific,44,48 region-specific,49,50 centromeric,51 and subtelomeric probes.52,53 To address the latter issue of intrachromosomal aberrations, FISH-based banding patterns obtained by using differentially labeled and pooled subregional DNA probes were designed to produce high-resolution chromosomal karyotypes with identifiable fluorescent banding patterns within a single chromosome via spectral color banding,54 cross-species color banding49,55 or multicolor banding.50,56
As intermediaries in the continuum between genotype and phenotype, levels of mRNA should be taken as a surrogate for corresponding protein expression or their functional activity with caution. Early data sets attempting to establish a correlation between protein and mRNA levels found varying degrees of concordance. Although a significant positive correlation has been observed in human transitional cell carcinomas,57 more marginal grading was observed in a comparative examination of 19 genes in the human liver.58 Conversely, in a more limited study of three matrix metalloproteinase–related genes expressed in benign and neoplastic prostate tissue,59 no correlative relationships were identified. When these data are placed in the context of the vast regulatory networks that monitor the various posttranscriptional events, this wide variability is not entirely unexpected. A nearly universal theme among the traditional tools for assaying protein expression is the use of affinity between an antibody and an epitope on the target protein to facilitate protein detection. The specificity of the primary antibody is the central determinant in the accuracy of protein recognition. Much like assays for detecting nucleic acids, methods to identify protein expression can be accomplished with the use of blots, free in solution or in situ.
Protein blots, more commonly referred to as Western blots,60 immobilize size-separated protein lysates on membranes (e.g., nitrocellulose or polyvinylidene difluoride [PVDF]), where they are detected with a monoclonal or polyclonal antibody.61,62 In short, cellular proteins solubilized in a lysis buffer containing one or more detergents, protease inhibitors, and more often than not, a strong reducing agent are separated by PAGE. Separation is most commonly accomplished by molecular weight. However, separation in this single dimension may be further refined by prior separation in an immobilized pH gradient gel, and these gels are often referred to as two-dimensional (2D) gels. Although protein lysates can be run under nondenaturing conditions, usually when separating by molecular weight, sodium dodecyl sulfate (SDS) is incorporated in the polyacrylamide gels and the running buffers to maintain the protein lysates in a denatured state. Strong reducing agents such as β-mercaptoethanol or dithiothreitol in the lysis or loading buffer (or in both) eliminate any secondary or tertiary folding that would interfere with protein migration within the polyacrylamide gel. Changes in the percentage of acrylamide within the gel determine how well low- or high-molecular-weight proteins separate within the gel. Gels with a higher percentage of acrylamide resolve lower-molecular-weight proteins better and vice versa. The gel-immobilized proteins are transferred in a glycine-based buffer to nitrocellulose or PVDF membranes. The addition of a primary antibody recognizing the target protein facilitates detection of the protein, most commonly in a multistep (i.e., indirect) detection scheme using fluorescently labeled secondary antibodies or enzyme-linked secondary antibodies and various colorimetric, chemifluorescent, or chemiluminescent substrates. Advances in antibody production offer not only a growing selection of primary immunoreagents but also novel innovations in antibody development that combine the most attractive properties of mouse monoclonal (e.g., uniformity, purity, indefinite availability) with rabbit polyclonal (higher affinity) antibodies.63,64 The choice of primary antibody is not without a caveat. A single primary antibody will rarely share equal affinity for the target proteins in nondenaturing and denaturing conditions and often has to be determined empirically. Signal detection reveals the experimental molecular weight of the protein, which can be compared against the calculated molecular weight of the open reading frame. Although aberrant migration can occur as a result of the intrinsic properties of the protein sequence, significant differences in molecular weight are also suggestive of cotranslational or posttranslational protein modifications. The ability to obtain quantitative information from signal detection is quite limited regardless of the detection scheme, but with proper normalization for loading errors65 and effort to increase the dynamic range of signal66 by using cameras with charge-coupled devices, there has been considerable improvement. A far more sensitive technique for determining protein abundance is the sandwich enzyme-linked immunosorbent assay (ELISA).67 Sandwich-ELISA methodology requires a capture antibody that recognizes the protein of interest. It is adsorbed to the surface of a microtiter plate and flooded with the presence of protein lysate. Any antigenic sequence within the protein of interest binds to the capture antibody. A detecting antibody that also recognizes the protein of interest, although at a different epitope not occluded by the capture antibody, is added to facilitate detection of the protein. Once an enzyme-linked secondary antibody is bound to the detecting antibody, an inert substrate of the enzyme is cleaved to create fluorescent or chemiluminescent signal that can be quantified to determine the concentration of the antigen.
Another widely used protein detection method is immunoprecipitation.68 The principal methodology is very simple. An antibody recognizing the target protein is incubated with cell lysates in solution in the presence of protease inhibitors and allowed to form an immune complex, which can then be “precipitated” out of the solution by using protein A/G–coupled agarose beads. Proteins not captured by the primary antibody and sequestered within the immune complex are washed away. The immune complexes (antibody and antigen) are eluted from the protein A/G–coupled beads, separated by SDS-PAGE, and analyzed by Western blot to verify the identity and quantity of the target protein. One important variable is the composition of the immunoprecipitation lysis buffer. Ideally, the lysis buffer is able to balance the solubilization of proteins from the original tissue or cell matrix while leaving their native conformation intact.69 By so doing, immunoprecipitation protocols seek to physically isolate the protein of interest from the rest of the cell lysate while retaining the protein-protein interactions of the target antigen. One criticism of this methodology has focused on the potential for identifying false-positive co-immunoprecipitation protein partners because of the lysis step, which allows all the solubilized cellular constituents to mix in solution. This mixing may produce nonphysiologic interactions because proteins normally compartmentalized within the cellular milieu or expressed in different cell types are now allowed to interact. As a result, validation of such protein-protein interactions by parallel methods will be required (Box 3-2).
Box 3-2
Protein Domains and Selected Parallel Methodologies for Assessing Protein-Protein Interactions
The three-dimensional structure of a protein is often scattered, with various protein modules that can fold and, in some cases, autonomously retain the function of the rest of the protein chain.70 Numerous protein-protein interaction domains and their sequence boundaries have been identified by structural data from x-ray crystallography and nuclear magnetic resonance, but obtaining these data is time-consuming and labor-intensive. By extrapolating from these data, mathematical algorithms have been constructed to query the primary amino acid sequence for the presence of and boundaries for various types of protein-protein–interacting domains and interfaces. Meanwhile, curated databases have been assembled to identify and catalog many of the physical interactions among pairs or larger groups of proteins.71 Identification of direct interacting partners will require multiple ways of verifying any interaction. A selected set of protein-protein interaction methodologies that are, to varying degrees, complementary with immunoprecipitation are presented in the following sections.
Protein Affinity Chromatography/Pull-Down Assay
A protein is covalently or noncovalently coupled to a solid-phase matrix, such as cyanogen bromide (CNBr), and protein lysates are run through the column.72 Weakly retained and strongly retained protein can be eluted under differing salt conditions. These columns can be incredibly sensitive with detectable binding constants as weak as 10−5 M. However, retaining the native structure, activity, and proper orientation of the protein when directly immobilized to a CNBr matrix can be difficult and result in contradictory results when compared with other methods.73 As an alternative, the target protein is expressed with a suitable affinity tag (e.g., poly-His, biotin, GST, FLAG, c-myc) and immobilized on agarose-Sepharose supports by its respective ligand (e.g., Ni2+, streptavidin, glutathione, or monoclonal antibodies specific to FLAG or c-myc). The interacting partner can be identified by Western blots, direct sequencing, or mass spectrometry.
Tandem Affinity Purification
This protein affinity assay requires placing two tags such as protein A and the calmodulin-binding protein on a bait protein separated by a TEV protease cleavage site. It reduces nonspecific pull-down of proteins through successive rounds of purification, but it does so at the expense of transient protein-protein interactions.74,75 A particularly successful application of the tandem affinity purification system in combination with mass spectrometry was used for the systematic analysis of yeast protein complexes.76
In Vivo Cross-Linking
False-positive results generated by the loss of spatial organization during the lysis step are mitigated by chemical and photo cross-linking to covalently “freeze” the protein-protein interactions in situ before isolation. Chemical cross-linking77,78 typically uses the exogenous introduction of a variety of homo- or hetero-bifunctional cross-linking reagents. In contrast, photo cross-linking uses modified versions of leucine (photo-leucine) and methionine (photo-methionine) containing a photoactivatable diazirine ring incorporated into growing peptide chains by the nascent translation apparatus.79 The addition of either amino acid does not alter the cell’s metabolism, but when the cells are exposed to ultraviolet light, highly reactive intermediates enable identification of protein-protein interactions when used in combination with immunoprecipitation, Western blotting, or mass spectrometry.
Label Transfer
Label transfer is a variation of the cross-linking methodologies that is especially useful for detecting weak or transient protein-protein interactions. It involves coupling of an isotopic or nonisotopic label transfer reagent into the bait protein and incubating it with an unlabeled protein lysate. When exposed to ultraviolet light, any interacting proteins are cross-linked by the label transfer reagent. The actual label transfer occurs when the cross-linker is cleaved so that the label is left attached to the interacting protein, where it can be detected by separation via sodium dodecyl sulfate–polyacrylamide gel electrophoresis and Western analysis, sequence analysis, or mass spectrometry.80,81
Yeast Two-Hybrid Screening
Pioneered by Fields and Song,82 the yeast two-hybrid screening technique uses transcriptional activity to assess protein-protein interactions. The premise of the technique is activation of a downstream reporter gene (e.g., β-galactosidase, secreted alkaline phosphatase, luciferase) that is easily assayed by binding of the Gal4 binding domain (BD) and Gal4 activating domain (AD) proteins to an upstream activating sequence. The BD and AD do not need to directly bind but are brought together in apposition with suspected interacting proteins fused with the AD or BD. Although useful as a complementary tool, this technique has a notoriously high false-positive rate.
Fluorescence Resonance Energy Transfer
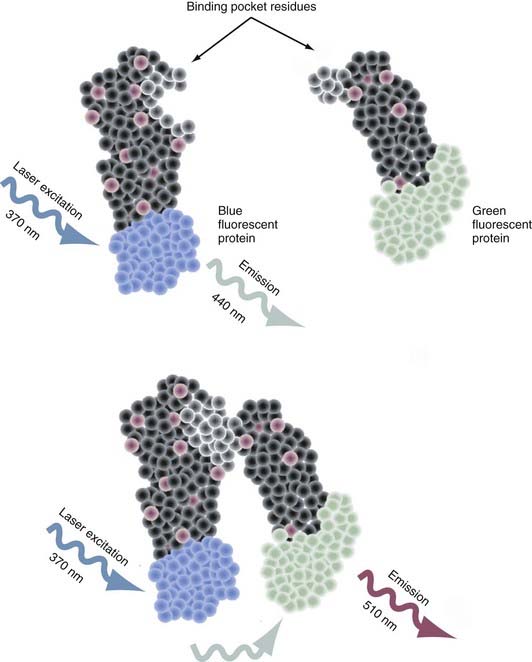
Intermolecular fluorescence resonance energy transfer (FRET) is a spectroscopic method that assesses the proximity and relative angular orientation of two different proteins—one having a donor fluorophore such as cyan fluorescent protein and the other having an acceptor fluorophore such as yellow fluorescent protein—by monitoring the emission spectra when laser excitation of the donor protein is applied.83–85 When the fluorophores are separated, only the emission spectra of the donor protein is observed (Fig. 3-3). When in close enough proximity, laser excitation of the donor fluorophore transfers the excited energy state to the acceptor fluorophore and generates a peak in its emission spectra. The two principal reasons why this technique is proving to be an extremely valuable tool for probing protein-protein interactions are that (1) the efficiency of this transfer is extremely sensitive to the separation in distance between the two fluorophores and (2) the range over which the transfer in the excited energy state can occur is spatially delimited to approximately 10 nm.
Determining the subcellular distribution of protein expression from the results of Western blotting or immunoprecipitation is constrained by the type of lysate used. Differential centrifugation protocols are the simplest way to fractionate various organelles, membranes, and subcellular structures as starting material for these protein assays, but residual contaminants interfere with detection of the nuanced changes in subcellular localization and intercompartmental translocations that are thought to be crucial to cellular information-processing networks.86 In situ visualization of protein expression in sections of frozen or paraffin-embedded fixed tissue (i.e., immunohistochemistry) and its cognate technique in fixed cells in culture (i.e., immunocytochemistry) are robust and dynamic methods for identifying and quantifying alterations in patterns of localization in the various compartments and subcellular structures intrinsic to nerve cells. They apply a common methodology based on the ability of a primary antibody to bind to endogenous proteins expressed within its native cytoarchitectural matrix. Primary antibodies can be directly conjugated to enzymes or fluorophores to facilitate detection. More often, because of reduced cost, labeled secondary antibodies are used with colorimetric or indirect immunofluorescence visualization schemes to provide quantifiable patterns of protein distribution. Indirect immunolabeling of multiple primary antibodies, which is most easily accomplished when the primary antibodies are raised in different species, can be used to correlate the colocalization of additional proteins when the emission spectra of the fluorophore-conjugated secondary antibody are separable. Because the maximal optical spatial resolution defined by Rayleigh scattering is approximately 200 nm for conventional wide-field fluorescence microscopic techniques, colocalization is suggestive of, although not formal proof of a protein-protein interaction.
The microinjection of a directly conjugated, high-quality antibody presents an opportunity to visualize protein expression dynamics in live cells. Recent improvements in neuronal transfection techniques frequently make heterologous expression of DNA constructs a more consistent option. A chimera of the target protein fused with a fluorescent protein (FP),87,88 such as GFP, DsRed, or their variants, with increased brightness and folding efficiency89 has the enviable characteristic of requiring no cofactors other than O2. When directly imaged, changes in the subcellular distribution of the chimeric protein can be quantified in largely the same manner described for FISH-based mRNA trafficking dynamics in neuronal processes. There persist three experimental concerns, only one of which is technical, that limit the usefulness of this type of transfection approach. The technical limitation is the size of the chimera sequence itself. Ordinarily, mammalian expression constructs are only efficient at driving overexpression of DNA constructs that are less than about 10 kilobases in size. The additional concerns are biologic and twofold. First, does overexpression of the DNA construct lead to ectopic expression of the target chimera? Second, does expression of the FP tag interfere in any way with the functional activity of the target protein? Most autofluorescent fusion proteins have been constructed by placing the coding sequence of the target protein upstream or downstream of the FP sequence. When either of these locations has a negative impact on target protein function, the alternative is to insert the FP sequence within the open reading frame. Lacking any previous knowledge of where to place the FP within the open reading frame, finding a permissive site is guesswork at best. One strategy to overcome the pitfalls of performing sequential insertions to create a functional FP fusion uses the bacterial Tn5 transposon to create libraries of FPs that can then be individually isolated and tested.90
When interfering with the activity of the target protein is the desired goal, there is no equivalent instrument in the molecular neurobiologist’s toolbox to genetic techniques that precisely and completely eliminate gene function.91 One now widely disseminated nucleic acid–based gene-specific silencing method to partially silence gene function uses the RNA interference (RNAi) pathway.92 Small interfering RNAs (siRNAs) are 20- to 25-nucleotide, double-stranded effector molecules of RNAi. They are integrated into the RNA-induced silencing complex in the same fashion as miRNA (Fig. 3-4),93–95 where they become juxtaposed with endogenous mRNA, base-pair with perfect homology to the mRNA, and cause it to be cleaved by argonaute-2 (Ago-2), the catalytic component of the RNA-induced silencing complex (RISC). In primary neuronal or astrocyte culture, transient transfection with the siRNA duplexes or with plasmid-encoded short-hairpin RNA (shRNA), which expresses the siRNA duplex as a hairpin suitable for processing with the enzyme Dicer, is the most common course of action. In vivo delivery of siRNA has proved successful with plasmid- or viral vector–encoded shRNA via a number of local96–100 or systemic96,101–103 applications. Although the empirical rules for rational siRNA design and selection prediction algorithms improve specificity,104 the efficacy of the knockdown can vary as a function of whether individual or pooled sets of siRNA are used and the potency of this siRNA. The most attractive potential of RNAi is the flexibility that it allows in controlling the spatial and temporal effects of inhibition. With the development of inducible siRNA whose expression is controlled by tetracycline- or doxycycline-regulated promoters,105–109 photoactivated versions of “caged” siRNA,110 and focal transfection methods,111 stepwise advances to this promise are being realized. Although the low to moderate concentrations of siRNA typically used to produce significant knockdown tend to evade interferon response–mediated changes in global gene expression,112,113 a secondary effect has on occasion been noted.114,115 A more acute concern is the possibility of an siRNA modulating the expression of a closely related sequence116–118 and resulting in observable changes in phenotype.119 Chemical modifications of the siRNA can mitigate some of these off-target effects,120 but the exact nature of siRNA specificity remains unclear (see Elbashir and colleagues121 and Miller and associates,122 but compare with Semizarov and coworkers123). Until a better consensus of siRNA specificity is reached, current siRNA design suggests allowing for at least two nucleotide mismatches with all off-target genes. A recent editorial suggests that the ideal control is to rescue the siRNA phenotype by using an siRNA-resistant gene with a silent mutation in the 3′ nucleotide of a codon in the middle of the siRNA binding site.124
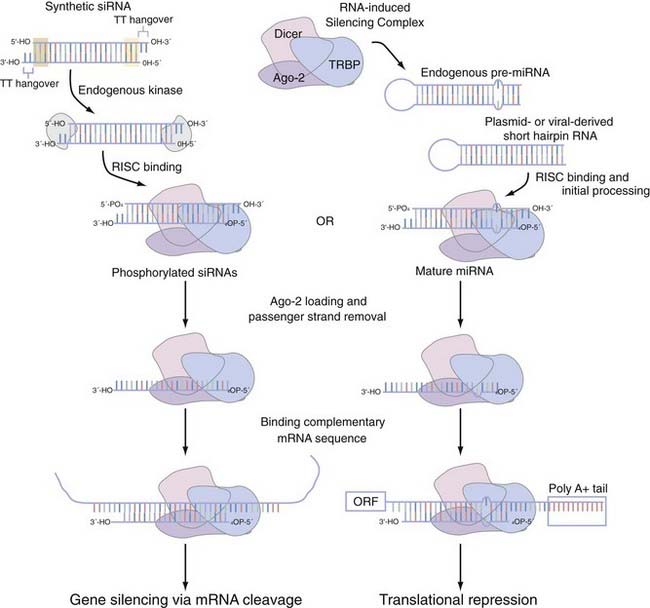
FIGURE 3-4 Small interfering RNA (siRNA) and microRNA (miRNA) processing pathway using the RNA-inducing silencing complex (RISC). RISC mediates the functional activity of both siRNA and miRNA. Short-hairpin versions of siRNA or endogenous miRNA are recruited to the RISC, which in mammals is composed of three core proteins (e.g., Dicer, TRBP, and argonaute-2 [Ago-2]) and associate with each other in the absence of double-stranded RNA (dsRNA).93,94 Synthetic siRNA duplexes, which are initially processed by an endogenous kinase, have a number of structural features that we highlight. The 21- to 23-nucleotide complexes have areas of high (highlighted by the green shaded box) and low (highlighted by the yellow shaded box) thermodynamic stability that dictates which strand is eventually incorporated into the RISC complex as the guide strand. These siRNA duplexes typically also incorporate a pair of thymidine base pairs as 3′ overhangs of each strand. After incorporation into the RISC, the dsRNA of both siRNA and miRNA is then unwound; only the guide strand is loaded onto Ago-2, whereas the passenger strand is released.95 On binding of mRNA with complete complementarity (siRNA) or with nucleotide mismatches (miRNA or, not pictured, siRNA), this dsRNA is able to influence gene function. siRNA can bind anywhere in the messenger RNA (mRNA), whereas miRNA is thought to bind primarily in the 3′ untranslated region.
The Rise of Functional Genomics
Candidate gene studies take advantage of two lines of evidence that dovetail to increase success: the increased efficiency of association studies in selected population-based samples and an a priori understanding of the clinical phenotypes and how it might be affected by candidate gene function. However, this approach has met with mixed success when assessing complex diseases in which multiple genes, as well as their sequence and functional variants, probably initiate small individual contributions and relative risk for a cumulative phenotype that varies in the severity of symptoms and age at onset and evolves over time. Lacking the tools of scale to perform the simultaneous analyses required, continuing efforts toward miniaturization and scalability epitomize the new “omics” technologies that are transforming nervous system studies by allowing data-rich and detailed characterization of the molecular mechanisms underlying cell physiology. Ironically, it does so by using the very same methods of biochemistry, molecular biology, and cell biology worked out decades earlier. At its core, functional genomics aspires to integrate data from the study of different molecular strata—the genome, transcriptome, proteome, metabolome, and their regulatory mechanisms—into a systems-level model of cell biology. The ostensible goal is to obtain a richly detailed, global understanding of the nervous system’s emergent properties through the interactions among all its constituent elements.125 In so doing, it promises to expand our insight into the root problems of complex diseases and transform the current predictive power of our diagnostic and therapeutic regimens.126
Transcriptomics
Evolving technologic innovations fostering miniaturization, increased scalability and efficiency, and decreased cost born from the Human Genome Project now exploit this wealth of genomic data. Gene expression profiling127,128 is the most widely used functional genomics technology due in equal parts to its early development and the ease with which it can be performed. High-density DNA microarrays anchor cDNA129 or oligonucleotides130,131 of different genes in massively parallel arrays of up to approximately 10,000 spots/cm2 and greater than 1,000,000 spots/cm2, respectively, on a glass surface. Using the principle of molecular hybridization, several micrograms of fluorescently labeled RNA or cDNA probes hybridize with the target DNA and are analyzed with high-resolution scanners that optically detect the strength of fluorescent signal from the bound probes. Raw data are normalized and processed through a series of statistical approaches to determine whether any gene is differentially expressed. The probes are constructed from abundant sources of high-integrity mRNA, which is reverse-transcribed in the presence of fluorophore-coupled deoxyribonucleoside triphosphates (dNTPs) or amino-allyl–labeled dNTPs that can be coupled to a fluorophore such as Cy3 or Cy5. In postmortem tissue, even with extended postmortem intervals of up to 30 hours, high-integrity mRNA can be isolated for microarray sample preparation. However, it is not the postmortem interval inasmuch as it is the pH of the tissue (great than 6.25) that determines mRNA integrity.132 Alternatively, when confronted with small amounts of starting material, it may be necessary to amplify the mRNA population so that there will be enough material to drive the hybridization reaction when labeled without skewing the complexity of the original mRNA population.16 Because exponential amplification techniques, such as PCR, do not offer this capability, a linear amplification technique, aRNA amplification, enzymatically converts the mRNA population into a single-stranded cDNA with reverse transcriptase by using a specialized oligo-dT primer containing a 3′ T7 RNA polymerase promoter sequence. When a complementary second strand is synthesized, it serves as a transcription template for T7 RNA polymerase to produce RNA oriented in the antisense direction, which can be labeled directly or converted into labeled cDNA as a probe. Amplification of mRNA by manual harvesting of individual live neurons128,133,134 or dendrites,135,136 as well as neurons in fixed tissue,137,138 has been equally as successful as automated approaches such as laser capture microdissection.139
Experimental artifacts can be introduced by sample preparation (e.g., differences in the integrity of mRNA or in the efficiency of labeling), the array (e.g., DNA spotting or printing errors), or processing (e.g., variable fluorescence scanner performance). Careful experimental design (e.g., checking the integrity of the mRNA before use, dye swaps and parallel processing of samples to control for labeling efficiency, quality control experiments for each lot of custom and commercial microarrays) can largely eliminate these issues. Reducing systemic biases in the results requires the optical data to be normalized at the global level to facilitate comparisons across microarray experiments and at the local level to account for individual variations in signal intensity that are unique to the surface of that microarray.140,141 Common approaches on how best to apply these normalization procedures to distribution of the data are available in the form of open source and open development software offered by the Bioconductor project. When analyzing data, the most conservative treatment of it uses a Bonferroni correction to reduce possible false-positive errors. However, this correction for multiple measurements can also lead to increases in the number of false-negative errors. Various data analysis software packages try to balance the discovery rates of these two types of errors. As with all high-throughput assays, these data should be verified with other techniques. Although the current generation of high-throughput, low-cost cDNA or oligonucleotide microarrays is the primary laboratory workhorse for quantifying the transcriptome, next-generation technology is already on the horizon (Box 3-3).
Box 3-3
Next-Generation Technology for mRNA Gene Expression
Sources of noise within the experiment can be controlled, in part, by the normalization techniques discussed earlier. However, there are several notable technical limitations of DNA microarrays at present: high background levels as the result of cross-hybridization by multiple targeting probes142 and low concordance (≈30% to 40%) of transcript detection between platforms.143–145 In the former circumstance, the probe will normally bind with high specificity to an arrayed target sequence. Off-target effects such as cross-hybridization occur when a flanking, unbound sequence of the same probe binds weakly to an adjacent arrayed sequence. The resulting background noise contributes to the relatively small dynamic range (≈2 orders of magnitude) of signal detection in microarrays, although in the latter circumstance the weak overlap in mRNA expression profiles across different microarray platforms is a consequence of unpredictable intramolecular folding events in some long probes146 and hybridization differences driven by the use of different sequences for the same target gene on various platforms. The cross-platform differences can be improved by using the RefSeq database for gene matching147 and still further when expression patterns are analyzed only when target sequences between platforms overlap.148
Next-generation technologies determine the identity of the mRNA transcript with the use of highly paralleled, direct sequencing methods.149 Although expensive at the moment, RNA sequencing (RNA-Seq) has several clear advantages over the current array-based methods, including low background noise, a large dynamic range (up to ≈3.5 orders of magnitude), and single–base pair resolution, which allows the ability to distinguish different isoforms (i.e., splice variants) and allelic expression (i.e., single nucleotide polymorphisms or structural variants, including insertion-deletions and copy number variations) of the same mRNA without subsequent need for any specialized normalization. Briefly, the total or poly A+ mRNA population is converted into a library of short, adaptor-modified cDNA (200 to 500 base pairs) that is compatible with deep-sequencing instrumentation. In the case of a population enriched in poly A+ mRNA, there are two general paths for processing. The poly A+ mRNA can be fragmented first, usually by hydrolysis or nebulization, and then ligated to adaptors and reverse-transcribed into cDNA. Conversely, the poly A+ mRNA can be ligated to the adaptor, reverse-transcribed into cDNA, and then fragmented with DNAse I or sonication. When fragmented at the RNA level, there is limited bias over the length of the transcript.150 However, fragmentation at the cDNA level greatly biases the readable sequence toward the 3′ end.151 Depending on the amount of input mRNA, amplification of the population may or may not be necessary. These libraries can generate millions of short reads that typically vary from 30 to 250 base pairs by 454, Solexa, or SOLid sequencing and can be compared against the genomic sequence or the coding sequencing of a gene.
There are two principal areas where highly paralleled mRNA expression technology has proven utility. One is as a comparative expression profile or signature profile. This genome-wide molecular fingerprint provides a distinctive pattern of gene expression that can be used as a comprehensive framework for assessing differences in classes of neurons134 and astrocytes,152 during development in myoblasts,153 and in genetic mutants in model systems.154 It has also been used to evaluate the secondary effects of drug compounds on regulation of gene expression.155 Signature profile comparisons of cells under different stimulation conditions141 or environmental influences156 that expand the complexity of the mRNA populations, or “expression space,” have colloquially been referred to as “exercising the genome.”157 The Human Genome Project estimated the total number of human genes expressed in the central nervous system to be approximately 25,000 to 30,000.158 However, alternative splicing, which is thought to occur in 92% to 94% of genes159 and is often subverted in disease,160,161 generates further heterogeneity in the mature mRNA population from a single pre-mRNA transcript.162 The patterns of expression of alternative splice forms are strongly correlated across different tissues, thus suggesting the presence of tissue-specific regulatory mechanisms.159,163,164 Because classic microarray designs do not incorporate this additional level of mRNA complexity, filling this gap in signature profile data is a series of new alternative splicing arrays165–167 with promising insight into transformation of Hodgkin’s lymphomas168 and gliomagenesis.169 Adaptations of DNA oligonucleotide microarray methods have also been made to signature-profile the expression of miRNA in low-density microarrays.170,171
Most highly paralleled gene expression studies make no a priori hypotheses about which individual genes are regulated among comparison sample sets. It is done within the framework of a systems biology approach in which it is assumed that transcription occurs with a finite set of resources. Thus, a change in the mRNA transcription of one gene will have collateral, sometimes seemingly stochastic influences on other mRNA. A second application of gene expression attempts to mine the comparative expression profiles for information on transcriptional regulatory networks. Data mining of signature profile results can identify clusters of mRNA to be transcriptionally active or silent. The genomic sequences of this mRNA are then analyzed for the presence of shared promoter elements that might contribute to the levels of expression. This sequence analysis is usually paired with direct analysis of promoter occupation by the suspected transcription factor via chromatin immunoprecipitation (ChIP).172,173 In a typical ChIP assay, the DNA-protein interaction is cross-linked by formaldehyde in situ to fix the interaction, although this step can be omitted when analyzing histone-DNA interactions (referred to as a native-ChIP). The DNA is then fragmented into approximately 500–base pair stretches by sonication or enzymatic digestion. The cross-linked transcription factor is used as an epitope to immunoprecipitate the complex. Antibodies for this purpose are often prequalified by commercial suppliers because they must be of very high quality. The cross-linking in the isolated complex is reversed wherein the DNA sequence of the chromatin fragment is identified by direct sequencing (ChIP-seq), a PCR-based method (ChIP-display),174 or most commonly, hybridization to a tiling array (ChIP-on-chip or ChIP-chip) for genome-wide detection. Tiling arrays are a relatively recent variation of microarrays with many design considerations that contain short (≈25 base pairs) oligonucleotides, or tiles, of nonrepetitive regions of genomic sequences that are arrayed linearly (i.e., contiguous sequence end to end or separated by five nucleotides) or with a fractional offset (i.e., overlapping genomic sequence tiles) for higher resolution studies.175 One important adjunctive function of ChIP-chip studies is the ability to establish the presence of the possible epigenetic effects of histone modifications and, by extension, nongermline DNA methylation.176–178 It is important to note that these descriptive studies of transcription factor occupancy alone do not indicate the efficacy of the interaction on transcription. However, when integrated with mRNA expression profiling, it is possible to identify functional regulatory network motifs, which is the aim of the ENCODE (Encyclopedia of DNA Elements) Project.179
This type of analysis, often enhanced by expression profile comparisons with genetic methods (Box 3-4) that create overexpression or null mutation phenotypes of the transcription factors that bind to the promoter loci, are more likely to reveal the presence of multitiered regulatory networks. A good example of this is maintenance of a human embryonic stem (ES) cell phenotype. ES cells maintain their pluripotency and ability to self-renew by maintaining a feedforward transcriptional regulatory network that requires the OCT4-SOX2 complex to autoregulate its own expression, as well as initiate expression of NANOG.187,188 These transcription factors interact to maintain ES cells in the undifferentiated state by repressing the activation of a host of other transcription factors, including key homeodomain proteins, while activating the transcription of another set of transcription factors, including REST, SKIL, and STAT3.189
Box 3-4
Genetic Tools for Modifying Gene Function
Insertional Mutagenesis
In contrast to chemical mutagenesis, insertional mutagenesis is a transposon-based technique for generating gene disruptions by inserting a molecular tag randomly180 or, more recently, by using targeted methods that combine the transposon with a DNA-binding domain.181 In the randomized version, mapping the site of insertion is required to determine where it occurred and whether the insertion site will generate any dysfunction and, if so, the severity of dysfunction in protein activity.
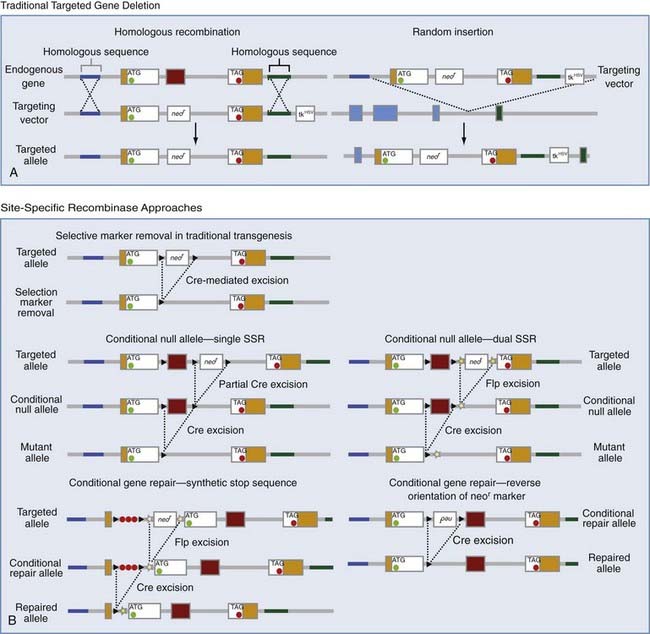
Homologous Recombination
This most precise and elegant method for altering gene function requires a DNA construct to align with the targeted gene of interest, by mechanisms still poorly understood but probably similar to the alignment of homologous chromosomes during meiosis and mitosis (Fig. 3-5). The recombination event, which is most efficient in yeast and mice but much less common than random insertion events, takes place anywhere in the flanking homologous sequence. The DNA construct contains both a positive (i.e., neomycin) and a negative (i.e., thymidine kinase gene) selection marker to select for homologous recombination events and against nonhomologous recombination, respectively. The neomycin selectable marker by itself, in traditional knockout strategies, causes a significant disturbance in gene function when introduced into an intron. Over the past decade, site-specific recombinase (SSR) systems have allowed geneticists to conditionally express or silence targeted genes, which can be exogenously engineered transgenes encoding reporter, sensor, or effector molecules.91,182 In approximately 15% of conventional transgenics, embryonic lethality is an issue. The basic concept of conditional transgenes evolved from this obstacle. The most commonly used SSRs are Cre (causes recombination of the bacteriophage P1 genome) and Flp (named for its ability in Caenorhabditis elegans to invert a gene). Three versions of Flp are currently in use (e.g., enhanced Flp, Flp-wt, and low-activity Flp) and have a dynamic range of activity across them of more than 1 order of magnitude. Each of the SSRs catalyze recombination events at specific DNA target motifs built into the DNA construct before homologous recombination. For Cre, that site is loxP. The cognate site for wild-type Flp or any of its variants is FRT. These SSRs possess a combination of fortuitous characteristics: neither of their DNA target motifs are found naturally in mice, and they catalyze the recombination between these target sequences with efficiency and reliability and do so without the need for any additional cofactors. In traditional gene-targeting deletions, the neomycin marker can interfere with the phenotype by influencing the expression of nearby genes.183 Removal of the selectable marker is one of the most obvious applications of the SSR system and requires only inserting loxP sites flanking the neomycin cassette.184,185 Conditional transgenesis can remove or repair the gene of interest. In the former, a single SSR strategy has loxP sites that remove both the neomycin selectable marker and the exon to be deleted. Partial Cre excision occurs by transient expression of the recombinase in recombinant cells after selection, thereby leaving a conditional null allele. The same situation can be accomplished by using both the Cre and Flp recombinases in tandem. For repairing gene functions, we show two hypothetical approaches. The relative strength of perturbing gene function with a neomycin cassette can be enhanced significantly when the cassette is oriented in the reverse direction of the target gene. Excision of the reverse-orientation neor marker is accomplished by flanking loxP sites. An alternative tactic uses a synthetic stop sequence and a positive selection marker placed between the 5′ untranslated region and the start codon186 with dual SSRs.
Although these types of analysis were most easily performed with microarray-based signature profiles in model systems such as yeasts early on,190–192 these methods have gained traction in mammalian models for identifying transcriptional regulatory networks in dopaminergic neurons of the midbrain193 and in ES cells of neural194,195 and hematopoietic196 origin. Additionally, a recent publication has illustrated the power of next-generation RNA-Seq technology when applied to this analysis.197
Some epigenetic modifications (i.e., genomic imprinting) or other genetic variations, such as SNPs, that are potential sources of variation in transcript abundance are not likely to be accounted for. Because sequencing results of the human genome estimate that SNPs are the most prevalent class of common genetic variations (i.e., variants with a minor allele frequency of >1%), they may require additional consideration. Although the vast majority of these genetic variants introduce silent mutations and neutral phenotypes, there has been much focus on determining the relative ratio of neutral, near-neutral,198 and non-neutral SNPs within populations of different ancestry.199–201 These genetic polymorphisms are naturally occurring, evolutionarily stable differences thought to confer a predisposition, susceptibility, or resistance to disease and influence individual responses to curative regimens, perhaps by altering the three-dimensional local DNA topography.202
There are a number of highly paralleled methods for assaying SNPs across the genome.203,204 Both the mass spectrometry (MS)-based assay and fluorescence polarization–based assay are allele-specific primer extension methods in which the genomic region is amplified by PCR and used as a template for the annealing of an oligonucleotide primer immediately upstream of the polymorphism. A DNA polymerase then adds only a single nucleotide, because chain-terminating dideoxynucleotide triphosphates (ddNTPs) are used, as dictated by the target DNA sequence at the polymorphic site. Multiplex MS versions rely on the natural differences in molecular weight of the DNA for detection by matrix-assisted laser desorption/ionization (MALDI) time-of-flight (TOF) MS for efficiently assigning genotype.205 In the fluorescence polarization–based version,206 the ddNTPs are labeled with different fluorophores. For detection, the labeled ddNTP is incorporated into the primer, which causes it to rotate more slowly within the plane of laser polarization and thereby emit more signal than the unincorporated ddNTPs, which rotate more quickly. A more robust fluorescence polarization assay uses PCR with a universal fluorescence resonance energy transfer (FRET) reporter system for detection of SNPs.207 An alternative set of highly multiplexed SNP assays incorporate universal PCR. One example of this is the molecular inversion probe assay,208 in which a single oligonucleotide simultaneously binds a complementary genomic DNA sequence that flanks either side of the SNP. The single base being flanked is filled in with a DNA polymerase and ligated to circularize the oligonucleotide. The circularized molecular inversion probe is isolated from the linear, nonbinding probes and amplified. The highly paralleled, multiplexing capability comes from a unique bar code in each set of SNP-specific oligonucleotides that can be detected on a high-density array containing sequence complementary to the bar code tags. In contrast, the GoldenGate assay uses allele-specific primer extension through the SNP to which it can be ligated to a second oligonucleotide (specific only for the locus and not the polymorphism), amplified, and detected with bar code tags.209 Genome-wide studies of SNP analysis have also used SNP arrays, which provide relatively comprehensive coverage (≈80%) of the genome currently mapped. Apart from the previously discussed sources of limitations for any array-based platform, it was originally thought that SNP array artifacts may arise from an additional bias. Detailed position mapping of SNP sites suggest that they are enriched in the 250–base pair sequences upstream of transcription start sites. Because of the close proximity of SNPs to each other at this loci, it was estimated that approximately15% of the microarray probes for any given gene will overlap with SNPs that are polymorphic in the population study. However, in a large-scale human study, no such systemic artifacts arose.210 Studies integrating the simultaneous effect of genome-wide DNA polymorphisms and global effects on gene expression suggest that transcript abundance can be a quantitative trait that can be mapped.211
Proteomics
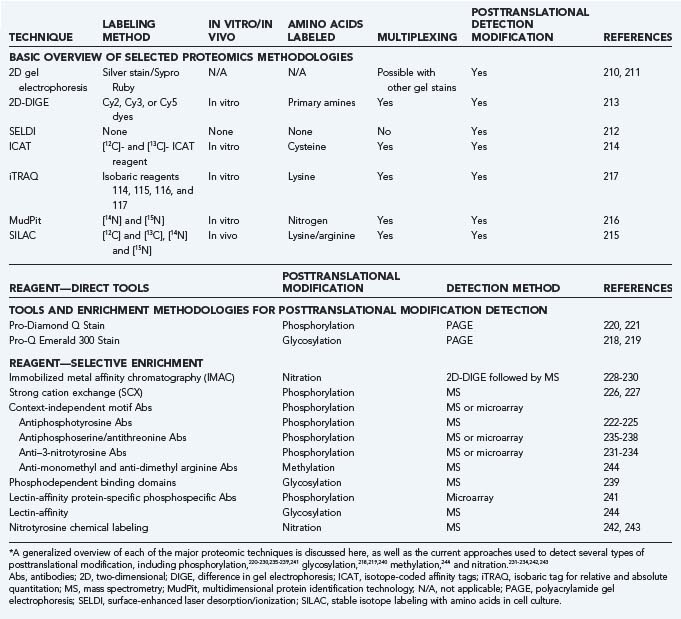
Highly paralleled analysis of protein expression and abundance is the most widely featured form of analysis (Table 3-1). Some forms approach the experimental design from a so-called top-down approach in which naturally occurring proteins can be analyzed. The most cost-effective form of these techniques is conventional 2D gel electrophoresis.213,245 Determining protein levels by 2D gel electrophoresis requires separating a protein lysate by isoelectric point in the first dimension followed by SDS-PAGE in the second. Comparison of Coomassie brilliant blue, Sypro Ruby, or silver-stained gels differentially exposes expressed spots that can be excised and enzymatically digested from the preparation after identification of the peptides by MS. Peptide mass mapping by MALDI-TOF MS and peptide sequencing by electron spray ionization MS are highly efficient at identifying gel-separated proteins. However, various technical issues, such as labor-intensive image analysis for gel matching, bias in protein representation, and small dynamic range of resolution (≈1 order of magnitude), are responsible for the high coefficient of variation (20% to 30%) that has limited its wider use.246 Using methods with sufficient dynamic range in proteomics is important because the rather modest differences observed in the changes in mRNA abundance in microarray studies are in sharp contrast to the range of protein expression (≈5 to 8 orders of magnitude).
A multiplexing fluorescent 2D difference in gel electrophoresis (2D-DIGE)247 method directly labels lysine groups of proteins with mass- and charge-matched cyanine (Cy) dyes before resolving them in the first isoelectric dimension. Up to three samples,248,249 each with a spectrally separable Cy dye, can be run on the same 2D gel and optically overlayed, thereby providing a significant increase in confidence during spot matching among samples. Addition of the Cy dye adds approximately 500 Da to the labeled protein, but it is also the basis for the large dynamic range (≈4 orders of magnitude) of 2D-DIGE250,251 and its ability to detect relatively small changes in protein expression.248 Titrating the Cy dye labeling limits the tagging to one lysine on each protein and prevents precipitation of the protein because of its increased hydrophobicity and visualization artifacts associated with the added mass of each additional fluorophore. As with standard 2D gels, hydrophobic membrane proteins are underrepresented in the sample despite the use of various chaotropic agents.212,252 Similarly, proteins with high molecular weight are difficult to resolve in the first dimension, low-abundance proteins (<1000 copies per cell) are not detected,253 and spots may contain more than one protein.
Current global biomarker discovery strategies attempt to generate differential maps of small peptide markers (<30 kD) that can correctly classify masked serum or cerebrospinal fluid (CSF) samples to a specific disease. To do so, most of these recent studies have relied on surface-enhanced laser desorption/ionization (SELDI) MS.254 A sample of serum or CSF is directly applied to the surface of a gold-plated chip with a modified chromatographic matrix (e.g., weak positive ion exchange [CM10], metal binding surface [IMAC30], or strong anion exchange [Q10]) that will bind only certain sets of proteins within the serum or CSF. With the use of TOF MS, patterns of peptide biomarkers in ovarian,255 breast,214 and prostate cancer256 have shown promising correlative strength.
In contrast to this trio of techniques, bottom-up proteomic methods consistently use enzymatic digestion to generate peptide fragments as the primary input for mass measurements by MS coupled with efficient multidimensional liquid chromatographic separation. Isotope-coded affinity tags (ICAT) are the most popular method for quantifying the relative expression levels of individual proteins.257 By specifically labeling cysteine residues with a reagent that contains nine 12C (light) or nine 13C (heavy) atoms258 and a biotin tag, samples of control proteins derivatized with the [12C]-ICAT reagent or experimental proteins with the [13C]-ICAT reagent are combined, digested with trypsin, and separated on an avidin column. All the cysteine-containing peptides tagged with biotin are selectively separated on an avidin column, subjected to reverse-phase chromatography, and identified by liquid chromatography–MS or MS. The selective enrichment of cysteine-containing peptides, which are thought to constitute 10% to 20% of the peptides from a whole cell extract,217,259 does significantly decrease the complexity of the peptide mixture. Quantifying the 12C/13C ratio provides a relative, not absolute expression ratio of individual proteins within the sample set. A variation of ICAT uses a combination of four isobaric labels that can label multiple lysine-containing peptides per protein. This feature of the isobaric tag for relative and absolute quantitation (iTRAQ)260 has the effect of increasing the confidence interval of identification and quantitation. iTRAQ-labeled peptides are normally separated by reverse-phase chromatography, but OFFGEL fractionation has also been used as another option.216 A recent comparison of ICAT and iTRAQ with 2D-DIGE supports the notion that the global-tagging approach of iTRAQ is more sensitive than either ICAT or 2D-DIGE,215 although all are likely to have dynamic ranges of resolution of at least 4 orders of magnitude. A more important point elucidated in this study was the limited overlap of proteins characterized by each of the techniques, thus suggesting the complementary quality of their data sets.
A third MS-based assay, multidimensional protein identification technology (MudPit),261 separates complex peptide mixtures in two dimensions, as opposed to 2D gels, which fractionate in two dimensions. Peptide mixtures are separated in the first dimension on the basis of electrostatic charge and eluted by using a step gradient of increasing salt concentrations directly onto a tandemly coupled column that separates on the basis of hydrophobicity. The advantage of this unbiased approach is that it allows integral membrane proteins to be identified among the complex peptide mixture. Typically, these proteins are lost by 2D gel separation.
Stable isotope labeling with amino acids in cell culture (SILAC)262 is a simple approach for the in vivo labeling of proteins for MS-based detection and quantitation of protein expression and posttranslational modifications.263 Isotopically labeled amino acids, usually lysine and arginine, are added directly to the growth media, where cells directly incorporate the light (e.g., 12C or 14N) or heavy (e.g., 13C or 15N) label into newly synthesized protein chains that can be prepared for peptide identification and quantitation by MS. SILAC has been coupled with various enrichment techniques to monitor phosphorylation,264–266 as well as methylation,244 in protein lysates.
The large data sets that are generated by these techniques do not directly address the state of posttranslational modification. Phosphorylation events are common and affect approximately 30% of all proteins267 at one time, and they are well-known regulatory switches in neuronal development,268 synaptic plasticity,269,270 and neuron-generated biologic rhythms.271 The current tools for the study of phosphoproteomics place heavy emphasis on the direct use of phospho-specific reagents in array-based platforms or various enrichment techniques to isolate phosphoproteins for subsequent analysis with MS (see Table 3-1). Selective phosphopeptide enrichment can be achieved by chromatographic separation, such as with immobilized metal affinity chromatographic (IMAC) columns228–230 and antiphosphotyrosine affinity columns222–225 or phospho-dependent binding domains.239 As a result of the negative charge of the phosphopeptides and their hydrophilic nature, specialized MS protocols have been used in some circumstances for analysis of phosphorylation sites.272,273 The one exception to the dependence on a phosphoprotein enrichment scheme is the fluorescent Pro-Q Diamond stain for direct use in isoelectric focusing gels, SDS-PAGE, and 2D gels for the detection of all types of phosphorylated amino acids,220 although greater proteome coverage can be achieved when Pro-Q Diamond staining is coupled with liquid chromatography–MS approaches.274 In ICAT, phosphorylated residues within a cysteine-containing peptide can be detected as a normal consequence of the experiment.275 Tools for detection or enrichment of other posttranslational modifications, such as glycosylation and nitration, have also been used (see Table 3-1).
The protein expression profiles generated by antibody array–based detection methods have matured considerably in surface designs of solid supports, coupling chemistries, on-chip probe stability, and fabrication.276 First-generation high-density arrays printing approximately 1000 unique antibodies with current fabrication platforms, with expectations of up to 10,000 in the near future, are beginning to provide an alternative to other proteomic methodologies for generating highly paralleled data in disease biomarker discovery signatures,277,278 phosphoproteomics,279,280 and oncoproteomics.281,282 One distinct advantage of this approach is the minute amounts of sample consumed, usually less than 1 µL, with multispotting techniques potentially providing significant improvement.283,284 In DNA microarrays, multiple housekeeping genes act as an internal control during the data normalization process. Lacking a comparable standard, a variety of data normalization approaches have been devised for antibody-based arrays.285 Other complementary microarray formats include binding domain–based arrays, such as phospho-dependent Src homology 2 domains,239 and reverse-phase protein microarrays,286 which are the inverse of antibody-based arrays (i.e., cells, serum, or tissue is spotted on a nitrocellulose slide and probed with a single antibody) and have been used to show disease progression in cancer.
Bilen J, Liu N, Burnett BG, et al. MicroRNA pathways modulate polyglutamine-induced neurodegeneration. Mol Cell. 2006;24:157-163.
Black DL. Mechanisms of alternative pre-messenger RNA splicing. Annu Rev Biochem. 2003;72:291-336.
Boyer LA, Lee TI, Cole MF, et al. Core transcriptional regulatory circuitry in human embryonic stem cells. Cell. 2005;122:947-956.
Dorsett Y, Tuschl T. siRNAs: applications in functional genomics and potential as therapeutics. Nat Rev Drug Discov. 2004;3:318-329.
Dymecki SM, Kim JC. Molecular neuroanatomy’s “Three Gs”: a primer. Neuron. 2007;54:17-34.
Emilsson V, Thorleifsson G, Zhang B, et al. Genetics of gene expression and its effect on disease. Nature. 2008;452:423-428.
FANTOM ConsortiumSuzuki H, Forrest AR, van Nimwegen E, et al. The transcriptional network that controls growth arrest and differentiation in a human myeloid leukemia cell line. Nat Genet. 2009;41:553-562.
Fodor SP, Read JL, Pirrung MC, et al. Light-directed, spatially addressable parallel chemical synthesis. Science. 1991;251:767-773.
Gillespie D, Spiegelman S. A quantitative assay for DNA-RNA hybrids with DNA immobilized on a membrane. J Mol Biol. 1965;12:829-842.
Hood L, Heath JR, Phelps ME, et al. Systems biology and new technologies enable predictive and preventative medicine. Science. 2004;306:640-643.
Johnson R, Teh CH, Kunarso G, et al. REST regulates distinct transcriptional networks in embryonic and neural stem cells. PLoS Biol. 2008;6(10):e256.
Kosik KS. A microRNA in a multiple-turnover RNAi enzyme complex. Nat Rev Neurosci. 2006;7:911-920.
Mackler SA, Brooks BP, Eberwine JH. Stimulus-induced coordinate changes in mRNA abundance in single postsynaptic hippocampal CA1 neurons. Neuron. 1992;9:539-548.
Miyashiro K, Dichter M, Eberwine J. On the nature and differential distribution of mRNAs in hippocampal neurites: implications for neuronal functioning. Proc Natl Acad Sci U S A. 1994;91:10800-10804.
Miyawaki A. Innovations in the imaging of brain functions using fluorescent proteins. Neuron. 2005;48:189-199.
Saiki RK, Bugawan TL, Horn GT, et al. Analysis of enzymatically amplified beta-globin and HLA-DQ alpha DNA with allele-specific oligonucleotide probes. Nature. 1986;324:163-166.
Schena M, Shalon D, Davis RW, et al. Quantitative monitoring of gene expression patterns with a complementary DNA microarray. Science. 1995;270:467-470.
Song E, Lee SK, Wang J, et al. RNA interference targeting Fas protects mice from fulminant hepatitis. Nat Med. 2003;9:347-351.
Southern EM. Detection of specific sequences among DNA fragments separated by gel electrophoresis. J Mol Biol. 1975;98:503-517.
Sugino K, Hempel CM, Miller MN, et al. Molecular taxonomy of major neuronal classes in the adult mouse forebrain. Nat Neurosci. 2006;9:99-107.
Tannu NS, Hemby SE. Methods for proteomics in neuroscience. Prog Brain Res. 2006;158:41-82.
Van Gelder RN, von Zastrow ME, Yool A, et al. Amplified RNA synthesized from limited quantities of heterogeneous cDNA. Proc Natl Acad Sci U S A. 1990;87:1663-1667.
Wang ET, Sandberg R, Luo S, et al. Alternative isoform regulation in human tissue transcriptomes. Nature. 2008;456:470-476.
Wang Z, Gerstein M, Snyder M. RNA-Seq: a revolutionary tool for transcriptomics. Nat Rev Genet. 2009;10:57-63.
1 Worton RG, Thompson MW. Genetics of Duchenne muscular dystrophy. Annu Rev Genet. 1988;22:601-629.
2 Costa T, Scriver CR, Childs B. The effect of Mendelian disease on human health: a measurement. Am J Med Genet. 1985;21:231-242.
3 Gillespie D, Spiegelman S. A quantitative assay for DNA-RNA hybrids with DNA immobilized on a membrane. J Mol Biol. 1965;12:829-842.
4 Southern EM. Detection of specific sequences among DNA fragments separated by gel electrophoresis. J Mol Biol. 1975;98:503-517.
5 Gu W, Lupski JR. CNV and nervous system diseases—what’s new? Cytogenet Genome Res. 2008;123:54-64.
6 Tinsley JM, Blake DJ, Roche A, et al. Primary structure of dystrophin-related protein. Nature. 1992;360:591-593.
7 Kleppe K, Ohtsuka E, Kleppe R, et al. Studies on polynucleotides. XCVI. Repair replications of short synthetic DNA’s as catalyzed by DNA polymerases. J Mol Biol. 1971;56:341-361.
8 Mullis K, Faloona F, Scharf S, et al. Specific enzymatic amplification of DNA in vitro: the polymerase chain reaction. Cold Spring Harb Symp Quant Biol. 1986;51:263-273.
9 Saiki RK, Bugawan TL, Horn GT, et al. Analysis of enzymatically amplified beta-globin and HLA-DQ alpha DNA with allele-specific oligonucleotide probes. Nature. 1986;324:163-166.
10 Newton CR, Graham A, Heptinstall LE, et al. Analysis of any point mutation in DNA. The amplification refractory mutation system (ARMS). Nucleic Acids Res. 1989;17:2503-2516.
11 Herman JG, Graff JR, Myohanen S, et al. Methylation-specific PCR: a novel PCR assay for methylation status of CpG islands. Proc Natl Acad Sci U S A. 1996;93:9821-9826.
12 Edwards MC, Gibbs RA. Multiplex PCR: advantages, development, and applications. PCR Methods Appl. 1994;3:S65-S75.
13 Alwine JC, Kemp DJ, Stark GR. Method for detection of specific RNAs in agarose gels by transfer to diazobenzyloxymethyl-paper and hybridization with DNA probes. Proc Natl Acad Sci U S A. 1977;74:5350-5354.
14 Zinn K, DiMaio D, Maniatis T. Identification of two distinct regulatory regions adjacent to the human beta-interferon gene. Cell. 1983;34:865-879.
15 Melton DA, Krieg PA, Rebagliati MR, et al. Efficient in vitro synthesis of biologically active RNA and RNA hybridization probes from plasmids containing a bacteriophage SP6 promoter. Nucleic Acids Res. 1984;12:7035-7056.
16 Van Gelder RN, von Zastrow ME, Yool A, et al. Amplified RNA synthesized from limited quantities of heterogeneous cDNA. Proc Natl Acad Sci U S A. 1990;87:1663-1667.
17 Provenzano M, Mocellin S. Complementary techniques: validation of gene expression data by quantitative real time PCR. Adv Exp Med Biol. 2007;593:66-73.
18 Ambros V. The functions of animal microRNAs. Nature. 2004;431:350-355.
19 Bartel DP, Chen CZ. Micromanagers of gene expression: the potentially widespread influence of metazoan microRNAs. Nat Rev Genet. 2004;5:396-400.
20 He L, Hannon GJ. MicroRNAs: small RNAs with a big role in gene regulation. Nat Rev Genet. 2004;5:522-531.
21 Mourelatos Z, Dostie J, Paushkin S, et al. miRNPs: a novel class of ribonucleoproteins containing numerous microRNAs. Genes Dev. 2002;16:720-728.
22 Hutvágner G, Zamore PD. A microRNA in a multiple-turnover RNAi enzyme complex. Science. 2002;297:2056-2060.
23 Kosik KS. A microRNA in a multiple-turnover RNAi enzyme complex. Nat Rev Neurosci. 2006;7:911-920.
24 Lim LP, Lau NC, Garrett-Engele P, et al. Microarray analysis shows that some microRNAs downregulate large numbers of target mRNAs. Nature. 2005;433:769-773.
25 Makeyev EV, Zhang J, Carrasco MA, et al. The microRNA miR-124 promotes neuronal differentiation by triggering brain-specific alternative pre-mRNA splicing. Mol Cell. 2007;27:435-448.
26 Bilen J, Liu N, Burnett BG, et al. MicroRNA pathways modulate polyglutamine-induced neurodegeneration. Mol Cell. 2006;24:157-163.
27 Schaefer A, O’Carroll D, Tan CL, et al. Cerebellar neurodegeneration in the absence of microRNAs. J Exp Med. 2007;204:1553-1558.
28 Kim J, Inoue K, Ishii J, et al. A microRNA feedback circuit in midbrain dopamine neurons. Science. 2007;317:1220-1224.
29 Pall GS, Hamilton AJ. Improved Northern blot method for enhanced detection of small RNA. Nat Protoc. 2008;3:1077-1084.
30 Várallyay E, Burgyán J, Havelda Z. Detection of microRNAs by Northern blot analyses using LNA probes. Methods. 2007;43:140-145.
31 Sweetman D, Goljanek K, Rathjen T, et al. Specific requirements of MRFs for the expression of muscle specific microRNAs, miR-1, miR-206 and miR-133. Dev Biol. 2008;321:491-499.
32 Chesselet M-F, Weiss-Wunder LT. Quantification of in situ hybridization histochemistry. In: Eberwine J, Valentino KL, Barchas JD, editors. In Situ Hybridization in Neurobiology: Advances in Methodology. New York: Oxford University Press; 1994:114-123.
33 Lein ES, Hawrylycz MJ, Ao N, et al. Genome-wide atlas of gene expression in the adult mouse brain. Nature. 2007;445:168-176.
34 Miyashiro KY, Beckel-Mitchener A, Purk TP, et al. RNA cargoes associating with FMRP reveal deficits in cellular functioning in Fmr1 null mice. Neuron. 2003;37:417-431.
35 Bassell GJ, Zhang H, Byrd AL, et al. Sorting of beta-actin mRNA and protein to neurites and growth cones in culture. J Neurosci. 1998;18:251-265.
36 Yao J, Sasaki Y, Wen Z, et al. An essential role for beta-actin mRNA localization and translation in Ca2+-dependent growth cone guidance. Nat Neurosci. 2006;9:1265-1273.
37 Lomax B, Tang S, Separovic E, et al. Comparative genomic hybridization in combination with flow cytometry improves results of cytogenetic analysis of spontaneous abortions. Am J Hum Genet. 2000;66:1516-1521.
38 Schaeffer AJ, Chung J, Heretis K, et al. Comparative genomic hybridization-array analysis enhances the detection of aneuploidies and submicroscopic imbalances in spontaneous miscarriages. Am J Hum Genet. 2004;74:1168-1174.
39 Claussen U, Michel S, Mühlig P, et al. Demystifying chromosome preparation and the implications for the concept of chromosome condensation during mitosis. Cytogenet Genome Res. 2002;98:136-146.
40 Telenius H, Carter NP, Bebb CE, et al. Degenerate oligonucleotide-primed PCR: general amplification of target DNA by a single degenerate primer. Genomics. 1992;13:718-725.
41 Telenius H, Pelmear AH, Tunnacliffe A, et al. Cytogenetic analysis by chromosome painting using DOP-PCR amplified flow-sorted chromosomes. Genes Chromosomes Cancer. 1992;4:257-263.
42 Mujumdar RB, Ernst LA, Mujumdar SR, et al. Cyanine dye labeling reagents: sulfoindocyanine succinimidyl esters. Bioconjug Chem. 1993;4:105-111.
43 Schröck E, du Manoir S, Veldman T, et al. Multicolor spectral karyotyping of human chromosomes. Science. 1996;273:494-497.
44 Speicher MR, Gwyn Ballard S, Ward DC. Karyotyping human chromosomes by combinatorial multi-fluor FISH. Nat Genet. 1996;12:368-375.
45 Raap AK, Tanke HJ. COmbined Binary RAtio fluorescence in situ hybridiziation (COBRA-FISH): development and applications. Cytogenet Genome Res. 2006;114:222-226.
46 Azofeifa J, Fauth C, Kraus J, et al. An optimized probe set for the detection of small interchromosomal aberrations by use of 24-color FISH. Am J Hum Genet. 2000;66:1684-1688.
47 Bentz M, Plesch A, Stilgenbauer S, et al. Minimal sizes of deletions detected by comparative genomic hybridization. Genes Chromosomes Cancer. 1998;21:172-175.
48 Karhu R, Ahlstedt-Soini M, Bittner M, et al. Chromosome arm–specific multicolor FISH. Genes Chromosomes Cancer. 2001;30:105-109.
49 Müller S, O’Brien PC, Ferguson-Smith MA, et al. Cross-species colour segmenting: a novel tool in human karyotype analysis. Cytometry. 1998;33:445-452.
50 Chudoba I, Plesch A, Lürch T, et al. High resolution multicolor-banding: a new technique for refined FISH analysis of human chromosomes. Cytogenet Cell Genet. 1999;84:156-160.
51 Henegariu O, Bray-Ward P, Artan S, et al. Small marker chromosome identification in metaphase and interphase using centromeric multiplex fish (CM-FISH). Lab Invest. 2001;81:475-481.
52 Brown J, Saracoglu K, Uhrig S, et al. Subtelomeric chromosome rearrangements are detected using an innovative 12-color FISH assay (M-TEL). Nat Med. 2001;7:497-501.
53 Fauth C, Zhang H, Harabacz S, et al. A new strategy for the detection of subtelomeric rearrangements. Hum Genet. 2001;109:576-583.
54 Kakazu N, Abe T. Multicolor banding technique, spectral color banding (SCAN): new development and applications. Cytogenet Genome Res. 2006;114:250-256.
55 Teixeira MR, Micci F, Dietrich CU, et al. Cross-species color banding characterization of chromosomal rearrangements in leukemias with incomplete G-band karyotypes. Genes Chromosomes Cancer. 1999;26:13-19.
56 Liehr T, Weise A, Heller A, et al. Multicolor chromosome banding (MCB) with YAC/BAC-based probes and region-specific microdissection DNA libraries. Cytogenet Genome Res. 2002;97:43-50.
57 Ørntoft TF, Thykjaer T, Waldman FM, et al. Genome-wide study of gene copy numbers, transcripts, and protein levels in pairs of non-invasive and invasive human transitional cell carcinomas. Mol Cell Proteomics. 2002;1:37-45.
58 Anderson L, Seilhamer J. A comparison of selected mRNA and protein abundances in human liver. Electrophoresis. 1997;18:533-537.
59 Lichtinghagen R, Musholt PB, Lein M, et al. Different mRNA and protein expression of matrix metalloproteinases 2 and 9 and tissue inhibitor of metalloproteinases 1 in benign and malignant prostate tissue. Eur Urol. 2002;42:398-406.
60 Burnette WN. “Western blotting”: electrophoretic transfer of proteins from sodium dodecyl sulfate–polyacrylamide gels to unmodified nitrocellulose and radiographic detection with antibody and radioiodinated protein A. Anal Biochem. 1981;112:195-203.
61 Towbin H, Staehelin T, Gordon J. Electrophoretic transfer of proteins from polyacrylamide gels to nitrocellulose sheets: procedure and some applications. Proc Natl Acad Sci U S A. 1979;76:4350-4354.
62 Renart J, Reiser J, Stark GR. Transfer of proteins from gels to diazobenzyloxymethyl-paper and detection with antisera: a method for studying antibody specificity and antigen structure. Proc Natl Acad Sci U S A. 1979;76:3116-3120.
63 Spieker-Polet H, Sethupathi P, Yam PC, et al. Rabbit monoclonal antibodies: generating a fusion partner to produce rabbit-rabbit hybridomas. Proc Natl Acad Sci U S A. 1995;92:9348-9352.
64 Rossi S, Laurino L, Furlanetto A, et al. Rabbit monoclonal antibodies: a comparative study between a novel category of immunoreagents and the corresponding mouse monoclonal antibodies. Am J Clin Pathol. 2005;124:295-302.
65 Zellner M, Babeluk R, Diestinger M, et al. Fluorescence-based Western blotting for quantitation of protein biomarkers in clinical samples. Electrophoresis. 2008;29:3621-3627.
66 Dickinson J, Fowler SJ. Quantification of proteins on Western blots using ECL. In: Walker JM, editor. The Protein Protocols Handbook. New York: Humana Press; 2002:429-437.
67 Crowther JR. ELISA. Theory and practice. Methods Mol Biol. 1995;42:1-218.
68 Celis JE, Lauridsen JB, Basse B. Determination of antibody specificity by Western blotting and immunoprecipitation. In: Celis JE, Carter NP, Shotton DM, et al, editors. Cell Biology: A Laboratory Handbook. San Diego: Academic Press; 1998:429-437.
69 Harlow E, Lane D. Antibodies: A Laboratory Manual. Cold Spring Harbor, NY: Cold Spring Harbor Laboratory; 1988.
70 Ouzounis CA, Coulson RM, Enright AJ, et al. Classification schemes for protein structure and function. Nat Rev Genet. 2003;4:508-519.
71 Lehne B, Schlitt T. Protein-protein interaction databases: keeping up with growing interactomes. Hum Genomics. 2009;3:291-297.
72 Monti M, Orrù S, Pagnozzi D, et al. Functional proteomics. Clin Chim Acta. 2005;357:140-150.
73 Mayer BJ, Jackson PK, Baltimore D. The noncatalytic src homology region 2 segment of abl tyrosine kinase binds to tyrosine-phosphorylated cellular proteins with high affinity. Proc Natl Acad Sci U S A. 1991;88:627-631.
74 Wine RN, Dial JM, Tomer KB, et al. Identification of components of protein complexes using a fluorescent photo-cross-linker and mass spectrometry. Anal Chem. 2002;74:1939-1945.
75 Hurst GB, Lankford TK, Kennel SJ. Mass spectrometric detection of affinity purified crosslinked peptides. J Am Soc Mass Spectrom. 2004;15:832-839.
76 Gavin AC, Bosche M, Krause R, et al. Functional organization of the yeast proteome by systematic analysis of protein complexes. Nature. 2002;415:141-147.
77 Sinz A. Chemical cross-linking and mass spectrometry to map three-dimensional protein structures and protein-protein interactions. Mass Spectrom Rev. 2006;25:663-682.
78 Tang X, Bruce JE. Tissue analysis with high-resolution imaging. In: Lipton MS, Pasa-Tolic L, editors. Mass Spectrometry of Proteins and Peptides: Methods and Protocols. New York: Springer; 2004:283-293.
79 Suchanek M, Radzikowska A, Thiele C. Photo-leucine and photo-methionine allow identification of protein-protein interactions in living cells. Nat Methods. 2005;2:261-267.
80 Koch T, Suenson E, Korsholm B, et al. Pitfalls in characterization of protein interactions using radioiodinated crosslinking reagents. Preparation and testing of a novel photochemical 125I-label transfer reagent. Bioconjug Chem. 1994;5:205-212.
81 Fancy DA. Elucidation of protein-protein interactions using chemical cross-linking or label transfer techniques. Curr Opin Chem Biol. 2000;4:28-33.
82 Fields S, Song O. A novel genetic system to detect protein-protein interactions. Nature. 1989;340:245-246.
83 Meyer T, Teruel MN. Fluorescence imaging of signaling networks. Trends Cell Biol. 2003;13:101-106.
84 Giepmans BN, Adams SR, Ellisman MH, et al. The fluorescent toolbox for assessing protein location and function. Science. 2006;312:217-224.
85 Piston DW, Kremers GJ. Fluorescent protein FRET: the good, the bad and the ugly. Trends Biochem Sci. 2007;32:407-414.
86 Teruel MN, Meyer T. Translocation and reversible localization of signaling proteins: a dynamic future for signal transduction. Cell. 2000;103:181-184.
87 Miyawaki A. Innovations in the imaging of brain functions using fluorescent proteins. Neuron. 2005;48:189-199.
88 Shaner NC, Steinbach PA, Tsien RY. A guide to choosing fluorescent proteins. Nat Methods. 2005;2:905-909.
89 Pédelacq JD, Cabantous S, Tran T, et al. Engineering and characterization of a superfolder green fluorescent protein. Nat Biotechnol. 2006;24:79-88.
90 Sheridan DL, Berlot CH, Robert A, et al. A new way to rapidly create functional, fluorescent fusion proteins: random insertion of GFP with an in vitro transposition reaction. BMC Neurosci. 2002;3:7.
91 Dymecki SM, Kim JC. Molecular neuroanatomy’s “Three Gs”: a primer. Neuron. 2007;54:17-34.
92 Dorsett Y, Tuschl T. siRNAs: applications in functional genomics and potential as therapeutics. Nat Rev Drug Discov. 2004;3:318-329.
93 Gregory RI, Chendrimada TP, Cooch N, et al. Human RISC couples microRNA biogenesis and posttranscriptional gene silencing. Cell. 2005;123:631-640.
94 Maniataki E, Mourelatos Z. A human, ATP-independent, RISC assembly machine fueled by pre-miRNA. Genes Dev. 2005;19:2979-2990.
95 MacRae IJ, Ma E, Zhou M, et al. In vitro reconstitution of the human RISC-loading complex. Proc Natl Acad Sci U S A. 2008;105:512-517.
96 Xia H, Mao Q, Paulson HL, et al. siRNA-mediated gene silencing in vitro and in vivo. Nat Biotechnol. 2002;20:1006-1010.
97 Hommel JD, Sears RM, Georgescu D, et al. Local gene knockdown in the brain using viral-mediated RNA interference. Nat Med. 2003;9:1539-1544.
98 Matsuda T, Cepko CL. Electroporation and RNA interference in the rodent retina in vivo and in vitro. Proc Natl Acad Sci U S A. 2004;101:16-22.
99 Mellitzer G, Hallonet M, Chen L, et al. Spatial and temporal ‘knock down’ of gene expression by electroporation of double-stranded RNA and morpholinos into early postimplantation mouse embryos. Mech Dev. 2002;118:57-63.
100 Kong XC, Barzaghi P, Ruegg MA. Inhibition of synapse assembly in mammalian muscle in vivo by RNA interference. EMBO Rep. 2004;5:183-188.
101 Sørensen DR, Leirdal M, Sioud M. Gene silencing by systemic delivery of synthetic siRNAs in adult mice. J Mol Biol. 2003;327:761-766.
102 Lewis DL, Hagstrom JE, Loomis AG, et al. Efficient delivery of siRNA for inhibition of gene expression in postnatal mice. Nat Genet. 2002;32:107-108.
103 Song E, Lee SK, Wang J, et al. RNA interference targeting Fas protects mice from fulminant hepatitis. Nat Med. 2003;9:347-351.
104 Mittal V. Improving the efficiency of RNA interference in mammals. Nat Rev Genet. 2004;5:355-365.
105 Wiznerowicz M, Trono D. Conditional suppression of cellular genes: lentivirus vector-mediated drug-inducible RNA interference. J Virol. 2003;77:8957-8961.
106 Matsukura S, Jones PA, Takai D. Establishment of conditional vectors for hairpin siRNA knockdowns. Nucleic Acids Res. 2003;31(15):e77.
107 Czauderna F, Santel A, Hinz M, et al. Inducible shRNA expression for application in a prostate cancer mouse model. Nucleic Acids Res. 2003;31(21):e127.
108 Van Craenenbroeck K, Vanhoenacker P, Leysen JE, et al. Evaluation of the tetracycline- and ecdysone-inducible systems for expression of neurotransmitter receptors in mammalian cells. Eur J Neurosci. 2001;14:968-976.
109 Gupta S, Schoer RA, Egan JE, et al. Inducible, reversible, and stable RNA interference in mammalian cells. Proc Natl Acad Sci U S A. 2004;101:1927-1932.
110 Shah S, Rangarajan S, Friedman SH. Light-activated RNA interference. Angew Chem Int Ed Engl. 2005;44:1328-1332.
111 Barrett LE, Sul JY, Takano H, et al. Region-directed phototransfection reveals the functional significance of a dendritically synthesized transcription factor. Nat Methods. 2006;3:455-460.
112 Jackson AL, Bartz SR, Schelter J, et al. Expression profiling reveals off-target gene regulation by RNAi. Nat Biotechnol. 2003;21:635-637.
113 Chi JT, Chang HY, Wang NN, et al. Genomewide view of gene silencing by small interfering RNAs. Proc Natl Acad Sci U S A. 2003;100:6343-6346.
114 Bridge AJ, Pebernard S, Ducraux A, et al. Induction of an interferon response by RNAi vectors in mammalian cells. Nat Genet. 2003;34:263-264.
115 Sledz CA, Holko M, de Veer MJ, et al. Activation of the interferon system by short-interfering RNAs. Nat Cell Biol. 2003;5:834-839.
116 Saxena S, Jønsson ZO, Dutta A. Small RNAs with imperfect match to endogenous mRNA repress translation. Implications for off-target activity of small inhibitory RNA in mammalian cells. J Biol Chem. 2003;278:44312-44319.
117 Doench JG, Petersen CP, Sharp PA. siRNAs can function as miRNAs. Genes Dev. 2003;17:438-442.
118 Zeng Y, Yi R, Cullen BR. MicroRNAs and small interfering RNAs can inhibit mRNA expression by similar mechanisms. Proc Natl Acad Sci U S A. 2003;100:9779-9784.
119 Fedorov Y, Anderson EM, Birmingham A, et al. Off-target effects by siRNA can induce toxic phenotype. RNA. 2006;12:1188-1196.
120 Jackson AL, Burchard J, Leake D, et al. Position-specific chemical modification of siRNAs reduces “off-target” transcript silencing. RNA. 2006;12:1197-1205.
121 Elbashir SM, Martinez J, Patkaniowska A, et al. Functional anatomy of siRNAs for mediating efficient RNAi in Drosophila melanogaster embryo lysate. EMBO J. 2001;20:6877-6888.
122 Miller VM, Xia H, Marrs GL, et al. Allele-specific silencing of dominant disease genes. Proc Natl Acad Sci U S A. 2003;100:7195-7200.
123 Semizarov D, Frost L, Sarthy A, et al. Specificity of short interfering RNA determined through gene expression signatures. Proc Natl Acad Sci U S A. 2003;100:6347-6352.
124 Whither RNAi? [Editorial]. Nat Cell Biol. 2003;5:489-490.
125 Hood L, Perlmutter RM. The impact of systems approaches on biological problems in drug discovery. Nat Biotechnol. 2004;22:1215-1217.
126 Hood L, Heath JR, Phelps ME, et al. Systems biology and new technologies enable predictive and preventative medicine. Science. 2004;306:640-643.
127 Mackler SA, Brooks BP, Eberwine JH. Stimulus-induced coordinate changes in mRNA abundance in single postsynaptic hippocampal CA1 neurons. Neuron. 1992;9:539-548.
128 Mackler SA, Eberwine JH. Diversity of glutamate receptor subunit mRNA expression within live hippocampal CA1 neurons. Mol Pharmacol. 1993;44:308-315.
129 Schena M, Shalon D, Davis RW, et al. Quantitative monitoring of gene expression patterns with a complementary DNA microarray. Science. 1995;270:467-470.
130 Fodor SP, Read JL, Pirrung MC, et al. Light-directed, spatially addressable parallel chemical synthesis. Science. 1991;251:767-773.
131 Blanchard A. Synthetic DNA arrays. Genet Eng (N Y). 1998;20:111-123.
132 Harrison PJ, Heath PR, Eastwood SL. The relative importance of premortem acidosis and postmortem interval for human brain gene expression studies: selective mRNA vulnerability and comparison with their encoded proteins. Neurosci Lett. 1995;200:151-154.
133 Nair SM, Werkman TR, Craig J, et al. Corticosteroid regulation of ion channel conductances and mRNA levels in individual hippocampal CA1 neurons. J Neurosci. 1998;18:2685-2696.
134 Sugino K, Hempel CM, Miller MN, et al. Molecular taxonomy of major neuronal classes in the adult mouse forebrain. Nat Neurosci. 2006;9:99-107.
135 Miyashiro K, Dichter M, Eberwine J. On the nature and differential distribution of mRNAs in hippocampal neurites: implications for neuronal functioning. Proc Natl Acad Sci U S A. 1994;91:10800-10804.
136 Crino PB, Eberwine J. Molecular characterization of the dendritic growth cone: regulated mRNA transport and local protein synthesis. Neuron. 1996;17:1173-1187.
137 Ginsberg SD, Hemby SE, Lee VM, et al. Expression profile of transcripts in Alzheimer’s disease tangle-bearing CA1 neurons. Ann Neurol. 2000;48:77-87.
138 Marciano PG, Brettschneider J, Manduchi E, et al. Neuron-specific mRNA complexity responses during hippocampal apoptosis after traumatic brain injury. J Neurosci. 2004;24:2866-2876.
139 Esposito G. Complementary techniques: laser capture microdissection—increasing specificity of gene expression profiling of cancer specimens. Adv Exp Med Biol. 2007;593:54-65.
140 Smyth GK, Speed T. Normalization of cDNA microarray data. Methods. 2003;31:265-273.
141 Smyth GK, Yang YH, Speed T. Statistical issues in cDNA microarray data analysis. Methods Mol Biol. 2003;224:111-136.
142 Okoniewski MJ, Miller CJ. Comprehensive analysis of affymetrix exon arrays using BioConductor. PLoS Comput Biol. 2008;4(2):e6.
143 Barnes M, Freudenberg J, Thompson S, et al. Experimental comparison and cross-validation of the Affymetrix and Illumina gene expression analysis platforms. Nucleic Acids Res. 2005;33:5914-5923.
144 Bosotti R, Locatelli G, Healy S, et al. Cross platform microarray analysis for robust identification of differentially expressed genes. BMC Bioinformatics. 2007;8(suppl 1):S5.
145 ‘tPedotti P, Hoen PA, Vreugdenhil E, et al. Can subtle changes in gene expression be consistently detected with different microarray platforms? BMC Genomics. 2008;9:124.
146 Southern E, Mir K, Shchepinov M. Molecular interactions on microarrays. Nat Genet. 1999;21:5-9.
147 Ji Y, Coombes K, Zhang J, et al. RefSeq refinements of UniGene-based gene matching improve the correlation of expression measurements between two microarray platforms. Appl Bioinformatics. 2006;5:89-98.
148 Carter SL, Eklund AC, Mecham BH, et al. Redefinition of Affymetrix probe sets by sequence overlap with cDNA microarray probes reduces cross-platform inconsistencies in cancer-associated gene expression measurements. BMC Bioinformatics. 2005;6:107.
149 Wang Z, Gerstein M, Snyder M. RNA-Seq: a revolutionary tool for transcriptomics. Nat Rev Genet. 2009;10:57-63.
150 Mortazavi A, Williams BA, McCue K, et al. Mapping and quantifying mammalian transcriptomes by RNA-Seq. Nat Methods. 2008;5:621-628.
151 Nagalakshmi U, Wang Z, Waern K, et al. The transcriptional landscape of the yeast genome defined by RNA sequencing. Science. 2008;320:1344-1349.
152 Oldham MC, Konopka G, Iwamoto K, et al. Functional organization of the transcriptome in human brain. Nat Neurosci. 2008;11:1271-1282.
153 Biressi S, Tagliafico E, Lamorte G, et al. Intrinsic phenotypic diversity of embryonic and fetal myoblasts is revealed by genome-wide gene expression analysis on purified cells. Dev Biol. 2007;304:633-651.
154 Hughes TR, Marton MJ, Jones AR, et al. Functional discovery via a compendium of expression profiles. Cell. 2000;102:109-126.
155 Marton MJ, DeRisi JL, Bennett HA, et al. Drug target validation and identification of secondary drug target effects using DNA microarrays. Nat Med. 1998;4:1293-1301.
156 Idaghdour Y, Storey JD, Jadallah SJ, et al. A genome-wide gene expression signature of environmental geography in leukocytes of Moroccan Amazighs. PLoS Genet. 2008;4(4):e1000052.
157 Kohane IS, Butte AJ, Kho A. Microarrays for an Integrative Genomics. Cambridge, MA: MIT Press; 2002.
158 Southan C. Has the yo-yo stopped? An assessment of human protein-coding gene number. Proteomics. 2004;4:1712-1726.
159 Wang ET, Sandberg R, Luo S, et al. Alternative isoform regulation in human tissue transcriptomes. Nature. 2008;456:470-476.
160 Faustino NA, Cooper TA. Pre-mRNA splicing and human disease. Genes Dev. 2003;17:419-437.
161 Garcia-Blanco MA, Baraniak AP, Lasda EL. Alternative splicing in disease and therapy. Nat Biotechnol. 2004;22:535-546.
162 Black DL. Mechanisms of alternative pre-messenger RNA splicing. Annu Rev Biochem. 2003;72:291-336.
163 Tseng-Crank J, Foster CD, Krause JD, et al. Cloning, expression, and distribution of functionally distinct Ca(2+)-activated K+ channel isoforms from human brain. Neuron. 1994;13:1315-1330.
164 Yeo G, Holste D, Kreiman G, et al. Variation in alternative splicing across human tissues. Genome Biol. 2004;5(10):R74.
165 Pando MP, Kotraiah V, McGowan K, et al. Alternative isoform discrimination by the next generation of expression profiling microarrays. Expert Opin Ther Targets. 2006;10:613-625.
166 Clark TA, Schweitzer AC, Chen TX, et al. Discovery of tissue-specific exons using comprehensive human exon microarrays. Genome Biol. 2007;8(4):R64.
167 Bemmo A, Benovoy D, Kwan T, et al. Gene expression and isoform variation analysis using Affymetrix Exon Arrays. BMC Genomics. 2008;9:529.
168 Relógio A, Ben-Dov C, Baum M, et al. Alternative splicing microarrays reveal functional expression of neuron-specific regulators in Hodgkin lymphoma cells. J Biol Chem. 2005;280:4779-4784.
169 Cheung HC, Baggerly KA, Tsavachidis S, et al. Global analysis of aberrant pre-mRNA splicing in glioblastoma using exon expression arrays. BMC Genomics. 2008;9:216.
170 Thomson JM, Parker J, Perou CM, et al. A custom microarray platform for analysis of microRNA gene expression. Nat Methods. 2004;1:47-53.
171 Nelson PT, Baldwin DA, Scearce LM, et al. Microarray-based, high-throughput gene expression profiling of microRNAs. Nat Methods. 2004;1:155-161.
172 O’Neill LP, VerMilyea MD, Turner BM. Epigenetic characterization of the early embryo with a chromatin immunoprecipitation protocol applicable to small cell populations. Nat Genet. 2006;38:835-841.
173 Dahl JA, Collas P. A rapid micro chromatin immunoprecipitation assay (microChIP). Nat Protoc. 2008;3:1032-1045.
174 Barski A, Frenkel B. ChIP Display: novel method for identification of genomic targets of transcription factors. Nucleic Acids Res. 2004;32(12):e104.
175 Bertone P, Trifonov V, Rozowsky JS, et al. Design optimization methods for genomic DNA tiling arrays. Genome Res. 2006;16:271-281.
176 Hecht A, Laroche T, Strahl-Bolsinger S, et al. Histone H3 and H4 N-termini interact with SIR3 and SIR4 proteins: a molecular model for the formation of heterochromatin in yeast. Cell. 1995;80:583-592.
177 Brownell JE, Zhou J, Ranalli T, et al. Tetrahymena histone acetyltransferase A: a homolog to yeast Gcn5p linking histone acetylation to gene activation. Cell. 1996;84:843-851.
178 Taunton J, Hassig CA, Schreiber SL. A mammalian histone deacetylase related to the yeast transcriptional regulator Rpd3p. Science. 1996;272:408-411.
179 ENCODE Project Consortium. The ENCODE (ENCyclopedia Of DNA Elements) Project. Science. 2004;306:636-640.
180 Zambrowicz BP, Friedrich GA, Buxton EC, et al. Disruption and sequence identification of 2,000 genes in mouse embryonic stem cells. Nature. 1998;392:608-611.
181 Wu SC-Y, Maragathavally KJ, Coates CJ, et al. Chromosomal Mutagenesis. In: Steps towards targeted insertional mutagenesis with class II transposable elements, Davis GD, Kayser KJ. Chromosomal Mutagenesis. New York: Springer: Steps towards targeted insertional mutagenesis with class II transposable elements; 2007:139-151.
182 Nagy A. Cre recombinase: the universal reagent for genome tailoring. Genesis. 2000;26:99-109.
183 Fiering S, Epner E, Robinson K, et al. Targeted deletion of 5′HS2 of the murine beta-globin LCR reveals that it is not essential for proper regulation of the beta-globin locus. Genes Dev. 1995;9:2203-2213.
184 Meyers EN, Lewandoski M, Martin GR. An Fgf8 mutant allelic series generated by Cre- and Flp-mediated recombination. Nat Genet. 1998;18:136-141.
185 Nagy A, Moens C, Ivanyi E, et al. Dissecting the role of N-myc in development using a single targeting vector to generate a series of alleles. Curr Biol. 1998;8:661-664.
186 Lakso M, Sauer B, Mosinger BJr, et al. Targeted oncogene activation by site-specific recombination in transgenic mice. Proc Natl Acad Sci U S A. 1992;89:6232-6236.
187 Kuroda T, Tada M, Kubota H, et al. Octamer and Sox elements are required for transcriptional cis regulation of Nanog gene expression. Mol Cell Biol. 2005;25:2475-2485.
188 Rodda DJ, Chew JL, Lim LH, et al. Transcriptional regulation of nanog by OCT4 and SOX2. J Biol Chem. 2005;280:24731-24737.
189 Boyer LA, Lee TI, Cole MF, et al. Core transcriptional regulatory circuitry in human embryonic stem cells. Cell. 2005;122:947-956.
190 Pilpel Y, Sudarsanam P, Church GM. Identifying regulatory networks by combinatorial analysis of promoter elements. Nat Genet. 2001;29:153-159.
191 Ihmels J, Friedlander G, Bergmann S, et al. Revealing modular organization in the yeast transcriptional network. Nat Genet. 2002;31:370-377.
192 Segal E, Shapira M, Regev A, et al. Module networks: identifying regulatory modules and their condition-specific regulators from gene expression data. Nat Genet. 2003;34:166-176.
193 Greco D, Volpicelli F, Di Lieto A, et al. Comparison of gene expression profile in embryonic mesencephalon and neuronal primary cultures. PLoS ONE. 2009;4:e4977.
194 Johnson R, Teh CH, Kunarso G, et al. REST regulates distinct transcriptional networks in embryonic and neural stem cells. PLoS Biol. 2008;6(10):e256.
195 Hu G, Kim J, Xu Q, et al. A genome-wide RNAi screen identifies a new transcriptional module required for self-renewal. Genes Dev. 2009;23:837-848.
196 Ng SY, Yoshida T, Zhang J, et al. Genome-wide lineage-specific transcriptional networks underscore Ikaros-dependent lymphoid priming in hematopoietic stem cells. Immunity. 2009;30:493-507.
197 FANTOM ConsortiumSuzuki H, Forrest AR, van Nimwegen E, et al. The transcriptional network that controls growth arrest and differentiation in a human myeloid leukemia cell line. Nat Genet. 2009;41:553-562.
198 Ohta T. Near-neutrality in evolution of genes and gene regulation. Proc Natl Acad Sci U S A. 2002;99:16134-16137.
199 International HapMap Consortium. A haplotype map of the human genome. Nature. 2005;437:1299-1320.
200 Hinds DA, Stuve LL, Nilsen GB, et al. Whole-genome patterns of common DNA variation in three human populations. Science. 2005;307:1072-1079.
201 International HapMap ConsortiumFrazer KA, Ballinger DG, Cox DR, et al. A second generation human haplotype map of over 3.1 million SNPs. Nature. 2007;449:851-861.
202 Parker SC, Hansen L, Abaan HO, et al. Local DNA topography correlates with functional noncoding regions of the human genome. Science. 2009;324:389-392.
203 Koboldt DC, Miller RD, Kwok PY. Distribution of human SNPs and its effect on high-throughput genotyping. Hum Mutat. 2006;27:249-254.
204 Fan JB, Chee MS, Gunderson KL. Highly parallel genomic assays. Nat Rev Genet. 2006;7:632-644.
205 Ross P, Hall L, Smirnov I, et al. High level multiplex genotyping by MALDI-TOF mass spectrometry. Nat Biotechnol. 1998;16:1347-1351.
206 Chen X, Levine L, Kwok PY. Fluorescence polarization in homogeneous nucleic acid analysis. Genome Res. 1999;9:492-498.
207 Mein CA, Barratt BJ, Dunn MG, et al. Evaluation of single nucleotide polymorphism typing with invader on PCR amplicons and its automation. Genome Res. 2000;10:330-343.
208 Hardenbol P, Banér J, Jain M, et al. Multiplexed genotyping with sequence-tagged molecular inversion probes. Nat Biotechnol. 2003;21:673-678.
209 Fan JB, Oliphant A, Shen R, et al. Highly parallel SNP genotyping. Cold Spring Harb Symp Quant Biol. 2003;68:69-78.
210 Emilsson V, Thorleifsson G, Zhang B, et al. Genetics of gene expression and its effect on disease. Nature. 2008;452:423-428.
211 Cookson W, Liang L, Abecasis G, et al. Mapping complex disease traits with global gene expression. Nat Rev Genet. 2009;10:184-194.
212 Görg A, Postel W, Friedrich C, et al. Temperature-dependent spot positional variability in two-dimensional polypeptide patterns. Electrophoresis. 1991;12:653-658.
213 Klose J. Protein mapping by combined isoelectric focusing and electrophoresis of mouse tissues. A novel approach to testing for induced point mutations in mammals. Humangenetik. 1975;26:231-243.
214 Li J, Zhang Z, Rosenzweig J, et al. Proteomics and bioinformatics approaches for identification of serum biomarkers to detect breast cancer. Clin Chem. 2002;48:1296-1304.
215 Wu WW, Wang G, Baek SJ, et al. Comparative study of three proteomic quantitative methods, DIGE, cICAT, and iTRAQ, using 2D gel- or LC-MALDI TOF/TOF. J Proteome Res. 2006;5:651-658.
216 Ernoult E, Gamelin E, Guette C. Improved proteome coverage by using iTRAQ labelling and peptide OFFGEL fractionation. Proteome Sci. 2008;6:27.
217 Greenbaum D, Colangelo C, Williams K, et al. Comparing protein abundance and mRNA expression levels on a genomic scale. Genome Biol. 2003;4(9):117.
218 Packer NH, Ball MS, Devine PL. Glycoprotein detection of 2-D separated proteins. Methods Mol Biol. 1999;112:341-352.
219 Hart C, Schulenberg B, Steinberg TH, et al. Detection of glycoproteins in polyacrylamide gels and on electroblots using Pro-Q Emerald 488 dye, a fluorescent periodate Schiff-base stain. Electrophoresis. 2003;24:588-598.
220 Martin K, Steinberg TH, Cooley LA, et al. Quantitative analysis of protein phosphorylation status and protein kinase activity on microarrays using a novel fluorescent phosphorylation sensor dye. Proteomics. 2003;3:1244-1255.
221 Schulenberg B, Aggeler R, Beechem JM, et al. Analysis of steady-state protein phosphorylation in mitochondria using a novel fluorescent phosphosensor dye. J Biol Chem. 2003;278:27251-27255.
222 Yeung YG, Wang Y, Einstein DB, et al. Colony-stimulating factor-1 stimulates the formation of multimeric cytosolic complexes of signaling proteins and cytoskeletal components in macrophages. J Biol Chem. 1998;273:17128-17137.
223 Pandey A, Podtelejnikov AV, Blagoev B, et al. Analysis of receptor signaling pathways by mass spectrometry: identification of vav-2 as a substrate of the epidermal and platelet-derived growth factor receptors. Proc Natl Acad Sci U S A. 2000;97:179-184.
224 Brill LM, Salomon AR, Ficarro SB, et al. Robust phosphoproteomic profiling of tyrosine phosphorylation sites from human T cells using immobilized metal affinity chromatography and tandem mass spectrometry. Anal Chem. 2004;76:2763-2772.
225 Wolf-Yadlin A, Kumar N, Zhang Y, et al. Effects of HER2 overexpression on cell signaling networks governing proliferation and migration. Mol Syst Biol. 2006;2:54.
226 Beausoleil SA, Jedrychowski M, Schwartz D, et al. Large-scale characterization of HeLa cell nuclear phosphoproteins. Proc Natl Acad Sci U S A. 2004;101:12130-12135.
227 Olsen JV, Blagoev B, Gnad F, et al. Global, in vivo, and site-specific phosphorylation dynamics in signaling networks. Cell. 2006;127:635-648.
228 Andersson L, Porath J. Isolation of phosphoproteins by immobilized metal (Fe3+) affinity chromatography. Anal Biochem. 1986;154:250-254.
229 Ficarro SB, McCleland ML, Stukenberg PT, et al. Phosphoproteome analysis by mass spectrometry and its application to Saccharomyces cerevisiae. Nat Biotechnol. 2002;20:301-305.
230 Ficarro SB, Salomon AR, Brill LM, et al. Automated immobilized metal affinity chromatography/nano-liquid chromatography/electrospray ionization mass spectrometry platform for profiling protein phosphorylation sites. Rapid Commun Mass Spectrom. 2005;19:57-71.
231 Castegna A, Thongboonkerd V, Klein JB, et al. Proteomic identification of nitrated proteins in Alzheimer’s disease brain. J Neurochem. 2003;85:1394-1401.
232 Kanski J, Behring A, Pelling J, et al. Proteomic identification of 3-nitrotyrosine-containing rat cardiac proteins: effects of biological aging. Am J Physiol Heart Circ Physiol. 2005;288:H371-H381.
233 Gokulrangan G, Zaidi A, Michaelis ML, et al. Proteomic analysis of protein nitration in rat cerebellum: effect of biological aging. J Neurochem. 2007;100:1494-1504.
234 Suzuki Y, Tanaka M, Sohmiya M, et al. Identification of nitrated proteins in the normal rat brain using a proteomics approach. Neurol Res. 2005;27:630-633.
235 Zhang H, Zha X, Tan Y, et al. Phosphoprotein analysis using antibodies broadly reactive against phosphorylated motifs. J Biol Chem. 2002;277:39379-39387.
236 Kane S, Sano H, Liu SC, et al. A method to identify serine kinase substrates. Akt phosphorylates a novel adipocyte protein with a Rab GTPase-activating protein (GAP) domain. J Biol Chem. 2002;277:22115-22118.
237 Grønborg M, Kristiansen TZ, Stensballe A, et al. A mass spectrometry–based proteomic approach for identification of serine/threonine-phosphorylated proteins by enrichment with phospho-specific antibodies: identification of a novel protein, Frigg, as a protein kinase A substrate. Mol Cell Proteomics. 2002;1:517-527.
238 Matsuoka S, Ballif BA, Smogorzewska A, et al. ATM and ATR substrate analysis reveals extensive protein networks responsive to DNA damage. Science. 2007;316:1160-1166.
239 Machida K, Thompson CM, Dierck K, et al. High-throughput phosphotyrosine profiling using SH2 domains. Mol Cell. 2007;26:899-915.
240 Hirabayashi J, Hayama K, Kaji H, et al. Affinity capturing and gene assignment of soluble glycoproteins produced by the nematode Caenorhabditis elegans. J Biochem. 2002;132:103-114.
241 Engelman JA, Zejnullahu K, Mitsudomi T, et al. MET amplification leads to gefitinib resistance in lung cancer by activating ERBB3 signaling. Science. 2007;316:1039-1043.
242 Nikov G, Bhat V, Wishnok JS, et al. Analysis of nitrated proteins by nitrotyrosine-specific affinity probes and mass spectrometry. Anal Biochem. 2003;320:214-222.
243 Abello N, Kerstjens HA, Postma DS, et al. Protein tyrosine nitration: selectivity, physicochemical and biological consequences, denitration, and proteomics methods for the identification of tyrosine-nitrated proteins. J Proteome Res. 2009;8:3222-3238.
244 Ong SE, Mittler G, Mann M. Identifying and quantifying in vivo methylation sites by heavy methyl SILAC. Nat Methods. 2004;1:119-126.
245 O’Farrell PH. High resolution two-dimensional electrophoresis of proteins. J Biol Chem. 1975;250:4007-4021.
246 Molloy MP, Brzezinski EE, Hang J, et al. Overcoming technical variation and biological variation in quantitative proteomics. Proteomics. 2003;3:1912-1919.
247 Unlü M, Morgan ME, Minden JS. Difference gel electrophoresis: a single gel method for detecting changes in protein extracts. Electrophoresis. 1997;18:2071-2077.
248 Tonge R, Shaw J, Middleton B, et al. Validation and development of fluorescence two-dimensional differential gel electrophoresis proteomics technology. Proteomics. 2001;1:377-396.
249 Shaw J, Rowlinson R, Nickson J, et al. Evaluation of saturation labelling two-dimensional difference gel electrophoresis fluorescent dyes. Proteomics. 2003;3:1181-1195.
250 Alban A, David SO, Bjorkesten L, et al. A novel experimental design for comparative two-dimensional gel analysis: two-dimensional difference gel electrophoresis incorporating a pooled internal standard. Proteomics. 2003;3:36-44.
251 Knowles MR, Cervino S, Skynner HA, et al. Multiplex proteomic analysis by two-dimensional differential in-gel electrophoresis. Proteomics. 2003;3:1162-1171.
252 Rabilloud T, Adessi C, Giraudel A, et al. Improvement of the solubilization of proteins in two-dimensional electrophoresis with immobilized pH gradients. Electrophoresis. 1997;18:307-316.
253 Gygi SP, Corthals GL, Zhang Y, et al. Evaluation of two-dimensional gel electrophoresis-based proteome analysis technology. Proc Natl Acad Sci U S A. 2000;97:9390-9395.
254 Issaq HJ, Veenstra TD, Conrads TP, et al. The SELDI-TOF MS approach to proteomics: protein profiling and biomarker identification. Biochem Biophys Res Commun. 2002;292:587-592.
255 Petricoin EF, Ardekani AM, Hitt BA, et al. Use of proteomic patterns in serum to identify ovarian cancer. Lancet. 2002;359:572-577.
256 Adam BL, Vlahou A, Semmes OJ, et al. Proteomic approaches to biomarker discovery in prostate and bladder cancers. Proteomics. 2001;1:1264-1270.
257 Gygi SP, Rist B, Gerber SA, et al. Quantitative analysis of complex protein mixtures using isotope-coded affinity tags. Nat Biotechnol. 1999;17:994-999.
258 Zhang R, Sioma CS, Wang S, et al. Fractionation of isotopically labeled peptides in quantitative proteomics. Anal Chem. 2001;73:5142-5149.
259 Tannu NS, Hemby SE. Methods for proteomics in neuroscience. Prog Brain Res. 2006;158:41-82.
260 Ross PL, Huang YN, Marchese JN, et al. Multiplexed protein quantitation in Saccharomyces cerevisiae using amine-reactive isobaric tagging reagents. Mol Cell Proteomics. 2004;3:1154-1169.
261 Washburn MP, Wolters D, Yates JR3rd. Large-scale analysis of the yeast proteome by multidimensional protein identification technology. Nat Biotechnol. 2001;19:242-247.
262 Ong SE, Blagoev B, Kratchmarova I, et al. Stable isotope labeling by amino acids in cell culture, SILAC, as a simple and accurate approach to expression proteomics. Mol Cell Proteomics. 2002;1:376-386.
263 Amanchy R, Kalume DE, Iwahori A, et al. Phosphoproteome analysis of HeLa cells using stable isotope labeling with amino acids in cell culture (SILAC). J Proteome Res. 2005;4:1661-1671.
264 Blagoev B, Ong SE, Kratchmarova I, et al. Temporal analysis of phosphotyrosine-dependent signaling networks by quantitative proteomics. Nat Biotechnol. 2004;22:1139-1145.
265 Trester-Zedlitz M, Burlingame A, Kobilka B, et al. Mass spectrometric analysis of agonist effects on posttranslational modifications of the beta-2 adrenoceptor in mammalian cells. Biochemistry. 2005;44:6133-6143.
266 Ballif BA, Roux PP, Gerber SA, et al. Quantitative phosphorylation profiling of the ERK/p90 ribosomal S6 kinase-signaling cassette and its targets, the tuberous sclerosis tumor suppressors. Proc Natl Acad Sci U S A. 2005;102:667-672.
267 Zolnierowicz S, Bollen M. Protein phosphorylation and protein phosphatases. De Panne, Belgium, September 19-24, 1999. EMBO J. 2000;19:483-488.
268 Lai HC, Johnson JE. Neurogenesis or neuronal specification: phosphorylation strikes again!. Neuron. 2008;58:3-5.
269 Wayman GA, Lee YS, Tokumitsu H, et al. Calmodulin-kinases: modulators of neuronal development and plasticity. Neuron. 2008;59:914-931.
270 Ogasawara H, Doi T, Kawato M. Systems biology perspectives on cerebellar long-term depression. Neurosignals. 2008;16:300-317.
271 Somers DE, Fujiwara S, Kim WY, et al. Posttranslational photomodulation of circadian amplitude. Cold Spring Harb Symp Quant Biol. 2007;72:193-200.
272 Schlosser A, Pipkorn R, Bossemeyer D, et al. Analysis of protein phosphorylation by a combination of elastase digestion and neutral loss tandem mass spectrometry. Anal Chem. 2001;73:170-176.
273 Steen H, Küster B, Fernandez M, et al. Detection of tyrosine phosphorylated peptides by precursor ion scanning quadrupole TOF mass spectrometry in positive ion mode. Anal Chem. 2001;73:1440-1448.
274 Tannu NS, Howell LL, Hemby SE. Integrative proteomic analysis of the nucleus accumbens in rhesus monkeys following cocaine self-administration. Mol Psychiatry. 2010;15:185-203.
275 Thelemann A, Petti F, Griffin G, et al. Phosphotyrosine signaling networks in epidermal growth factor receptor overexpressing squamous carcinoma cells. Mol Cell Proteomics. 2005;4:356-376.
276 Wingren C, Borrebaeck CA. Antibody-based microarrays. Methods Mol Biol. 2009;509:57-84.
277 Gao WM, Kuick R, Orchekowski RP, et al. Distinctive serum protein profiles involving abundant proteins in lung cancer patients based upon antibody microarray analysis. BMC Cancer. 2005;5:110.
278 Hudelist G, Singer CF, Kubista E, et al. Use of high-throughput arrays for profiling differentially expressed proteins in normal and malignant tissues. Anticancer Drugs. 2005;16:683-689.
279 Gembitsky DS, Lawlor K, Jacovina A, et al. A prototype antibody microarray platform to monitor changes in protein tyrosine phosphorylation. Mol Cell Proteomics. 2004;3:1102-1118.
280 Flores-Delgado G, Liu CW, Sposto R, et al. A limited screen for protein interactions reveals new roles for protein phosphatase 1 in cell cycle control and apoptosis. J Proteome Res. 2007;6:1165-1175.
281 Belov L, de la Vega O, dos Remedios CG, et al. Immunophenotyping of leukemias using a cluster of differentiation antibody microarray. Cancer Res. 2001;61:4483-4489.
282 Huang RP, Huang R, Fan Y, et al. Simultaneous detection of multiple cytokines from conditioned media and patient’s sera by an antibody-based protein array system. Anal Biochem. 2001;294:55-62.
283 Angenendt P, Wilde J, Kijanka G, et al. Seeing better through a MIST: evaluation of monoclonal recombinant antibody fragments on microarrays. Anal Chem. 2004;76:2916-2921.
284 Wingren C, Steinhauer C, Ingvarsson J, et al. Microarrays based on affinity-tagged single-chain Fv antibodies: sensitive detection of analyte in complex proteomes. Proteomics. 2005;5:1281-1291.
285 Wingren C, Borrebaeck CAK. Antibody-based microarrays. In: Bilitewski U, editor. Microchip Methods in Diagnostics. New York: Humana Press; 2009:57084.
286 VanMeter A, Signore M, Pierobon M, et al. Reverse-phase protein microarrays: application to biomarker discovery and translational medicine. Expert Rev Mol Diagn. 2007;7:625-633.