Measurement and implications of the  s/
s/ t
t
Hypoxemia can be caused by a variety of factors (Box 32-1). This chapter will focus on the primary cause of hypoxemia—shunting, which may, at times, be due to ventilation/perfusion ( /
/ ) mismatch.
Ventilation/perfusion mismatch
Ideally, pulmonary perfusion ( ) evenly matches alveolar ventilation at all levels of the lung; however, perfect matching does not occur because the distribution of ventilation and perfusion and the
  /
/ ratio vary throughout the lung. A normal lung has a
  /
/ ratio of approximately 0.8. A
  /
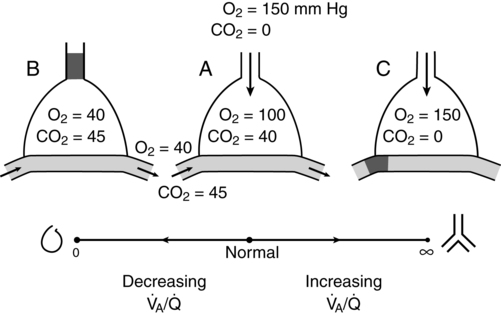
/ ratio of 0 (i.e., a shunt) exists when perfused alveoli have no ventilation and the values for PO2 and PCO2 of the trapped air are the same as those of mixed venous blood (PO2 = 40 mm Hg and PCO2 = 47 mm Hg). Conversely, a
  /
/ ratio of ∞ exists when ventilated alveoli have no perfusion and, at sea level, the PO2 and PCO2 equal approximately 150 and 0 mm Hg, respectively. Nonperfused alveoli (i.e., alveolar dead space) is approximately 25 to 50 mL in a healthy 70-kg person. Figure 32-1 depicts the progression of a
  /
/ ratio from 0 to ∞; the normal, idealized, alveolar-capillary unit is shown as example A.
 /
/ ratio improves, better oxygenating blood. A low P
Shunting due to other causes
Hypoxemia that is the result of a physiologic or anatomic shunt cannot be corrected by having the patient breathe supplemental O2. The hemoglobin in blood that perfuses alveoli with a  /
/ ratio of 1 will readily achieve 100% saturation; increasing the partial pressure of O2 in these alveoli will minimally increase the O2 content. Blood that perfuses alveoli with a
  /
/ ratio of 0 will not be exposed to any O2, no matter the fraction of inspired O2 (FIO2); therefore, no significant improvement in arterial oxygenation occurs (Figure 32-2).
 A/
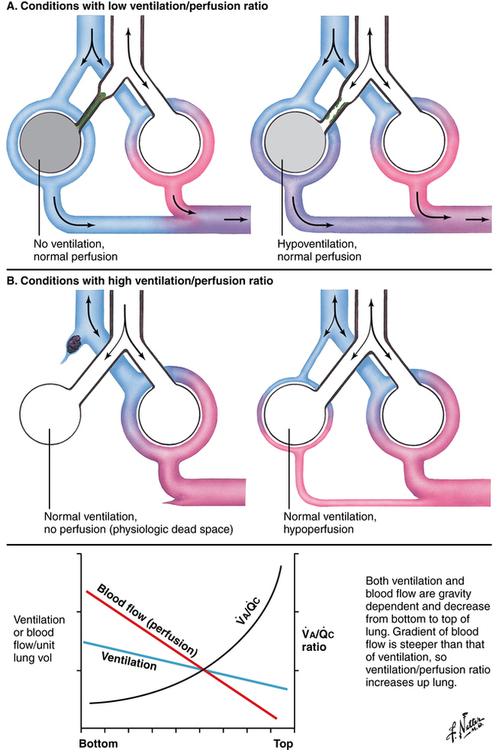
A/ c), is lowest at the bottom of the lung and greatest at the top of the lung (B).
  A/
A/ c is also affected by various other conditions affecting ventilation and perfusion (A and B). (Netter illustration from www.netterimages.com. © Elsevier Inc. All rights reserved.)
 s/
s/ t):
t):
 represents the O2 content of mixed venous blood. The O2 content of arterial blood is calculated by:
 are calculated by inserting the respective O2 saturation and Pa