Lung ultrasound in acute respiratory distress syndrome (ARDS)
Overview
Acute respiratory distress syndrome (ARDS) is a clinical entity characterized by acute inflammatory lung injury, increased pulmonary vascular permeability and lung weight, as well as loss of aerated lung tissue. The clinical hallmarks of ARDS are hypoxemia, bilateral opacities detected by chest radiograph or computed tomography (CT) scan, decreased lung compliance, and increased dead space. ARDS has different etiologies, among which the most common ones are sepsis, aspiration, pneumonia, trauma, major surgery, and multiple transfusions.1
A new definition of ARDS has been recently proposed based on the presence of the following criteria2:
1. Timing: Acute onset within 1 week of a known clinical insult or new or worsening respiratory symptoms
2. Chest imaging: Bilateral opacities detected by chest radiograph or CT scan
3. Origin of edema: Respiratory failure not explained by cardiac failure or fluid overload. Objective assessment by echocardiography or quantification of pulmonary capillary wedge pressure (PCWP) to exclude hydrostatic edema
4. Oxygenation: partial pressure of arterial oxygen (Pao2)/fraction of inspired oxygen (Fio2) ≤ 300
Past studies using chest CT scans have elucidated that, unlike acute cardiogenic pulmonary edema (ACPE), ARDS is characterized by inhomogeneous pulmonary injury, with some areas of the lungs severely affected, some mildly involved, and others completely healthy.3,4 However, CT cannot be used on a daily basis because of the high amount of ionizing radiation exposure, the high cost, and the difficulty in transporting patients to the CT scanner. Hence the diagnosis of ARDS may be challenging, especially during its acute phase, because it is not always feasible to perform a CT scan or invasive hemodynamic measurements (e.g., evaluation of PCWP using a pulmonary artery catheter) and because of the tenuous respiratory function and hemodynamic instability of patients. In addition, images from a simple portable chest radiograph are inaccurate in distinguishing an ARDS pattern from ACPE. Recently, lung ultrasound has emerged as a noninvasive, radiation-free, bedside technique with high sensibility in the detection of different lung and pleural disorders, as analyzed in preceding chapters.5
Lung ultrasound b-lines and extravascular lung water
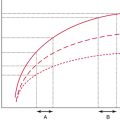
Healthy aerated lungs are featured by an anechoic echotexture. Diseased lungs are characterized by varying amounts of reduced aeration and edema that correspond to progressively dense and/or hyperechoic sonographic patterns (Figure 22-1). The latter is observed mainly due to the increased number and thickness of artifacts (B-lines or comet-tails). B-lines are generated because of subpleural interlobular septal thickening resulting from hydrostatic or “lesional” edema, pulmonary inflammatory edema, and/or fibrosis.6 Previous work demonstrated that the number of B-lines is proportional to the amount of extravascular lung water, thus being a sensitive sign of alveolar-interstitial syndrome.7–10 A simple visual score based on the sum of the number of B-lines (in each scanning intercostal space) correlates with chest radiograph visual scores,6,7 lung weight and density (quantitative CT),10 PCWP evaluated by the thermodilution method using the invasive pulse-induced contour cardiac output (PiCCO) system (Pulsion Medical Systems, Munich, Germany),8 and also with lung weight assessed by gravimetry in experimental animals.11
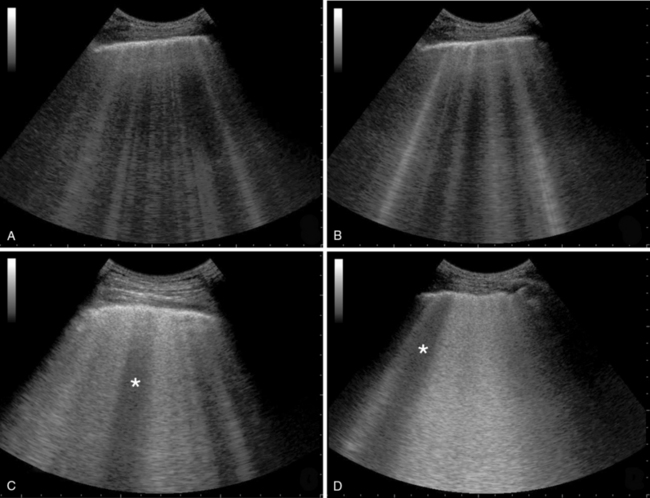
Figure 22-1 Various stages of increasing severity in alveolar-interstitial syndrome: interstitial syndrome (panel A), alveolar-interstitial syndrome (panel B), more severe alveolar interstitial syndrome with spared area (star) and thickening of pleural line (panel C) and alveolar-interstitial syndrome with ground-glass attenuation, irregular pleural line and spared area (star) (panel D).
Ultrasonographic signs of acute respiratory distress syndrome
The main signs that can be recognized by lung ultrasound in cases of suspected ARDS are
1. B-lines: Vertical artifact, also called “comet-tail artifact,” extending to the edge of the screen, moving within pleural line synchronously with inspiration and effacing A-lines. In ARDS, B-lines should be bilateral and, in number, greater than 3 or more, to confluence in a completely “white lung.” In the anterior lung fields, B-lines are not homogeneously distributed, whereas in the posterior lung fields, the B-lines are more compact and homogeneous, producing the image of a global white lung (see Figure 22-1).
2. Spared areas: Areas of normal lung that are observed in at least one intercostal space, surrounded by areas of B-lines or white lung (usually in the anterior lung fields) (Figure 22-2).
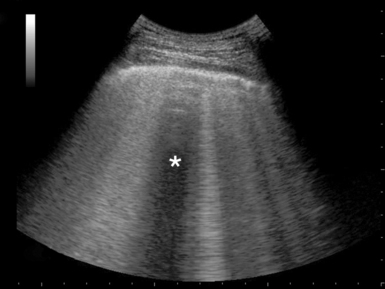
Figure 22-2 Visualization of spared area (star) and thickened pleural line in an acute respiratory distress syndrome (ARDS) case.
3. Consolidations: Areas of hyperechoic echotexture with punctiform elements or “hepatization,” with presence of static or dynamic air bronchograms.12 In ARDS, consolidations may be located in the posterior lung fields, especially at the bases (Figure 22-3).
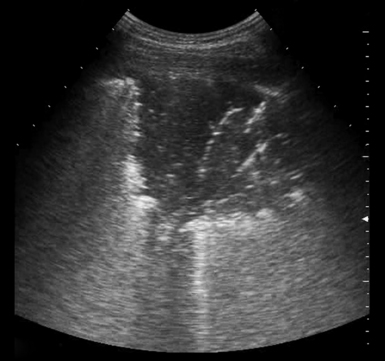
Figure 22-3 Visualization of a pulmonary consolidation and associated air bronchogram in a patient with acute respiratory distress syndrome (ARDS).
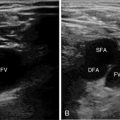
4. Pleural line abnormalities: Thickening is greater than 2 mm, and there is irregularity of the pleural line as well as evidence of small subpleural consolidations (Figure 22-4). In ARDS, the pleural line is always involved, and this leads to a reduction of lung sliding. In white lung areas, lung sliding might be absent and the pleural line may appear to move according to the heartbeat (lung pulse sign).
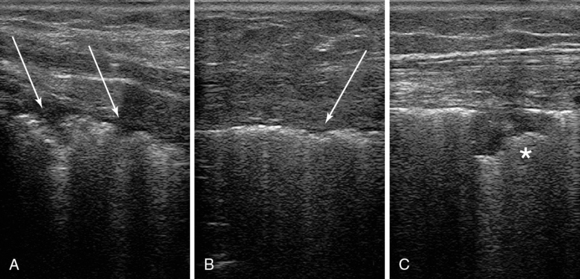
Figure 22-4 Ultrasound scans of the anterior (upper) lung region, by using a high-frequency transducer, depict a thickened irregular pleural line (panels A and B, arrows) and subpleural consolidation and in a patient with acute respiratory distress syndrome (ARDS) case (C).
5. Pleural effusion: Anechoic and homogeneous pleural areas with no evidence of gas inside, limited by the diaphragm and pleura. If pleural effusion is likely to create a mechanical compression, the lower lung lobe can be visualized as collapsed and floating. Pleural effusion is rarely observed in ARDS. However, this is equally dependent on the primary cause of ARDS (e.g., pancreatitis, lower respiratory tract infection).
Acute respiratory distress syndrome versus acute cardiogenic pulmonary edema: Differential diagnosis by lung ultrasound
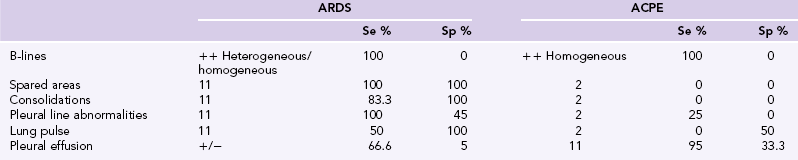
The role of lung ultrasound in the diagnosis of alveolar-interstitial syndrome has been well known since 1997.6 The nonspecific lung ultrasound pattern (B-lines and white lung), which is predominant in the alveolar-interstitial syndrome, is also observed in other abnormalities characterized by an increase of extravascular lung water with thickening of alveolar septa (e.g., ACPE). In 2008, Copetti et al13 analyzed lung ultrasound images of 58 consecutive patients affected by ARDS or ACPE and described different pleuropulmonary sonographic patterns to differentiate alveolar-interstitial syndromes. This report suggested that the classic pleuroparenchymal patterns described by CT are similar to the pleuroparenchymal patterns detected by ultrasound in both disorders. In ACPE, a pattern of homogeneous hydrostatic edema with interstitial thickness and subsequent extravasations of fluid in the alveoli, in the absence of impaired alveolar-capillary membrane, can be equally well identified by both CT and ultrasound. However, in ARDS, the integrity of the alveolar-capillary membrane is compromised, and this causes an early, diffuse, heterogeneous alveolar flooding. Hence a homogeneous white lung pattern, which is usually observed in both anterior and posterior lung fields along with evidence of pleural effusion, is predominant in ACPE (Table 22-1). In ARDS, the white lung pattern is rather heterogeneous in the anterior fields of the lung (spared areas), whereas it tends to appear more homogeneous with bilateral pleural line modifications and consolidated areas in the posterior lung fields; however, this is also dependent on the ARDS stage (see Table 22-1).
The integration of lung ultrasound in acute respiratory distress syndrome management
Lung morphology: Diffuse or focal loss of aeration?
Lung ultrasound can be very useful to assess lung morphology. Indeed, ARDS can be classified as focal or diffuse based on the distribution of aeration loss as detected by ultrasound.14 A focal ARDS pattern is ultrasonographically evident by the presence of normally aerated anteriolateral lung fields (A-line profile and normal lung sliding) and by loss of aeration in the posterolateral lung fields (multiple B-lines and areas of consolidation). A diffuse ARDS pattern is ultrasonographically identified by a global loss of aeration (multiple B-lines and areas of consolidation) in all pertinent lung fields (upper, lower, anterior/posterior, and lateral). The identification of a focal loss of aeration points toward a more careful application of mechanical ventilation because high PEEP might generate a hyperinflation of healthy lung regions, thus increasing the risk of lung stress and strain. In contrast, a diffuse loss of aeration usually permits the application of higher levels of PEEP to optimize global lung recruitment.15,16 Of note, 70% of ARDS cases present with a focal lung morphology pattern, and 25% of cases with a diffuse pattern. Hence it is essential to identify the two different aeration patterns and adjust accordingly the applied mechanical ventilation strategies.17
Lung re-aeration score
Recently, Bouhemad et al18 have validated an ultrasound score to assess lung aeration. The score classifies four main lung aeration conditions: (1) a normal aerated lung with A-lines and lung sliding, (2) the interstitial syndrome with B-lines at intervals of 7 mm, (3) the alveolar-interstitial syndrome with B-lines at intervals of 3 mm or less, and finally (4) the alveolar consolidation. The score analyses 12 lung areas. The summation of the results obtained from each area provides an idea of the global lung aeration and correlates well with lung aeration patterns determined by quantitative CT. An ultrasound score less than 5 was associated with re-aeration and therapy success, whereas an ultrasound score less than 10 was associated with exacerbation of aeration loss and therapy failure. The ultrasound re-aeration score seems to be a reliable method to monitor ARDS patients daily.19 This ultrasound monitoring also facilitates the prompt detection of the results (e.g., improvement of lung aerations) of ongoing therapy (e.g., protective ventilation, antimicrobial therapy, drainage of pleural effusion). The ultrasound lung re-aeration score is further analyzed in Chapter 23.
Technical issues
Lung ultrasound should examine the entire lung fields, bilaterally, when evaluating patients with alveolar-interstitial syndrome. However, intensive care unit (ICU) patients are usually in a supine position, and thus posterior lung fields (sometimes even lateral fields) may not be easily accessible compared with the anterior ones. It is useful to adopt a systematic scanning protocol by dividing the lung into six regions (upper and lower—anterior, lateral, and posterior regions), which are further outlined by the anterior and posterior axillary lines (see Chapter 1). Lung ultrasound parenchymal scanning (see Figure 22-1) is usually performed by means of low-frequency convex transducers (which permit analysis of deeper structures), whereas high-frequency transducers can better visualize and thus analyze more superficial structures, such as abnormalities of the pleural line (see Figure 22-4). Finally, microconvex transducers are extremely useful because of their small footprints, when scanning between intercostal spaces (see Chapter 1).
Pearls and highlights
• Lung ultrasound lung is an invaluable tool in the diagnosis and management of mechanically ventilated ARDS patients.
• Usual ultrasonographic findings in patients with ARDS may include B-lines, spared areas of normal lung parenchyma, consolidated areas, pleural line abnormalities, and pleural effusions.
• In ACPE, a homogeneous white lung pattern is usually observed in both anterior and posterior lung fields along with pleural effusion.
• In ARDS, the white lung pattern is usually heterogeneous in the anterior lung fields and more homogeneous in the posterior ones, but pleural effusion is uncommon. However, with ARDS, ultrasonographic patterns depend much on the primary etiology and stage.
• ARDS can be classified as focal or diffuse based on the distribution of aeration loss as detected by ultrasound. This is an important discrimination because it may facilitate the optimization of mechanical ventilation strategies.
References
1. Ware, LB, Matthay, MA, The acute respiratory distress syndrome. N Engl J Med 2000;342(18):1334–1349.
2. Ranieri, VM, Rubenfeld, GD, Thompson, BT, et al, Acute respiratory distress syndrome: the Berlin Definition. JAMA. 2012;307(23):2526–2533.
3. Gattinoni, L, Caironi, P, Pelosi, P, Goodman, LR, What has computed tomography taught us about the acute respiratory distress syndrome. Am J Respir Crit Care Med 2001;164(9):1701–1711.
4. Pesenti, A, Tagliabue, P, Patroniti, N, Fumagalli, R, Computerised tomography scan imaging in acute respiratory distress syndrome. Intensive Care Med 2001;27(4):631–639.
5. Xirouchaki, N, Magkanas, E, Vaporidi, K, et al, Lung ultrasound in critically ill patients: comparison with bedside chest radiography. Intensive Care Med. 2011;37(9):1488–1493.
6. Lichtenstein, D, Mezière, G, Biderman, P, et al, The comet-tail artifact. An ultrasound sign of alveolar-interstitial syndrome. Am J Respir Crit Care Med 1997;156(5):1640–1646.
7. Jambrik, Z, Monti, S, Coppola, V, et al, Usefulness of ultrasound lung comets as a nonradiologic sign of extravascular lung water. Am J Cardiol 2004;93(10):1265–1270.
8. Agricola, E, Bove, T, Oppizzi, M, et al, “Ultrasound comet-tail images”: a marker of pulmonary edemaa comparative study with wedge pressure and extravascular lung water. Chest. 2005;127(5):1690–1695.
9. Picano, E, Frassi, F, Agricola, E, et al, Ultrasound lung comets: a clinically useful sign of extravascular lung water. J Am Soc Echocardiogr. 2006;19(3):356–363.
10. Baldi, G, Gargani, L, Abramo, A, et al, Lung water assessment by lung ultrasonography in intensive care: a pilot study. Intensive Care Med. 2012;39(1):74–84.
11. Jambrik, Z, Gargani, L, Adamicza, A, et al, B-lines quantify the lung water content: a lung ultrasound versus lung gravimetry study in acute lung injury. Ultrasound Med Biol. 2010;36(12):2004–2010.
12. Weinberg, B, Diakoumakis, EE, Kass, EG, et al, The air bronchogram: sonographic demonstration. AJR Am J Roentgenol. 1986;147(3):593–595.
13. Copetti, R, Soldati, G, Copetti, P, Chest sonography: a useful tool to differentiate acute cardiogenic pulmonary edema from acute respiratory distress syndrome. Cardiovasc Ultrasound. 2008;6:16.
14. Puybasset, L, Cluzel, P, Gusman, P, et al, Regional distribution of gas and tissue in acute respiratory distress syndrome. I. Consequences for lung morphology. CT Scan ARDS Study Group. Intensive Care Med 2000;26(7):857–869.
15. Stefanidis, K, Dimopoulos, S, Tripodaki, ES, et al, Lung sonography and recruitment in patients with early acute respiratory distress syndrome: a pilot study. Crit Care. 2011;15(4):R185.
16. Luecke, T, Corradi, F, Pelosi, P, Lung imaging for titration of mechanical ventilation. Curr Opin Anaesthesiol 2012;25(2):131–140.
17. Puybasset, L, Gusman, P, Muller, JC, et al, Regional distribution of gas and tissue in acute respiratory distress syndrome. III. Consequences for the effects of positive end-expiratory pressure. CT Scan ARDS Study Group. Adult Respiratory Distress Syndrome. Intensive Care Med 2000;26(9):1215–1227.
18. Bouhemad, B, Liu, ZH, Arbelot, C, et al, Ultrasound assessment of antibiotic-induced pulmonary reaeration in ventilator-associated pneumonia. Crit Care Med 2010;38(1):84–92.
19. Bouhemad, B, Brisson, H, Le-Guen M, et al, Bedside ultrasound assessment of positive end-expiratory pressure-induced lung recruitment. Am J Respir Crit Care Med 2011;183(3):341–347.