Evaluation of fluid responsiveness by ultrasound
Overview
Fluid therapy is the cornerstone of hemodynamic resuscitation, and its aim is to increase tissue perfusion. Notably, a positive fluid balance is associated with a poor outcome. Thus it is important to optimize fluid administration and identify patients who may most benefit from it while trying to predict fluid responsiveness. Fluids increase tissue perfusion by means of an increase in cardiac output (CO), which is related to an increase in cardiac preload. However, the relationship between preload and CO or, more precisely, between left ventricular (LV) preload and stroke volume is curvilinear (Figure 38-1). In patients with altered contractility the curve is even flattened. Fluids should be administered only to those on the steep part of the curve.
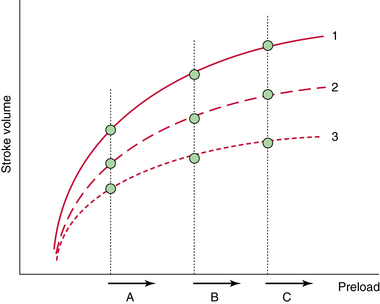
Figure 38-1 Prediction of fluid responsiveness with static indices. Fluid responsiveness depends on the patient’s intrinsic contractility (1 = normal, 2 = moderately altered, 3 = severely altered) and position on the Frank-Starling curve (A, B, and C). A given value of preload (e.g., B) may be associated with a positive response to fluids (B1) or no response to fluids (B3). Only extreme values of preload such as A (very low) and C (very high) are predictive of fluid responsiveness. Of note, even patients with severely impaired cardiac function may respond to fluids (A3).
Another important aspect is fluid tolerance. When preload increases, hydrostatic pressure also increases. The magnitude of the increase in hydrostatic pressure for a given increase in preload depends on patient’s position on the Frank-Starling curve and on ventricular compliance (Chapter 36). In patients with altered diastolic function, the increase in hydrostatic pressure is more pronounced (Figure 38-2). Tolerance to fluids also depends on right ventricular (RV) function. In patients with RV dysfunction, fluid administration may induce RV dilatation. This chapter illustrates mainly the role of ultrasound in evaluating fluid responsiveness in the intensive care unit (ICU).
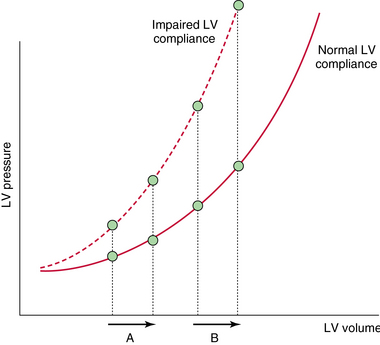
Figure 38-2 Relationship between left ventricular (LV) volume and pressure. In patients with impaired LV compliance, an increase in preload is associated with an increase in pressure, even when cardiac output (CO) also increases (A). The increase in hydrostatic pressure is more pronounced when patients are on the flat part of the Frank-Starling curve (B).
Prediction of fluid responsiveness
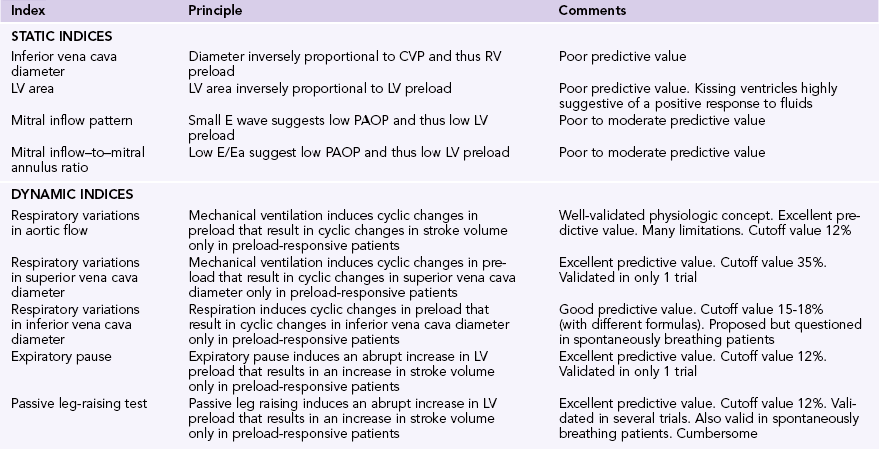
The literature reports that only half of patients respond to the administration of fluids. Several static and dynamic indices can be used to predict fluid responsiveness (Table 38-1). The technical details of these indices are discussed elsewhere in this book.
Static indices
Ventricular pressure and volume can be measured with echocardiography to assess preload. Because a multitude of Frank-Starling curves exist (depending on the patient’s heart function), it is difficult to predict fluid responsiveness from a single estimate of preload. When preload is very low, only then is the likelihood of a patient being on the steep part of the Frank-Starling curve high. Conversely, when preload is very high, a patient’s chance to be fluid responsive is low. However, patients are usually in a more indefinite situation (see Figure 38-1).
The diameter of the inferior vena cava (IVC) reflects central venous pressure (CVP) and can be used to predict fluid responsiveness. When IVC diameter is markedly increased (>20 mm), the likelihood of a patient to be fluid responsive is low, whereas when the diameter is decreased (<10 mm), the likelihood appears to be higher. IVC diameter reflects RV preload, and even though it is measured from outside the thorax, it can be influenced by high intrathoracic and intraabdominal pressure. Hence return of blood to the heart may be impeded and fluid administration may not result in an increase in CO. A small IVC diameter usually indicates that RV preload is not elevated and venous return is not impeded; however, it cannot elucidate whether the left ventricle also works on the steep part of the Frank-Starling curve. The possibility of IVC collapse as a result of increased intraabdominal pressure or dilatation of the IVC when high positive end-expiratory pressure (PEEP) is used may further complicate the interpretation of changes in IVC diameter. Altogether, these factors explain why this method poorly predicts fluid responsiveness.
Color Doppler– and tissue Doppler imaging–derived mitral inflow patterns can be used to estimate pulmonary artery occlusion pressure (PAOP) and fluid responsiveness as mentioned elsewhere in this book.1 A low mitral E wave or a low mitral inflow E wave–to–mitral annulus ratio (E/Ea) suggests low PAOP and may reflect a greater chance to respond to fluid therapy. Nevertheless, its predictive value for fluid responsiveness varies in different published series, and no definite cutoff values of these echocardiographic parameters can be used to distinguish fluid responders from nonresponders. LV and RV size may be used to estimate preload. Ventricular size can be assessed visually or with echocardiography (calculation of ventricular diameters, surfaces, or volumes). Only extreme values of ventricular size appear to have some value in predicting fluid responsiveness. In this context, a small LV cavity is associated with a positive response to fluids, provided that the right ventricle is not dilated.
Dynamic indices
Heart-lung interaction–based indices
Mechanical ventilation induces cyclic changes in intrathoracic pressure that result in cyclic changes in LV preload and stroke volume in preload-responsive patients (Figure 38-3). During inspiration, increments in intrathoracic pressure induce a decrease in the diameter and flow of the intrathoracic segment of the IVC, whereas its extrathoracic segment appears to be distended. RV afterload also increases. These changes lead to a decrease in RV and an increase in LV preload, respectively. Because of lung transmission time, the decreased RV stroke volume results in reduced LV preload after three to four beats, usually at midexpiration. During expiration, reverse changes in LV and RV preload occur. These hemodynamic changes can be assessed with echocardiography by noting specific alterations in aortic flow and IVC diameter, which occur only in preload-responsive patients.
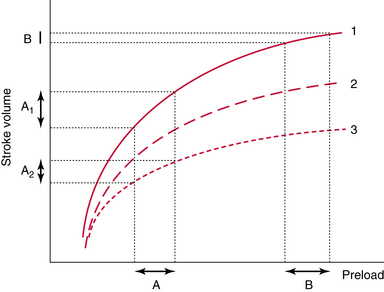
Figure 38-3 Prediction of fluid responsiveness with dynamic indices. In these tests, preload either spontaneously varies or is transiently manipulated (see text for details). These transient changes in preload are associated with transient changes in stroke volume in fluid responders (A); however, this is not the case in nonresponders (B).
Respiratory variations in aortic flow
Variations in stroke volume with respiration can be assessed with color Doppler echocardiography. The latter depicts pertinent respiratory variations in peak aortic velocity or the velocity-time integral (VTI) of aortic flow.2,3 The former measurements are simpler than the latter, but their value in predicting fluid responsiveness is comparable.3 These Doppler-derived indices were suggested to be reliable predictors of fluid responsiveness in a recent meta-analysis; however, their use carries several limitations.4 When performing Doppler measurements of aortic flow, the heart rate should be regular and higher than the respiratory rate (heart-respiratory rate ratio >3.5). When patients are ventilated with tidal volumes of 8 mL/kg or lower, the predictive value of the Doppler indices is low.5 Also, because no spontaneous respiratory movements should occur during the Doppler measurements, patients are usually deeply sedated; intraabdominal pressure should be within normal limits for reasons already explained in previous paragraphs.6
Vena cava analysis
Superior vena cava.
The physiologic role of the right ventricle is to lower CVP and thus enable LV preload. During inspiration, the increased intrathoracic pressure induces a decrease in vena cava flow, but the right ventricle continues to eject blood at its maximal stroke volume. When the patient is preload dependent, vena cava flow transiently becomes lower than RV output, and the decreased CVP reflects the observed collapse of the superior vena cava (SVC). When the right ventricle is not preload responsive, intraluminal SVC pressure usually prevents its collapse. When a patient is afterload dependent (e.g., cor pulmonale), small fluctuations in SVC diameter may occur as a result of the decreased distensibility observed in an already enlarged SVC. Vieillard-Baron et al studied 66 patients with septic shock and reported that variation in the SVC collapsibility index (calculated as [maximum − minimum]/maximum SVC diameter) of at least 36% identifies fluid responders with a sensitivity of 90% and a specificity of 100%.7 Ideally, SVC diameter is measured with transesophageal echocardiography at the level of the pulmonary artery (upper esophageal 90-degree view following identification of the SVC at 0 degrees). This location provides maximal sensitivity for determining intrathoracic pressure and minimizes artifacts. SVC analysis has several limitations and is not reliable when RV and LV preload dependency is dissociated (e.g., severe LV dysfunction). The method is of limited value in patients who are ventilated with low tidal volumes or undergo open chest surgery.
Inferior vena cava.
Usually, only the extrathoracic segment of the IVC can be analyzed sonographically as described elsewhere in this book. IVC flow is maximal during expiration. During inspiration, flow stagnation occurs as a result of the increased intrathoracic pressure, and the IVC dilates. The latter occurs mostly in RV preload–dependent patients and in those with cor pulmonale (which can easily be identified with echocardiography). SVC and IVC analysis share the same limitations, whereas raised intraabdominal pressure influences the latter (by dampening the variations in IVC diameter with respiration) as described in previous paragraphs.8 Two different formulas have been suggested for performing IVC analysis as described in other chapters in this section. These formulas produce results with slightly different cutoff values (15% for [maximum − minimum]/mean IVC diameter and 18% for [maximum − minimum]/minimum IVC diameter) but with similar values in predicting fluid responsiveness.9,10
IVC analysis can be also used during spontaneous breathing. During inspiration, right atrial pressure decreases and thereby leads to increased IVC flow. In patients with RV preload dependency this results in a marked decrease in IVC pressure and diameter. In spontaneously breathing patients, IVC diameter is minimal during inspiration (the opposite is true in those undergoing mechanical ventilation). Following IVC analysis, a cutoff value of 30% was proposed to distinguish fluid responders from nonresponders during spontaneous breathing, although this remains debatable.1
Other dynamic tests
Expiratory pause.
Mechanical ventilation generates a mean respiratory pressure that determines venous return and CO during one respiratory cycle. An expiratory pause abruptly decreases mean intrathoracic pressure to the level of PEEP and in turn induces an abrupt increase in LV preload. The latter results in increased stroke volume in preload-responsive patients. This dynamic test has been validated by aortic pulse contour analysis (although further echocardiographic validation is required) and can be used in patients who are mechanically ventilated with low tidal volumes or have arrhythmias.11
Passive leg raising.
Passive leg raising (PLR) has previously been analyzed in this book. In brief, it consists of an abrupt change in body position (raising the legs together with a change in torso position from 30 to 45 degrees to 0 degrees), which results in acute blood mobilization (300 mL) from large capacitance veins (lower limbs and splanchnic regions).12 Mobilization of blood may be limited in patients with severe vasoconstriction or in those with lower limb compression stockings. In preload-responsive patients, PLR induces an abrupt increase in LV preload that results in increased stroke volume. This effect is relatively transient (1 to 2 minutes) since compensatory mechanisms occur after a few minutes. The PLR test can be performed in both spontaneously breathing and mechanically ventilated patients.13 In this test, Doppler-derived changes in the aortic VTI are usually measured (cutoff values >12% are suggested to identify fluid responders).
Final thoughts
In the ICU, evaluation of fluid responsiveness has many limitations irrespective of the method used, and the concept itself has many “gray zones.” However, assessing the effectiveness of fluid therapy in ICU patients is an essential parameter of hemodynamic and respiratory monitoring. In our practice, the aortic flow VTI is measured before and after administration of fluid boluses. A 10% increase in VTI values usually indicates fluid responsiveness. When the aortic VTI fails to increase, one important question is whether this is resulting from insufficient “fluid loading” or whether the patient is effectively failing to respond despite a significant increase in preload. A simple way to evaluate preload is to measure changes in echocardiographic indices such as the Doppler-derived mitral E/A ratio or the tissue Doppler–derived mitral E/Ea ratio (any significant change in PAOP usually corresponds to an increased mitral E wave). Another important clinical issue is whether fluids are well tolerated. Indeed, fluid therapy can unmask RV failure or precipitate pulmonary edema. Echocardiography can be used to evaluate RV dysfunction as analyzed elsewhere. Notably, in such cases the Doppler-derived aortic VTI often fails to increase and sometimes even decreases after a fluid challenge. Evaluation of impending pulmonary edema can be facilitated by monitoring changes in PAOP. This is usually performed by measuring the aforementioned Doppler and tissue Doppler echocardiographic indices, whereas the recent integration of lung ultrasound into the diagnostic arsenal has facilitated prompt identification of pulmonary edema in the ICU. Notably, the E/Ea ratio markedly increases in nonresponders after a fluid challenge, and this increase is more pronounced in patients with LV diastolic dysfunction.14 No cutoff values have clearly been established, however, when the E/Ea ratio rises above 10; in general, further administration of fluids should be performed with caution.
Pearls and highlights
• Echocardiography is an essential tool in predicting fluid responsiveness in the ICU.
• Dynamic indices of cardiac preload (e.g., variations in aortic flow or vena cava analysis with respiration) and dynamic tests (e.g., expiratory pause in mechanical ventilation or PLR) are preferred over static indices for prediction of fluid responsiveness.
• All static and dynamic indices of cardiac preload have limitations, and the concept of fluid responsiveness has many “gray zones.”
• No cutoff values that predict fluid responsiveness or tolerance have clearly been established for the tissue Doppler–derived mitral flow E/Ea ratio in mechanically ventilated patients. In general, when the latter rises above 10, administration of fluids should be performed with caution.
References
1. Muller, L, Bobbia, X, Toumi, M, et al, Respiratory variations of inferior vena cava diameter to predict fluid responsiveness in spontaneously breathing patients with acute circulatory failure: need for a cautious use. Crit Car. 2012; 16:R188.
2. Feissel, M, Michard, F, Mangin, I, et al. Respiratory changes in aortic blood velocity as an indicator of fluid responsiveness in ventilated patients with septic shock. Chest. 2001; 119:867–873.
3. Charron, C, Fessenmeyer, C, Cosson, C, et al. The influence of tidal volume on the dynamic variables of fluid responsiveness in critically ill patients. Anesth Analg. 2006; 102:1511–1517.
4. Marik, PE, Cavallazzi, R, Vasu, T, et al, Dynamic changes in arterial waveform derived variables and fluid responsiveness in mechanically ventilated patients: a systematic review of the literature. Crit Care Me. 2009; 37:2642–2647.
5. De Backer, D, Heenen, S, Piagnerelli, M, et al, Pulse pressure variations to predict fluid responsiveness: influence of tidal volume. Intensive Care Me. 2005; 31:517–523.
6. Heenen, S, De Backer, D, Vincent, JL. How can the response to volume expansion in patients with spontaneous respiratory movements be predicted. Crit Care. 2006; 10:R102.
7. Vieillard-Baron, A, Chergui, K, Rabiller, A, et al. Superior vena caval collapsibility as a gauge of volume status in ventilated septic patients. Intensive Care Med. 2004; 30:1734–1739.
8. Bendjelid, K, Viale, JP, Duperret, S, et al. Impact of intra-abdominal pressure on retrohepatic vena cava shape and flow in mechanically ventilated pigs. Physiol Meas. 2012; 33:615–627.
9. Feissel, M, Michard, F, Faller, JP, et al. The respiratory variation in inferior vena cava diameter as a guide to fluid therapy. Intensive Care Med. 2004; 30:1834–1837.
10. Barbier, C, Loubieres, Y, Schmit, C, et al. Respiratory changes in inferior vena cava diameter are helpful in predicting fluid responsiveness in ventilated septic patients. Intensive Care Med. 2004; 30:1740–1746.
11. Monnet, X, Osman, D, Ridel, C, et al. Predicting volume responsiveness by using the end-expiratory occlusion in mechanically ventilated intensive care unit patients. Crit Care Med. 2009; 37:951–956.
12. Monnet, X, Teboul, JL. Passive leg raising. Intensive Care Med. 2008; 34:659–663.
13. Lamia, B, Ochagavia, A, Monnet, X, et al. Echocardiographic prediction of volume responsiveness in critically ill patients with spontaneously breathing activity. Intensive Care Med. 2007; 33:1125–1132.
14. Mahjoub, Y, Benoit-Fallet, H, Airapetian, N, et al. Improvement of left ventricular relaxation as assessed by tissue Doppler imaging in fluid-responsive critically ill septic patients. Intensive Care Med. 2012; 38:1461–1470.