Kidney Clinical Assessment and Diagnostic Procedures
History
The history begins with a description of the chief complaint, stated in the patient’s own words. A description of the chief complaint includes the onset, location, duration, and factors or strategies that lessen or aggravate the problem.1 The individual should be encouraged to describe the effects of any treatment for the problem, prescription and nonprescription medications taken to alleviate symptoms, efforts taken to determine the cause of the problem, and procedures performed to improve the problem. A careful history that explores symptoms fully is an essential component of the clinical assessment.
Predisposing factors for acute kidney dysfunction are obtained during the history, including the use of over-the-counter medicines, recent infections requiring antibiotic therapy, antihypertensive medicines, and any diagnostic procedures performed using radiopaque contrast.2 Nonsteroidal anti-inflammatory medications (e.g., ibuprofen), antibiotics (especially aminoglycosides), antihypertensives (especially medicines that block angiotensin),3 and iodine-based dyes may cause an acute or chronic decline in kidney function. A history of recent onset of nausea and vomiting or appetite loss caused by taste changes (uremia often causes a metallic taste) may provide clues to the rapid onset of kidney problems.2 Symptoms that indicate rapid fluid volume gains are explored. For example, weight gains of more than 2 pounds per day, sleeping on additional pillows, and sitting in a chair to sleep are signals of volume overload and potential cardiac stress related to kidney dysfunction.
The family history may provide important information that points to the kidneys as the source of the patient’s symptoms. For example, the patient may reveal that one or two close family members have always had swelling of the extremities or high blood pressure. These symptoms should lead to questions about a history of kidney problems in the family. Box 26-1 summarizes the information gained from a kidney history.
Physical Examination
Inspection
Bleeding
Visual inspection related to the kidneys focuses on the patient’s flank and abdomen. Kidney trauma is suspected if a purplish discoloration is present on the flank (Grey-Turner sign) or near the posterior 11th or 12th ribs.1 Bruising, abdominal distention, and abdominal guarding may also signal kidney trauma or a hematoma around a kidney. Individuals who have experienced a traumatic injury should be carefully assessed for signs of kidney trauma.
Volume
Inspection is especially helpful in looking for signs of volume depletion or overload that may signal or lead to kidney problems. Fluid volume assessment begins with an inspection of the patient’s jugular neck veins. The supine position facilitates normal jugular venous distention. An absence of distention (flat neck veins) indicates hypovolemia. Assessment continues with the head of the bed elevated 45 to 90 degrees.1 Fluid overload exists when the neck veins remain distended more than 2 cm above the sternal notch when the bed is at 45 degrees.4
Assessment of skin turgor provides additional data for identifying fluid-related problems. To assess turgor, the skin over the forearm is picked up and released.5 Normal elasticity and fluid status allow an almost immediate return to shape after the skin is released. In fluid volume deficit, however, the skin remains raised and does not return to its normal position for several seconds.5 Because of the loss of skin elasticity in older persons, skin turgor assessment may not be as accurate a fluid assessment measure for this age group.
Inspection of the oral cavity provides clues to fluid volume status. When a fluid volume deficit exists, the mucous membranes of the mouth become dry. However, mouth breathing and some medicines (e.g., antihistamines) can also dry the mucous membranes temporarily. The most accurate way to assess the oral cavity is to inspect the mouth using a tongue blade and light. Dryness of the oral cavity is more indicative of fluid volume deficit than are complaints of a dry mouth.4
Edema
Edema can be assessed by applying fingertip pressure on the swollen area over a bony prominence, such as the ankles, pretibial areas (shins), and sacrum. If the indentation made by the fingertip does not disappear within 15 seconds, pitting edema exists. Pitting edema indicates increased interstitial volume, and it usually is not evident until significant weight gain has occurred. Edema also may appear in the hands and feet, around the eyes, and in the cheeks. Dependent areas, such as the feet and sacrum, are the areas most likely to demonstrate edema in patients confined to a wheelchair or bed. One way of measuring the extent of edema is by using a subjective scale of 1 to 4, with 1 indicating only minimal pitting and 4 indicating severe pitting (Table 26-1).1 Other scales for assessing and measuring edema can be used (see Table 13-3).
TABLE 26-1
| RATING | APPROXIMATE EQUIVALENT |
| +1 | 2-mm depth |
| +2 | 4-mm depth (lasting up to 15 sec) |
| +3 | 6-mm depth (lasting up to 60 sec) |
| +4 | 8-mm depth (lasting longer than 60 sec) |
Auscultation
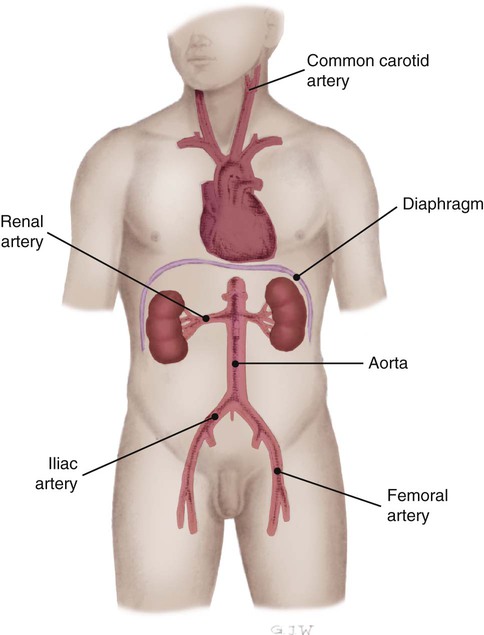
Auscultation of the kidneys yields virtually no useful information. However, the renal arteries are auscultated for a bruit, a blowing or swishing sound that resembles a cardiac murmur (Fig. 26-1). The examiner listens for bruits above and to the left and right of the umbilicus.1 A renal artery bruit usually indicates stenosis, which may lead to acute or chronic kidney dysfunction due to compromised blood flow to one or both kidneys. A bruit over the upper portion of the abdominal aorta may indicate an aneurysm or a stenotic area that can decrease blood flow to the kidneys.
Heart
Auscultation of the heart requires assessing the rate and rhythm and listening for extra sounds. Fluid overload is often accompanied by a third or fourth heart sound, which is best heard with the bell of the stethoscope.1 Increased heart rate alone provides little information about fluid volume, but combined with a low blood pressure, it may indicate hypovolemia.
The heart is auscultated for the presence of a pericardial friction rub. A rub can best be heard at the third intercostal space to the left of the sternal border while the individual leans slightly forward.1 A pericardial friction rub indicates pericarditis, and it may result from uremia in a patient with kidney failure.
Blood Pressure
Blood pressure and heart rate changes are very useful in assessing fluid volume deficit.3 In stable critically ill patients or in patients on a telemetry unit, orthostatic vital sign measurements provide clues to blood loss, dehydration, unexplained syncope, and the effects of some antihypertensive medications. A drop in systolic blood pressure of 20 mm Hg or more, a drop in diastolic blood pressure of 10 mm Hg or more, or a rise in pulse rate of more than 15 beats/min from lying to sitting or from sitting to standing indicates orthostatic hypotension. Box 26-2 describes how to assess for orthostatic hypotension. The drop in blood pressure occurs because a sufficient preload is not immediately available when the patient changes position. The heart rate increases in an attempt to maintain cardiac output and circulation. Orthostatic hypotension produces subjective feelings of weakness, dizziness, or faintness. Orthostatic hypotension occurs with hypovolemia, prolonged bed rest, or as a side effect of medications that affect blood volume or blood pressure.
Palpation
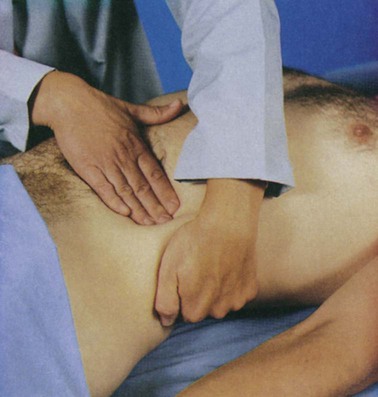
Although rarely performed in critically ill patients, palpation of the kidneys in stable patients provides information about the kidneys’ size and shape. Palpation of the kidneys is achieved through the bimanual capturing approach. Capturing is accomplished by placing one hand posteriorly under the flank of the supine patient with the examiner’s fingers pointing to the midline and placing the opposite hand just below the rib cage anteriorly.1,2 The patient is asked to inhale deeply while pressure is exerted to bring the hands together (Fig. 26-2). As the patient exhales, the examiner may feel the kidney between the hands. After each kidney is palpated in this manner, the two should be compared for size and shape. Each kidney should be firm and smooth, and the two organs should be of equal size. The examiner is usually unable to palpate a normal left kidney. The right kidney is more easily palpated because of its lower position, caused by downward displacement by the liver. Problems should be suspected if a mass (cancer) or an irregular surface (polycystic kidneys) is palpated, a size difference is detected, the kidney extends significantly lower than the rib cage on either side, or there is evidence of recent blunt trauma.1
Percussion
Kidneys
Percussion of a kidney is performed with the patient in a side-lying or sitting position, with the examiner’s hand placed over the costovertebral angle (lower border of the rib cage on the flank).1 Striking the back of the hand with the opposite fist produces a dull thud, which is normal. Pain may indicate infection (e.g., urinary tract infection that has extended into the kidneys) or injury resulting from trauma. Traumatic injury to the kidneys should be assessed in the presence of a penetrating abdominal wound, with blunt abdominal trauma, or with a fractured pelvis or ribs.
Abdomen
Observation and percussion of the abdomen may help in assessing fluid status. Percussing the abdomen with the patient in the supine position generally yields a dull sound (solid bowel contents or fluid) or a hollow sound (gaseous bowel).1
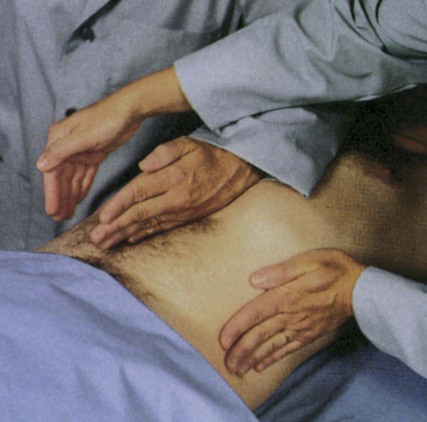
Ascites, or excess fluid accumulation and distention of the abdominal cavity, is an important observation in determining fluid overload. Differentiating ascites from distortion caused by solid bowel contents is accomplished by producing a fluid wave. A fluid wave is elicited by exerting pressure to the abdominal midline while one hand is placed on the right or left flank.1 Tapping the opposite flank produces a wave in the accumulated fluid that can be felt under the hands (Fig. 26-3). Other signs of ascites include a protuberant, rounded abdomen and abdominal striae.1
Additional Assessments
Weight Monitoring
Whenever possible, the patient is weighed during admission to the critical care unit. It is important to document whether the current weight differs significantly from the weight 1 to 2 weeks before admission to the hospital. The patient is weighed daily for comparison with the previous day’s weight. The weight is obtained at the same time each day, with the patient wearing the same amount of clothing and using the same scales. The individual’s weight is of critical importance to the dialysis nurse caring for a patient with acute or chronic kidney failure. The differences in weight from day to day are used to calculate the amount of fluid to remove during a dialysis treatment.6
Intake and Output Monitoring
Individuals with acute kidney injury (AKI) often exhibit a decrease in urine output, or oliguria (less than 0.5 mL/kg/hr in adults; less than 1 mL/kg/hr in infants and young children). However, there may be a fairly normal or only slightly decreased urine output that reflects water removal without solute removal in the early phases of AKI. Although urine output is a sensitive indicator, kidney function cannot be accurately determined by urine output alone. For additional information on AKI see Chapter 27.
Hemodynamic Monitoring
Body fluid status is accurately reflected in measurements of cardiovascular hemodynamics. Measurements such as central venous pressure (CVP), pulmonary artery occlusion pressure (PAOP), cardiac index (CI), and mean arterial pressure (MAP) provide a clear picture of the increases or decreases in vascular volume returning to and being ejected from the heart.7 Volume depletion and volume overload are easily detected by use of central venous or arterial catheters, from which pressure measurements can be obtained (Table 26-2).
TABLE 26-2
HEMODYNAMIC ASSESSMENT OF FLUID STATUS
| MEASUREMENT | VOLUME DEPLETION | VOLUME OVERLOAD |
| Central venous pressure (CVP) | <2 mm Hg | >5 mm Hg |
| Pulmonary artery occlusion pressure (PAOP) | <5 mm Hg | >12 mm Hg |
| Cardiac index (CI) | <2.2 L/min/m2 | >4 L/min/m2 |
| Mean arterial pressure (MAP) | Decreased | Increased |
A central venous catheter often is inserted to evaluate fluid volume status and to measure the CVP. The CVP represents the filling pressure of the right atrium and is a measurement of right ventricular preload. The CVP changes with fluctuations in volume status. A normal CVP is 2 to 5 mm Hg. In volume depletion, the CVP is less than 2 mm Hg, whereas volume overload is reflected by readings of more than 5 mm Hg (see “Bedside Hemodynamic Monitoring” in Chapter 14 for more information on CVP interpretation).
If the patient has coexisting cardiopulmonary disease or if more information about hemodynamic function is required, a pulmonary artery catheter may be inserted. This catheter provides information about left ventricular filling pressures and cardiac output. The PAOP represents the left atrial pressure required to fill the left ventricle. When the left ventricle is full at the end of diastole, it represents the volume of blood available for ejection. It is also known as left ventricular preload and is measured by the PAOP. The normal PAOP is 5 to 12 mm Hg. In fluid volume excess, the PAOP increases. In fluid volume deficit, the PAOP is low.7
The CI demonstrates the cardiac output, or amount of blood ejected by the left ventricle over 1 minute, standardized for body size. The normal CI is 2.2 to 4 L/min/m2. Compensatory mechanisms in early hypovolemic shock maintain the CI at or near normal. With prolonged fluid loss, the CI decreases. Fluid volume overload increases heart rate, which increases cardiac output, but only to a point. Left ventricular failure may result from massive volume overload, such as with acute heart failure resulting from kidney failure, in which case the CI decreases. The most common cause of AKI in which hemodynamic monitoring is indicated is severe sepsis.7
Other Observations
Kidney system dysfunction often leads to fluid and electrolyte imbalances and the retention of metabolic waste products. Some of the disturbances in fluid, electrolyte, and waste product levels are accompanied by clinical manifestations less observable or measurable than those previously mentioned but that indicate a change from normal function. Box 26-3 summarizes important aspects to consider during kidney and fluid and electrolyte assessment.
Sudden or slowly developing changes in cognitive function and mental status must be investigated. For example, acidosis often results in disorientation. Lethargy, decreased attention or memory, coma, and confusion may result from sodium, calcium, or magnesium excess or deficit or retained waste products. Apprehension or anxiety may result from sodium deficit, a shift of fluid from the plasma to the interstitium, or respiratory changes caused by fluid volume overload. In older adults, new-onset confusion or a fall incurred by a previously mobile, alert individual may signal volume deficit in the absence of apparent acute illness.8
Apathy and withdrawal may accompany hypovolemic states. Patients with kidney failure and the accompanying systemic increases in electrolytes, fluids, and nitrogenous waste products may exhibit apathy, restlessness, confusion, and withdrawal.2 The speed of onset depends on how rapidly or slowly the kidney failure progresses and alters homeostasis.
Laboratory Assessment
There is no single or ideal laboratory test or marker that detects a decrease in kidney function.11 Laboratory tests (serum and urine) used to detect and diagnose kidney dysfunction have limitations, but when reviewed daily for changes or trends, they provide valuable information concerning the status of the kidneys. Small changes in kidney function are associated with short- and long-term outcomes for hospitalized patients.9 In addition to the history and physical examination, laboratory data are extremely helpful in the diagnosis, management, and ongoing evaluation of kidney system dysfunction.
Serum Components
Blood Urea Nitrogen
Blood urea nitrogen (BUN) is a byproduct of protein and amino acid metabolism. The normal value for BUN is 5 to 20 mg/dL, which is increased when kidney function deteriorates. With kidney dysfunction, the BUN is elevated because of a decrease in the glomerular filtration rate (GFR) and resulting decrease in urea excretion. Elevations in the BUN can be correlated with the clinical manifestations of uremia; as the BUN rises, symptoms of uremia become more pronounced.2 However, a drop in the GFR with an increase in the BUN also may be caused by hypovolemia and dehydration, nephrotoxic medications, or a sudden hypotensive episode. In these cases, the rise in BUN is caused by a decreased GFR in the presence of normal kidney function. BUN is also increased by changes in protein metabolism that occur with excessive protein intake and catabolism. A catabolic state may occur with starvation (or chronic poor nutrition in a critically ill patient), severe infection, surgery, or trauma. The BUN level also may be elevated as the result of hematoma resorption, gastrointestinal bleeding, excessive licorice ingestion, or steroid or tetracycline therapy. A decrease in the BUN level may indicate volume overload, liver damage, severe malnutrition (as a result of depleted protein stores), use of phenothiazines, or pregnancy.
Creatinine
Creatinine is a byproduct of muscle and normal cell metabolism, and it appears in serum in amounts generally proportional to the body muscle mass. Although slightly higher in males than females, the normal serum creatinine level is about 0.5 to 1.2 mg/dL. Creatinine is freely filtered by the glomerulus, easily excreted by the kidney tubules, and minimally resorbed or secreted in the tubules.2 Creatinine levels are fairly constant and are affected by fewer factors than BUN. As a result, the serum creatinine level is a more sensitive and specific indicator of kidney function than BUN. Creatinine excess occurs most often in persons with kidney failure resulting from impaired excretion. However, the body’s production and release of creatinine may vary during muscle wasting in acute illness, leading to a falsely low serum level of creatinine. Elevated levels of creatinine are seen in muscle growth disorders such as acromegaly, with traumatic skeletal muscle injury, and with some medications that decrease creatinine removal (e.g., trimethoprim, cimetidine) in the absence of kidney dysfunction. Malnutrition can result in transient increases in creatinine levels as the rapid muscle catabolism associated with malnutrition releases increased amounts of creatinine into the circulation.
Creatinine Clearance
The urine creatinine clearance is a measure of how well the kidneys remove creatinine. Because of the relatively constant rate at which creatinine is produced and the nearly complete removal of creatinine by normal kidneys, the ability of the kidneys to remove (clear) creatinine from the blood is an indication of how well the glomeruli and tubules are working. Measuring the creatinine clearance—the amount of creatinine in the excreted urine and the amount of creatinine in the blood over 24 hours—provides a reliable and accurate estimate of glomerular filtration and therefore of kidney function.2 The normal value for creatinine clearance is 110 to 120 mL/min; values less than 50 mL/min indicate significant kidney dysfunction. The creatinine clearance is traditionally measured using a 12- or 24-hour urine collection and blood sample. Newer methods use a random, smaller-volume urine specimen and blood sample. Creatinine clearance can also be estimated from the serum creatinine level (Box 26-4), a method commonly used in the critical care unit. The estimated or calculated creatinine clearance is widely used to determine changes in medication dosing with kidney dysfunction because of the many medications excreted by the kidneys.
Box 26-4 Creatinine Clearance Calculations*
Estimated: Adults—Cockcroft-Gault Formula
< ?xml:namespace prefix = "mml" />

Estimated: Adults—Modification of Diet in Renal Disease (MDRD) Formula


*Online calculators available from the National Kidney Foundation at http://www.kidney.org/professionals.
†Both risk factor assessments apply for African American women. The number would be multiplied by both 0.742 (woman) and 1.210 (African American).
Cystatin C
Although not widely used in practice, cystatin C is another serum marker for kidney function. Cystatin C is a substance synthesized and released by most cells in the body at a constant rate.10 Like creatinine, cystatin C is filtered easily by the glomerulus and not secreted or resorbed by the tubules. The advantage of cystatin C is that it is metabolized by the tubules. In normal kidney function, cystatin C levels are very low because the glomerulus filters it and the tubules metabolize it. In kidney dysfunction, the glomerular filtration of cystatin C is reduced and therefore not provided to the tubules for metabolism. Cystatin C is affected by fewer factors (e.g., age, gender, muscle mass) than creatinine, and a change in its level can be detected earlier during AKI than creatinine.10 Cystatin C and other kidney-related biomarkers may become more widely used as a kidney function marker as additional clinical validation studies are completed.10
Osmolality
The serum osmolality reflects the concentration or dilution of vascular fluid and measures the dissolved particles in the serum. The normal serum osmolality is 275 to 295 mOsm/L.3 An elevated osmolality level indicates hemoconcentration or dehydration, and a decreased osmolality level indicates hemodilution or volume overload. When the serum osmolality level increases, antidiuretic hormone (ADH) is released from the posterior pituitary gland and stimulates increased water resorption in the kidney tubules. This expands the vascular space, returns the serum osmolality level back to normal, and results in more concentrated urine and an elevated urine osmolality level. The opposite occurs with a decreased serum osmolality level, which inhibits the production of ADH. The decreased ADH results in increased excretion of water in the tubules, producing dilute urine with a low osmolality, and returns the serum osmolality level back to normal. Sodium accounts for 85% to 95% of the serum osmolality value; doubling the serum sodium level gives an estimate of the serum osmolality level in healthy individuals. Other particles in the serum can increase the osmolality and need to be considered in individuals with common comorbid conditions. A more precise estimation of serum osmolality can be calculated from the following formula:

Anion Gap
The anion gap is a calculation of the difference between the measurable extracellular plasma cations (sodium and potassium) and the measurable anions (chloride and bicarbonate).3 In plasma, sodium is the predominant cation and chloride is the predominant anion. Extracellular potassium concentration in plasma is so small that it is generally ignored, leaving the following equation for calculation of the anion gap:
The normal anion gap is 8 to 16 mEq/L, a range that has been verified in a healthy population of adults.11 The “gap” represents the unmeasurable ions present in the ECF (phosphates, sulfates, ketones, lactate). An increased anion gap level usually reflects overproduction or decreased excretion of acid products and indicates metabolic acidosis; a decreased anion gap indicates metabolic alkalosis.
Acute and chronic kidney failure can increase the anion gap because of retention of acids and altered bicarbonate resorption.12 The anion gap is also increased in diabetic ketoacidosis caused by ketone production. The measurement of the anion gap is a rapid method for identifying acid–base imbalance but cannot be used to pinpoint the source of the acid–base disturbance specifically.
Hemoglobin and Hematocrit
The hemoglobin and hematocrit levels can indicate increases or decreases in intravascular fluid volume. Hemoglobin and hematocrit values vary between genders; the hemoglobin level in males is normally 13.5 to 17.5 g/dL, and in females, it is 12 to 16 g/dL. The hematocrit level is 40% to 54% in males and 37% to 47% in females. Hematocrit levels are higher in newborns (up to 65%) and decrease to adult ranges between the ages of 4 and 10 years. Hemoglobin transports oxygen and carbon dioxide and is important in maintaining cellular metabolism and acid–base balance.3
Conversely, a decreased hematocrit value can indicate fluid volume excess because of the dilutional effect of the extra fluid load. Decreases also can result from anemias, blood loss, liver damage, or hemolytic reactions. In individuals with acute kidney failure, anemia may occur early in the disease.13 A decreased hematocrit level may indicate the anemia of kidney failure or may reflect fluid volume overload. If the hematocrit value is decreasing but the hemoglobin concentration remains constant, the cause is fluid volume overload. Decreased hematocrit values and hemoglobin concentrations indicate a true loss of RBCs. The history and bedside assessment, including hemodynamic monitoring data, aid in determining whether fluid imbalances or disease states, or both, are responsible for changes in hematocrit levels in the critically ill patient.
Urinalysis
Analysis of the urine provides excellent information about the patient’s kidney function and condition relative to fluids and electrolytes. Specific tests and abnormal indications are presented in Table 26-3. In the critically ill patient a routine urinalysis specimen may be obtained to rule out the presence of urinary protein or glucose. A sterile urine culture may be obtained if a urinary tract infection (UTI) is suspected.
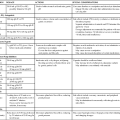
TABLE 26-3
| TEST | NORMAL | POSSIBLE CAUSES FOR INCREASED VALUES | POSSIBLE CAUSES FOR DECREASED VALUES |
| pH | 4.5-8.0 | Alkalosis | Acidosis |
| Intrarenal AKI | |||
| Specific gravity | 1.003-1.030* | Volume deficit | Volume overload |
| Glycosuria | Intrarenal AKI | ||
| Proteinuria | |||
| Prerenal AKI (>1.020) | |||
| Osmolality | 300-1200 mOsm/kg | Volume deficit | Volume excess |
| Prerenal AKI (urine > serum osmolality) | Intrarenal AKI (urine < serum osmolality) | ||
| Protein | 30-150 mg/24 hr† | Trauma | |
| Infection | |||
| Intrarenal AKI | |||
| Transient with exercise | |||
| Glomerulonephritis | |||
| Sodium | 40-220 mEq/24 hr | High-sodium diet | Prerenal AKI |
| Intrarenal AKI | |||
| Creatinine | 1-2 g/24 hr | Intrarenal AKI | |
| Chronic kidney failure | |||
| Urea | 6-17 g/24 hr | Intrarenal AKI | |
| Chronic kidney failure | |||
| Myoglobin | Absent | Crush injury | |
| Rhabdomyolysis | |||
| RBCs | 0-5‡ | Trauma | |
| Intrarenal AKI | |||
| Infection | |||
| Strenuous exercise | |||
| Renal artery thrombus | |||
| WBCs | 0-5‡ | Infection | |
| Bacteria | None to few | Infection | |
| Casts | None to few | RBC: glomerular disease | |
| WBC: pyelonephritis | |||
| Glomerular disease | |||
| Nephrotic syndrome | |||
| Epithelial: glomerular disease |
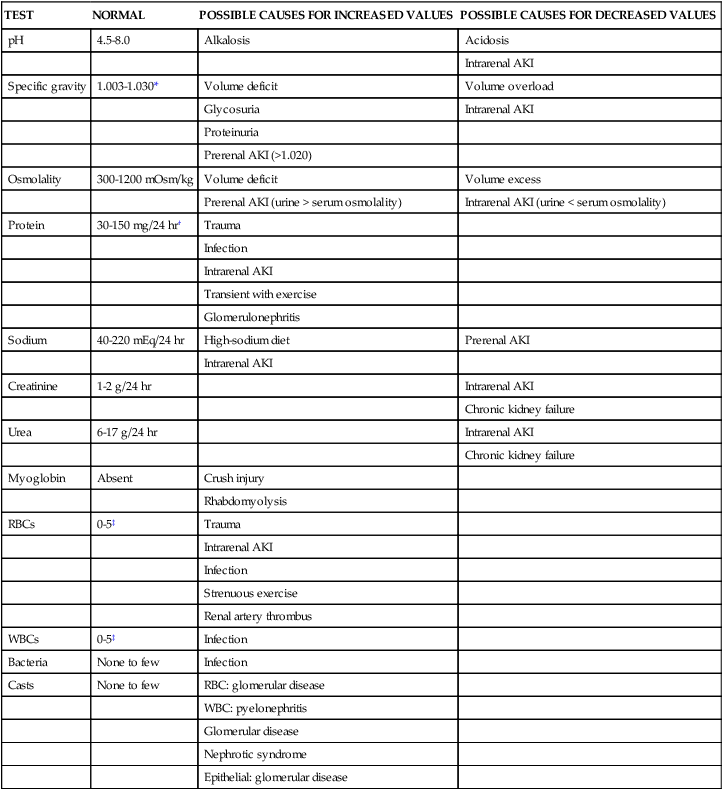
AKI, Acute kidney injury; RBCs, red blood cells; WBCs, white blood cells.
*Adult value; newborn value is slightly lower at 1.001-1.020.
†Higher values usually apply for persons after exercise; lower values apply for persons at rest.
Urine Appearance
Physical examination of the urine focuses on a general inspection of the urine’s color, clarity, and odor. Normal urine is pale yellow, but it may vary due to food intake (carrots, beets, rhubarb), medications (phenytoin, nitrofurantoin, phenazopyridine), or metabolic byproducts (bilirubin, methemoglobin). Clarity of the urine may be affected by bacteria, white blood cells (WBCs), or urates. Normal urine has minimal odor; a strong odor may be caused by concentrated urine (as in dehydrated states), infection, medicines (especially vitamins), or foods (broccoli, asparagus).14
Urine pH
Urine pH indicates the acidity or alkalinity of the urine. The normal urinary pH is acidic but has a range from 4.5 to 8.14 The kidneys regulate acid–base balance; more hydrogen ions are excreted than bicarbonate ions, causing the acidity of the urine. Changes in metabolic function and kidney function produce changes in urinary pH.
Urine Specific Gravity
Specific gravity measures the density or weight of urine compared with that of distilled water. The normal urinary specific gravity is 1.005 to 1.025.14 For comparison, the specific gravity of distilled water is 1.000. Because urine is composed of many solutes and substances suspended in water, the specific gravity should always be higher than that of water.
The specific gravity reflects hydration status and indicates the ability of the kidneys to dilute or concentrate the urine. Decreases in specific gravity reflect the inability of the kidneys to excrete the usual solute load into the urine (less dense with fewer solutes). Increases in specific gravity are caused by dehydration (more concentrated urine), or with additional glucose (diabetes) or protein (glomerular dysfunction) that increase urine density.14 A fixed specific gravity (does not vary with fluid intake) suggests early kidney dysfunction because the kidneys are unable to excrete or resorb water and solutes.
Urine Protein
Protein normally is absent from urine because protein molecules are too large to be filtered across the intact glomerular capillary membrane. Protein amounts greater than 150 mg/day signal compromise of the glomerular membrane and intrinsic kidney damage.14
Traditionally, quantitative measurement of the amount of protein in the urine required a 24-hour urine collection.14 A “spot” or random urine sample can also be used as the correlation between the two tests is very strong.14 Both the amount of protein and the amount of creatinine in the urine specimen are measured. A normal urine protein to urine creatinine ratio is less than 0.2; a protein-to-creatinine ratio of 3.5 indicates approximately 3.5 grams of protein are being excreted per day, indicating severe protein loss by the kidneys.
Urine Glucose
Glycosuria is defined as glucose in the urine. Glucose normally is completely resorbed by the kidney tubules, and the urine should be free of glucose. Urinary glucose should not exceed 130 mg per day.14 In the presence of acute or chronic kidney failure, glycosuria may not be a reliable indicator of the level of hyperglycemia because of the damaged nephrons. In the critical care unit, the serum glucose is measured, not urine values.
Urine Sediment
The presence of sediment such as epithelial cells and casts in urine aids in identifying problems related to the kidneys.14 A fresh urine specimen, tested 30 to 60 minutes following collection, is important.14 Urine becomes more alkaline after it has been collected, resulting in a change in the urine sediment (e.g., casts dissolve, cells lyse). The presence or absence of urine sediment can be helpful in identifying the cause of AKI. In prerenal AKI, the kidneys are not injured, and urinary sediment is absent. However, in intrarenal AKI, the kidney glomeruli or tubules are damaged, allowing urinary sediment containing casts and epithelial cells in the urine.14
Casts are cylindrical structures composed mainly of mucoprotein (Tamm-Horsfall protein), which is secreted by epithelial cells lining the loops of Henle, the distal tubules, and the collecting ducts. Casts may form in the presence of epithelial cells, RBCs, or WBCs in the tubular lumen. These cells or clumps of cellular breakdown products can adhere to and be surrounded by the fibrillar mucoprotein matrix, and the resulting casts are washed out of the kidney tubular system in the urinary flow. Casts differ in composition and size and correlate with the severity and type of kidney damage. For example, WBC casts indicate pyelonephritis, or they may occur during acute glomerulonephritis. RBC casts indicate glomerulonephritis. Hyaline casts, which consist of Tamm-Horsfall protein, are associated with kidney parenchymal disease and glomerular capillary membrane inflammation. Consistent appearance of epithelial cells shed by the lining of the nephron may indicate nephritis. Although small numbers of epithelial cells normally appear in the urine and an occasional cast may be found, their consistent appearance is abnormal.14
Urine Toxicology Screen
Urine can be screened to detect the presence of alcohol, illegal drugs, prescription and nonprescription medications, and other substances that are excreted via the kidneys.15 The is often referred to as a Urine Drug Screen (UDS).15 Urine toxicology tests conducted in the emergency department or the critical care unit are considered screening tests and are not diagnostic of a disease state.15 These analyses are typically undertaken to provide information about causes of an altered level of consciousness rather than to identify kidney-related problems.
Imaging Studies
Although laboratory assessment is used most often in diagnosing kidney problems in the critically ill patient, imaging studies can confirm or clarify causes of particular disorders. Imaging assessment includes the use of ultrasound and radiologic techniques. Ultrasound is a noninvasive imaging technique that is available in most hospitals. Kidney ultrasound is especially useful in determining the size, shape, and contour of the kidneys, the presence of masses or cysts, and the presence of renal artery stenosis.16 Radiologic assessment ranges from basic to more complex (Table 26-4) and provides information about abnormal masses, abnormal fluid collections, obstructions, vascular supply alterations, and other disorders of the kidneys and urinary tract.16
TABLE 26-4
| TEST | COMMENTS |
| Kidney-ureter-bladder (KUB) radiograph | Flat-plate radiograph of the abdomen; determines position, size, and structure of the kidneys, urinary tract, and pelvis; useful for evaluating the presence of calculi and masses; usually followed by additional tests |
| Intravenous pyelogram (IVP) | Intravenous injection of contrast with radiography; allows visualization of internal kidney tissues |
| Angiography | Injection of contrast into arterial blood perfusing the kidneys; allows visualization of renal blood flow; may also visualize stenosis, cysts, clots, trauma, and infarctions |
| Computed tomography (CT) | Radioisotope is administered by intravenous route and absorbed by the kidneys; scintillation photography is then performed in several planes; spiral or helical CT allows rapid imaging; density of the image helps evaluate kidney vessels, perfusion, tumors, cysts, stones/calculi, hemorrhage, necrosis, and trauma |
| Ultrasound | High-frequency sound waves are transmitted to the kidneys and urinary tract, and the image is viewed on an oscilloscope; noninvasive; identifies fluid accumulation or obstruction, cysts, stones/calculi, and masses; useful for evaluating kidney before biopsy |
| Magnetic resonance imaging (MRI) | A scanner produces three-dimensional images in response to the application of high-energy radiofrequency waves to the tissues; produces clear images; density of the image may indicate trauma, cysts, masses, malformation of the vessels or tubules stones/calculi, and necrosis |
Some radiologic studies require the use of contrast or injection of a radiopaque dye. Because many of the dyes used in radiology are potentially nephrotoxic, they must be used carefully in patients with AKI or chronic kidney disease.17,18 To prevent contrast induced nephrotoxicity (CIN), adequate hydration before and after the test and careful monitoring of kidney function are always indicated.17,18
Kidney Biopsy
Kidney biopsy is the definitive tool for diagnosing disease processes involving the parenchyma of the kidney. Percutaneous needle biopsy involves inserting a needle through the flank to obtain a specimen of cortical and medullary kidney tissue.19,20 An open biopsy is a surgical procedure and is rarely done in critically ill patients. In either case, biopsy is the last choice for diagnostic assessment in the critically ill patient because of the periprocedural risks of bleeding, hematoma, and infection.19,20
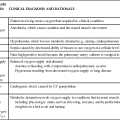
Summary
Clinical Assessment
• Predisposing factors for acute kidney dysfunction are obtained during the history, including the use of over-the-counter medicines, recent infections requiring antibiotic therapy, antihypertensive medicines, and any diagnostic procedures performed using radiopaque contrast.
• Urine output may be decreased or normal, depending on the cause of the kidney dysfunction but low urine output is insufficient to identify acute kidney injury (AKI).
Laboratory Studies
• Blood urea nitrogen (BUN) is a byproduct of protein and amino acid metabolism. BUN is increased when kidney function deteriorates.
• Serum creatinine is used to trend kidney function in critical illness as creatine is not resorbed by the kidney tubules and rises when kidney function deteriorates.
• Cystatin C is a newer serum biomarker for early identification of acute kidney injury.
• Electrolyte derangements are frequent in kidney failure including: sodium, potassium, phosphate, calcium, chloride, and bicarbonate.
• Anion gap is increased in kidney failure in association with electrolyte and acid–base changes.
• Urinalysis can provide valuable information about kidney function, but results are not reliable if the patient has recently been administered diuretics.