Invasive monitoring
Invasive arterial pressure monitoring
Components
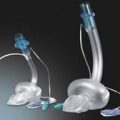
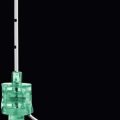
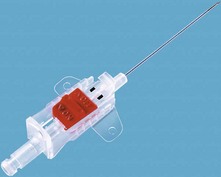
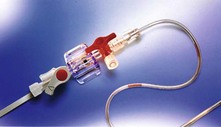
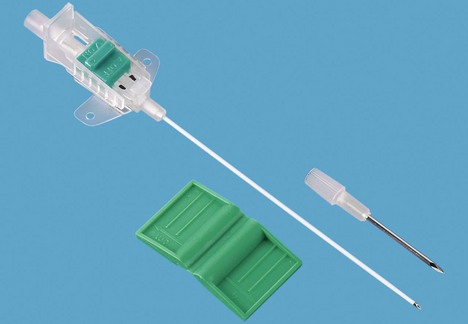
1. An indwelling Teflon arterial cannula (20 or 22 G) is used (Fig. 11.1). The cannula has parallel walls to minimize the effect on blood flow to the distal parts of the limb. Cannulation can be achieved by directly threading the cannula (either by direct insertion method or a transfixation technique) or by using a modified Seldinger technique with a guidewire to assist in the insertion as in some designs (Fig. 11.2).
2. A column of bubble-free heparinized or plain 0.9% normal saline at a pressure of 300 mmHg, incorporating a flushing device.
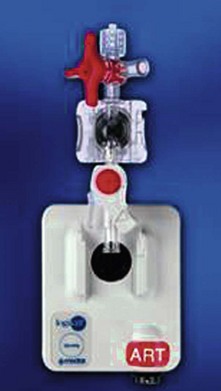
3. Via the fluid column, the cannula is connected to a transducer (Figs 11.3–11.5). This in turn is connected to an amplifier and oscilloscope. A strain gauge variable resistor transducer is used.
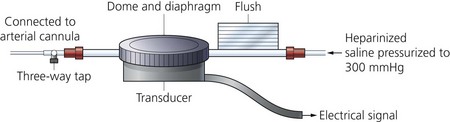
4. The diaphragm (a very thin membrane) acts as an interface between the transducer and the fluid column.
5. The pressure transducer is a device that changes either electrical resistance or capacitance in response to changes in pressure on a solid-state device. The moving part of the transducer is very small and has little mass.
Mechanism of action
1. The saline column moves back and forth with the arterial pulsation causing the diaphragm to move. This causes changes in the resistance and current flow through the wires of the transducer.
2. The transducer is connected to a Wheatstone bridge circuit (Fig. 11.6). This is an electrical circuit for the precise comparison of resistors. It uses a null-deflection system consisting of a very sensitive galvanometer and four resistors in two parallel branches: two constant resistors, a variable resistor and the unknown resistor. Changes in resistance and current are measured, electronically converted and displayed as systolic, diastolic and mean arterial pressures. The Wheatstone bridge circuit is ideal for measuring the small changes in resistance found in strain gauges. Most pressure transducers contain four strain gauges that form the four resistors of the Wheatstone bridge.
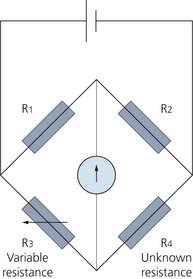
Fig. 11.6 The Wheatstone bridge circuit where null deflection of the galvanometer implies R1/R2 = R3/R4.
3. The flushing device allows 3–4 mL per hour of saline (or heparinized saline) to flush the cannula. This is to prevent clotting and backflow through the catheter. Manual flushing of the system is also possible when indicated.
4. The radial artery is the most commonly used artery because the ulnar artery is the dominant artery in the hand. The ulnar artery is connected to the radial artery through the palmar arch in 95% of patients. The brachial, femoral, ulnar or dorsalis pedis arteries are used occasionally.
5. The information gained from invasive arterial pressure monitoring includes heart rate, pulse pressure, the presence of a respiratory swing, left ventricular contractility, vascular tone (SVR) and stroke volume.
The arterial pressure waveform
1. This can be characterized as a complex sine wave that is the summation of a series of simple sine waves of different amplitudes and frequencies.
2. The fundamental frequency (or first harmonic) is equal to the heart rate, so a heart rate of 60 beats per min = 1 beat/s or 1 cycle/s or 1 Hz. The first 10 harmonics of the fundamental frequency contribute to the waveform.
3. The system used to measure arterial blood pressure should be capable of responding to a frequency range of 0.5–40 Hz in order to display the arterial waveform correctly.
4. The dicrotic notch in the arterial pressure waveform represents changes in pressure because of vibrations caused by the closure of the aortic valve.
5. The rate of rise of the upstroke part of the wave (dP/dt) reflects the myocardial contractility. A slow rise upstroke might indicate a need for inotropic support. A positive response to the inotropic support will show a steeper upstroke. The maximum upward slope of the arterial waveform during systole is related to the speed of ventricular ejection.
6. The position of the dicrotic notch on the downstroke of the wave reflects the peripheral vascular resistance. In vasodilated patients, e.g. following an epidural block or in septic patients, the dicrotic notch is positioned lower on the curve. The notch is higher in vasoconstricted patients.
7. The downstroke slope indicates resistance to outflow. A slow fall is seen in vasoconstriction.
8. The stroke volume can be estimated by measuring the area from the beginning of the upstroke to the dicrotic notch. Multiply that by the heart rate and the cardiac output can be estimated.
9. Systolic time indicates the myocardial oxygen demand. Diastolic time indicates myocardial oxygen supply.
10. Mean blood pressure is the average pressure throughout the cardiac cycle. As systole is shorter than diastole, the mean arterial pressure (MAP) is slightly less than the value half way between systolic and diastolic pressures. An estimate of MAP can be obtained by adding a third of the pulse pressure (systolic − diastolic pressure) to the diastolic pressure. MAP can also be determined by integrating a pressure signal over the duration of one cycle, divided by time.
Problems in practice and safety features
1. The arterial pressure waveform should be displayed (Fig. 11.7) in order to detect damping or resonance. The monitoring system should be able to apply an optimal damping value of 0.64.
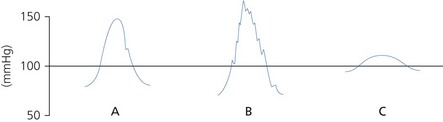
a) Damping is caused by dissipation of stored energy. Anything that takes energy out of the system results in a progressive diminution of amplitude of oscillations. Increased damping lowers the systolic and elevates the diastolic pressures with loss of detail in the waveform. Damping can be caused by an air bubble (air is more compressible in comparison to the saline column), clot or a highly compliant, soft transducer diaphragm and tube.
b) Resonance occurs when the frequency of the driving force coincides with the resonant frequency of the system. If the natural frequency is less than 40 Hz, it falls within the range of the blood pressure and a sine wave will be superimposed on the blood pressure wave. Increased resonance elevates the systolic and lowers the diastolic pressures. The mean pressure should stay unchanged. Resonance can be due to a stiff, non-compliant diaphragm and tube. It is worse with tachycardia.
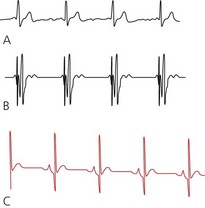
2. To determine the optimum damping of the system, a square wave test (fast flush test) is used (Fig. 11.8). The system is flushed by applying a pressure of 300 mmHg (compress and release the flush button or pull the lever located near the transducer). This results in a square waveform, followed by oscillations:
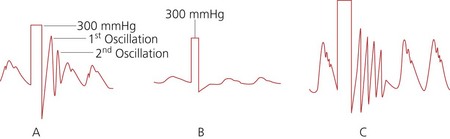
a. in an optimally damped system, there will be two or three oscillations before settling to zero
b. an overdamped system settles to zero without any oscillations.
c. an underdamped system oscillates for more than three to four cycles before settling to zero.
3. The transducer should be positioned at the level of the right atrium as a reference point that is at the level of the midaxillary line. Raising or lowering the transducer above or below the level of the right atrium gives error readings equivalent to 7.5 mmHg for each 10 cm.
4. Ischaemia distal to the cannula is rare but should be monitored for. Multiple attempts at insertion and haematoma formation increase the risk of ischaemia.
5. Arterial thrombosis occurs in 20–25% of cases with very rare adverse effects such as ischaemia or necrosis of the hand. Cannulae in place for less than 24 h very rarely cause thrombosis.
6. The arterial pressure wave narrows and increases in amplitude in peripheral vessels. This makes the systolic pressure higher in the dorsalis pedis than in the radial artery. When compared to the aorta, peripheral arteries contain less elastic fibres so they are stiffer and less compliant. The arterial distensibility determines the amplitude and contour of the pressure waveform. In addition, the narrowing and bifurcation of arteries leads to impedance of forward blood flow, which results in backward reflection of the pressure wave.
7. There is risk of bleeding due to disconnection.
8. Inadvertent drug injection causes distal vascular occlusion and gangrene. An arterial cannula should be clearly labelled.
9. Local infection is thought to be less than 20%. Systemic infection is thought to be less than 5%. This is more common in patients with an arterial cannula for more than 4 days with a traumatic insertion.
10. Arterial cannulae should not be inserted in sites with evidence of infection and trauma or through a vascular prosthesis.
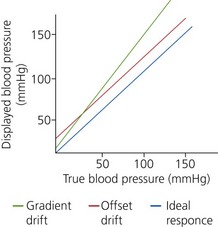
11. Periodic checks, calibrations and re-zeroing are carried out to prevent baseline drift of the transducer electrical circuits. Zero calibration eliminates the effect of atmospheric pressure on the measured pressure. This ensures that the monitor indicates zero pressure in the absence of applied pressure, so eliminating the offset drift (zero drift). To eliminate the gradient drift, calibration at a higher pressure is necessary. The transducer is connected to an aneroid manometer using a sterile tubing, through a three-way stopcock and the manometer pressure is raised to 100 and 200 mmHg. The monitor display should read the same pressure as is applied to the transducer (Fig. 11.9).
Central venous catheterization and pressure (CVP)
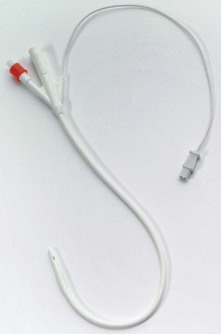
The CVP is the filling pressure of the right atrium. It can be measured directly using a central venous catheter. The catheter can also be used to administer fluids, blood, drugs, parenteral nutrition and sample blood. Specialized catheters can be used for haemofiltration, haemodialysis (see Chapter 13, Haemofiltration) and transvenous pacemaker placement.
The Seldinger technique is the common and standard method used for central venous catheterization (Fig. 11.10) regardless of catheter type. The procedure should be done under sterile conditions:
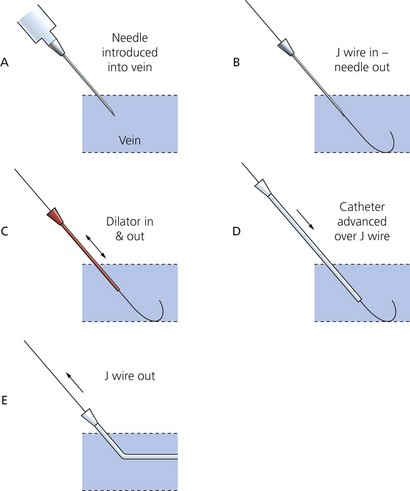
1. Introduce the needle into the vein using the appropriate landmarks or an ultrasound-locating device.
2. A J-shaped soft tip guidewire is introduced through the needle (and syringe in some designs) into the vein. The needle can then be removed. The J-shaped tip is designed to minimize trauma to the vessels’ endothelium.
3. After a small incision in the skin has been made, a dilator is introduced over the guidewire to make a track through the skin and subcutaneous tissues and is then withdrawn.
4. The catheter is then railroaded over the guidewire into its final position before the guidewire is withdrawn.
5. Blood should be aspirated easily from all ports which should then be flushed with saline or heparin solution. All the port sites that are not intended for immediate use are sealed. A port should never be left open to air during insertion because of the risk of air embolism.
6. The catheter is secured onto the skin and covered with a sterile dressing.
7. A chest X-ray is performed to ensure correct positioning of the catheter and to detect pneumo-and/or haemothorax.
8. The use of ultrasound guidance should be routinely considered for the insertion of central venous catheters (Fig. 11.11). There is evidence to show that its use during internal jugular venous catheterization reduces the number of mechanical complications, the number of catheter-placement failures and the time required for insertion.
The CVP is read using either a pressure transducer or a water manometer.
Pressure transducer
1. A similar measuring system to that used for invasive arterial pressure monitoring (catheter, heparinized saline column, transducer, diaphragm, flushing device and oscilloscope system). The transducer is positioned at the level of the right atrium.
2. A measuring system of limited frequency range is adequate because of the shape of the waveform and the values of the central venous pressure.
Fluid manometer (Fig. 11.12)
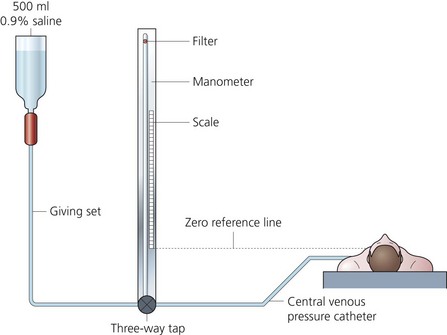
1. A giving set with either normal saline or 5% dextrose is connected to the vertical manometer via a three-way tap. The latter is also connected to the central venous catheter.
2. The manometer has a spirit level side arm positioned at the level of the right atrium (zero reference point). The upper end of the column is open to air via a filter. This filter must stay dry to maintain direct connection with the atmosphere.
3. The vertical manometer is filled to about the 20-cm mark. By opening the three-way tap to the patient, a swing of the column should be seen with respiration. The CVP is read in cm H2O when the fluid level stabilizes.
4. The manometer uses a balance of forces: downward pressure of the fluid (determined by density and height) against pressure of the central venous system (caused by hydrostatic and recoil forces).
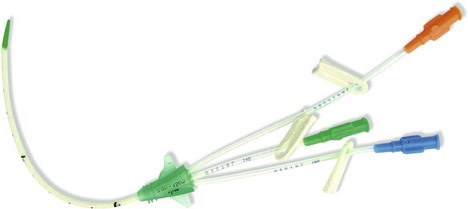
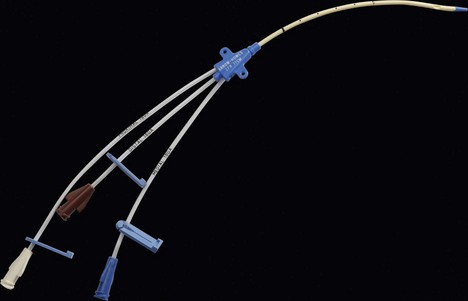
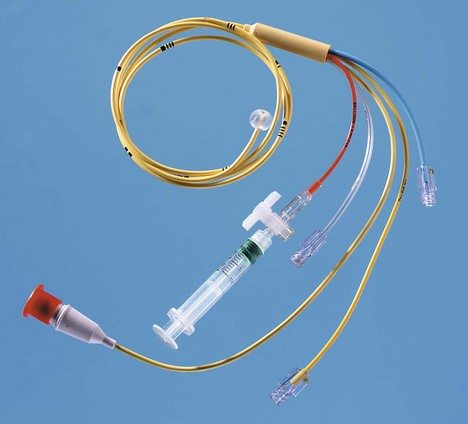
Catheters
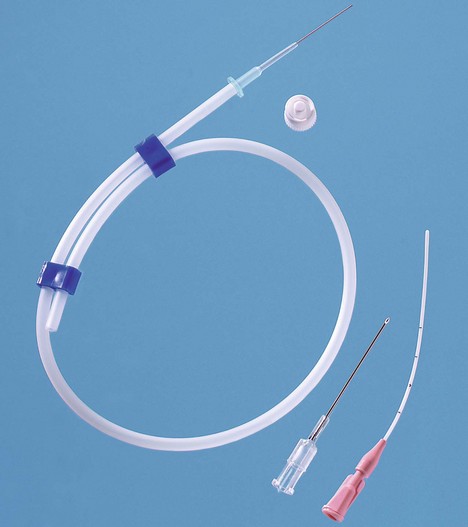
There are different types of catheters used for central venous cannulation and CVP measurement. They differ in their lumen size, length, number of lumens, the presence or absence of a subcutaneous cuff and the material they are made of. The vast majority of catheters are designed to be inserted using the Seldinger technique although some are designed as ‘long’ intravenous cannulae (cannula over a needle) (Fig. 11.13).
Antimicrobial-coated catheters have been designed to reduce the incidence of catheter-related bloodstream infection. These can be either antiseptic coated (e.g. chlorhexidine/silver sulfadiazine, benzalkonium chloride, platinum/silver) or antibiotic coated (e.g. minocycline/rifampin) on either the internal or external surface or both. The antibiotic-coated central lines are thought to be more effective in reducing the incidence of infection (Fig. 11.14).
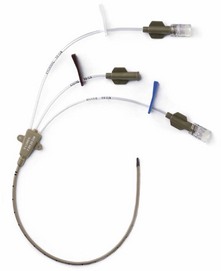
Multilumen catheter
1. The catheter has two or more lumens of different sizes, e.g. 16 G and 18 G (Fig. 11.15). Paediatric sizes also exist (Fig. 11.16).
2. The different lumens should be flushed with heparinized saline before insertion.
3. Single and double lumen versions exist.
4. Simultaneous administration of drugs and CVP monitoring is possible. It does not allow the insertion of a pulmonary artery catheter.
5. These catheters are made of polyurethane. This provides good tensile strength, allowing larger lumens for smaller internal diameter.
Long central catheters/peripherally inserted central catheters (PICC)
1. These catheters, 60 cm in length, are designed to be inserted through an introducing cannula via an antecubital fossa vein, usually the basilic vein (Fig. 11.17).
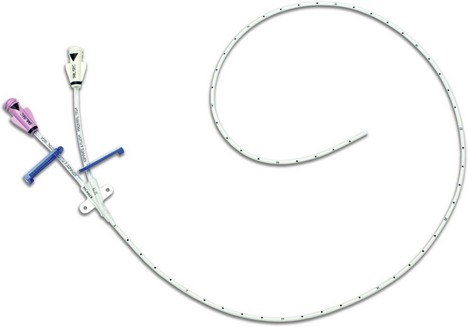
2. They are used when a central catheter is required in situations when it is undesirable to gain access via the internal jugular or the subclavian veins, for example during head and neck surgery or prolonged antibiotic therapy. They are made of soft flexible polyurethane or silicone.
Hickman catheters
1. These central catheters are made of polyurethane or silicone and are usually inserted into the subclavian vein. The catheter can have one, two or three lumens (Fig. 11.18).
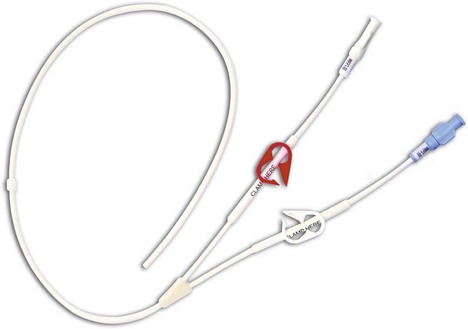
2. The proximal end is tunnelled under the skin for a distance of about 10 cm.
3. A Dacron cuff is positioned 3–4 cm from the site of entry into the vein under the skin. It induces a fibroblastic reaction to anchor the catheter in place (Fig. 11.19). The cuff also reduces the risk of infection as it stops the spread of infection from the site of entry to the skin. Some catheters also have a silver impregnated cuff that acts as an anti-microbial barrier.
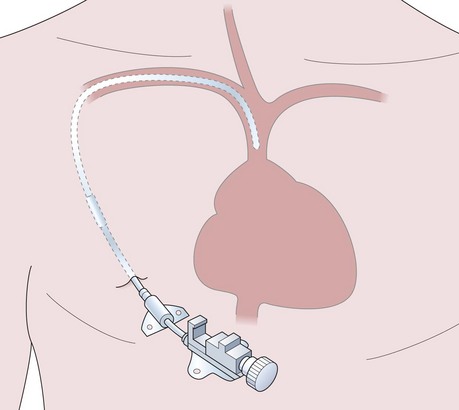
4. They are used for long-term chemotherapy, parenteral nutrition, blood sampling or as a readily available venous access especially in children requiring frequent anaesthetics during cancer treatment.
5. These lines are designed to remain in situ for several months unless they become infected but require some degree of daily maintenance.
Dialysis catheters
Problems in practice and safety features
1. Inaccurate readings can be due to catheter blockage, catheter inserted too far or using the wrong zero level.
2. Pneumohaemothorax (with an incidence of 2–10% with subclavian vein catheterization and 1–2% with internal jugular catheterization), trauma to the arteries (carotid, subclavian and brachial), air embolism, haematoma and tracheal puncture are complications of insertion.
3. Sepsis and infection are common complications with an incidence of 2.8–20%. Staphylococcus aureus and Enterococcus are the most common organisms.
4. A false passage may be created if the guidewire or dilator are advanced against resistance. The insertion should be smooth.
5. There may be cardiace complications such as self-limiting arrhythmias due to the irritation caused by the guidewire or catheter. Gradual withdrawal of the device is usually adequate to restore normal rhythm. More serious but unusual complication such as venous or cardiac perforation can be lethal.
6. Catheter-related venous thrombosis is thought to be up to 40% depending on the site, the duration of placement, the technique and the condition of the patient.
7. Microshock. A central venous catheter presents a direct pathway to the heart muscle. Faulty electrical equipment can produce minute electrical currents (less than 1 ampere) which can travel via this route to the myocardium. This can produce ventricular fibrillation (VF) if the tip of the catheter is in direct contact with the myocardium (see Chapter 14). This very small current does not cause any adverse effects if applied to the body surface, but if passed directly to the heart, the current density will be high enough to cause VF, hence the name microshock.
Invasive electrocardiogram (ECG)
In addition to using skin electrodes to record ECG, other more invasive methods can be used (Fig. 11.20). The following methods can be used:
1. Oesophageal ECG can be recorded by using oesophageal electrodes that are incorporated into an oesophageal stethoscope and temperature probe. It has been found to be useful in detecting atrial arrhythmias. As it is positioned near the posterior aspect of the left ventricle, it can be helpful in detecting posterior wall ischaemia.
2. Intracardiac ECG with electrodes inserted using a multipurpose pulmonary artery flotation catheter. There are three atrial and two ventricular electrodes. In addition to ECG recording, these electrodes can be used in atrial or AV pacing. Such ECG recording has great diagnostic capabilities and can be part of an implantable defibrillator. It is used for loci that cannot be assessed by body surface electrodes, such as the bundle of His or ventricular septal activity,
3. Tracheal ECG using two electrodes embedded into a tracheal tube. It is useful in diagnosing atrial arrhythmias especially in children
Cardiac output
1. Arterial waveform analysis either via direct arterial cannulation or ‘simulated’ via a plethysmographic trace (such as that obtained with the pulse oximeter):
7. Electrical velocimetry (EV) is the technique which non-invasively measures rate-of-change of electrical conductivity of blood in the aorta using four standard ECG surface electrodes.
Balloon-tipped flow-guided pulmonary artery catheter
Components
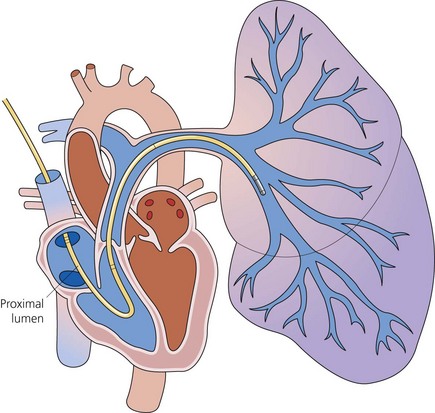
PA catheters are available in sizes 5–8 G and are usually 110 cm in length (Fig. 11.21). They have up to five lumens and are marked at 10-cm intervals:
1. The distal lumen ends in the pulmonary artery. It is used to measure PA and pulmonary capillary wedge (PCW) pressures and to sample mixed venous blood.
2. The proximal lumen should ideally open in the right atrium, being positioned about 30 cm from the tip of the catheter. It can be used to continuously monitor the CVP, to administer the injectate to measure the cardiac output (by thermodilution) or to infuse fluids. Depending on the design, a second proximal lumen may be present which is usually dedicated to infusions of drugs.
3. Another lumen contains two insulated wires leading to a thermistor that is about 3.7 cm from the catheter tip. Proximally it is connected to a cardiac output computer.
4. The balloon inflation lumen is used to inflate the balloon which is situated at the catheter tip.
Up to 1.5 mL of air is needed. When the balloon is inflated, the catheter floats with the blood flow into a pulmonary artery branch (Fig. 11.22).
Mechanism of action
1. Before insertion, flush all the lines and test the balloon with 1–1.5 mL of air.
2. The distal lumen of the catheter is connected to a transducer pressure measuring system for continuous monitoring as the catheter is advanced. As the catheter passes via the superior vena cava to the right atrium, low pressure waves (mean of 3–8 mmHg normally) are displayed (Fig. 11.23). The distance from the internal jugular or the subclavian vein to the right atrium is about 15–20 cm.

3. The balloon is partly inflated, enabling the blood flow to carry the catheter tip through the tricuspid valve into the right ventricle. Tall pressure waves (15–25 mmHg systolic and 0–10 mmHg diastolic) are displayed.
4. As the balloon tip floats through the pulmonary valve into the PA, the pressure waveform changes with higher diastolic pressure (10–20 mmHg), but similar systolic pressures. The dicrotic notch, caused by the closure of the pulmonary valve, can be noted. The distance from the right ventricle to the pulmonary artery should be less than 10 cm, unless there is cardiomegaly.
5. The balloon is fully inflated enabling the blood flow to carry the tip of the catheter into a pulmonary artery branch, where it wedges. This is shown as a damped pressure waveform (pulmonary capillary wedge pressure (PCWP), mean pressure of 4–12 mmHg). This reflects the left atrial filling pressure. The balloon should then be deflated so the catheter floats back into the PA. The balloon should be kept deflated until another PCWP reading is required.
6. The cardiac output can be measured using thermodilution. Ten mL of cold injectate is administered upstream via the proximal lumen. The thermistor (in the pulmonary artery) measures the change in temperature of the blood downstream. A temperature–time curve is displayed from which the computer can calculate the cardiac output (Fig. 11.24). The volume of injectate should be known accurately and the whole volume injected quickly. Usually the mean of three readings is taken. Because of the relatively high incidence of complications, less invasive techniques are being developed to measure the cardiac output. Thermodilution remains the standard method for measuring the cardiac output.

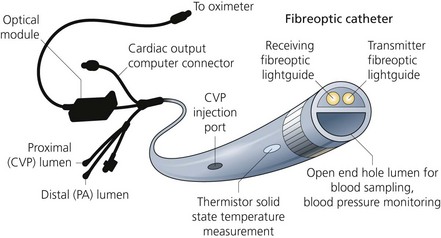
7. Some designs have the facility to continuously monitor the mixed venous oxygen saturation using fibreoptic technology (Figs 11.25 and 11.26). Cardiac pacing capability is present in some designs.
Problems in practice and safety features
The overall morbidity of such catheters is 0.4%.
1. Complications due to central venous cannulation (as above).
2. Complications due to catheter passage and advancement. These include arrhythmias (ventricular ectopics, ventricular tachycardia and others), heart block, knotting/kinking (common in low-flow states and patients with large hearts; a ‘rule of thumb’ is that the catheter should not be advanced more than 10–15 cm without a change in the pressure waveform), valvular damage and perforation of PA vessel.
3. Complications due to the presence in the PA. These include thrombosis (can be reduced by the use of heparin-bonded catheters), PA rupture (more common in the elderly, may present as haemoptysis and is often fatal), infection, balloon rupture, pulmonary infarction, valve damage and arrhythmias.
4. In certain conditions, the PCWP does not accurately reflect left ventricular filling pressure. Such conditions include mitral stenosis and regurgitation, left atrial myxoma, ball valve thrombus, pulmonary veno-occlusive disease, total anomalous pulmonary venous drainage, cardiac tamponade and acute right ventricular dilatation resulting from right ventricular infarction, massive pulmonary embolism and acute severe tricuspid regurgitation.
5. Catheter whip can occur because of the coursing of the pulmonary catheter through the right heart. Cardiac contractions can produce ‘shock transients’ or ‘whip’ artifacts. Negative deflections due to a whip artifact may lead to an underestimation of pulmonary artery pressures.
Oesophageal Doppler haemodynamic measurement
Components
a) a screen for visual verification of correct signal measurement (Fig. 11.27)
b) technology that enables beat-to-beat calculation of the stroke volume and cardiac output.
2. An insulated, thin, latex-free silicone oesophageal probe containing a Doppler transducer angled at 45° (Fig. 11.27). The probe has a diameter of 6 mm with an internal spring coil to ensure flexibility and rigidity.
Mechanism of action
1. The device relies on the Doppler principle. There is an increase in observed frequency of a signal when the signal source approaches the observer and a decrease when the source moves away.
2. The changes in the frequency of the transmitted ultrasound result from the encounter of the wavefront with moving red blood cells. If the transmitted sound waves encounter a group of red cells moving towards the source, they are reflected back at a frequency higher than that at which they were sent, producing a positive Doppler shift. The opposite effect occurs when a given frequency sent into tissues encounters red cells moving away. The result is the return of a frequency lower than that transmitted, resulting in a negative Doppler shift. Analysis of the reflected frequencies allows determination of velocity of flow.
3. The lubricated probe is inserted via the mouth with the bevel of the tip facing up at the back of the patient’s throat into the distal oesophagus to a depth of about 35–40 cm from the teeth.
4. The probe is rotated and slowly pulled back while listening to the audible signal. The ideal probe tip location is at the level between the fifth and sixth thoracic vertebrae because, at that level, the descending aorta is adjacent and parallel to the distal oesophagus. This location is achieved by superficially landmarking the distance to the third sternocostal junction anteriorly. A correctly positioned probe can measure the blood flow in this major vessel using a high ultrasound frequency of 4 MHz.
5. The Doppler signal waveform is analysed and the stroke volume and total cardiac output are computed using the Doppler equation and a normogram which corrects for variations found with differing patient age, sex and body surface area.

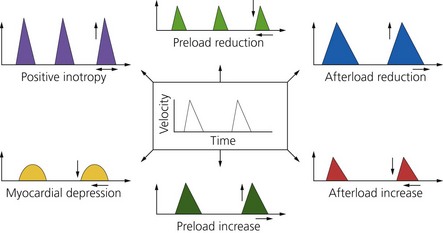
6. The parameters obtained from analysis of the Doppler signal waveform allow the operator to gain an assessment of cardiac output, stroke volume, volaemic status, systemic vascular resistance and myocardial function (Fig. 11.28).
Problems in practice and safety features
1. The probe is fully insulated and safe when diathermy is being used.
2. The probe cannot easily be held in the correct position for long periods. Frequent repositioning may be necessary if continuous monitoring is required.
3. Oesophageal Doppler measurement can only be used in an adequately sedated, intubated patient. Its use in awake patients has been described using local anaesthesia. A suprasternal probe is also available and can be used in awake patients.
4. Insertion of the probe is not recommended in patients with pharyngo-oesophageal pathology (e.g. oesophageal varices).
5. The role of the oesophageal Doppler in children is still being evaluated.
LiDCOrapid
This is a cardiac output monitor that uses arterial pressure waveform analysis software to generate a ‘nominal’ cardiac output value. Because it does not require calibration, it can be quickly set up and the effects of fluids or inotropes assessed (Fig. 11.29).
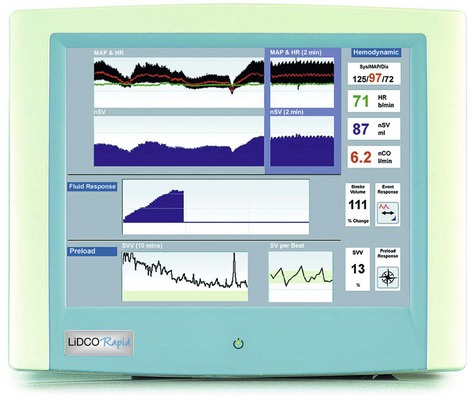
Fig. 11.29 The LiDCOrapid cardiac output monitor.
Mechanism of action
1. The patient’s existing invasive blood pressure trace is fed by a cable into the LiDCOrapid. From this, the software algorithm generates a nominal stroke volume and cardiac output.
2. The LiDCOrapid displays the following parameters: heart rate, pressures (MAP, systolic and diastolic), stroke volume and cardiac output.
3. Dynamic preload parameters can also be generated by the software to assess the stroke volume response to a fluid challenge.
Problems in practice and safety features
The performance of the software may be compromised in the following patient groups:
1. Patients with aortic valve regurgitation.
2. Patients being treated with an intra-aortic balloon pump or cardiac arrythmias that will disrupt the usual arterial waveform pattern.
3. Patients with highly damped peripheral arterial lines or with pronounced peripheral arterial vasoconstriction.
4. The Lidco Plus can be calibrated using a single-point lithium indicator dilution process. This offers more accurate cardiac output measurement.
Temperature probes
Thermistor
Mechanism of action
1. The thermistor has electrical resistance which changes non-linearly with temperature. The response is made linear electronically. This property allows them to accurately measure temperature to an order of 0.1°C.
2. It can be made in very small sizes and is relatively cheap to manufacture.
3. It is mounted in a plastic or stainless steel probe making it mechanically robust, and it can be chemically sterilized.
4. It is used in PA catheters to measure cardiac output.
5. In the negative thermal conductivity thermistors, such as cobalt oxide, copper oxide and manganese oxide, the electrical resistance decreases as the temperature increases. In the positive thermal conductivity thermistors, such as barium titanate, the electrical resistance increases with the temperature.
Infrared tympanic thermometer
Mechanism of action
1. The detector receives infrared radiation from the tympanic membrane.
2. The infrared signal detected is converted into an electrical signal that is processed to measure accurately the core temperature within 3 s.
3. The rate of radiation by an object is proportional to temperature to the fourth power.
Thermocouples
These are devices that make use of the principle that two different metals in contact generate a voltage, which is temperature dependent (Fig. 11.30).
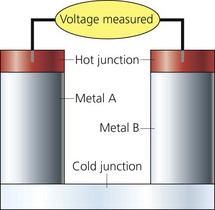
Fig. 11.30 Thermocouple.
Mechanism of action
1. One junction is used as the measuring junction whereas the other one is the reference. The latter is kept at a constant temperature.
2. The metals expand and contract to different degrees with change in temperature producing an electrical potential that is compared to a reference junction. The current produced is directly proportional to the temperature difference between the two junctions, i.e. there is a linear relationship between voltage and temperature.
3. The voltage produced is called the Seebeck effect or thermoelectric effect.
4. The measuring junction produces a potential of 40 µV per °C. This potential is measured by an amplifier.
5. They are stable and accurate to 0.1°C.
6. If multiple thermocouples are linked in series, they constitute a thermopile. This is done to improve their sensitivity
Body core temperature can be measured using different sites:
1. Rectal temperature does not accurately reflect the core temperature in anaesthetized patients. During an operation, changes in temperature are relatively rapid and the rectal temperature lags behind.
2. Oesophageal temperature accurately reflects the core temperature with the probe positioned in the lower oesophagus (at the level of the left atrium). Here the probe is not affected by the cooler tracheal temperature (Fig. 11.31).
Fig. 11.31 Oesophageal/rectal temperature probe.
3. Tympanic membrane temperature is closely associated with brain temperature. It accurately reflects core temperature, compared with lower oesophageal temperature. Thermocouple and thermistor probes as well as the infrared probe can be used (Figs 11.32 and 11.33).
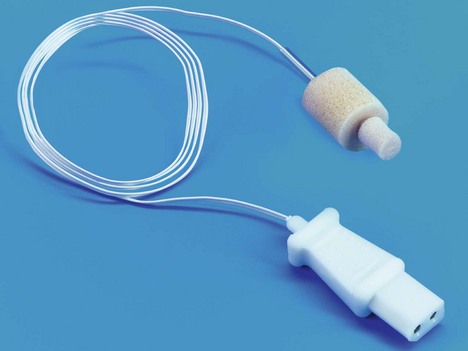
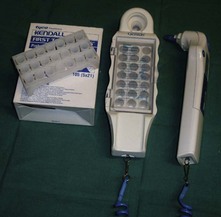
Fig. 11.33 Tympanic membrane thermometer.
4. Bladder temperature correlates well with the core temperature when there is a normal urine output (Fig. 11.34).
5. Skin temperature, when measured with the core temperature, can be useful in determining the volaemic status of the patient (Fig. 11.35).
Fig. 11.35 Skin temperature probe.
Centers for Disease Control and Prevention. Guidelines for the prevention of intravascular catheter-related infections. Online. Available at http://www.cdc.gov/hicpac/pdf/guidelines/bsi-guidelines-2011.pdf, 2011.
National Institute for Health and Clinical Excellence. Inadvertent perioperative hypothermia. The management of inadvertent perioperative hypothermia in adults. Online. Available at http://www.nice.org.uk/nicemedia/pdf/CG65NICEGuidance.pdf, 2008.
NHS. Infusions and sampling from arterial lines. Online. Available at http://www.nrls.npsa.nhs.uk/resources/?entryid45=59891&p=10, 2008.
Shoemaker W.C., Velmahos G.C., Demetriades D. Procedures and monitoring for the critically ill. Philadelphia: WB Saunders; 2002.
In the following lists, which of the statements (a) to (e) are true?
a) The electrical resistance of a thermistor changes non-linearly with temperature.
b) Thermocouples are used in measuring cardiac output using the thermodilution method.
c) The Seebeck effect is used to measure the temperature with thermocouples.
d) Thermometers can be used to measure core and peripheral temperatures at the same time.
e) A galvanometer is used to measure the potential in a thermocouple.
2. Concerning direct arterial blood pressure measurement:
a) A 16-G radial artery cannula is suitable.
b) The position of the dicrotic notch in the waveform can reflect the vascular tone.
c) The monitoring system should be capable of responding to a frequency range of up to 40 Hz.
d) Increased damping of the waveform causes an increase in systolic pressure and a decrease in diastolic pressure.
3. Balloon-tipped flow-guided pulmonary artery catheter:
a) They can have up to five separate lumens.
b) They measure the cardiac output using the Doppler technique.
c) The balloon should be left wedged and inflated in order to get a continuous reading of the left ventricular filling pressure.
d) Mixed venous blood oxygen saturation can be measured.
e) They use a thermocouple at the tip to measure the temperature of the blood.
4. If the mean arterial blood pressure is 100 mmHg, pulmonary capillary wedge pressure is 10 mmHg, mean pulmonary artery pressure is 15 mmHg, cardiac output is 5 L/min and CVP is 5 mmHg, which of the following statements are correct?
a) The unit for vascular resistance is dyne s−1 cm5.
b) The pulmonary vascular resistance is about 800.
c) The peripheral vascular resistance is about 1500.
5. Concerning central venous pressure and cannulation:
a) 10 mmHg is equivalent to 7.5 cm H2O.
b) During cannulation, the left internal jugular vein is the approach of choice since the heart lies mainly in the left side of the chest.
c) Subclavian vein cannulation has a higher incidence of pneumothorax than the internal jugular vein.
d) The ‘J’-shaped end of the guidewire is inserted first.
e) The Dacron cuff used in a Hickman’s line is to anchor the catheter only.
6. In an invasive pressure measurement system, which of the following is/are correct:
a) A clot causes high systolic and low diastolic pressures.
b) A transducer diaphragm with very low compliance causes low systolic and high diastolic pressures.
c) A soft wide lumen catheter causes low systolic and high diastolic pressures.
d) An air bubble causes low systolic and diastolic pressures.
7. Concerning the oesophageal Doppler:
a) The ideal probe location is at the level between the fifth and sixth thoracic vertebrae.
b) It emits a pulsed ultrasound wave of 4 Hz.
c) Red cells moving towards the ultrasound source reflect the sound back at a frequency lower than that at which it was sent, producing a positive Doppler shift.
d) The oesophageal probe tip is located at a depth of about 40 cm.
e) The angle between the ultrasound beam and blood flow is 75°.
a) True. The response is non-linear but can be made linear electronically.
b) False. Thermistors are used in measuring the cardiac output by thermodilution. Thermocouples are not used in measuring the cardiac output by thermodilution.
c) True. The Seebeck effect is when the electrical potential produced at the junction of two dissimilar metals is dependent on the temperature of the junction. This is the principle used in thermocouples.
d) True. The gradient between the core and peripheral temperatures is useful in assessing the degree of skin perfusion and the circulatory volume. For example, hypovolaemia causes a decrease in skin perfusion which reduces the peripheral temperature and thus increases the gradient. The normal gradient is about 2–4°C.
e) True. The galvanometer is placed between the junctions of the thermocouple, the reference and the measuring junctions. This allows the current to be measured. Changes in current are calibrated to measure the temperature difference between the two junctions.
2. Concerning direct arterial blood pressure measurement:
a) False. A 16-G cannula is far too big to be inserted into an artery. 20-G or 22-G cannulae are usually used allowing adequate blood flow to pass by the cannula distally.
b) True. The position of the dicrotic notch (which represents the closure of the aortic valve) is on the downstroke curve. A high dicrotic notch can be seen in vasoconstricted patients with high peripheral vascular resistance. A low dicrotic notch can be seen in vasodilated patients (e.g. patients with epidurals or sepsis).
c) True. The addition of the shape of the dicrotic notch to an already simple waveform makes a maximum frequency of 40 Hz adequate for such a monitoring system. Because of the complicated waveform of the ECG, the monitoring system requires a much wider range of frequencies (maximum of 100 Hz).
d) False. Increased damping leads to a decrease in systolic pressure and an increase in diastolic pressure. Decreased damping causes the opposite. The mean pressure remains the same.
e) True. This is due to the difference in the compressibility of the two media, air and saline. Air is more compressible in contrast to the saline column.
3. Balloon-tipped flow-guided pulmonary artery catheter:
a) True. The most distal lumen is in the pulmonary artery. There are one or two proximal lumens in the right atrium: one lumen carries the insulated wires leading to the thermistor proximal to the tip of the catheter and another lumen is used to inflate the balloon at the tip of the catheter.
b) False. The cardiac output is measured by thermodilution. A ‘cold’ injectate (e.g. saline) is injected via the proximal lumen. The changes in blood temperature are measured by the thermistor in the pulmonary artery. A temperature–time curve is displayed from which the cardiac output can be calculated.
c) False. Leaving the balloon wedged and inflated is dangerous and should not be done. This is due to the risk of ischaemia to the distal parts of the lungs supplied by the pulmonary artery or its branches.
d) True. Using fibreoptics, the mixed venous oxygen saturation can be measured on some designs. This allows the calculation of oxygen extraction by the tissues.
e) False. A thermistor is used to measure the temperature of the blood. Thermistors are made to very small sizes.
4. If the mean arterial blood pressure is 100 mmHg, pulmonary capillary wedge pressure is 10 mmHg, mean pulmonary artery pressure is 15 mmHg, cardiac output is 5 L/min and CVP is 5 mmHg, which of the following statements are correct?
a) False. The unit for vascular resistance is dyne s cm−5.
b) False. The pulmonary vascular resistance = mean pulmonary artery pressure − left atrial pressure × 80/cardiac output (15 − 10 × 80/5 = 80 dyne s cm−5).
c) True. The peripheral vascular resistance = mean arterial pressure − right atrial pressure × 80/cardiac output (100 − 5 × 80/5 = 1520 dyne s cm−5.
d) False. The normal mean pulmonary artery pressure is about 15 mmHg (systolic pressure of about 25 and a diastolic pressure of about 10 mmHg) and pulmonary vascular resistance is 80–120 dyne s cm−5.
e) True. The normal peripheral vascular resistance is 1000–1500 dyne s cm−5.
5. Concerning central venous pressure and cannulation:
a) False. 10 cm H2O is equivalent to 7.5 mmHg or 1 kPa.
b) False. The right internal jugular is usually preferred first as the internal jugular, the brachiocephalic veins and the superior vena cava are nearly in a straight line.
c) True. The higher incidence of pneumothorax with the subclavian approach makes the internal jugular the preferred vein.
d) True. The ‘J’-shaped end of the guidewire is inserted first because it is atraumatic and soft.
e) False. In addition to anchoring the catheter, the cuff also reduces the risk of infection by stopping the spread of infection from the site of skin entry. Some catheters have a silver impregnated cuff that acts as an anti-microbial barrier.
6. In an invasive pressure measurement system, which of the following is/are correct:
a) False. A clot will cause damping of the system as pressure changes are not accurately transmitted. The systolic pressure is decreased and the diastolic pressure is increased.
b) False. A too rigid diaphragm will cause the system to resonate. This leads to high systolic and low diastolic pressures.
c) True. A soft wide lumen catheter will increase the damping of the system (see a) above).
d) False. An air bubble will increase the damping of the system (see a) above).
e) True. A catheter that is short and narrow allows transmission of pressure changes accurately. For clinical use, a maximum length of 2 m is acceptable.
7. Concerning the oesophageal Doppler:
a) True. The ideal probe tip location is at the level between the fifth and sixth thoracic vertebrae. At that level, the descending aorta is adjacent and parallel to the distal oesophagus. This location is achieved by superficially landmarking the distance to the third sternocostal junction anteriorly.
b) False. The frequency used is 4 MHz.
c) False. Red cells moving towards the ultrasound source reflect the sound back at a frequency higher than that at which they were sent, producing a positive Doppler shift. The opposite produces a negative Doppler shift.
d) True. The tip of the probe is positioned in the distal oesophagus at about 40 cm depth.
e) False. The angle between the ultrasound beam and blood flow is 45°.