[level-membership-for-pulmolory-and-respiratory-category]
Interpreting the Electrocardiogram


Electrocardiography is an important tool used by health care practitioners. In some settings, the electrocardiogram (ECG) is obtained by the respiratory therapist (RT), which places the RT at the bedside in a prime position to recognize and respond to life-threatening arrhythmias. For this reason, RTs must be familiar with the electrocardiographic results and must be able to interpret them accurately. This chapter emphasizes the basics of cardiac physiology, lead placement, ECG interpretation, and the identification and key points in the treatment of dysrhythmias. More details of the cardiopulmonary anatomy and emergency cardiovascular life support are presented in Chapters 9 and 34.
The ECG is a popular evaluation tool because it is inexpensive, noninvasive, and easy to obtain. It is used primarily to evaluate a patient with an acute clinical condition suggestive of myocardial disease. A physician would order an ECG for most adult patients complaining of certain types of chest pain, shortness of breath, dyspnea with palpitations, weakness, lethargy, or syncope. These are classic clinical symptoms associated with heart disease for which the ECG is used. In addition, the ECG is routinely used by physicians for evaluating the general health status of middle-aged or older patients before major surgery or for periodic health screening. A resting ECG has little or no value as a predictor of future heart problems, however. It is useful only for detecting abnormalities that are occurring or have already occurred, such as a myocardial infarction (MI). In addition, certain abnormalities, such as valvular defects, cannot be identified directly by an ECG.1
Basic Principles of Electrophysiology
Understanding the ECG requires a basic knowledge of physiology related to the contraction and relaxation of the heart muscle. The muscle cells of the heart normally are stimulated and paced by the electrical activity of the cardiac impulse-conducting system. The impulse-conducting system cells have the ability to stimulate the heart without the influence of the nervous system. However, the autonomic nervous system normally plays a major role in controlling heart function (see subsequent discussion).1
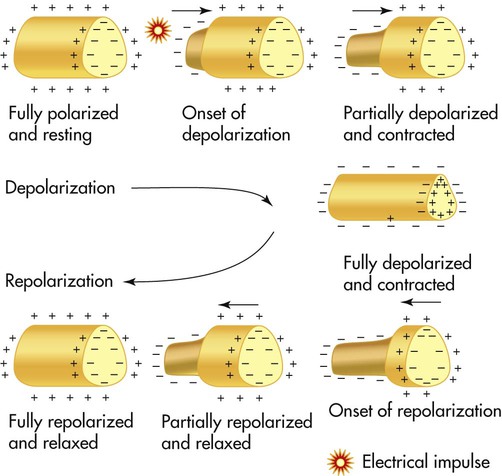
Cardiac muscle cells normally generate an electrical imbalance across the cell membrane with a positive charge on the outside and a negative charge on the inside. This is the resting or polarized state in which there is no electrical activity. Stimulation of the “polarized” cells causes an influx of sodium into the interior portion of the cell; this is called depolarization (Figure 17-1). Depolarization causes the cardiac muscle cells to contract momentarily, which is seen as a shortening of the muscle. Depolarization is immediately followed by repolarization, which is a rapid return of the cell to the “polarized” position in which the electrical imbalance across the membrane is reestablished.
The impulse-conducting system has three types of cardiac cells capable of electrical excitation: pacemaker cells (e.g., sinoatrial [SA] node, atrioventricular [AV] node), specialized rapidly conducting tissue (e.g., Purkinje fibers), and atrial and ventricular muscle cells. The ability of these cells to depolarize without stimulations is known as automaticity. Each of these cardiac cell groups varies in their degree of automaticity.1–3
Impulse-Conducting System
The impulse-conducting system is responsible for initiating the heartbeat and controlling the heart rate. It also coordinates the contraction of the heart chambers, which is essential to move blood effectively. A defect in the impulse-conducting system may lead to inadequate cardiac output and decreased tissue perfusion. Normally, the SA node, which is located in the upper portion of the right atrium, has the greatest degree of automaticity and paces the heart (Figure 17-2). Any heartbeat originating outside the SA node is considered an ectopic beat.2 The SA node is innervated by the autonomic nervous system, which allows the sympathetic and parasympathetic nervous systems to influence heart rate. Stimulation of the sympathetic nervous system increases the heart rate, whereas activation of the parasympathetic nervous system slows the heart rate by influencing the degree of automaticity within the SA node.
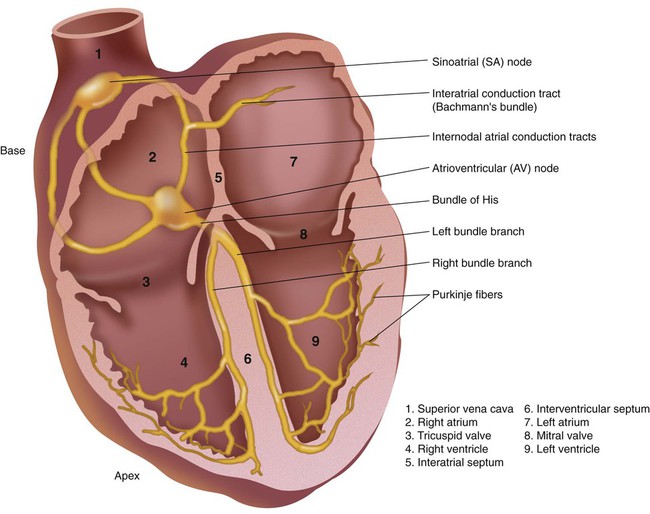
The electrical impulse generated by the SA node travels rapidly across the right atrium, through intraatrial pathways, to the left atrium by way of Bachmann bundle; this causes a wave of depolarization to occur over the atria, producing atrial contraction. Next, the impulse moves to the AV node, located in the intraventricular septum in the inferior aspect of the right atrium (see Figure 17-2). The AV node is the “backup” pacemaker because it has the second greatest degree of automaticity in the healthy heart. In most cases, if the SA node fails to function properly, the AV node paces ventricular activity at a lower heart rate of 40 to 60 beats/min, which is generally sufficient to maintain adequate cardiac output.2
The electrical impulse is temporarily delayed at the AV node to allow the ventricles time to fill with blood. That brief delay also limits the rate of the ventricular stimulation during excessively fast atrial rhythms that, if passed to the ventricles, would lead to inadequate cardiac output.3,4
The impulse exits the AV node, enters the bundle of His, and rapidly moves to the bundle branches. The bundle branches carry the impulse rapidly into the right and left ventricles. The bundle branches terminate in the Purkinje fibers, which are small, finger-like projections that penetrate the myocardium (see Figure 17-2). These fibers stimulate contraction of the myocardium from the apex of the heart upward toward the base of the heart, causing a coordinated contraction of the ventricles, which normally is effective in moving blood. The impulse travels the most rapidly in the Purkinje fibers, which is essential if contraction of the ventricles is to occur in a coordinated fashion. Immediately after depolarization of the ventricles, repolarization occurs in preparation for the next impulse.3,4
Electrocardiogram Procedural Summary
The 12 leads can be subdivided into two groups: 6 extremity (limb) leads and 6 chest (precordial) leads. To obtain the six limb leads, four electrodes are placed on the extremities, one on each wrist and one on each ankle. These leads are bipolar, which permits the measurement of electrical activity in two different directions. Additionally, the ECG unit can vary the orientation of these four electrodes to create six different views. Any electrical activity of the heart that is directed up, down, left, or right is recorded by the limb leads. The limb leads are called leads I, II, III, aVR, aVL, and aVF (Table 17-1).
TABLE 17-1
The 12 Leads of an ECG and the Myocardial Wall That Each Set Views
| Facing Lead* | View |
| I, aVL, V5, V6 | Lateral |
| II, III, aVF | Inferior |
| V1, V2 | Septal |
| V3, V4 | Anterior |
| Cells and Function | |
| Pacemaker cells | Specialized cells that have a high degree of automaticity and provide electrical power for the heart |
| Conducting cells | Cells that conduct the electrical impulse throughout the heart |
| Myocardial cells | Cells that contract in response to electrical stimuli and pump blood |
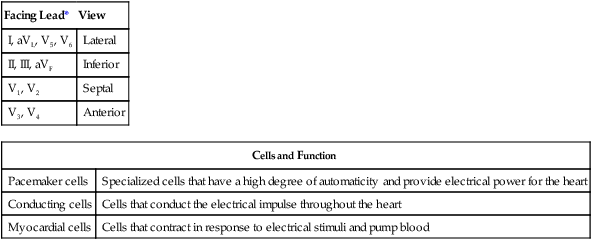
*Excludes aVR, which faces the interior, endocardial surface of the ventricles.
From Wilkins RL, Dexter JR, Heuer AJ: Clinical assessment in respiratory care, ed 6, St Louis, 2010, Mosby.
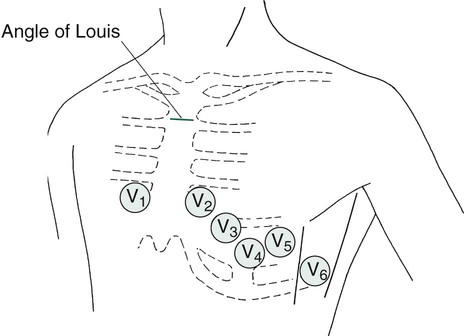
The six chest or precordial leads are called leads V1, V2, V3, V4, V5, and V6. These leads are unipolar, which means that they measure electrical activity in only one direction. These leads are placed in a horizontal plane across the chest, starting with V1 in the fourth intercostal space to the right of the sternum. The rest of the chest leads are on the left side, starting with V2, which is placed in the fourth intercostal space just to the left of the sternum, and ending with V6, which is placed at the fifth intercostal space at the left midaxillary line (V6). Figure 17-3 illustrates proper placement of ECG leads. The view from each chest lead provides its own angle of orientation to measure cardiac electrical activity moving anteriorly or posteriorly.2,4
Basic Electrocardiographic Waves
The wave of depolarization occurring in the atria is seen as the P wave on the ECG (Figure 17-4). The normal P wave is no more than 2.5 mm high or 3 mm long. Atrial hypertrophy may cause the P wave to enlarge to a height and length beyond the normal parameters. Atrial repolarization is not seen on the electrocardiographic tracing because it is obscured by the electrical activity occurring in the ventricles at the same time.
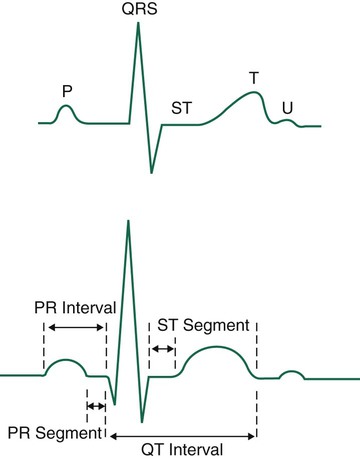
The QRS complex usually consists of several distinct waves, each of which has a letter assigned to it as a label. If the first wave of the complex is negative (downward), it is labeled the Q wave. The initial positive (upward) deflection is electrocardiographically referred to as the R wave, and the next negative deflection after the R wave is labeled the S wave. Not all QRS complexes have all three components present, but the waves making up ventricular depolarization are electrocardiographically referred to as the QRS complex, regardless of its exact makeup. The wave of repolarization occurring in the ventricles immediately after depolarization is the T wave (see Figure 17-4).
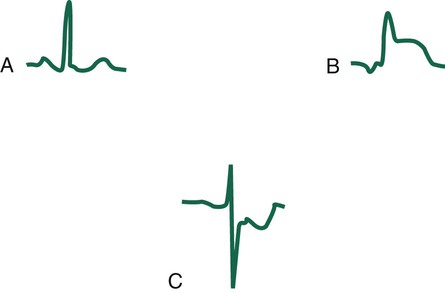
The next important part of the ECG to evaluate is the ST segment, which represents the time from the end of ventricular depolarization to the start of ventricular repolarization. The normal ST segment is isoelectric, which is seen as a flat line that is not above or below the neutral baseline. Certain pathologic abnormalities in the myocardium cause the ST segment configuration to become abnormal; this is seen as an elevated or depressed ST segment and is common in cardiac ischemia and MI (Figure 17-5). Because this configuration represents a potentially life-threatening arrhythmia, abnormal ST segments must be identified as soon as possible.3–5
 Rule of Thumb
Electrocardiographic Paper and Measurements
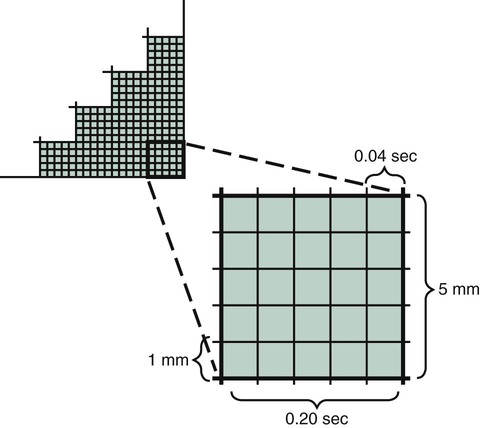
Electrocardiographic paper is made up of gridlike boxes that define time on the horizontal axis and voltage on the vertical axis. Dark lines circumscribe larger boxes that are 5 mm × 5 mm, and lighter lines define smaller boxes that are 1 mm × 1 mm (Figure 17-6). Because the paper passes through the electrocardiograph at a set speed of 25 mm/sec, each large box represents 0.20 second, and each small box represents 0.04 second on the horizontal axis. The standard ECG is calibrated so that 1 mV causes an upward deflection of 10 small boxes or 2 large boxes on the vertical axis; this allows measurement of the exact voltage occurring during depolarization of the cardiac muscle fibers.1,4,6
Interpreting the Electrocardiogram
 Problem
 matching in the lung are probably causing acute hypoxemia and inadequate tissue oxygenation. T wave inversion and ST segment elevation are serious signs indicating that the patient is not tolerating the weaning. She should be put back on the ventilator at an elevated FiO2 and monitored closely. Weaning should not be attempted again until the patient’s clinical condition improves significantly. The attending physician should be notified.
Steps to Follow
Step 7
Identify the mean QRS axis. The limb lead exhibiting the largest amount of voltage is identified. If the lead shows a positive QRS complex, the axis is very close to the position on the hexaxial reference circle where that limb lead is labeled. If the QRS complex with the most voltage is negative, the mean axis is moving in the opposite direction from where that lead is labeled on the hexaxial reference circle.1–3
Axis Evaluation
A less understood area of ECG interpretation for RTs is the axis evaluation and the identification of related deviations from normal. Axis evaluation is used to determine the general direction of current flow during ventricular depolarization; this is helpful to know when hypertrophy of one of the ventricles is suspected, which would cause the direction of current flow to deviate from normal. Normally, the mean QRS axis (vector) points leftward (patient’s left) and downward, between 0 and +90 degrees in the frontal plane (Figure 17-7). The normal position of the QRS axis results from the slight tilt of the heart to the left and from the large muscle mass of the left ventricle compared with the right ventricle.
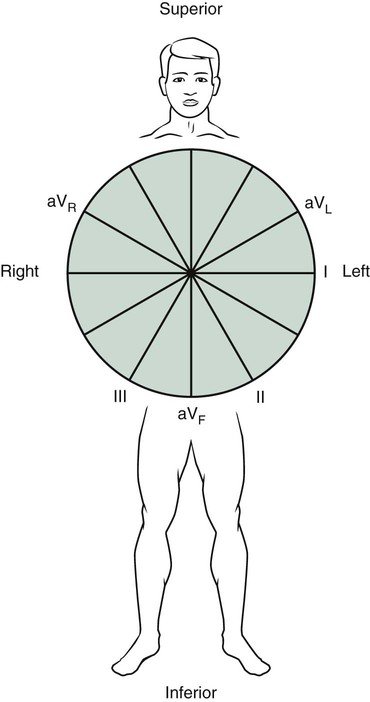
The clinician identifies the mean QRS axis by using the hexaxial reference circle (see Figure 17-7) with the position of each limb lead labeled on the circle. Next, the clinician identifies the limb lead with the most voltage (either positive or negative) from the ECG being evaluated. If the lead with the most voltage is positive (upright), the clinician locates the position of that lead on the hexaxial reference circle. The mean axis must be very close to that position on the circle. If the lead with the most voltage is negative (downward), the mean axis points in the opposite direction from that lead. If the lead with the most voltage is lead II and it is positive, the mean QRS axis must be approximately +60 degrees because this is where lead II is located on the hexaxial reference circle (see Figure 17-7). This is considered a normal axis because it falls between 0 and +90 degrees.5,6
 Problem
Recognizing Arrhythmias
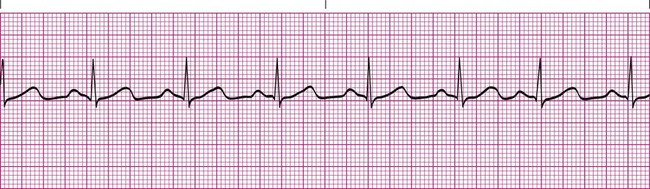
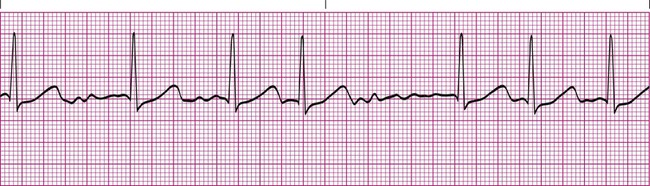
Normal Sinus Rhythm
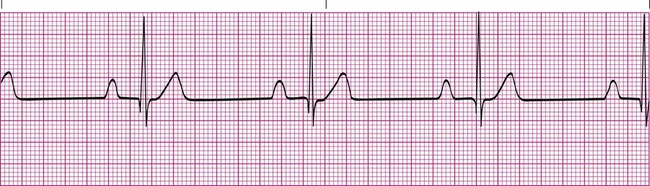
Recognizing abnormal rhythms from an electrocardiographic strip is easier if you have an appreciation for the normal tracing. The normal sinus rhythm begins with an upright P wave that is identical from one complex to the next. The PR interval is consistent throughout the rhythm strip and is 0.12 to 0.20 second. The QRS complexes are identical and no longer than 0.12 second. The ST segment is flat. The R-R interval is regular and does not vary more than 0.12 second between QRS complexes. The heart rate is between 60 beats/min and 100 beats/min (Figure 17-8).2,3
Sinus Tachycardia
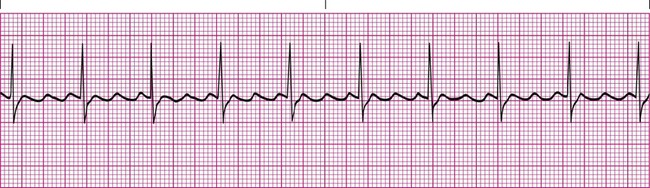
Heart rates exceeding 100 beats/min are abnormal in resting adult patients and are electrocardiographically referred to as sinus tachycardia when a P wave is appropriately present before each QRS complex (Figure 17-9). Other than the rate exceeding 100 beats/min, sinus tachycardia does not differ from a normal sinus rhythm. This abnormality is common and can be caused by numerous problems. Most often, sinus tachycardia is caused by anxiety, pain, fever, hypovolemia, or hypoxemia. It may also be a side effect of certain medications, such as bronchodilators. Treatment typically involves eliminating the underlying cause.5,6
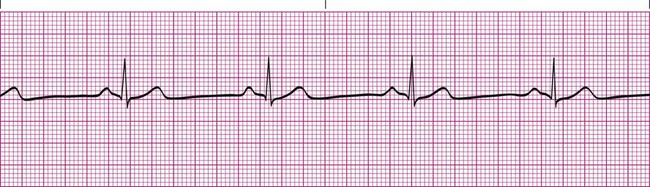
Sinus Bradycardia
A heart rate of less than 60 beats/min that is otherwise normal is electrocardiographically referred to as sinus bradycardia. Other than the rate being too slow, sinus bradycardia does not differ from a normal sinus rhythm (Figure 17-10). This abnormal rhythm is not as common as sinus tachycardia, but it represents a significant clinical problem if it causes the patient’s blood pressure to decrease significantly or impairs tissue perfusion causing symptoms such as fatigue, lightheadedness, or syncope. It is most often caused by hypothermia or abnormalities in the SA node and in some cases may simply be the result of intense athletic conditioning. Numerous medications, such as atropine, are available to stimulate the heart rate when clinical bradycardiac symptoms occur.5,6
Sinus Arrhythmia
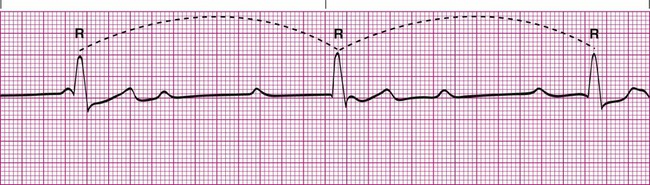
Sinus arrhythmia is a common arrhythmia and is recognized by the irregular spacing between QRS complexes. The spacing is measured by identifying the intervals between the R waves of successive QRS complexes, which are normally consistent. When the R-R interval varies more than 0.12 second throughout the rhythm strip, sinus arrhythmia is present (Figure 17-11). This arrhythmia may occur with the effects of breathing on the heart or as a side effect of medications such as digoxin. Most cases of sinus arrhythmia are benign and do not need treatment. If the arrhythmia is severe, the underlying cause must be identified and eliminated.5,6
First-Degree Heart Block
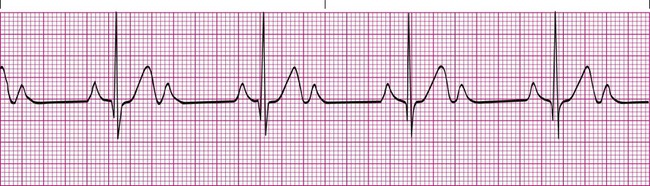
In first-degree heart block, the PR interval is longer than 0.20 second. In addition, there is one P wave before each QRS complex (Figure 17-12). This tracing indicates that the impulse from the SA node is getting through to the ventricles but is abnormally delayed in passing through the AV node or bundle of His. Typically, the QRS complex has a normal configuration, and the R-R intervals are regular. First-degree heart block is common after an MI that damages the AV node, or it may be a complication of certain medications, such as digoxin or beta blockers. Treatment usually is not needed for first-degree heart block if the patient is able to maintain an adequate blood pressure.6,7
Second-Degree Heart Block
Second-degree heart block type II (Mobitz type II) is less common and is more often the result of serious problems such as MI or ischemia. Type II heart block is seen as a series of nonconducted P waves followed by a P wave that is conducted to the ventricles (Figure 17-13). Sometimes the ratio of nonconducted to conducted P waves is fixed at 3 : 1 or 4 : 1. The PR interval for the conducted impulses is consistent.6,7
Treatment for type I second-degree heart block is not needed because it usually does not impair cardiac output or cause symptoms. Type II second-degree heart block requires treatment in most cases because the resulting reduction in ventricular rate causes a decrease in blood pressure. Medications such as atropine provide a better cardiac output until a pacemaker can be inserted. Because type II block may progress to third-degree heart block without warning, a pacemaker is indicated even if the patient is asymptomatic.8,9
Third-Degree Heart Block
Third-degree heart block is the most serious of the different types of heart block. It indicates that the conduction system between the atria and ventricles is completely blocked, and impulses generated in the SA node are not conducted to the ventricles. The atria and ventricles are paced by independent sources. Most commonly, the atria are paced by the SA node, and the ventricles are paced by the AV node. This arrhythmia can be recognized when it is established that there is no relationship between the P waves and the QRS complexes. The P-P intervals are regular, and the R-R intervals are regular, but they have no correlation with one another. In addition, the QRS complexes are normal in configuration if the ventricles are paced by the AV node (Figure 17-14). If the ventricles are paced by an ectopic site in the myocardium, the QRS complexes may be abnormally wide. Typically, the ventricular rate is slower than the atrial rate because the automaticity of the AV node or other latent points is much slower than the automaticity of the SA node.6,7
Third-degree heart block is a serious arrhythmia because it often is caused by MI or drug toxicity (especially digitalis), and it may render the heart unable to meet the normal metabolic demands of the body. In almost all cases, treatment usually includes medication to speed up the ventricles and a temporary external pacemaker until a permanent pacemaker can be surgically placed.8,9
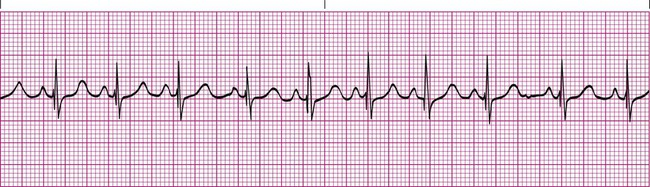
Atrial Flutter
Atrial flutter is the rapid depolarization of the atria resulting from an ectopic focus that depolarizes at a rate of 250 to 350 times per minute. Typically, only one ectopic focus is causing the arrhythmia, which results in each P wave appearing similar. The result is a characteristic saw-toothed baseline pattern (Figure 17-15). Numerous P waves are present for every QRS complex, and the QRS complexes are normal in configuration. The R-R interval may be regular or it may vary, depending on the ability of the atrial impulse to pass through the AV node.1,3,4
Various conditions can produce atrial flutter, including rheumatic heart disease, coronary heart disease, stress, renal failure, and hypoxemia. This arrhythmia is not considered life-threatening, but it may lead to atrial fibrillation if untreated. Treatment usually includes medications such as digoxin, beta blockers, or calcium channel blockers. Once the rate is significantly slowed, cardioversion is attempted to return the heart rhythm back to a normal sinus rhythm.8,9
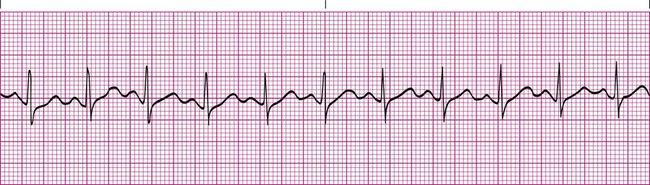
Atrial Fibrillation
Atrial fibrillation is present when the atrial muscle quivers in an irregular pattern that does not result in a coordinated contraction. The baseline electrical activity appears erratic, and no true P waves are seen in atrial fibrillation (Figure 17-16). The AV node determines the ventricular response to the atrial activity by controlling which impulses pass through and which do not. The ventricular rate is often very irregular and results in an abnormal R-R interval.1,3,4
The causes of atrial fibrillation are similar to the causes of atrial flutter. However, atrial fibrillation is a more serious arrhythmia because it can lead to a significant reduction in cardiac output resulting from the loss of the atrial kick that helps fill the ventricles before systole. It also can lead to formation of thrombi in the atria caused by the stagnation of blood. Emboli may occur if the thrombi break free and enter the pulmonary artery or aorta. Treatment for atrial fibrillation is similar to the treatment for atrial flutter. However, if the length of time the patient has been in atrial fibrillation cannot be determined, the patient may be put on anticoagulants or antithrombolytic medications for a period concurrently with medications to slow the heart rate before cardioversion is attempted. This treatment decreases the chance of accidentally releasing a thrombus that may have formed in the atria, which could potentially cause a life-threatening embolic event.8,9
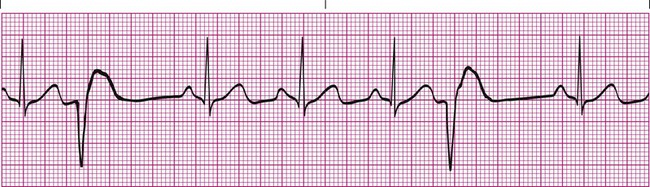
Premature Ventricular Contractions
Premature beats can occur when a portion of the impulse-conducting system or myocardium other than the SA node becomes diseased and triggers depolarization of the surrounding cardiac cells. Sources for the impulse outside the SA node are called ectopic foci. Ectopic foci occur when hypoxia, acid-base imbalances, or electrolyte abnormalities are present and cause the cardiac cells to become abnormally excited. Premature ventricular contractions (PVCs) are an example of ectopic foci that originate in the ventricles. PVCs are easy to recognize because they cause a unique and bizarre QRS complex that is much wider than normal (Figure 17-17). The QRS complex of a PVC is wider than normal because the ectopic focus is using channels outside the normal conduction system to move the impulse throughout the myocardium. PVCs have no P wave preceding them and may occur as a singular event or, more commonly, as a temporary run of PVCs. They also may occur at every other beat (bigeminy) or every third beat (trigeminy).1,3,4
An occasional PVC is not of major concern and may occur as a result of stress, caffeine intake, nicotine use, or electrolyte imbalance. However, frequent PVCs are more serious and most often occur in response to ischemia of the myocardium. They also are commonly seen as a side effect of some medications. Treatment is based on the frequency and cause of the PVCs and is needed when the PVCs are frequent (more than six per minute), paired together, or multifocal (appear differently because they come from more than one ectopic focus) or when they land directly on the T wave (R on T phenomenon). In such cases, treatment must be prompt because the problem may progress rapidly to ventricular tachycardia (VT) and ventricular fibrillation (VF) (see subsequent discussion). A complete cardiac evaluation is usually needed to identify the appropriate plan of action. Antiarrhythmic medications (e.g., lidocaine) may offer a temporary solution until the underlying cause can be identified and treated.8,9
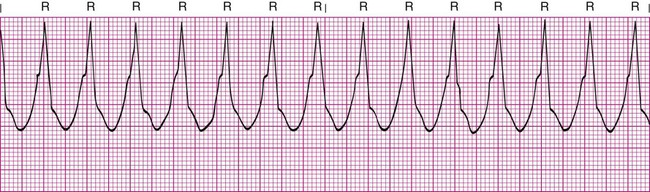
Ventricular Tachycardia
VT is a run of three or more PVCs. It usually is easy to recognize as a series of wide, bizarre QRS complexes that have no preceding P wave. The ventricular rate is usually 100 to 250 beats/min (Figure 17-18). It is considered sustained VT if it lasts longer than 30 seconds.
Sustained or symptomatic VT is a serious arrhythmia because it indicates that an ectopic focus is rapidly firing from the ventricles, which results from increased automaticity. It suggests a significant pathologic defect in the myocardium and often leads to VF if untreated. MI, coronary artery disease, and hypertensive heart disease are the most common causes.1,3,4
Treatment must be prompt and specific and usually consists of cardioversion followed by long-term antiarrhythmic drugs for long-term suppression. Patients at high risk for recurrent VT may have an internal cardioverter-defibrillator (ICD) placed so that if VT occurs it can be treated automatically and promptly. Asymptomatic patients with recurrent nonsustained VT and ventricular ectopic beats may be treated with beta blockers to reduce symptoms of non–life-threatening ventricular arrhythmias. Symptomatic or sustained VT is considered a medical emergency, and the patient must be treated and monitored continuously in the intensive care unit until his or her condition is stabilized.8–12
 Rule of Thumb
Ventricular Fibrillation
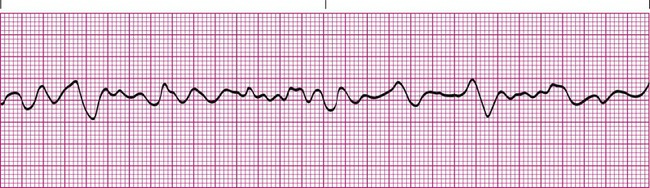
VF is the most life-threatening arrhythmia and is defined as erratic quivering of the ventricular muscle mass. It causes the cardiac output to drop to zero; the patient becomes unconscious and represents a true medical emergency. The electrocardiographic tracing of VF shows grossly irregular fluctuations with a zigzag pattern (Figure 17-19). This pattern is caused by the same problems associated with VT.
Treatment calls for rapid defibrillation, cardiopulmonary resuscitation, and administration of oxygen and antiarrhythmic medications; treatment of the underlying cause of the ischemia is also warranted. Survivors of VF usually receive an internal cardioverter-defibrillator.8–12
Pulseless Electrical Activity
Treatment involves emergency life support and the immediate reversal of the cause. PEA also illustrates why RTs and other clinicians should never “treat the monitor” and underscores the importance of using ECGs as just one of several clinical indicators in assessing patients.10–12 The prompt recognition and response to VT, VF, and PEA are discussed in detail in Chapter 34, which covers the broader topic of emergency cardiovascular life support.
 Problem
[/level-membership-for-pulmolory-and-respiratory-category][not-level-membership-for-pulmolory-and-respiratory-category]
Interpreting the Electrocardiogram
Electrocardiography is an important tool used by health care practitioners. In some settings, the electrocardiogram (ECG) is obtained by the respiratory therapist (RT), which places the RT at the bedside in a prime position to recognize and respond to life-threatening arrhythmias. For this reason, RTs must be familiar with the electrocardiographic results and must be able to interpret them accurately. This chapter emphasizes the basics of cardiac physiology, lead placement, ECG interpretation, and the identification and key points in the treatment of dysrhythmias. More details of the cardiopulmonary anatomy and emergency cardiovascular life support are presented in Chapters 9 and 34.
The ECG is a popular evaluation tool because it is inexpensive, noninvasive, and easy to obtain. It is used primarily to evaluate a patient with an acute clinical condition suggestive of myocardial disease. A physician would order an ECG for most adult patients complaining of certain types of chest pain, shortness of breath, dyspnea with palpitations, weakness, lethargy, or syncope. These are classic clinical symptoms associated with heart disease for which the ECG is used. In addition, the ECG is routinely used by physicians for evaluating the general health status of middle-aged or older patients before major surgery or for periodic health screening. A resting ECG has little or no value as a predictor of future heart problems, however. It is useful only for detecting abnormalities that are occurring or have already occurred, such as a myocardial infarction (MI). In addition, certain abnormalities, such as valvular defects, cannot be identified directly by an ECG.1
Basic Principles of Electrophysiology
Understanding the ECG requires a basic knowledge of physiology related to the contraction and relaxation of the heart muscle. The muscle cells of the heart normally are stimulated and paced by the electrical activity of the cardiac impulse-conducting system. The impulse-conducting system cells have the ability to stimulate the heart without the influence of the nervous system. However, the autonomic nervous system normally plays a major role in controlling heart function (see subsequent discussion).1
Cardiac muscle cells normally generate an electrical imbalance across the cell membrane with a positive charge on the outside and a negative charge on the inside. This is the resting or polarized state in which there is no electrical activity. Stimulation of the “polarized” cells causes an influx of sodium into the interior portion of the cell; this is called depolarization (Figure 17-1). Depolarization causes the cardiac muscle cells to contract momentarily, which is seen as a shortening of the muscle. Depolarization is immediately followed by repolarization, which is a rapid return of the cell to the “polarized” position in which the electrical imbalance across the membrane is reestablished.
The impulse-conducting system has three types of cardiac cells capable of electrical excitation: pacemaker cells (e.g., sinoatrial [SA] node, atrioventricular [AV] node), specialized rapidly conducting tissue (e.g., Purkinje fibers), and atrial and ventricular muscle cells. The ability of these cells to depolarize without stimulations is known as automaticity. Each of these cardiac cell groups varies in their degree of automaticity.1–3
Impulse-Conducting System
The impulse-conducting system is responsible for initiating the heartbeat and controlling the heart rate. It also coordinates the contraction of the heart chambers, which is essential to move blood effectively. A defect in the impulse-conducting system may lead to inadequate cardiac output and decreased tissue perfusion. Normally, the SA node, which is located in the upper portion of the right atrium, has the greatest degree of automaticity and paces the heart (Figure 17-2). Any heartbeat originating outside the SA node is considered an ectopic beat.2 The SA node is innervated by the autonomic nervous system, which allows the sympathetic and parasympathetic nervous systems to influence heart rate. Stimulation of the sympathetic nervous system increases the heart rate, whereas activation of the parasympathetic nervous system slows the heart rate by influencing the degree of automaticity within the SA node.
The electrical impulse generated by the SA node travels rapidly across the right atrium, through intraatrial pathways, to the left atrium by way of Bachmann bundle; this causes a wave of depolarization to occur over the atria, producing atrial contraction. Next, the impulse moves to the AV node, located in the intraventricular septum in the inferior aspect of the right atrium (see Figure 17-2). The AV node is the “backup” pacemaker because it has the second greatest degree of automaticity in the healthy heart. In most cases, if the SA node fails to function properly, the AV node paces ventricular activity at a lower heart rate of 40 to 60 beats/min, which is generally sufficient to maintain adequate cardiac output.2
The electrical impulse is temporarily delayed at the AV node to allow the ventricles time to fill with blood. That brief delay also limits the rate of the ventricular stimulation during excessively fast atrial rhythms that, if passed to the ventricles, would lead to inadequate cardiac output.3,4
The impulse exits the AV node, enters the bundle of His, and rapidly moves to the bundle branches. The bundle branches carry the impulse rapidly into the right and left ventricles. The bundle branches terminate in the Purkinje fibers, which are small, finger-like projections that penetrate the myocardium (see Figure 17-2). These fibers stimulate contraction of the myocardium from the apex of the heart upward toward the base of the heart, causing a coordinated contraction of the ventricles, which normally is effective in moving blood. The impulse travels the most rapidly in the Purkinje fibers, which is essential if contraction of the ventricles is to occur in a coordinated fashion. Immediately after depolarization of the ventricles, repolarization occurs in preparation for the next impulse.3,4
Electrocardiogram Procedural Summary
The 12 leads can be subdivided into two groups: 6 extremity (limb) leads and 6 chest (precordial) leads. To obtain the six limb leads, four electrodes are placed on the extremities, one on each wrist and one on each ankle. These leads are bipolar, which permits the measurement of electrical activity in two different directions. Additionally, the ECG unit can vary the orientation of these four electrodes to create six different views. Any electrical activity of the heart that is directed up, down, left, or right is recorded by the limb leads. The limb leads are called leads I, II, III, aVR, aVL, and aVF (Table 17-1).
TABLE 17-1
The 12 Leads of an ECG and the Myocardial Wall That Each Set Views
| Facing Lead* | View |
| I, aVL, V5, V6 | Lateral |
| II, III, aVF | Inferior |
| V1, V2 | Septal |
| V3, V4 | Anterior |
| Cells and Function | |
| Pacemaker cells | Specialized cells that have a high degree of automaticity and provide electrical power for the heart |
| Conducting cells | Cells that conduct the electrical impulse throughout the heart |
| Myocardial cells | Cells that contract in response to electrical stimuli and pump blood |
*Excludes aVR, which faces the interior, endocardial surface of the ventricles.
From Wilkins RL, Dexter JR, Heuer AJ: Clinical assessment in respiratory care, ed 6, St Louis, 2010, Mosby.
The six chest or precordial leads are called leads V1, V2, V3, V4, V5, and V6. These leads are unipolar, which means that they measure electrical activity in only one direction. These leads are placed in a horizontal plane across the chest, starting with V1 in the fourth intercostal space to the right of the sternum. The rest of the chest leads are on the left side, starting with V2, which is placed in the fourth intercostal space just to the left of the sternum, and ending with V6, which is placed at the fifth intercostal space at the left midaxillary line (V6). Figure 17-3 illustrates proper placement of ECG leads. The view from each chest lead provides its own angle of orientation to measure cardiac electrical activity moving anteriorly or posteriorly.2,4
Basic Electrocardiographic Waves
The wave of depolarization occurring in the atria is seen as the P wave on the ECG (Figure 17-4). The normal P wave is no more than 2.5 mm high or 3 mm long. Atrial hypertrophy may cause the P wave to enlarge to a height and length beyond the normal parameters. Atrial repolarization is not seen on the electrocardiographic tracing because it is obscured by the electrical activity occurring in the ventricles at the same time.
The QRS complex usually consists of several distinct waves, each of which has a letter assigned to it as a label. If the first wave of the complex is negative (downward), it is labeled the Q wave. The initial positive (upward) deflection is electrocardiographically referred to as the R wave, and the next negative deflection after the R wave is labeled the S wave. Not all QRS complexes have all three components present, but the waves making up ventricular depolarization are electrocardiographically referred to as the QRS complex, regardless of its exact makeup. The wave of repolarization occurring in the ventricles immediately after depolarization is the T wave (see Figure 17-4).
The next important part of the ECG to evaluate is the ST segment, which represents the time from the end of ventricular depolarization to the start of ventricular repolarization. The normal ST segment is isoelectric, which is seen as a flat line that is not above or below the neutral baseline. Certain pathologic abnormalities in the myocardium cause the ST segment configuration to become abnormal; this is seen as an elevated or depressed ST segment and is common in cardiac ischemia and MI (Figure 17-5). Because this configuration represents a potentially life-threatening arrhythmia, abnormal ST segments must be identified as soon as possible.3–5
