Interpretation of arterial blood gases

Published on 13/02/2015 by admin

Filed under Anesthesiology

Last modified 22/04/2025

Print this page

rate 1 star rate 2 star rate 3 star rate 4 star rate 5 star
Your rating: none, Average: 1 (1 votes)

This article have been viewed 1600 times

Interpretation of arterial blood gases

Bradly J. Narr, MD and Steven G. Peters, MD

The clinical utility of arterial blood gas (ABG) measurements includes assessment of oxygenation (arterial O2 tension [PaO2]), ventilation (arterial CO2 tension [PaCO2]), and acid-base status (pH). The bicarbonate (HCO3) value in an ABG measurement is calculated from the CO2 tension and pH, as opposed to the bicarbonate value on an electrolyte panel, which is actually measured. Modern blood gas machines also have a means to measure hemoglobin concentration and a co-oximeter to measure hemoglobin O2 saturation. These measurements allow quantitative assessment of the functions of the cardiorespiratory system. Recognition of abnormal measurements permits specific diagnostic and therapeutic interventions in the operating room, postanesthesia care unit, and intensive care unit. Specific clinical situations for which ABG analysis can guide patient care include management of hypoxia or hypercarbia, weaning from mechanical ventilation, use of permissive hypercapnia as a component of lung-protective ventilation strategies, and diagnosis and management of acid-base disorders.

Acid-base disturbances

Intracellular pH is tightly regulated; several buffering systems minimize the changes in pH that are associated with the addition of acid or base. In humans, the major extracellular buffer pair is bicarbonate/carbonic acid. The Henderson-Hasselbalch equation describes the effect of the dissociation of carbonic acid to hydrogen ion and bicarbonate:

< ?xml:namespace prefix = "mml" />pH =pK+logHCO3H2CO3

image

Using 6.1 as the pK for carbonic acid, and expressing the concentration of carbonic acid as dissolved CO2 (0.03 × PCO2), the pH determined by the Henderson-Hasselbalch equation becomes:

pH=6.1+log(HCO3)0.03×PaCO2

image

The physiologic response to an acid-base disturbance is threefold. Initially, the acid or base is buffered immediately in that body-fluid compartment. In plasma and interstitial fluid, bicarbonate is the major buffer, with proteins and phosphate compounds contributing to a lesser extent. In erythrocytes, hemoglobin is the major buffer, with bicarbonate contributing approximately 30% and phosphate 10% of the buffering capacity. Secondary and tertiary compensation for the underlying acid-base abnormality occurs via the lungs and kidneys. Elimination of CO2 by hyperventilation is the initial compensatory mechanism for metabolic acidemia. The kidneys eliminate organic acids and [H+] as ammonium ions and reabsorb bicarbonate from tubular fluids, with formation of titratable acid. Ultimately, however, to restore true homeostasis, the underlying pathophysiologic process must be corrected (e.g., administration of fluids and insulin for diabetic ketoacidosis or antibiotics for pneumonia in a patient with chronic obstructive lung disease).

Acid-base abnormalities are the result of pathophysiologic processes and are not unique disease entities. The differential diagnosis of any specific acid-base pattern begins with obtaining the patient’s history and performing a physical examination. Common conditions and disease states associated with acid-base disturbances include metabolic acidosis (septic or cardiogenic shock, renal failure, diabetic ketoacidosis), metabolic alkalosis (diuretics, nasogastric suction, vomiting), respiratory acidosis (narcosis, neuromuscular blockade or profound weakness of respiratory muscles, chronic obstructive pulmonary disease), and respiratory alkalosis (hyperventilation).

Ventilation

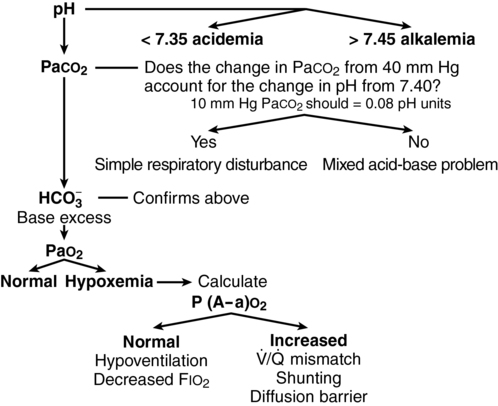
Normal PaCO2 values range between 36 and 44 mm Hg. Production of CO2 is relatively constant in most clinical settings, so the elimination of CO2 is proportional to alveolar ventilation. As diagrammed in Figure 23-1, a PaCO2 below 36 mm Hg implies hyperventilation and a PaCO2 above 44 mm Hg implies hypoventilation, unless these situations occur as respiratory compensation for metabolic acid-base abnormalities.

When interpreting PaCO2, the initial question that the clinician should answer is whether this change in PaCO2 (from 40 mm Hg) accounts for the change in pH from 7.40. This effect can be estimated by employing the “golden rule” of ABG interpretation: For every 10-mm Hg change in PaCO2, the pH will change 0.08 unit in the opposite direction.

If the change in pH can be accounted for by the change in PaCO2, then the abnormality causing the change in PaCO2 is a primary respiratory disturbance. If not, then a metabolic acid-base disturbance or, more commonly, a mixed metabolic-respiratory acid-base abnormality accounts for the change.

Oxygenation

The PaO2 depends on inspired O2 concentration, alveolar ventilation, mixed venous O2 saturation, and ventilation/perfusion matching (image/image). The lung is not a perfect gas-exchange unit, and, to the extent that ventilation and perfusion are not matched, a gradient between the alveolar and the arterial PO2 exists [P(A−a)o2]. Abnormalities in lung function increase this gradient and produce hypoxemia.

When interpreting the PaO2, the clinician’s first step is to determine if hypoxemia is present. In most patients, hypoxemia would be considered to be a PaO2 below 60 mm Hg because, below this level, the oxyhemoglobin dissociation curve is steep and the O2 content of the blood drops rapidly with small decreases in the PaO2. If hypoxemia is present, then knowing the [P(A−a)O2] helps the clinician determine the severity of the disturbance. The PaO2 is measured and the PAO2 is calculated as:

PAO2=FIO2(PBPH2O)PaCO2R

image

Simplified for clinical use, this equation reads as follows:

PAO2=(FIO2×713)(PaCO2×1.25)

image

where FIO2 is the fractional content of inspired O2; PB, the barometric pressure; PH2o, the vapor pressure of water in alveoli at 37° C (47 mm Hg); and R, the respiratory quotient (CO2 production/O2 consumption = 0.8). PaO2 and PaCO2 are determined from ABG analysis.

If the P(A−a)O2 gradient is normal, (i.e., ≤ 20), then the hypoxemia must be the result of hypoventilation or decreased FIO2 concentration. If the P(A−a)O2 gradient is increased, then the hypoxemia is the results of a image/image mismatch, shunting, or, rarely, a diffusion barrier (see Figure 23-1).

Finally, O2 saturation should be assessed relative to the PaO2 expected for a normal oxyhemoglobin dissociation curve. If the measured O2 saturation is less than expected for the PaO2, then other hemoglobin abnormalities (such as carboxyhemoglobin, methemoglobin, or sulfhemoglobin) must be present. Modern co-oximeters are designed to measure all of these values.

Case examples

Acute respiratory acidosis—buffering

A 38-year-old woman comes to the operating room for repair of perineal lacerations sustained during a recent vaginal delivery. A spinal anesthetic is placed, and 10 min later, the patient complains of respiratory difficulty and arm weakness. An ABG analysis obtained with the patient receiving supplemental O2 via nasal cannula reveals the following: PaO2, 98 mm Hg; PaCO2, 70 mm Hg; pH, 7.16; and HCO3, 26 mmol/L.

Interpretation algorithm

The pH is in the acidemic range. The PaCO2 varies from normal PaCO2 (40 mm Hg) by 30. An estimate of the respiratory component to acidosis can be calculated as the variance from normal PaCO2 (i.e., 30) divided by 10 and then multiplied by 0.08 pH units (remember the golden rule). The result of this calculation is a pH that is 0.24 below normal. The measured pH of 7.16 corresponds exactly with this calculation, indicating a simple acute respiratory acidosis. The interpretation of this ABG is acute respiratory acidosis due to impaired ventilation, most likely the result of a high spinal anesthetic. The process is so acute that no compensation by retention of bicarbonate could occur and only buffering has taken place. The P(A−a)O2 gradient is calculated by estimating the FIO2 to be 27% with an O2 flow of 2 L/min. The PAO2 equals (0.27 × 713) minus 70/0.8, or 193 – 88, or 105 mm Hg, which calculates to a P(a−a)o2 gradient of 7 mm Hg. The measured PaO2 of 98 mm Hg implies normal oxygenation in the setting of significant CO2 retention due to hypoventilation.

Chronic metabolic acidosis—compensation

A woman on chronic hemodialysis sustains a femur fracture in a motor vehicle crash but has no other apparent injuries. Her extremity is dusky below the fracture. The patient is brought to the operating room immediately for open reduction and fixation. She appears to be breathing deeply during induction of anesthesia. After the patient is draped, an ABG sample obtained while she is breathing 50% O2 reveals a PaO2 of 266 mm Hg; PaCO2, 32 mm Hg; pH, 7.17; and HCO3, 12 mmol/L.

Interpretation algorithm

The pH is in the acidemic range. The PaCO2 is below normal, so this is a metabolic acidosis and probably a mixed disorder, based on the history. According to Winters formula defining the confidence interval for expected respiratory compensation for chronic metabolic acidosis (PaCO2 = [1.5 × HCO3] + 8 ± 2), the expected PaCO2 is 1.5 + 12 + 8, or 26, whereas the measured PaCO2 is 32, so we have a mixed metabolic-respiratory acidosis due to chronic renal failure and less-than-expected respiratory compensation due to general anesthesia. The P(A−a)O2 gradient is calculated as PAO2 = (0.5 × 713) − 32/0.8 (356 – 40), or 316 mm Hg. The measured PaO2 is 266 mm Hg, implying image/image mismatch in the setting of chronic renal failure, recent trauma, and general anesthesia.

Carbon monoxide exposure—correction

The first patient anesthetized in an operating room on a Monday morning is preoxygenated for 2 min, anesthesia is induced with intravenously administered medications and then maintained on desflurane and a mixture of N2O and O2. Fifteen minutes into the case, the patient’s pulse has increased by 40 beats/min, and respirations have increased by 10/min. Pulse oximetry reveals an SpO2 of 88%. An ABG measurement shows a PaCO2 of 155 mm Hg; PCO2, 33 mm Hg; pH, 7.25; HCO3, 20 mmol/L; O2 saturation, 55%; and carboxyhemoglobin concentration, 45%. A presumptive diagnosis is made of carbon monoxide poisoning due to production of carbon monoxide by exposure of dry sodalime to desflurane. The operation is canceled, and the patient is transferred to the intensive care unit breathing 95% O2. Four hours later, an ABG analysis reveals PaO2, 550 mm Hg; PCO2, 39 mm Hg; pH, 7.38; HCO3, 24 mmol/L; and carboxyhemoglobin concentration, 3.2%.