Chapter 43 Insulin and Drugs Used in the Therapy of Diabetes Mellitus
| Abbreviations | |
|---|---|
| ADP | Adenosine diphosphate |
| ATP | Adenosine triphosphate |
| cAMP | Cyclic adenosine monophosphate |
| DPP-IV | Dipeptidyl peptidase-IV |
| Epi | Epinephrine |
| GI | Gastrointestinal |
| GIP | Glucose-dependent insulinotropic polypeptide |
| GLP-1 | Glucagon-like peptide-1 |
| GLUT | Glucose transporter |
| GS | Glycogen synthase |
| HbA1c | Glycosylated hemoglobin |
| IRS | Insulin receptor substrate |
| IV | Intravenous |
| Kir6.2 | Inward rectifying K+ channel 6.2 subunit of the ATP-sensitive K+ channel |
| PI 3-kinase | Phosphatidylinositol 3-kinase |
| PKA | cAMP-dependent protein kinase A |
| PKC | Protein kinase C |
| PPAR | Peroxisome proliferator-activated receptor |
| SC | Subcutaneous |
| SUR1 | Sulfonylurea subunit of the ATP-sensitive K+ channel |
Therapeutic Overview
To determine how well blood glucose has been managed over a 2- to 3-month period, glycosylated hemoglobin (HbA1c) can be measured. Glycosylated hemoglobin is a molecule in red blood cells that attaches to glucose. HbA1c is normally 5%. An HbA1c of greater than 7% means that blood glucose levels have been poorly controlled, and the individual is at risk for developing problems such as kidney or nerve damage, heart disease, or stroke. The closer that HbA1c is to normal, the less risk for developing complications. It is important to recognize that it is not desirable to reduce glycosylated HbA1c values to the normal range if doing so results in hypoglycemic episodes.
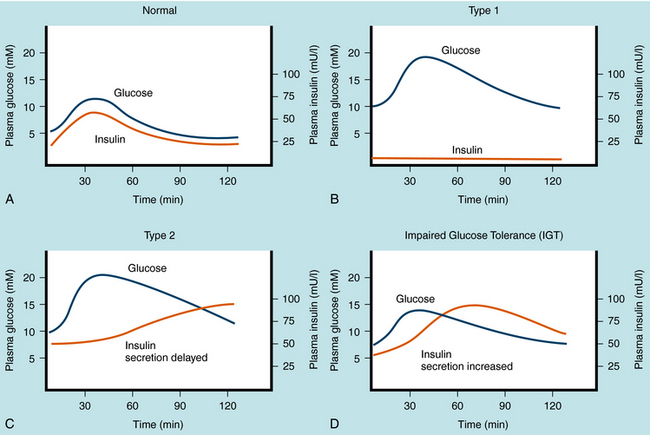
The management of diabetes is highly individualized and must consider the patient’s health, frequency of episodes of diabetic ketoacidosis, hypoglycemia (insulin-induced) and hyperglycemia, need for insulin, and relationship between circulating insulin levels and tissue responsiveness to insulin. There are two primary types of diabetes mellitus, and the pharmacological strategies for treating these differ in several important ways. Plasma glucose and insulin levels after an oral glucose tolerance test in normal individuals, in individuals with both types of diabetes mellitus, and in individuals with impaired glucose tolerance are depicted in Figure 43-1.
Type 1 diabetes mellitus is caused primarily by a T-cell mediated autoimmune response leading to destruction of the pancreatic β cells that produce insulin. Type 1 diabetes has an estimated frequency of 5% to 10% of total cases of diabetes mellitus and occurs predominantly before sexual maturation. Because the incidence of type 1 diabetes in homozygous twins is approximately 50%, factors other than genetic predisposition must be involved. The stimulus that prompts the immune system to attack β cells is still under investigation. The temporal nature of pancreatic β cell destruction can occur over a number of years, but after significant destruction (~90%), the onset of symptoms (polyuria, polydipsia, and polyphagia) can be abrupt. The increased urine volume is caused by osmotic diuresis resulting from increased concentrations of urinary glucose and ultimately ketone bodies. Thirst and hunger are compensatory responses. The development of diabetes mellitus is characterized by weight loss in the untreated disease and premature cessation of growth in children.
At the onset of symptoms, insulin levels are lower than normal and eventually become negligible (Fig. 43-1, B), requiring replacement to prevent metabolic acidosis (ketosis), followed by diabetic coma and premature death. The goal of insulin replacement is the carefully controlled maintenance of blood glucose to prevent or delay the onset of long-term diabetic complications.
Metabolic abnormalities associated with type 2 diabetes mellitus precede the appearance of overt symptoms. The progression of symptoms may evolve from impaired glucose tolerance, to insulin-independent type 2 diabetes mellitus, to insulin-requiring type 2 diabetes mellitus. Detection of impaired glucose tolerance is difficult, because fasting blood glucose and insulin levels can be nearly normal. However, 2 hours after a glucose challenge, above-normal levels of blood sugar and insulin are observed (see Figs. 43-1, C and D). These results are related to insulin resistance at the cellular level leading to diminished glucose transport and metabolism, which promotes hyperglycemia and provokes pancreatic β cell insulin release. Although adequate insulin secretion can occur initially, the amount of insulin release diminishes eventually and is insufficient to reduce hyperglycemia and consequently overcome the effects of insulin resistance. Chronic stimulation of the pancreatic β cell is thought to increase metabolic activity, which can induce cell death and ultimately decreased ability to secrete insulin, leading to the symptoms associated with type 2 diabetes mellitus. The diagnosis of type 2 diabetes mellitus is based on the appearance of hyperglycemia as it meets the criteria discussed. Because the pharmacological agents that are used to manage type 2 diabetes mellitus require insulin, if insulin is lost at this stage, the patient will become a candidate for insulin supplementation.
| Therapeutic Overview |
|---|
| Type 1 Diabetes Mellitus |
| Diabetic diet and exercise |
| Human insulin combination therapy |
| Addition of thiazolidinedione to manage concurrent insulin resistance |
| Management of Diabetic Ketoacidosis |
| Proper replacement of fluid, insulin, Na+, K+ and bicarbonate |
| Type 2 Diabetes Mellitus |
| Obesity management: |
| Diet, increased exercise, and weight reduction |
| Promoters of insulin secretion: |
| Sulfonylureas |
| Meglitinides |
| Incretin analogs |
| Dipeptidyl peptidase-IV inhibitors |
| Insulin supplementation |
| Management of insulin resistance: |
| Metformin |
| Thiazolidinediones |
| Pramlintide |
| α-Glucosidase inhibition to reduce postprandial carbohydrate challenge: |
| Metformin and miglitol |
| Combination therapy with multiple agents |
Mechanisms of Action
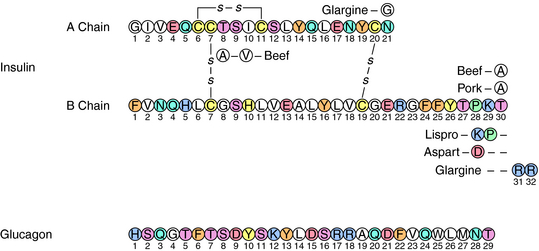
Insulin is a small acidic protein formed from the larger proinsulin precursor. Proinsulin is synthesized and packaged for secretion with trypsin-like proteases in the β cells of the islets of Langerhans. The precursor protein is proteolyzed within the secretory granule to form insulin via cleavage of a sequence of amino acids referred to as the C (connecting) peptide. Insulin is complexed with Zn++ within the granule. The active insulin protein is composed of an A peptide (21 amino acids), which has an intramolecular disulfide bond, and a B peptide (30 amino acids) that are covalently joined by two disulfide bonds (Fig. 43-2). Approximately equimolar amounts of insulin and C peptide are stored in and released from the granule, along with a much smaller amount of proinsulin.
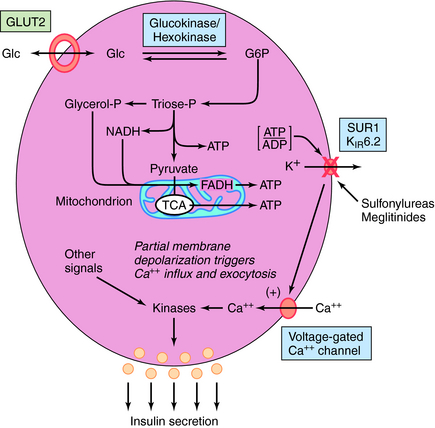
Insulin release is modulated by many factors (Box 43-1) but is controlled primarily by glucose. When blood glucose levels increase, glucose is taken up and metabolized by the pancreatic β cell, generating adenosine triphosphate (ATP) (Fig. 43-3). The increase in the ATP/ADP ratio promotes closure of the inward rectifying potassium channel 6.2 subunit (Kir6.2) of the ATP-sensitive potassium channel (also referred to as the SUR1/Kir6.2 channel). The decreased permeability of potassium ions partially depolarizes the cell membrane, promoting calcium uptake via activation of its voltage-gated channels. The elevated intracellular calcium stimulates exocytosis of the granules, releasing insulin and other components into the circulation.
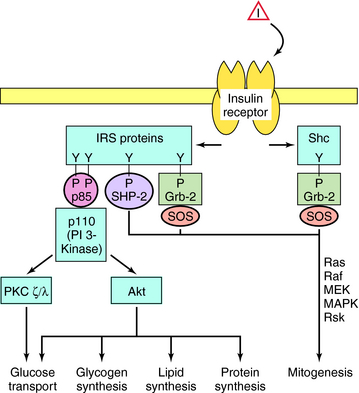
The cellular effects of insulin are initiated after insulin binds to a plasma membrane receptor (Fig. 43-4). The insulin receptor is composed of two α-subunits and two β-subunits. The interaction of insulin with the α-subunit results in changes in the β-subunit configuration, leading to activation of the tyrosine protein kinase that resides in the β-subunit. The phosphorylation of peptide substrates by the insulin receptor tyrosine kinase leads to activation of various anabolic pathways, inhibition of catabolic processes, and subsequently modulation of gene expression. The major peptide substrates for the insulin receptor are insulin receptor substrate (IRS)-1 and IRS-2. Phosphotyrosine residues in the IRS proteins serve as binding sites for intermediaries that trigger signal transduction pathways. The best defined of these pathways involves the small guanosine triphosphate (GTP)-binding protein Ras and leads to cell growth, differentiation, or both. However, the most important acute metabolic effects of insulin are mediated by phosphatidylinositol 3-kinase (PI 3-kinase), which is activated upon binding to phosphorylated IRS proteins. The phospholipid products generated by PI 3-kinase promote activation of several protein kinases including protein kinase B(Akt) and protein kinase C (PKC). These kinases phosphorylate effectors that activate glucose transporters (GLUT) and glycogen synthase (GS) and increase the synthesis of triglyceride and protein. Phosphotyrosine phosphatases are also activated that limit the duration of effects promoted by phosphotyrosines.
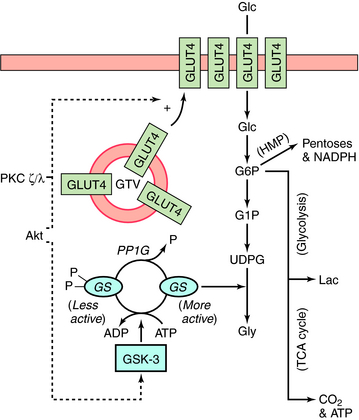
Stimulation of glycogen synthesis is very important in the action of insulin to lower blood glucose concentrations. Glucose taken up in response to insulin is deposited as glycogen in liver and skeletal muscle. Activation of glucose transport and GS contributes to the overall effects of insulin on glycogen synthesis. Increasing glucose transport allows more glucose to enter the muscle fiber, and activation of GS converts the glucose into glycogen. The control of GS activity is very important in this process and involves phosphorylation/dephosphorylation mechanisms (Fig. 43-5). GS is inactivated upon phosphorylation by the kinase GSK-3 and activated upon dephosphorylation by the protein phosphatase PP1G. In addition, phosphorylation of GSK-3 by Akt inactivates the kinase. Thus activation of Akt by insulin (see Fig. 43-4) leads to the inactivation of GSK-3, thereby tipping the balance to favor activation of GS by PP1G. In addition, by stimulating glucose transport via GLUT4, insulin increases the concentration of intracellular glucose 6-phosphate, an allosteric activator of GS. Insulin stimulates glucose transport in skeletal muscle and adipocytes by causing GLUT4 to translocate from intracellular vesicular compartments to the plasma membrane, an action promoted by signals from arising from Akt, PKC, or both (see Fig. 43-5). Increasing the number of glucose transporters at the cell surface increases glucose uptake into the cell. Interruption of any of these processes can be associated with genomic-associated insulin resistance.
Glucagon is a single-chain polypeptide with a molecular weight of approximately 3500 (see Fig. 43-2). It is synthesized in the α cells of the pancreatic islets through processes involving enzymatic cleavage of specific bonds in proglucagon, a large precursor. In the stomach and GI tract, a related molecule, glycentin, is formed from proglucagon. Glucagon is sometimes referred to as a counterregulatory hormone, because its action to increase blood glucose is counter to that of insulin. Glucagon levels may be inappropriately elevated in both type 1 and type 2 diabetics, contributing to the hyperglycemia in these diseases.
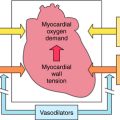
Glucagon is sometimes used as a drug to increase blood glucose concentrations in seriously hypoglycemic patients unable to take glucose orally. Its chief use, however, is in radiology. When administered with a radiopaque substance, glucagon relaxes GI smooth muscles, allowing better visualization of tumors and other GI disorders. Glucagon also stimulates lipolysis in adipocytes and has both chronotropic and inotropic effects in the heart. It is occasionally used to stimulate cardiac function after overdose of a β adrenergic receptor antagonist.
The incretins are a group of hormones that have been shown recently to play an important role in the regulation of glucose homeostasis and represent a relatively new target for drug action. The incretins are produced by cells in the GI tract in response to the absorption of food and are believed to increase the function of pancreatic islets. Incretins stimulate the β cells to produce insulin and impair the ability of the α cells to secrete glucagon, particularly when circulating levels of glucose are high. Incretins have also been shown to increase the growth and mass of β cells, delay gastric emptying, and promote the feeling of satiety through central mechanisms. The two best characterized incretins are glucose-dependent insulinotropic polypeptide (GIP, also known as gastric inhibitory peptide) and glucagon-like peptide-1 (GLP-1). Although increased levels of these incretins decrease blood glucose, they have very short half-lives (approximately 2 minutes) as they undergo rapid proteolysis by the enzyme dipeptidyl peptidase-IV (DPP-IV). Individuals with type 2 diabetes appear to have decreased GIP activity and decreased levels of GLP-1. Restoring incretin function, which promotes the health and function of the islets, is a major focus of current drug development. Indeed, incretin analogs and DPP-IV inhibitors both represent new classes of drugs for the treatment of type 2 diabetes.
Agents that Promote Insulin Release
On the basis of mechanism of action, four classes of drugs promote insulin secretion, the sulfonylureas, meglitinides, incretin analogs, and DPP-IV inhibitors (Fig. 43-6). The effectiveness of these agents is dependent on functioning pancreatic β cells, and these agents are not beneficial if the patient exhibits severe insulin deficiency.
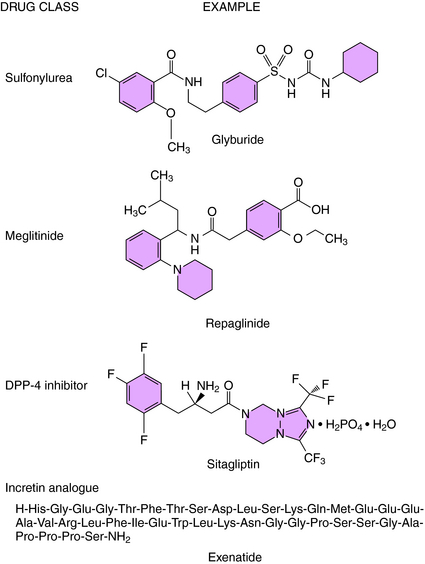
Tolbutamide, tolazamide, acetohexamide, and chlorpropamide are the first-generation sulfonylureas; glyburide, glipizide, and glimepiride are second-generation agents, which are effective at 10 to 100 times lower concentrations. All of the sulfonylureas promote insulin release by binding to the sulfonylurea subunit (SUR1) of the SUR1/Kir6.2 ATP-sensitive K+ channel (see Fig. 43-3). Binding inhibits channel conductance, resulting in partial depolarization of the membrane and activation of voltage-sensitive Ca++ channels. The resulting increase in cytosolic Ca++ promotes exocytosis of the secretory granules containing insulin. Insulin release is essential for the hypoglycemic actions of the sulfonylureas. However, after long-term treatment with sulfonylureas, the concentrations of insulin return to pretreatment values, even though the hypoglycemic effect persists. Thus it is assumed that sulfonylureas increase insulin sensitivity by enhancing the effect of insulin to stimulate glucose uptake into muscle and adipose cells.
Two members of this class have been approved for use in the United States: repaglinide and nateglinide. These agents have a mechanism of action similar to the sulfonylureas to inhibit K+ conductance by the Kir6.2 ATP-sensitive K+ channel. Although the meglitinides bind to a site distinct from that of the sulfonylureas, stimulation of insulin secretion occurs by the same membrane depolarization mechanism (see Fig. 43-3).
Exenatide is a synthetic peptide with an amino acid sequence that partially overlaps that of human GLP-1 (see Fig. 43-6). Exenatide binds to and activates the GLP-1 receptor on the pancreatic β cell to increase levels of cAMP and the density of membrane-associated GLUT2 transporters. The consequence of the increased glucose uptake and ATP formation is closure of the Kir6.2 ATP-sensitive K+ channel, analogous to the natural process stimulated by sulfonylureas. As a consequence, exenatide promotes the release of insulin from pancreatic β cells in the presence of elevated glucose levels.
Other Antihyperglycemic Agents
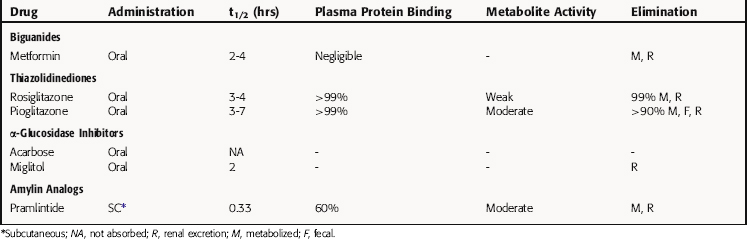
Other agents that are used for the treatment of diabetes include drugs that reduce insulin resistance including the biguanides and the thiazolidinediones, α-glucosidase inhibitors, and a modified amylin peptide (Fig. 43-7).
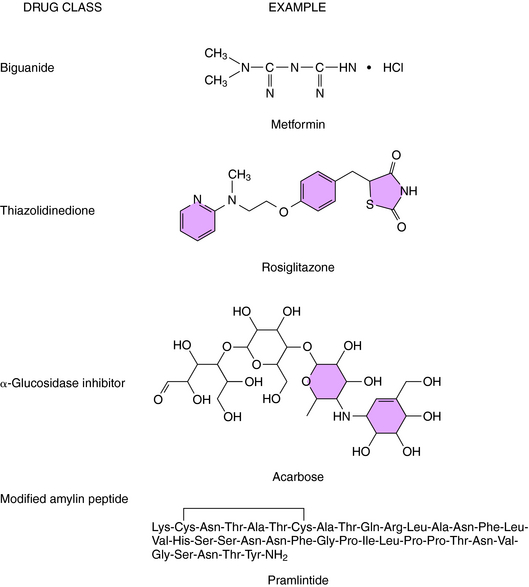
Metformin is a biguanide that decreases hepatic glucose output, inhibits absorption of glucose from the GI tract, and increases glucose uptake by muscle cells and adipocytes. Although not fully understood, the mechanism of action involves activation of cAMP-dependent protein kinase (PKA). Activation of this kinase in skeletal muscle and adipocytes leads to increased glucose transport by promoting translocation of GLUT4 to the cell surface (see Fig. 43-5).
At therapeutic doses, metformin is comparable in efficacy to sulfonylureas in maintaining lower levels of blood glucose in the type 2 diabetic. However, the acute effect of a single dose of metformin on blood glucose is less pronounced than a meglitinide such as repaglinide. Nevertheless, metformin, unlike sulfonylureas and meglitinides, has very little potential to cause hypoglycemia. Moreover, unlike insulin, agents that promote insulin release, or the thiazolidinediones, metformin does not cause weight gain and is often a preferred drug in the treatment of obese type 2 diabetics.
Pharmacokinetics
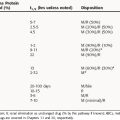
Insulin cannot be administered orally because it is degraded by GI tract proteases. There are several routes available for dispensing insulin, intravenous (IV) administration for the emergency treatment of diabetic coma, inhaled insulin formulations for supplementation, and subcutaneous (SC) injection, the most common route for maintenance. Insulin preparations were developed to address several functions of insulin, including maintenance of relatively constant and low levels to meet cellular requirements and a rapid increase and decline to fulfill the role for insulin in managing nutritional intake and storage. Thus insulin preparations were developed with different pharmacokinetic properties, for example, different times of onset, peak activities, and durations of action. The success of this ongoing process can be seen in Table 43-1.
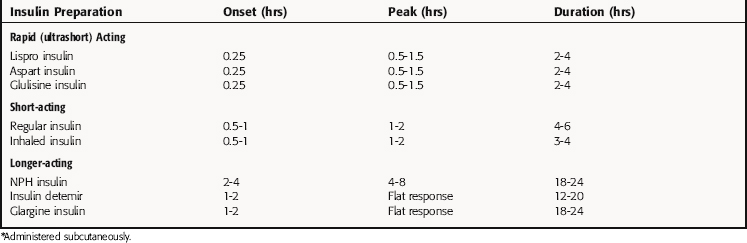
Regular insulin is classified as a short-acting preparation. Insulin has a strong tendency to dimerize, and dimeric insulin is absorbed less rapidly than monomeric insulin. Two rapid-acting preparations, lispro insulin and aspart insulin, have been developed by modifying the insulin protein to prevent dimerization. In lispro insulin, the lysine and proline residues at positions 28 and 29 in the B chain are interchanged (see Fig. 43-2), whereas in aspart insulin, proline 28 is replaced with arginine.
Long-acting insulin preparations are not readily soluble and are absorbed only after dissolving in the interstitial fluid. The delayed solubility prolongs the duration of insulin action. The extended-action preparations are injected SC and must not be injected IV. There are two long-acting insulin preparations. Ultralente insulin is a suspension of large insulin-Zn++ crystals that dissolve slowly at the site of injection. Glargine insulin was developed by engineering two additional arginines at the COOH terminus of the B chain and a glycine in place of the aspargine at position 21 in the A chain (see Fig. 43-2). The additional arginines increase the charge and decrease the solubility of the protein at neutral pH. Arginine 21 was replaced with glycine to prevent desamidation, a process accelerated by acidic pH. Glargine insulin also precipitates at the site of injection, creating a depot that dissolves slowly and produces a stable baseline level of circulating drug.
Agents that Promote Insulin Release
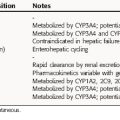
The sulfonylureas are rapidly and completely absorbed from the GI tract and highly bound to plasma proteins. The first-generation drugs typically bind by ionic interactions and may be displaced by other drugs using such interactions. Second-generation sulfonylureas interact with albumin through nonionic binding, which makes them relatively more difficult to displace and increases their duration of action. Most sulfonylureas are metabolized in the liver, and the metabolites are excreted by the kidney. Pharmacokinetic parameters of sulfonylureas are summarized in Table 43-2. The duration of action of these drugs enables them to be administered as a single daily dose. The drugs are metabolized to inactive or weakly active products primarily by the liver.
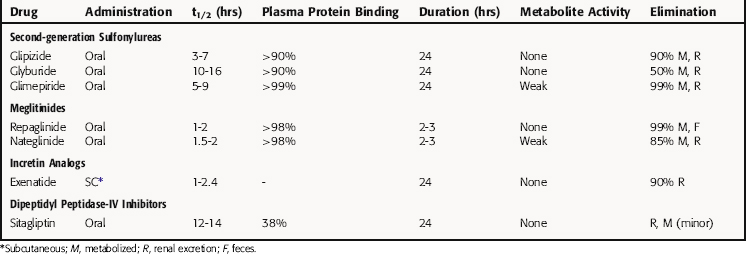
The meglitinides, repaglinide and nateglinide, have more rapid onsets and shorter durations of action than the sulfonylureas. Hypoglycemic actions with the meglitinides may occur as early as 20 minutes after an oral dose. Consequently, these drugs are generally taken immediately before meals to ensure that the effect on enhancing insulin release coincides with the increase in blood glucose. The meglitinides are highly bound to plasma proteins but not readily displaced by other drugs. Repaglinide is metabolized by oxidation and conjugation with glucuronic acid to products eliminated in the feces. Nateglinide is metabolized in the liver to products excreted in the urine.
Relationship of Mechanisms of Action to Clinical Response
The actions of insulin that contribute to the uptake and storage of glucose are summarized in Box 43-2. Insulin stimulates glucose transport by facilitated diffusion into muscle cells and adipocytes by promoting translocation of GLUT4 to the cell surface. Hepatic glucose transport is mediated by GLUT2, and its membrane density is insulin-independent. The hepatic effects of insulin are metabolic, for example, insulin inhibits glycogenolysis and gluconeogenesis. Although the effects of insulin on gluconeogenesis are restricted to the liver, the hormone affects activity of many intracellular enzymes involved in energy storage in all major insulin-sensitive tissues. As a result, glucose is efficiently converted to glycogen, triglyceride, and protein.
Elevated blood lipids increase the risk of atherosclerosis, and insulin has several actions that decrease serum lipid concentrations (Box 43-2). Lipids are transported in blood primarily as particles containing cholesterol esters complexed with proteins (see Chapter 25). Before the fatty acids can be taken up into cells, the cholesterol esters must be hydrolyzed by lipoprotein lipase, which is stimulated by insulin. Insulin also stimulates fatty acid synthesis, although the concentration of free fatty acids in the circulation decreases because insulin decreases lipolysis and accelerates fatty acid esterification. Stimulation of glucose transport into fat cells increases the supply of glycerol phosphate used in esterification.
Type 2 diabetes is frequently associated with hypercholesterolemia and hypertension, and the coexistence of these disorders is referred to as metabolic syndrome. The significance of this association with respect to the underlying causes of type 2 diabetes, hypercholesterolemia, and hypertension is unclear. However, it is important to recognize that type 2 diabetics often have other disorders that place them at risk of developing atherosclerosis. Aggressively treating hypertension and hyperlipidemia in such individuals is important to decrease the risk of cardiovascular disease (see Chapter 25).
Other Antihyperglycemic Agents
Pramlitide inhibits glucagon secretion, which promotes hepatic insulin sensitivity by increasing glucose use. It also decreases gastric emptying and appetite. Several long-term randomized, double-blind, placebo-controlled trials indicate decreased HbA1c levels without concomitant weight gain, which is a major complaint and reason for terminating therapy with thiazolidinediones.
Pharmacovigilance: Clinical Problems, Side Effects, and Toxicity
A major problem in treating diabetes mellitus is that control of blood glucose cannot be achieved with a fixed concentration of insulin. Insulin release is subject to complex regulation by many factors (Box 43-1), and circulating concentrations can change dramatically in nondiabetic subjects to maintain glucose levels within the normal range. Correlating insulin concentrations with the glucose load is a major challenge in insulin therapy, particularly because insulin sensitivity may vary greatly among individuals. Too little insulin results in hyperglycemia, whereas too much causes hypoglycemia and potentially insulin shock. As mentioned, the general strategy is to inject a short-acting insulin preparation to produce a peak in insulin that coincides with the rise in blood glucose that follows a meal and to use an extended-action preparation to establish a baseline concentration to prevent hyperglycemia between meals and during the overnight period. Administering insulin with variable-rate infusion pumps provides a more flexible means to control circulating insulin. There is evidence that tighter control of the blood glucose concentration is possible with these devices, although hypoglycemic episodes are also more frequent. Careful monitoring of blood glucose levels is essential.
Hypoglycemia is the most serious complication of insulin therapy. Among its causes are mistakes made in calculating doses or the timing of injections, changes in eating patterns, increased energy expenditure, or an increase in sensitivity. The brain has an absolute requirement for glucose, and severe hypoglycemia can cause unconsciousness, convulsions, brain damage, and death. Symptoms of hypoglycemia are often caused by increases in epinephrine (Epi) secretion, abnormal functioning of the central nervous system, or both. When the blood glucose concentration declines rapidly, Epi is released as a compensatory mechanism to stimulate hepatic glucose production and mobilize energy reserves. Rapid heart rate, headache, cold sweat, weakness, and trembling are characteristic responses to Epi (see Chapter 11). The extent to which these symptoms are observed varies considerably, depending on the individual and the rate of fall of the blood glucose concentration. Impaired neural function leads to blurred vision, an incoherent speech pattern, and mental confusion. At this point an experienced diabetic may be able to recognize his or her hypoglycemic state and take corrective action. However, the disoriented person is likely to need assistance. A glucose tablet or other source of rapidly absorbed glucose may be given to a conscious person Use of a medical identification bracelet can be life-saving.
Agents that Promote Insulin Release
Weight gain related to the increase in insulin action on triglyceride synthesis occurs in most diabetics treated with oral hypoglycemic agents. A more serious complication is hypoglycemia, which may be due to an overdose, increased insulin sensitivity, change in dietary pattern, or increased energy expenditure. If the response is mild, it can be corrected by decreasing the dose of drug. However, severe cases may persist for days and require infusion of glucose.
Abramowicz M, Zuccotti G. Drugs for Type 2 Diabetes. Treat Guidel Med Lett. 2008;6:47-54.
Anonymous. Thiazolidinediones and cardiovascular disease. Med Lett. 2007;49:57-60.
Charpentier G. Oral combination therapy for type 2 diabetes. Diabetes Metab Res Rev. 2002;(Suppl 3):S70-S76.
McMahon GT, Arky RA. Inhaled insulin. N Engl J Med. 2007;356:497-502.
Nathan DM. New treatments for diabetes. N Engl J Med. 2007;356:437-440.