8 Imaging in Radiation Oncology*
Accurate, patient-specific anatomic information is a prerequisite for planning and implementing the delivery of radiation to the entire extent of the malignancy while minimizing exposure to critical structures. For this reason, anatomic images are of utmost importance in radiotherapy. In fact, most of the significant recent advances in radiation oncology have resulted from developments in imaging modalities such as computed tomography (CT), magnetic resonance imaging (MRI), magnetic resonance spectroscopy imaging (MRSI), positron emission tomography (PET), and digital planar image receptors. With information from the new imaging modalities, it is now possible to define treatment volumes and critical structures with great precision, thus reducing marginal misses and irradiation of normal tissues. Such capabilities may permit higher tumor doses, potentially leading to improved local control, while maintaining the same level of normal tissue morbidity or even reducing it.1–4


Generation of Images
Computed Tomography
Principles of Operation
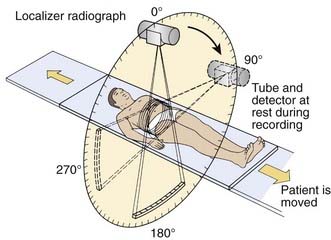
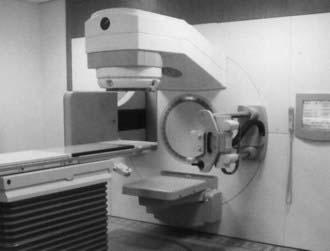
CT is an x-ray imaging technique used to visualize thin slices of the body. The first commercial CT scanner was developed by Sir Godfrey Hounsfield of the EMI Corporation in 1972. Alan Cormack developed an accurate mathematical technique to reconstruct images from x-ray projections. Hounsfield and Cormack received the 1979 Nobel Prize in medicine for their efforts. Modern scanners employ a pure rotation motion and require only 0.4 to 1.0 second per rotation to acquire the data (Fig. 8-1). Multislice detector arrays now allow as many as 320 slices to be acquired in one 0.35 second rotation.
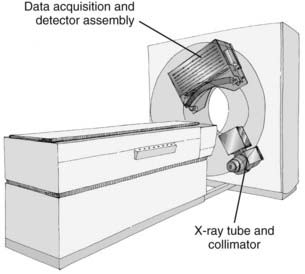
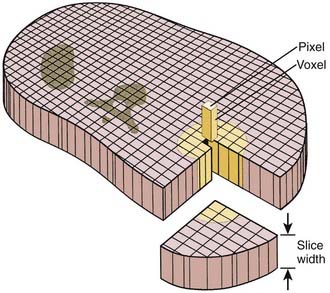
A thin beam of x-rays of about 120 kilovolts (kV), in the fan-beam geometry, is incident on the patient transversely. The transmitted x-rays are detected by an array of many solid-state detectors. Concomitantly, the x-ray source and the detector array are rotated through an angular range from 180 to 360 degrees. The detected x-ray transmission factors are input data to a computer program, the so-called reconstruction algorithm, which produces an output matrix (usually 512 × 512) of digital values. Current scanners using workstations and the filtered-back projection algorithm can reconstruct an image in a fraction of a second. Each element of the matrix represents a small area, or pixel; the product of a pixel area and the slice thickness constitutes a volume element, or voxel (Fig. 8-2). The digital value reconstructed for each pixel (or voxel) represents the linear attenuation coefficient (approximately equivalent to the electronic density) of that volume. The digital values are converted to gray-scale levels for display on a video monitor screen or are used as input to a PACS workstation or to a laser imager for hard-copy output on film. The contrast of the image may be adjusted by window and level settings that determine the range of attenuation values displayed within the gray-scale range of the output device.

where µt is the linear attenuation coefficient of the tissue element in that pixel, and µw is the linear attenuation coefficient of water at the effective energy of the x-ray beam. With this definition, water has a CT number of 0 H, air of −1000 H, and dense bone of more than 1000 H. In general, CT values for soft tissues range from −100 to +100 H.
Uses in Radiation Oncology and Limitations
Computed tomographic images are usually acquired with a 120 to 140 kV x-ray beam (an effective energy of 70 to 80 keV), which undergoes a significant number of photoelectric interactions, particularly in bone. Therefore, a nonlinear conversion table must be used to obtain electron densities for dose calculations relevant to the much higher energy treatment photons that undergo mainly Compton interactions. Several authors have developed an empiric relationship between CT numbers in H units and electron densities normalized to 1.0 for water.5 This relationship is expressed as two or three linear regions and stored in a lookup table (LUT). Phantoms that contain multiple objects of a known electron density for converting CT numbers are commercially available.
Recent Developments
Faster and more accurate CT examinations have become possible with the introduction first of the single-slice and then of the multi-slice spiral, or (more properly) helical, scanners. Volumetric scan data is acquired by having the table move continuously relative to the gantry, concomitant with the continuous rotation of the x-ray tube and detector array around the patient. Multislice units may acquire the data for as few as 4 or as many as 320 slices during a single 0.35 second rotation.6 State-of-the-art multislice CT scanners can obtain isotropic data sets with voxels of dimension as small as 0.5 mm. These scanners can acquire the data for a full set of images in times well below 1 minute, usually during one breath hold. For radiotherapy application, however, one must consider the possibility that patient anatomy during a breath hold may not be in its “average” location during radiation treatment.
To address the limitations of CT gantry aperture on the ability to set up patients with immobilization devices, commercial scanners with 80 to 85 cm apertures have become available. In connection with respiration-gated radiation therapy, in which dose delivery from the treatment accelerator occurs at a preselected interval in the respiratory cycle while the patient breathes normally, different means of synchronizing CT acquisition with respiration have been introduced. In one method, a respiration monitor system triggers the scanner to acquire a single axial image while the patient breathes normally, followed by indexing of the table to the next position; the process is repeated until the volumetric set of images is obtained.7 A more widely used approach is the acquisition of volumetric data concurrently throughout the respiration cycle, for the purposes of obtaining information on anatomical motion and more accurately accounting for it in the treatment plan.8,9 In this approach, axial images are acquired continuously while the respiration signal is simultaneously recorded; the images are then retrospectively sorted according to the respiration phase to form volumetric sets at different phases.
The use of CT for treatment verification is discussed in the section on In-Room CT-Based Systems.
Use and Limitations of Computed Tomographic Scout View
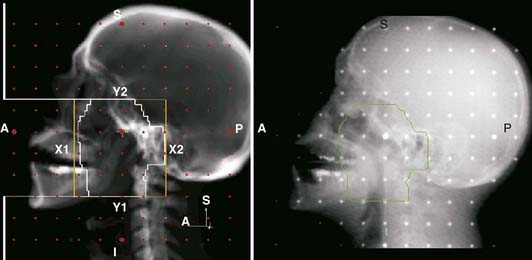
Digital projection images, the so-called scout view, can be obtained from CT scanners by translating the patient relative to the x-ray tube and detector array (Fig. 8-3). Although the x-ray tube may be oriented at any angle, the most common arrangement is in either the anterior-posterior (AP) or the lateral direction. The data obtained are a two-dimensional (2-D) matrix of relative transmission values in an arbitrary numeric range that may differ from one type of scanner to another. Adjustment of the window and level controls provides an image of appropriate brightness and contrast. The scout view is often useful in determining the extent and spacing of axial scans. In addition, in the hard-copy output, the positions of the axial images can be annotated on the scout views, relative to a reference position selected during the patient setup.
Magnetic Resonance Imaging
Principles of Operation
The phenomenon of nuclear magnetic resonance (NMR) was first described by Purcell and Bloch, the 1952 winners of the Nobel Prize in physics. Early work on the use of NMR for imaging was done by Lauterbur, Damadian, and others. Nuclei with a magnetic moment, usually those with odd numbers of protons or neutrons, when placed in a strong magnetic field, can be excited from their ground or lowest energy state to a higher state by a pulse from a second and weaker magnetic field that is varying in radiofrequency. When these nuclei return to the ground energy state, they emit radiofrequency energy that can be detected by very sensitive wire coils and appropriate electronics. Many commercial MRI units use a 0.5 to 1.5 tesla (T) magnetic field produced by a superconducting magnet and radiofrequency signals of 20 to 65 MHz for studies of the distribution of hydrogen nuclei (protons) in the body. Additional electromagnets are used to localize the region where resonance takes place (x-, y-, and z-gradient coils) and remove inhomogeneities in the main magnetic field (shim coils) (Fig. 8-4).
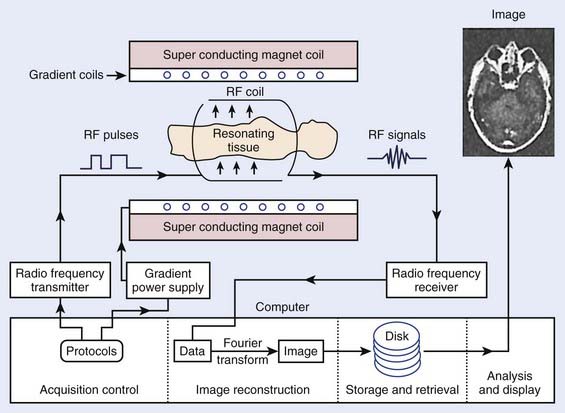
FIGURE 8-4 • Typical magnetic resonance imaging system. RF, Radiofrequency.
(From Sprawls P: Physical principles of medical imaging, ed 2, Madison, WI, 1993, Medical Physics Publishing.)
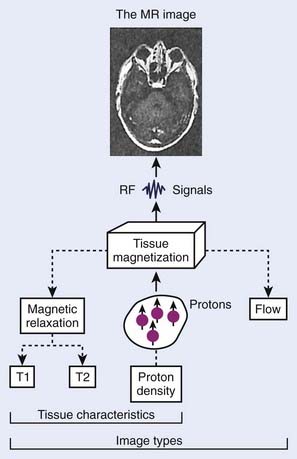
Typical magnetic resonance (MR) images contain a matrix of 256 × 256 values, a factor of 2 less than CT images in each dimension. Each pixel contains a complex combination of information about hydrogen nuclei density (ρ), spin-lattice relaxation time (T1), and spin-spin relaxation time (T2). The relaxation times are a measure of the time required for the disappearance of the signal caused by nuclei returning from an excited to an unperturbed energy state, or for dephasing of the initially aligned and precessing nuclear spins. Radiofrequency pulse sequences can be designed to enhance the dependence of the image on the values of any of the three parameters and improve the contrast for various tumors or other abnormal tissue variations. The appearance of MR images may be further affected by blood flow or by injection of contrast agents such as gadolinium compounds. MR image data may be obtained for a three-dimensional (3-D) volume or for any arbitrary plane within the volume. MRI offers the possibility of excellent discrimination of certain tumors with high contrast, the ability to select arbitrary planes for imaging, and good resolution (Fig. 8-5).
Uses and Limitations
MR images often provide better soft-tissue contrast than CT, thus improving discrimination between tumor and normal tissue in some disease sites. Small differences in T1 and T2 can be exploited by manipulating imaging parameters to enhance the contrast among different tissues. In addition, by using the three orthogonal field gradients independently or in combination, the image plane can be oriented in a direction that best displays the extent of a particular tissue. Functional MRI of the brain can identify speech, visual, and sensory areas to avoid when treating intracranial lesions.10
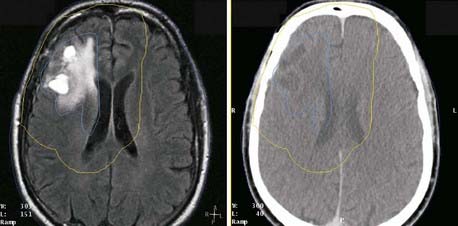
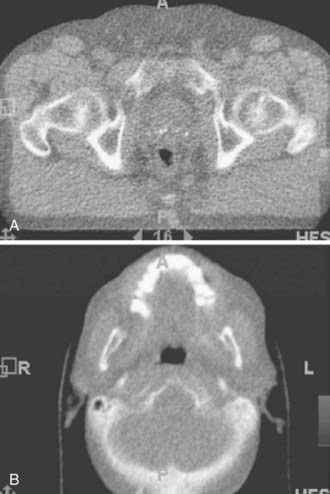
Several characteristics have limited the applicability of MR images alone for treatment planning. One is the lack of signal from cortical bone: Although bone location can be inferred in some disease sites, it is not possible to distinguish bone-air interfaces such as sinuses. Pixel intensities do not correlate with electron density as they do in CT; thus they cannot be used directly in dose calculations. Intensity variations occur across the images, such as those arising from falloff in sensitivity toward the ends of the receiver coil. The images may be distorted by variations in local magnetic fields caused by imperfections in the machine itself and by the presence of metal objects in the environment and within the patient. Because of these limitations, MR images are usually registered to CT, and the information MRI provides is transferred to the CT study for treatment planning purposes. The registration of CT and MR images is described in another section. MRI has been effectively used for treatment planning of brain, head and neck, liver, pelvis, and prostate tumors (Fig. 8-6). Other disadvantages include the high cost of equipment and site preparation, examination times that are 1.5 to 2 times those required for CT, a limited diameter of the patient tunnel opening in the magnet, and magnetic and radio-frequency shielding problems.
MRI alone can be used in treatment planning of sites that do not have large tissue inhomogeneities by substituting a bulk density correction for dose calculation in the absence of an electron density map.11
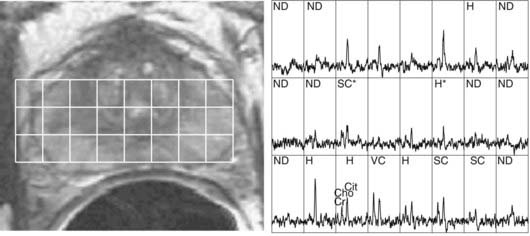
MRSI of 1H nuclei in combination with MRI is receiving increased clinical adoption for evaluating tumor extent and necrosis in brain tumors and potential staging and evaluation of prostate cancer, and thus as an aid to external beam and brachytherapy planning.12,13 The relative concentrations of metabolites choline, creatine, and citrate, specifically elevated values of the ratio (choline + creatine)/citrate, have been hypothesized to be an indicator of malignant prostatic tissue (Fig. 8-7).14,15
MRI studies of perfusion, diffusion, and contrast enhancement in recent years have shown potential for assessment of therapeutic response and as an early predictor of treatment outcome.16 These investigations indicate a potential use of MRI as an aid to optimizing therapy for individual patients.
An advantage of MRI is that rapid-sequence images can be acquired without the radiation dose associated with CT. Applications of cine MRI to radiotherapy have evaluated the influence of rectal and bladder filling on prostate motion and respiration-induced motion of anatomic structures in the thorax.17,18
Recent Developments
There is also a new class of MRI contrast agents, which are capable of gene transfection into cells. These agents will allow gene therapy to be monitored by MRI through cotransported MRI contrast agents. Additional refinements include MRI contrast agents that will enable the MRI signal to be greatly amplified through association of the site-directed contrast agent with its target.19
Ultrasound Imaging
Uses and Limitations in Radiation Oncology
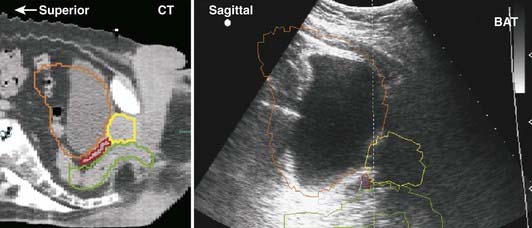
Early medical ultrasound B-scan units provided some of the first cross-sectional images for treatment planning; however, current CT and MRI units, although 5 to 10 times more expensive, produce images with better resolution and contrast that are more desirable for treatment planning. The major exception is the use of high-resolution images of the prostate obtained with an ultrasound imager that employs a special rectal probe. Transrectal ultrasound has become the predominant image modality for planning and delivery of prostate implants using transperineal template-guided insertion. Intraoperative ultrasound has also been applied to evaluate high-dose-rate prostate brachytherapy implants.20 Application of ultrasound in breast cancer occurs most commonly in the initial diagnostic evaluation: in addition to detecting abnormalities, it is useful in assessing the presence of multicentric tumor.21 Ultrasound can serve to define involved primary and nodal sites for breast-cancer radiotherapy and postlumpectomy radiotherapy. A commercially available device allows ultrasound-guided patient positioning for external-beam radiation therapy; several centers have reported on its application to daily localization and correction of prostate position.22
Ultrasound beams cannot penetrate gas-filled cavities or bone. This limits the use of ultrasonography. Furthermore, ultrasonographic images are much more difficult to interpret than those from CT or MRI (Fig. 8-8).
Recent Developments
Imaging systems consisting of multielement transducers can produce ultrasonographic images in a slice at rates fast enough to show smooth motion on a video screen (≈30 pictures per second). All modern ultrasonographic units use a digital scan converter to produce digital images. Individual pictures, or frames, can be transferred to PACs or to film with a laser imager. Recent ultrasound-guided patient positioning systems produce 3-D ultrasound images, thereby improving image interpretation and alignment relative to earlier 2-D systems.23
Computed Tomography Simulation


 Generation of DRRs for comparison with portal films or electronic portal images. The DRR display may include a treatment field outline, graticule tray, and outlines of organs (Fig. 8-9).

Imaging in Treatment Verification
Portal Radiographs
Portal radiographs are a fundamental part of the clinical quality-assurance program. They provide a beam’s eye view record of the patient treatment volume, radiographically revealing the relationship between anatomical structures and the treatment field. There are three types of imaging systems available for acquiring portal radiographs: film, electronic portal imaging devices (EPIDs), and CR; each system is described in later sections. The American Association of Physicists in Medicine (AAPM) Task Group 28 defines a portal radiograph as “a radiograph produced by exposing the image receptor to the radiation beam which emanates from the portal of a therapy unit.”24 The report describes three types of radiographs (within the context of acquisition with film):
 Localization: A portal radiograph produced by an exposure that is short compared with the daily treatment of that field (generally called localization films, beam films, or port films).

The importance of portal radiography as a quality-assurance tool is supported by numerous published studies, which have made it clear that portal radiographs are essential to accurate radiotherapy and that frequent imaging is desirable for difficult patient setups or highly conformal treatments.25
Portal Films
The image quality of either type of film is reduced in part by high-energy secondary electrons that exit from the patient onto the film. Portal film quality is improved with specialized radiotherapy cassettes that provide metal front screens in uniform and close contact with the film and that is thick enough to absorb the shower of secondary electrons exiting the patient. The thickness of these screens is determined by measurements of scatter-to-primary ratios for large fields.24 Thicknesses are generally 1 to 4 mm, depending on the beam energy and on the screen material (usually lead or copper). A rear metal screen is also often used to improve the overall sensitivity, or speed, of the system. The use of rear screens may cause some reduction in image resolution; however, in practice no significant degradation of image quality is observed. A second important function of the film cassette is to provide good film–screen contact.
Electronic Portal Imaging Devices
The EPID is attached to the gantry of an isocentric radiation treatment machine so that it may intercept the exiting photon beam at all gantry angles. The ideal support system must be sturdy and capable of precise repositioning, yet easily retracted or removed to facilitate patient access. First-generation commercial EPIDs have been either video-based or matrix ionization chamber-based systems.27 In video-based systems, the image is formed by the interaction of the radiation with a fluorescent screen assembly consisting of a metal (e.g., copper or tungsten) plate onto which the phosphor is deposited. The metal plate is upstream relative to the phosphor and absorbs scattered electrons emanating from the patient, as well as interacting with the photons to generate high-energy electrons that, in turn, produce the fluorescent image in the phosphor. A front-silvered mirror, placed diagonally, reflects the fluorescent light by 90 degrees into a video camera. In the matrix ionization chamber system, electrode strips on two printed circuit boards form an array of ionization chambers; the strips run horizontally on one board and vertically on the other. A 1 mm gap between the boards is filled with iso-octane liquid, which serves as an ionization medium for the x-rays. An image is obtained by switching on the high voltage to one row, collecting the currents from each of the column electrodes, and repeating the process for each of the rows. The first-generation systems, although more convenient than film, have a number of limitations. The camera-based systems are bulky and image quality is reduced because of the poor optical transfer system, and the matrix ionization chamber system requires long irradiation times and is especially sensitive to small changes in dose rate, resulting in line and band artifacts.
The current commercially available EPIDs take advantage of the large industrial development of flat-display panel technology, and provide faster acquisition and superior image quality than their predecessors. Variously referred to as active-matrix flat-panel imagers or amorphous silicon flat-panel image detectors, the array of electronic circuitry comprising the pixels is fabricated on panels of hydrogenated amorphous silicon. Each pixel comprises a light-sensitive photodiode attached to a thin-film transistor acting as a switch. The physical buildup of the detector array consists of a metal plate (typically 1 mm copper) and phosphor screen to convert x-rays to visible light; the metal layer also serves to attenuate scattered radiation. The light is converted to electron-ion pairs in the photodiode, and collected by application of a bias voltage onto a storage capacitor. The charges stored in the pixels are transferred to the readout electronics by activating the pixel switches row by row and reading out all columns simultaneously. The arrays are capable of 10 frames per second or higher, and thus are applicable to fluoroscopy as well as radiography. For portal imaging applications, several frames are averaged together to reduce image noise. Panel sizes of 30 × 40 cm2 or 40 × 40 cm2 are available in arrays of 512 × 384, 1024 × 768, or 1024 × 1024 pixels, respectively (Fig. 8-10).
Use of Portal Radiographs in Radiation Oncology
Image Registration
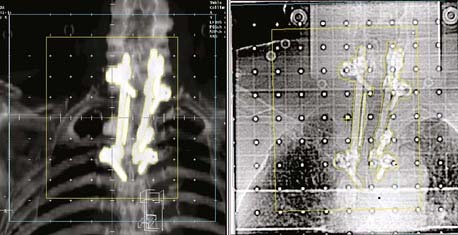
Portal radiography is a primary tool for quality assurance in radiation delivery. The portal image from the first treatment is compared with the corresponding reference image (a digitized simulator film or digital image, or digitally reconstructed radiograph from CT) to ensure correct patient setup and proper block construction and placement or MLC programming. Since portal (and simulator) radiographs of oblique fields are confusing and difficult to interpret because of their nonstandard view of radiographic anatomy, AP and lateral portal films are generally used to verify the isocenter location. Side-by-side comparison of the simulator and portal images can be facilitated with the use of a graticule, a device that projects a cross-hair shadow and centimeter scale in the portal film; the device is supplied by several vendors.24,28 The use of such a device is recommended because the cross hairs of the linear accelerator or cobalt-60 fields do not appear on the portal image. If field adjustments are needed, this tool facilitates the quantification and communication of the desired changes (see Fig. 8-10).
Two of the most common methods of interactive, or manual, image registration are the line drawing or template technique, and point-pair registration. Point-pair registration involves identifying the positions of corresponding anatomical landmarks in the reference and portal images; the portal image is then transformed (i.e., translated, rotated, and scaled) such that the selected points align with those in the reference image. Although the methodology is simple, point-pair registration is error prone, because of the difficulty in correctly identifying corresponding fiducial points, particularly when reference and portal images are of different image quality (i.e., kV vis-à-vis megavoltage beam quality). The template method involves drawing (graphically, by means of a mouse or trackball) lines or curves indicating the field edge and patient anatomy on the reference image, which is then overlaid and aligned with the portal image (Fig. 8-11). Semiautomatic extensions of the template method are those that automatically extract anatomic features in the portal image and align them with the reference template. A third category of registration methods uses automated pixel-by-pixel, grayscale intensity–based image correlation. This approach assumes similar quality images for matching; thus, it requires registration of a first-day portal image to the reference image by some other means, then uses the first-day portal image as reference for subsequent treatment sessions.
As previously indicated, portal radiographs are part of the overall quality-assurance program for ongoing verification of treatment accuracy. Portal images can reveal errors in the patient setup position, field size and orientation, or placement and shaping of shielding blocks. Thus they should be taken during the initial treatment setup and weekly thereafter, as recommended by the AAPM Task Group on Radiotherapy Portal Imaging Quality and the AAPM Task Group on Comprehensive Clinical Quality Assurance.28 Regular review takes place at the weekly chart (film) rounds; the current week’s portal films are compared side by side with the appropriate reference image. Alternatively, electronic images can be displayed by means of a computer monitor or liquid crystal display projector. Approved portal images should be signed (on the film electronically via a radiotherapy PAC) and dated for medicolegal documentation purposes, and discrepancies should be investigated and rectified. Note that altering the patient setup position or skin marks based on a small discrepancy (e.g., <0.5 cm) observed in a single portal image may not be appropriate. Rather, it may be more appropriate to take a repeat image on the subsequent day before effecting a change. However, by using online imaging with implanted markers, treatment accuracy can be improved such that changes of less than 0.5 cm can be made accurately.
Specific goals for using EPIDs should be established before they can be put to clinical use.25,27 A number of key questions should be addressed; these questions include:


Other Applications of Electronic Portal Imaging Devices
The use of EPIDs for detecting radio-opaque fiducial markers implanted in or near a tumor, particularly in the prostate, has received increasing attention as a means of correcting errors in target position from internal organ motion.26
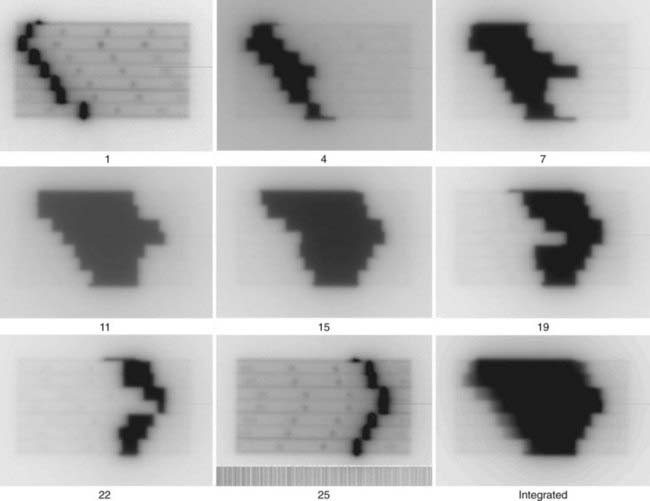
Another application is to verify intensity-modulated treatment fields delivered with an MLC. With present algorithms, this is usually accomplished by irradiation of a flat phantom before actual treatment.29 The images of the subfields composing the intensity-modulated field are summed in the computer to obtain a 2-D intensity pattern (Fig. 8-12), which is compared with the intended pattern from the treatment planning system. Other uses of EPIDs include transit dosimetry to measure the accuracy of dose delivery during treatment, and in accelerator quality-assurance procedures.30,31
Limitations
There appears to be a systematic degradation of portal image quality with increasing accelerator beam energy. This is attributable to a reduction in subject contrast and in resolution, although the relative importance of these factors is uncertain. Although the decrease in contrast with photon energy, changing from the kiloelectron volt (keV) to megaelectron volt (MeV) range, is a result of the reduced probability of photoelectric interaction, the reduction in image quality with sources higher than 1 MeV cannot be similarly explained and may be caused in part by the increased range of Compton electrons generated in the front screen for film, or in the conversion plate and phosphor screen for CR and electronic portal imaging systems.32 At the high end of megavoltage photon energies, the situation is further complicated by increased multiple photon scattering and some increase in pair production. Additional degradation of cobalt-60 beam images is caused by blurring caused by the relatively large cobalt-60 source size.
Portal Radiograph Quality Assurance
Most EPIDs require a calibration process to correct for inherent systematic artifacts (e.g., variations in sensitivity across the detecting device). For amorphous silicon EPIDs, the electronic noise and sensitivity of the photodiode pixels can vary with time. The AAPM Task Group 58 has reported on acceptance testing, commissioning, and periodic quality assurance of EPIDs.27 The recommended quality-assurance tasks include tests of the collision interlock system that prevents collision of the EPID with the couch or patient, accuracy of the EPID positioning relative to the isocenter, image artifacts, image resolution and noise using phantoms designed for this purpose, and geometric localization accuracy.
In-Room Kilovoltage Radiography
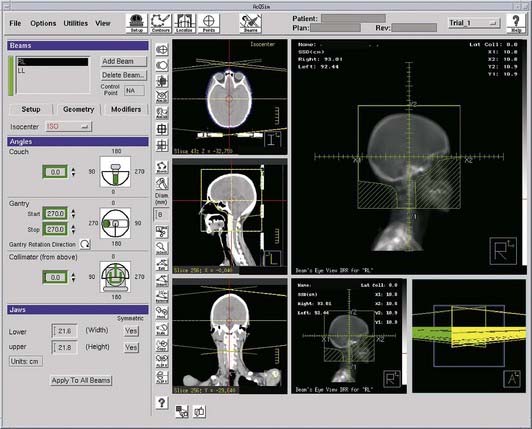
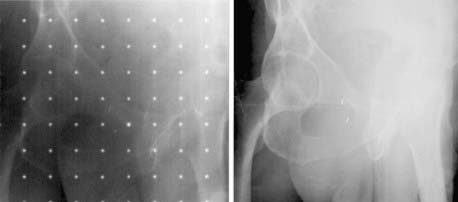
The advent of large-area flat-panel x-ray detectors has led to widespread use of kV image guidance systems for patient positioning in the treatment room. At present, several kV imaging developments have evolved into commercial products that use one or more image detectors together in combination with kV x-ray sources in the treatment room.33–37 The near-diagnostic quality of kV radiographs facilitates automatic image registration and beam alignment just prior to treatment or in real time during treatment, often in combination with implanted fiducial markers (Fig. 8-13). A single radiograph provides 2-D information, whereas two imaging systems enable stereoscopic 3-D imaging. Gantry-mounted systems (Fig. 8-14) provide radiographic as well as cone-beam CT capabilities (described in the next section); such systems are generally mounted at right angles to the treatment beam.
In-Room CT-Based Systems
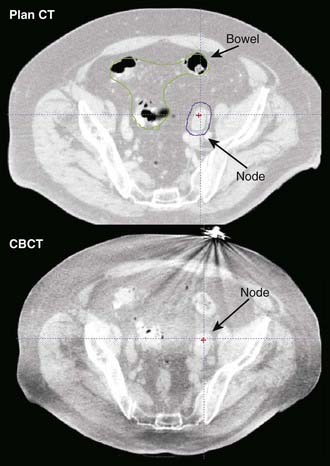
The principal advantage of CT-based systems in the treatment room over radiographs is that they provide volumetric anatomical information, including soft tissue localization. The use of repeat CT scans during treatment as a means of measuring and reducing target positioning errors has become increasingly widespread; Chapter 12 gives a more extensive description. Different types of systems for imaging the patient at the treatment accelerator are commercially available. “CT-on-rails” systems combine a linear accelerator and conventional CT scanner in the treatment room.38 Helical tomotherapy systems use a CT detector consisting of pressurized xenon gas within a tungsten septa-filled housing with the megavoltage beam (Fig. 8-15). Cone-beam CT systems make use of a 2-D flat-panel imaging sensor to acquire a volumetric image in a single rotation; such systems have been developed for use with megavoltage as well as kV x-ray sources (Fig. 8-16).39,40 The cone-beam geometry is actually pyramidal in shape, diverging both in longitudinal and lateral directions with its apex at the x-ray source. The source-detector pair moves around the patient to collect a set of 2-D projection images, which are then processed with a cone-beam reconstruction algorithm to obtain a 3-D image set.
Electromagnetic Marker Tracking
An emergent localization technology uses implanted electromagnetic transponders whose position is detectable with nonionizing radiation, providing continuous real-time monitoring. The position of the transponders is detected at a rate of 10 Hz with an electromagnetic source-detector array placed close to the patient.41 Application of this system for prostate localization and real-time position monitoring has been demonstrated.42
Optical Methods
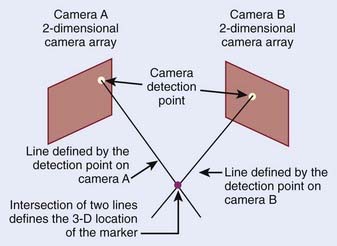
Optical imaging systems provide positional information on the external anatomy, and commonly use infrared light to determine an object’s location. The object can be active, such as an infrared emitter; passive markers consisting of spheres or disks that reflect the infrared light; or the patient’s surface acting as a reflector. The optical detectors are usually CCD cameras, which are a collection of light-sensitive cells or pixels arranged in a 2-D array, producing a digital image. An optical system consisting of two such CCD cameras provides stereoscopic 3-D information of the detected objects (Fig. 8-17).
The first commercially available optical system for radiotherapy localized patients by means of detecting passive markers attached to a biteplate.43 An early system for extracranial treatment enabled tracking of reflective spheres attached to the patient’s torso.44 A respiratory monitoring system, in which infrared light from an illuminator is reflected from a passive reflective block placed on the patient and detected by video camera, is widely used in connection with respiration-correlated CT, breathing-synchronized fluoroscopy, and gated treatment on a linear accelerator.7 More recent optical patient positioning systems use stereoscopic imaging of a speckle pattern projected onto the patient,45 or imaging of the intersection of a scanned fan-shaped, laser beam with the patient.46
Nuclear Medicine Imaging in Radiation Oncology
The strength of nuclear medicine imaging is that it is several orders of magnitude more sensitive than other imaging modalities. How sensitive depends on the radiotracer used. For example, the typical concentration of 18F-fluorodeoxyglucose (FDG) uptake in a lesion is 0.5 picomole (i.e., almost nine orders of magnitude lower than the mmole concentrations required for 19F-FDG NMR).47 Nuclear medicine operates by the “tracer principle,” in which a biomolecule is labeled, is injected into the body, and serves as a precursor for the biomolecule it mimics. Some tracers are chemically identical to the biomolecules they mimic (e.g., 11C-glucose or 11C-methionine). Others are synthetic precursors such as 18F-FDG and 123I, 124I, or 131I-iododeoxyuridine, which are not chemically identical, but sufficiently similar to participate in the biochemical process of interest, albeit with slightly altered metabolic rates. The number of possible tracers for nuclear medicine imaging is potentially infinite.
Single Photon Emission Gamma Camera Imaging
Uses and Limitation of Single Photon Emission Gamma Camera Imaging in Radiation Oncology
Nuclear medicine studies are rarely the primary method of choice for the diagnosis of tumors, with the exception of the role of radioiodine in thyroid cancer, for which it also plays an important role in therapy.48 Nuclear medicine is a sensitive method for the detection of metastatic spread of disease, the most widely used of which is the bone scan agent technetium-99m methylene diphosphate, for determining the extent of metastatic spread to the bone.49 A methodology to quantitatively track the progression of bone metastases has been proposed by Imbriaco and colleagues,50 and is called the bone scan index. A broader class of tumor diagnostic (and therapeutic) tracers includes the somatostatin binding peptides, with selective binding to neuroendocrine cancers.51 Several groups have evaluated the use of 99mTc-sestamibi for the detection of breast cancer. One example is Lumachi and colleagues52 who reported that the sensitivity of sestamibi scintimammography reaches 100% in patients with breast lesions larger than 8 mm, and that the predictive value of mammography, sestamibi scintimammography, and mammography and sestamibi scintimammography together were 63.4%, 95.1%, and 97.6%, respectively. Lymphoscintigraphy is a procedure in which a radiotracer, 99mTc sulfur colloid, is injected subcutaneously into sites providing lymphatic drainage to the nodes of interest. Spot views are then taken with a gamma camera at two angles for stereoscopic localization of the nodes. The use of lymphoscintigraphy is the precise localization of the internal mammary and axillary lymph nodes, information from which can be used in the design of radiotherapy portals for breast radiotherapy and in guiding sentinel node biopsy. 123I and 131I-metaiodobenzylguanidine have been widely used for the diagnosis and therapy of neuroblastoma and pheochromocytoma.53,54 Gallium-67 citrate has been widely used for detection of cancer, in particular lymphoma,55 through targeting, internalization, and retention via the over-expressed ferritin receptor. The usefulness and complementarity of 67Ga SPECT and CT in the management of patients with lymphoma have been extensively demonstrated.56 However, 67Ga SPECT has also largely been replaced by FDG PET. Another general cell tumor viability tracer, 201Tl, has been used to diagnose tumors as well as measure residual tumor, such as in the brain, postradiation therapy.57 Others have used 201Tl SPECT imaging in addition to blood-flow images with 99mTc-HMPAO to assist in the differentiation between viable tumor and necrosis in the target definition for stereotactic radiosurgery.58
Radiolabeled monoclonal antibodies are a generic class of tumor targeting agents of greater specificity and selectivity, but have not gained widespread use, in part because of their complexity and expense. Whether antibodies will achieve their potential status as the ideal tumor-specific imaging agents still remains a question that is reviewed by Bischof Delaloye.59 The practice of radioimmunotherapy (RIT) for the treatment of non-Hodgkin lymphomas has resulted in considerable success and is being routinely performed within departments of nuclear medicine and radiology, medicine, and radiation oncology around the world.60,61 There are two approved anti-CD20 antibodies shown to be effective with low grade non-Hodgkin lymphomas. These are 90Y-ibritumomab tiuxetan (administered after a predose with 111In-ibritumomab tiuxetan) and 131I-tositumomab, which both induce high response rates, with durable remissions in patients with relapsed or refractory indolent non-Hodgkin lymphomas as well as when used as front-line treatment in patients with indolent non-Hodgkin lymphomas.62,63 Yet, in spite of more than 30 years of development, RIT has had limited success in the treatment of solid cancers.
Evaluation of Normal Tissue Toxicity
Nuclear medicine methods are routinely used to assess normal tissue function (e.g., lung, cardiac, stomach, renal). Although some nuclear medicine tests (e.g., gastric emptying) have not been shown to be sensitive predictors of radiation damage,64 others may be more useful. The most studied of these, in the context of radiation therapy, have been ventilation and perfusion studies of the lung. Boersma and colleagues65,66 and Damen and colleagues67 performed perfusion (99mTc-MAA) and ventilation (81Kr) studies in patients before radiotherapy for patients with Hodgkin lymphoma to determine the dose-effect relations for regional lung-function changes after radiotherapy. Pulmonary function of 25 patients was re-evaluated 3 to 4 months after irradiation for malignant lymphoma from the 3-D dose distribution, looking at relative reduction of local perfusion and ventilation. By combining the 3-D dose distribution with the average dose-effect relations for local perfusion or ventilation, an overall response parameter was calculated before irradiation, which is predictive for the radiation-induced change in the overall pulmonary function, and possibly for the incidence of radiation pneumonitis, in this group of patients. To determine local dose-effect relations for lung perfusion and density changes caused by irradiation for patients with non–small cell lung cancer (NSCLC) and to quantify the effect of reperfusion, Seppenwoolde and colleauges.68 performed SPECT perfusion analysis of 25 NSCLC patients before and after radiotherapy against a reference group of 81 patients with healthy lungs. The study concluded (1) that well-perfused lung tissue of patients with NSCLC behaves like healthy lung tissue with respect to radiation, (2) that there was a dose-effect relation for perfusion and CT density that extended for doses up to 80 Gy, and (3) that the radiation damage in poorly perfused lung regions was less than predicted as a consequence of local reperfusion.
Valdes Olmos and colleagues69 demonstrated that 111In-pentetreotide SPECT scans can delineate areas of radiation pneumonitis, through correlation with areas of decreased ventilation and perfusion and x-ray abnormalities, and may be a potential method of assessing radiation damage.
Work is ongoing to evaluate perfusion-weighted optimization in radiotherapy treatment plans for patients with NSCLC. Seppenwoolde and colleagues70 compared treatment plans in which the beam weights directed through the hypoperfused lung regions were increased versus geometrically optimized plans (Fig. 8-18). For patients with one hypoperfused hemithorax, an estimated gain of 6% of the prescribed dose compared with the geometrically optimized plan was reported. No advantage was found in patients with small perfusion defects. Others have also explored the potential to use intensity-modulated radiation therapy (IMRT) for functional lung volume avoidance defined by perfusion scans in the radiotherapy of NSCLC.71
Chapman and colleagues72 have described the potential of SPECT imaging to identify multiple radiobiologic features of the tumor using multienergy window SPECT that allows the simultaneous acquisition of two tracers. These could include tracers to identify hypoxia and blood flow, tumor growth rate, and, if they can be identified, tracers selective for intrinsic tumor clonogen radiosensitivity.
123I-Labeled iodoazomycin arabinoside is a single-photon radiotracer that has been successfully used for the clinical imaging of hypoxia in solid tumors, peripheral vascular disease of diabetic origin, blunt brain trauma, and rheumatoid joints.73 However, these efforts have been largely replaced by positron-emitting tracers on account of the higher sensitivity and quantitative power of PET.
Positron Emission Tomography
The radionuclides required for PET are those that undergo β+ decay. There are numerous positron emitters in the table of nuclides, at least one for almost every element in the periodic table. Those that have already been used with PET clinical radiopharmaceuticals include 11C, 13N, 15O, 18F, 60Cu, 64Cu, 82Rb, and 124I, and the list continues to grow. In spite of the wealth of opportunity to work with a practically limitless number of radiolabeled compounds, clinical PET remains dominated by FDG. This is largely because FDG is the only reimbursed agent for tumor imaging, but also reflects the regulatory difficulties in obtaining approval for new radiopharmaceuticals. However, the exploration of new tumor-imaging radiotracers, and their preclinical evaluation in tumor-bearing animals on small-animal imaging scanners, forms a backbone of molecular imaging, and this field is expected to grow substantially over the next decade. The ideal isotope for PET imaging is fluorine-18 on account of its 110-minute half-life, high 100% positron yield, and low positron energy (Eav = 0.242 MeV) resulting is a short average positron range of 1.4 mm in water. Positrons lose energy on their passage through tissue until they subsequently undergo annihilation with an orbital electron of one of the atomic constituents of tissue. This electron-positron annihilation results in two almost collinear (180 degrees ± 0.3 degrees) photons of 511 keV (the rest mass energy of an electron-positron pair). The coincident detection of these two photons forms the basis of PET. The positron range with the noncollinearity of the 511 keV photons constitute the fundamental physical resolution limits of PET, which, combined with the size of the detector elements, results in the ultimate scanner resolution. Current whole-body scanners possess a spatial resolution of between 5 and 8 mm full width at half maximum (FWHM). However, dedicated brain PET scanners can achieve a resolution as high as 2.3 mm FWHM74 such as reported on the high-resolution research tomograph for brain research. PET scanners can operate in 2-D or 3-D mode. The difference between 2-D and 3-D lies in whether the acquisition is performed using septa (2-D) or without septa (3-D). The septa serve to restrict the lines of response from the individual (and adjacent) detector rings. In 3-D acquisition mode, no septa are used and oblique lines of response are accepted between several rings of detectors resulting in two- to threefold higher scanner sensitivity for the detection of true coincident events, but with no significant change in scanner resolution.
For general reviews of PET, the reader is referred Humm and colleagues75 for a discussion of the scanner properties, and for the clinical use of FDG PET to Hoh.76
Principles Of Operation
PET also has the ability to acquire scans in a dynamic mode of a single field of view, providing temporal resolution of the tracer uptake within a tumor or organ of interest. This type of acquisition is usually employed when investigating new radiotracers (for example to ascertain the optimum imaging time post–tracer injection), or when compartmental analysis is being used to estimate the rate of tracer metabolism or entrapment in a specific intracellular biochemical process. In its simplest form a dynamic acquisition consists of a single field-of-view scan, in which the full duration of the scan is divided into numerous successive time frames (or bins) that allow the kinetics of the tracer within regions of interest (ROIs) to be visualized and plotted to be observed. Dynamic data, gleaned from the images of successive time frames, are frequently used in compartmental models to generate parametric images (i.e., metabolic rate images). One example is dynamic FDG images of the brain, which, using the Sokoloff compartmental model and measurement of the arterial input function, can be converted to a regional glucose metabolic rate.77 Dynamic imaging is also useful when establishing the optimal imaging time for a new radiopharmaceutical.
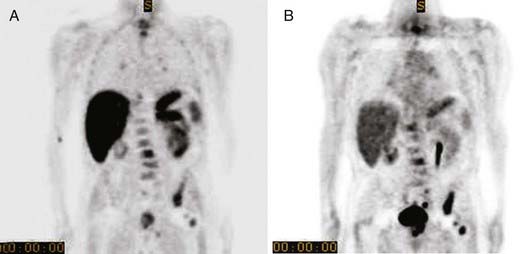
When the emission data are reconstructed, it results in a tomographic image set that has not been corrected for attenuation of the 511 keV photons in the patient. Such images exhibit a characteristic hot periphery relative to the central body organs, which appear cold. To rectify this bias, an attenuation map of the patient is used to correct the emission data. On dedicated PET scanners this map was obtained by a transmission scan of the patient, using either a long-lived (270-day half-life) positron generator (68Ge → 68Ga) or a 137Cs singles source, in which the linear attenuation coefficient of 662 keV is scaled to 511 keV. Because practically all PET scanners in current operation are now PET/CT units, the attenuation map for PET reconstruction is derived from the CT image set in which the attenuation (µ) map is scaled from CT energies to 511 keV.78–80
FDG Positron Emission Tomography
FDG is an almost ubiquitous cancer-imaging agent for PET. The basis for tumor visualization by PET is the elevation of glucose metabolism by most malignancies. Most PET studies performed today are diagnostic FDG scans. Wahl has edited an excellent book that summarizes FDG PET within different tumors.81 The increased level of glucose metabolism by cancer cells is frequently reported in clinical practice by the standardized uptake value (SUV). This is a quantitative measure of FDG uptake defined by the ratio of the activity per cm3 in tumor (per gram assuming unit density tissue) to the administered activity per unit patient mass:
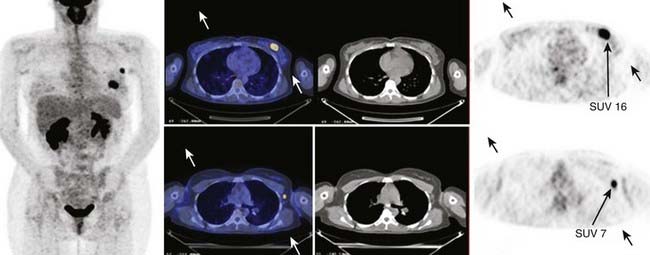
An example of an FDG PET/CT scan of a patient with ductal carcinoma with a positive level I lymph node is shown in Fig. 8-19 in which the SUV is indicated for both the primary and metastatic disease sites. Clinical scanners are routinely equipped with an SUV tool, which allows clinicians to draw an ROI around the tumor from which the SUV is automatically calculated. The SUV can be used to differentiate between benign and malignant disease. For lung nodules, an SUV greater than 2.5 is commonly indicative of malignant lung cancer, although other factors, such as size, shape, and location may reinforce the nuclear medicine clinician’s judgment. The magnitude of the SUV is often believed to be correlated with tumor aggressiveness. The variability among tumor types, patients, and even among lesions in the same patient suggests a large variability of glucose metabolism within tumors.82 There is now strong evidence to support the role of FDG PET in cancer staging.83 In lung cancer there is a large body of evidence convincingly demonstrating that locoregional lymph node staging by FDG-PET/CT is significantly superior to CT alone.84,85 In lymphoma and melanoma, PET/CT has been shown to improve the accuracy of staging as well as response assessment over that of conventional anatomic imaging.86,87
Artifacts In PET/CT Imaging
The µ maps obtained from the CT data are scaled for 511 keV photons. This scaling is inexact because the selected kV setting (80-140 kVp) results in an x-ray spectrum that hardens with increasing body thickness. Therefore the effective beam energy is not constant. Carney and colleagues discuss a method of CT attenuation for different kVp CT operater settings.80
When CT contrast agents are used, the high atomic number (Z) of these materials further contribute to errors in the coefficients used for the PET attenuation correction. The magnitude of errors in the SUV determination have been carefully measured for intravenous contrast by Mawlawi and colleagues88 who examined differences with patient PET data when attenuation corrected with the contrast and noncontrast CT scan data. ROIs drawn over the heart showed an SUV(max) increase of up to 16.7%, but for soft tissue masses discrepencies of less than 9% were found. The effect of giving the contrast intravenously is small because of the rapid dilution and clearance of these agents from the blood compartment. Such dilution and clearance is significantly slower for oral constrast agents that can remain highly concentrated in the body for several days. CT attenuation correction around regions of oral contrast pooling can result in significantly greater errors and even in the appearance of false positive emission images.89,90 These PET image artifacts occur because of the misclassification of contrast as bone.
Nehmeh and colleagues91 developed an algorithm to properly transform CT numbers in the contrast regions from CT energies (40-140 keV) to PET energy at 511 keV, which was validated in phantom experiments using BaSO4 at concentrations ranging from 0% to 80% using 68Ge rod source attenuation correction as the “gold standard.” The algorithm was also tested in a clinical case, in which discrepencies in the SUV(max) measurements of up to 66% were found, depending on whether CT or 68Ge rod source attenuation correction were performed, reducing it to less than 5% when the correction method was applied.
Truncation artifacts can be produced when the patient’s arms extend beyond the CT field of view, which leads to errors in the attenuation correction associated with the unaccounted tissue beyond the CT field of view. Modern PET/CT scanners allow for extended field of view reconstruction that remedies this problem for all but the very largest patients. A combined phantom and patient evaluation of SUV errors resulting from truncation artifacts was performed by Mawlawi and colleagues.92 PET images were reconstructed using attenuation maps from truncated and truncation-corrected CT images. Truncation artifact manifests as a rim of high-activity concentration at the edge of the truncated CT image with an adjacent low-concentration region peripherally.
Respiratory motion is the largest source of error when visualizing PET/CT image data, and the most extensively studied. There are several techniques for reducing or compensating for respiratory motion. The simplest approach is to attempt to acquire both the CT and PET during gentle breathing to minimize the mismatch between the data sets during the acquisition phase. Although such results may be adequate for visual diagnosis, they are inadequate for tracer quantification or radiation therapy applications. Despite rapid advances in PET scanner instrumentation, it remains unlikely that sufficiently short scan times will be achieved to allow the acquisition of a PET scan in one single breath-hold. For this reason, respiratory gating approaches have been developed to reduce and correct motion image blurring and recover the quantitative accuracy of PET.93
There are at least two approaches to respiratory gating. These consist of approaches that are extensions of cardiac gating, in which the PET acquisition is divided into a number of individual bins (usually from 4 to 10) corresponding to different phases of the respiratory cycle, wherein the gating trigger may be either amplitude or phase-based. For respiratory gating, this trigger can be derived from a number of sources: a spirometer, nasal thermistor, pressure sensor to detect the external respiratory motion,94 or the respiratory management system. All of these sensors provide the means to track respiratory motion in real time. In cardiac gating, the trigger is generated from an electrocardiogram. Because both the respiratory and cardiac cycle can affect tumor motion, depending on the position of the lesion, either type of gating may be required.95 The second approach uses the so-called list-mode acquisition capability of the PET scanner. In list mode, the data, instead of being sorted into histograms for rapid reconstruction, are collected as a raw data stream composed of the detector pair, the energy deposit per detector, and the time the event was recorded. Data collected in this way, in sychrony with any respiratory motion tracker device, can be used to select events according to the desired breathing phase or amplitude.
Respiratory gating, or the equivalent list-mode censoring of the data, does require slightly longer acquisition times, to compensate for reduced counting statistics, but offers the benefits of improved image contrast and tracer quantification within the tumor.93,96 Numerous recent effects have focussed on minimizing the wasted signal counts through modelling the motion of ROIs within the lung, with the intention of repositioning the counts from respiratory phases of no immediate use into those of interest to both improve diagostic accuracy (potentially improving the limits of detectability) and radiotherapy target definition. Motion-incorporated reconstruction methods for gated PET imaging are also under development.97–99
Gated PET acquisition allows selected reconstructed PET images to be obtained from different phases of the respiratory cycle. These need to be matched to the appropriate CT corresponding to the same phase of the respiratory cycle. This is achieved through 4-D PET-CT acquisition.100 The effect of mismatched PET/CT data on PET quantification is described by Erdi and colleagues.101 Pan and colleagues102 and Chi and colleagues103 have developed a method of generating a respiratory motion averaged CT scan with which to perform the PET emssion data attenuation correction. Whereas there are insufficent counts in a single breath-hold to form a statistically useful PET image, Meirelles and colleagues104 and Nehmeh and colleagues105 have shown that summing the PET data from nine or more breath-hold scans can produce exquisite diagnostic PET/CT images that may yield the highest limits of lesion detectability.
Uses of Positron Emission Tomography
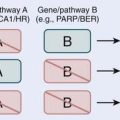
The visualization of FDG (or any other tracer) images requires considerable care, because the viewing windows are less well defined than for CT. Therefore, the PET window in fused PET/CT displays may be set to provide the best match between PET and CT.106 This practice can result in a misleading complacency. Erdi and colleagues107 defined the PET window setting based on phantom studies, in which spheres of known size, representing lesions, were imaged within different 18F background levels. This study concluded that to accurately define the lesion size, the optimum window setting should set the upper window level to the maximum intensity voxel and the lower level set at a value of 42% of the upper level for spherical lesions of size greater than 4 cc. For smaller lesions, in which partial volume effects become significant, the optimum threshold level increased higher than 42% because of the resolution constraints of the camera. Furthermore, the lower-level threshold is not independent of the contrast (lesion–background ratio). Lower contrast necessitated elevating the lower threshold level, if accurate lesion volumetrics were to be obtained. Such empirical methodologies are effective at accurately determining lesion size within a homogeneous background (such as the lung) in which the methodology has been validated, but become problematic when attempting to unambiguously define the boundaries of a lesion within a nonuniform background (e.g., the prostate, because of the close proximity of the bladder). Several recent papers have appeared describing the variability in the appearance of lesion size when different proposed methods are applied to identify lesion boundaries. Schinagl and colleagues108 compared five methods of tumor delineation from FDG-PET compared with CT-based delineation. Seventy-eight head and neck cancer patients were evaluated, for whom the primary tumor was delineated on CT, and compared with five PET-based gross tumor volume (GTV) determinations: (1) visual interpretation, (2) applying an isocontour of a SUV of 2.5, (3) using a fixed threshold of 40% or (4) 50% of the maximum signal intensity, and applying (5) an adaptive threshold based on the signal-to-background ratio. Whereas there was considerable variability in the results given by the different PET segmentation methods, the authors reported that on average all threshold-based PET-GTVs were smaller than on CT. Nevertheless, PET frequently detected significant tumor extension outside the GTV delineated on CT (15%-34% of PET volume). This study underscores that simple SUV threshold cannot be expected to handle the subleties of FDG uptake within tumors. This can be appreciated from autoradiographic images of FDG uptake that exhibit marked nonuniformity determined by microenvironmental factors.109 For this reason, more sophisticated methods are being developed. Examples include the Gaussian mixture model segmentation technique proposed by Aristophanous and colleagues110 tested on selected PET tumor regions from NSCLC patients. The Gaussian mixture model assumes that the FDG uptake can be represented as a mixture of Gaussian densities representing different classes such as background (B), uncertain (U), and target (T). Another example is the morphologic filter-based approaches of Geets and colleagues.111
Greco and colleagues112 investigated the effect of a PET-derived contour on treatment planning with respect to the CT-only target volume in lung cancer. This study reported that the most prominent changes in the GTV have been reported in cases with atelectasis and following the incorporation of PET-positive nodes in otherwise CT-insignificant nodal areas. Although interobserver variability was still present following target-volume delineation with PET/CT, it is greatly reduced compared with conventional CT-only contouring. One of the difficulties of using PET in thoracic and abdominal tumors is the effect of respiratory motion, which blurs and reduces the tumor volume.
One of the tumor sites that has received the most attention regarding the incorporation and use of FDG PET images for radiation treatment planning is head and neck cancer.113–116 Here the patient can be rigidly immobilized, allowing nongated PET studies of high quality. Yet how the PET information is used to delineate the tumor boundary or modulate the treatment plan varies between centers.
One of the difficulties of determining the accuracy of PET for defining the tumor volume is the lack of surgical corroboration. Such studies are of course extremely difficult to perform. One of the only such studies to attempt to compare the accuracy of different imaging modalities (CT, MRI, and FDG PET) against surgical data is the study by Daisne and colleagues117 for head and neck cancer. In a comparison of the GTV determined by each modality, it was concluded that the FDG PET volumes were smaller but, surprisingly, for the nine available surgical specimens PET was the most accurate.
There are numerous reviews on the use of FDG PET in radiotherapy planning for lymphoma, esophageal, and other cancers, and the reader is referred to them for more details.118–122
Dose Painting
An addition to the use of PET to provide metabolic information into the procedure of target-volume delineation is the concept of using PET for biologically based IMRT, so-called dose painting or sculpting.123,124 This is a large emerging field driven by advances in molecular imaging and its potential ability to determine radiobiologic attributes of the tumor noninvasively. Three of the most promising intratumor targets for dose painting are (1) FDG defining regions of highest glucose metabolism, (2) fluorothymidine (FLT) defining regions of highest cell proliferation, and (3) hypoxia tracers of which the earliest was 18F-fluoromisonidazole (18F-FMISO). Several alternative tracers are under investigation in radiotherapy-motivated clinical trials.
The FDG uptake within a voxel can depend on many factors: cell number, fraction of tumor or stroma, cell type, distance from capillary supply, PO2, mitotic index, inflammation, and so on. Until the dependence on these factors is better understood, caution is advised if FDG is to be used for dose painting. Nonetheless, studies have been performed to assess the feasibility FDG PET–guided IMRT dose escalation in head and neck cancer, in which an upfront simultaneously integrated boost dose was administered to 18F-FDG PET–delineated tumor subvolumes within the GTV.125 Dose-limiting toxicities resulted in the halting of this study. Pugachev and colleagues126 investigated the microenvironmental determinants of FDG uptake in a rodent prostate cancer model and used autoradiography to show the highest regions of FDG uptake were correlated with regions of hypoxia. Rajendran and colleagues127 showed that FDG was positively correlated with regions of hypoxia defined by 18F-FMISO imaging, but also found regions of high FDG uptake in regions not high in 18F-FMISO uptake. In recent work by Thorwarth and colleagues,128 the FDG distribution was proposed for a uniform dose escalation of 10%, with a dose painting by numbers approach to the hypoxia map defined from dynamic 18F-MISO images. Schwartz and colleagues129 performed theoretical IMRT plans to explore dose painting to FDG hot spots in which 66 Gy was prescribed in 30 fractions to FDG-avid CT abnormalities and nodal zones directly involved with disease, without prophylactic coverage of uninvolved neck levels. After 66 Gy, FDG-avid disease with 0.5-cm margins was boosted in 220 cGy increments until dose-limiting criteria were reached, but caution is advised on the routine clinical use of FDG-directed treatment planning until the accuracy of FDG PET/CT is fully validated.
Of greater potential relevance for radiation oncology are PET tracers that are associated with cellular proliferation. The most widely used proliferation tracer is 18F-FLT,130–133 whose uptake is regulated by cytosolic S-phase-specific thymidine kinase 1 resulting in the tracers’ selective intracellular entrapment in dividing tumor cells. FLT uptake has been shown to correlate with pathology-based proliferation measurements, including the Ki-67 score, in a variety of human cancers.134 However, FLT PET scans generally exhibit a lower overall uptake with SUVs less than three being typical, with high levels of activity in liver and bone marrow. In a multicenter study conducted in China by Tian and colleagues,135 16 patients with malignant tumor, 16 with tuberculosis, and 23 with other benign lesions were evaluated by both FDG and 18F-FLT PET/CT. The sensitivity for malignant tumor was 88% for FDG, significantly higher than for FLT (59%). However, 18F-FLT exhibited higher specificity at 77% versus 69% for FDG. This study reported that a combination of dual-tracer PET/CT improved the sensitivity and specificity up to 100% and 89.74%. A study investigating the use of FLT in the brain by Ullrich and colleagues136 showed limited correlation of the FLT images with viable tumor in high-grade gliomas but that kinetic analysis of 18F-FLT tracer uptake could provide an in vivo assessment of tumor proliferation. The value of compartmental modeling to enhance the value and potential validity of PET imaging of radiotracers such as FLT is an area os active research.
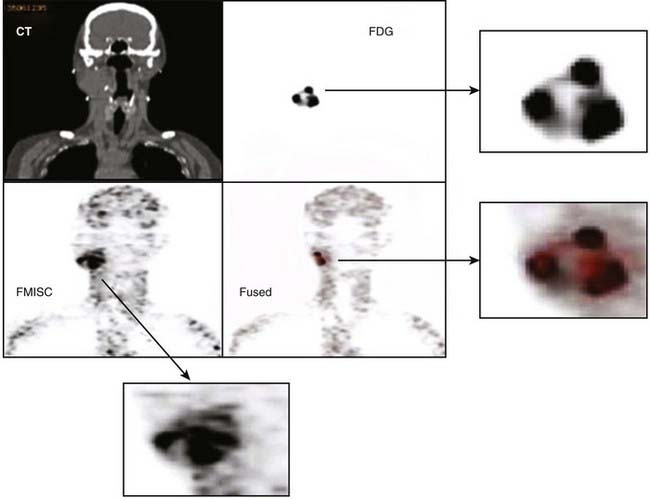
Some of the radiotracers that have attracted the greatest interest for evaluating tumor response as well as for potential application in dose painting are the hypoxia markers.72 This is a consequence of the long-held belief that hypoxia is a major cause of treatment failure in radiotherapy, resulting from the radio-resistance of cells under low partial oxygen pressure. Whether this is true or untrue (because of tumor reoxygenation between treatment fractions), a noninvasive technique to measure tumor hypoxic fraction would allow the role of hypoxia as a therapy outcome prognosticator to be determined. Several hypoxia radiotracers have been proposed. The first to be extensively studied was fluoromisonidazole (18F-MISO) which was introduced into the clinic by Rasey and colleagues137 and has since been continued by Rajendran and colleagues138 who have demonstrated the ability to acquire good-quality images of tumor in head and neck, lung, brain, soft tissue sarcomas, and other tumors. It is recognized that such images of hypoxia may be useful for use in IMRT dose painting. One difficulty of 18F-MISO is associated with the short 110-minute half-life of 18F, restricting image acquisition to a maximum of about 3 to 4 hours postinjection, and at a time when the hypoxia tissue/blood ratio is only 1.3 to 1.4. As a consequence, 18F-MISO images are frequently of poor contrast. This results in the difficulty that any threshold level used to discriminate intratumoral hypoxia from nonhypoxia is highly sensitive to the threshold setting. An additional difficulty is the reproducility of the hypoxia imaging under these low contrast conditions. Nehmeh and colleagues139 analyzed the intratumor distribution of 18F-FMISO from 20 head and neck cancer patients who underwent two pretreatment baseline scans to assess the reproducibility of hypoxia imaging for the purpose of dose painting. This study revealed considerable variation in the voxel correlation between scans caused by a combination of count statistics, differences in scan time post injection, and acute changes in the tumor hypoxia. An example of 18F-FMISO PET scan, showing the complexity of the intratumor distribution displayed alongside FDG and CT of the same patient, is given in Fig. 8-20. Nevertheless, preliminary studies to investigate the feasibility of 18F-FMISO for treatment planning studies in head and neck cancer patients based on these scans have been described.140,141
Other 18F hypoxia tracers are being explored, with higher octanol/water partition coefficient, with the hope that these will provide greater contrast (e.g., 18F-FETNIM, 18F-EF5, and 18F-FAZA).These are also being explored to define targets for hypoxia dose painting.142–146 The compound EF5 was initially developed as an exogenous immunohistochemical marker of tumor hypoxia using fluorescently tagged antibody. Evans and colleagues147,148 have shown the prognostic significance of hypoxia in brain tumors as well as in head and neck squamous cell tumors, based on quantitative immunohistochemistry of tumor tissue supporting the development of 18F-labeled EF5 as a PET imaging agent.
Studies are ongoing to overcome the low contrast associated with 18F-labeled hypoxia imaging agents and statistical variability and highly time-dependent hypoxia-to-background ratio observed in single-time point imaging with 18F-FMISO by using compartmental analysis of dynamic 18F-MISO data.149,150 One of the models used to determine the rate of hypoxia tracer entrapment is described by Casciari and colleagues.151 Such models use the pharmacokinetics of tracer uptake extracted from dynamic PET emission data of the tumor and the arterial input function data (from arterial samples or ROIs over arterial blood) for the generation of parametric images, in which the voxel intensities reflect the rate constants for radiotracer entrapment. These rate constants are believed to be proportional to the amount of hypoxia within each PET voxel.
Another class of PET hypoxia radiotracer that has been extensively investigated in the context of radiotherapy applications is Cu(II)-diacetyl-bis(N4-methylthiosemicarbazone) (Cu-ATSM), which can be labeled with several positron-emitters: 62Cu (T½: 9.74 min), 60Cu (T½: 24.0 min), or 64Cu (T½: 12.7 hr). The group at Washington University, St Louis, has shown interesting data suggesting an inverse correlation between the level of 60Cu-ATSM uptake in tumor and clinical outcome in NSCL cancer, as well as for cervical carcinoma patients.152–154 These findings provide strong support for the hypothesis that hypoxia is a negative prognostic indicator of radiotherapy outcome. Prior to these studies, preclinical investigations in a rodent model demonstrated a correlation between oxygen electrode measurements and 60Cu-ATSM accumulation. Chao and colleagues155 conducted a study to demonstrate the feasibility of biologically based IMRT with the selective targeting of dose to regions of high 60Cu-ATSM accumulation. The mechanism of hypoxia targeting of Cu-ATSM is still under investigation, but it believed to be an effective tracer for some but not all tumors.156–158
Evaluation of Treatment Response
PET provides an alternative perspective relative to CT and MRI in measuring treatment response. Several centers perform FDG scans pre- and postchemotherapy and radiation therapy. The ability to discern viable from necrotic tissue has been an important application of PET, and was first used to assess response after stereotactic radiosurgery.159 However, the difficulty of separating viable tumor posttherapy from inflammation has reduced the reliability of FDG as a quantitative index of response. The potential use of FDG in measuring radiation response has been expressed by Oku and colleagues160 who reported, for rectal carcinoma, a change in the mean value of SUV from 7.6 to 4.2 before and after radiotherapy. There was a significant difference in SUV reduction between the groups with and without recurrence, suggesting SUV to be a good prognostic indicator for long-term prognosis of rectal cancer patients. Allal and colleagues161 and Greven and colleagues162 have assessed the value of PET FDG in predicting the outcome of radiation therapy for head and neck cancers, concluding that there is little use in early scans 4 weeks post treatment, but improved predictive capacity at several months post therapy. Erdi and colleagues163 investigated the changes in FDG uptake in two lung cancer patients throughout the course of fractioned therapy, imaging patients weekly from before the treatment until the completion of treatment. This study was the first to describe the metabolic changes to the tumor that occurred during the whole course of radiation therapy, and provided a discussion of the observed effects of the radiation on normal tissues in the treatment field. The authors report essentially no changes in normal tissues at doses lower than 9 Gy (four fractions). By 18 Gy, increased FDG uptake was observed in the tissues in the back, suggestive of inflammatory changes in muscle and soft tissues at the treatment portal. At 27 Gy, there was intense FDG uptake associated with clinical esophagitis; by 36 Gy and by 54 Gy, significant reduction of uptake in the normal marrow of the lumbar spine was observed.
The value of PET-FDG in monitoring treatment response to combined chemoradiation therapy is clear in some disease sites. In esophageal cancers there are data that suggest patients with a greater than 55% drop in SUV(max) have a significantly improved progression free survival.164–166 In colorectal cancers, data suggest patients who respond have a greater than 67% decline between baseline and presurgical assessment.167,168 PET-FDG is now widely used to monitor treatment response to lymphoma, from therapies with or without radiation. These studies indicate that the persistence of metabolic activity as measured by FDG is a negative prognostic indicator for treatment response and also demonstrate that PET/CT imaging is much more effective than CT alone in predicting response to either chemotherapy or radiation.169,170 FDG PET scanning for recurrence after radiotherapy is complicated by the inflammatory response in the normal tissues surrounding the tumor. The clinical introduction of FDG PET scanning in brain tumors occurred earlier than for other cancers, because of the availability of dedicated brain PET scanners before the introduction of whole-body PET scanners in the early 1990s.171–173 The differential diagnosis of brain tumor recurrence versus radiation necrosis is difficult, because on cross-sectional imaging there may be significant mass effect that may increase over time and still be the result of radiation necrosis. For this reason, FDG scanning may be useful in certain situations to detect recurrence versus radiation necrosis, although radiolabeled amino acids may better serve this purpose (see next section). FDG PET is now being widely used to assess the radiotherapy treatment response and recurrence of head and neck cancers as well as for disease staging.174–178 Posttherapy false-positives have been a problem with FDG PET, but when posttherapy FDG is negative, a high-accuracy negative predictive value of 92% has been shown.179
Alternative Positron Emission Tomography Tracers
FDG PET has been so successful in diagnostic oncology that it has overshadowed the development of alternative tracers for cancer detection. But not all tumors image well with FDG, because of either low glucose metabolism or proximity to hot structures such as the prostate, unless they are high-grade tumors with metastatic spread.180 However, which tracers are useful for imaging tumor biology is a big unanswered question and a large area of active research. Some of the PET tracers that have been clinically used for tumor imaging include 11C-methionine, 11C-thymidine, 124I-iododeoxyuridine, F-FLT, 11C-choline, 11C-acetate, and 68Ga-DOTATOC.181–188
The short 20-minute half-life of 11C-based tracers limits the use of these tracers to hospitals with in-house cyclotrons and radiochemistry facilities, and requires the radiopharmaceutical to exhibit a rapid (~10-minute) uptake in the tissue of interest. Studies with 11C-methionine in prostate cancer has shown uptake peaking at approximetly 10 minutes postinjection with the tracer remaining at a plateau, thereby facilitating whole-body PET imaging with decay correction for this radiotracer.181,182 The low metabolic amounts accumulated in the bladder result in prostate images of excellent contrast for 11C-methionine as well as 11C-choline and 11C-acetate relative to FDG (Fig. 8-21). There is an increased interest in 11C-choline, because of evidence of its potential for distinguishing more aggressive versus less aggressive prostate tissue on the basis of differential incorporation of 11C-choline into cell membrane.189
This approach may offer a nuclear medicine alternative to choline-citrate nuclear magnetic spectroscopy. Studies have also reported potential advantages of 11C-choline over FDG for imaging of the brain and mediastinum.190,191 However, the short half-life of 11C limits the use of these PET tracers to hospitals with on-campus cyclotrons. For this reason, radiochemists have developed fluorinated amino acid tracers such as FACBC and fluorotyrosine.192–194 There is also a 18F-fluorocholine that has been successfully used for clinical imaging of prosate cancer.195,196 The utility of 18F-fluorocholine has been compared to sextant localization of malignant prostate tumors from 15 patients who underwent PET prior to radical prostatectomy. Histopathology demonstrated malignant involvement in 61 of 90 prostate sextants, indicating the potential value of 18F-choline PET at localizing dominant areas of malignancy within the prostate.
The use of thymidine analogs offers the potential to image cell replication directly, rather than a metabolic process inferring viability, which is especially important when measuring posttherapeutic response. Carbon-11–labeled thymidine was compared with FDG in a limited number of patients with lung cancer and sarcoma to evaulate treatment response.197 There were promising results, but difficulties associated with the short half-life led these investigators to pursue fluorothymidine (18F-FLT).129,130 Blasberg and colleagues184 have used 124I-iododeoxyuridine with PET to measure the proliferative capacity of brain tumors, although the low 0.24 positron abundance of 124I is a disadvatage for PET imaging with this isotope.
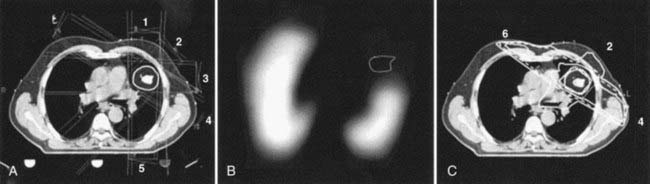
PET tracers also may play a role in assessing the aggressiveness of the disease phenotype. There are several examples of this arsing from multiple PET (or PET and SPECT) tracer studies. For example, patients with metaststic thyroid cancer may exhibit lesions with high radioiodine uptake and low (or negligable) FDG and vice versa, suggestive of a reciprocity of these two tracers in determining cancer differentiation. Good radioiodine uptake and low FDG SUV indicate highly differentiated disease, whereas high FDG and low radioiodine uptake indicate poor differentiation.198
Another class of nuclear medicine imaging agents, which may provide measures of the level of tumor differentiation, are the hormonal receptor binding tracers such as 18F-fluoro-17beta-estradiol (18F-FES) in which uptake has been shown to correlate with expression for estrogen levels in breast cancer199,200 and 18F-fluorodihydrotestosterone for androgen receptors in prostate cancer,201,202 which are now involved in preliminary clinical trials. Alternatively, antibodies with binding specificity for tumor-associated antigens, labeled with a long-lived PET tracer such as 124I,105 64Cu,106 and 86Y107 will provide the ability to perform serial PET imaging for tumor-specific antibodies for several days postadministration, with the benefits of greater quantitative accuracy needed for tumor and normal organ dosimetry during RIT trials. The high specificity of radiolabeled antibodies imaged several days postinjection (after wash-out from the blood compartment) can provide images of tumor-associated antibodies. Late imaging with 124I labeled cG250 antibody binds to carbonic anhydrase-IX, which is constitutively expressed in clear-cell but not non–clear-cell renal carcinoma. This allows presurgical identification of the histologic subtype that could have important implications for the choice of treatment for renal cancers.203
Image Acquisition and Processing
Image Acquisition, Communication, and Storage
Picture Archiving and Communication System
In modern hospitals and radiology departments, all imaging equipment produces and handles digital images, and data and is interconnected through a comprehensive PACS.204 In a standard PACS design, imaging modalities and equipment such as CR, ultrasound, CT, MRI, SPECT, PET, workstations, archive servers, and film printers are all connected together through a backbone or network. By design and function, a PACS encompasses principally the physical links and communication protocols between the imaging equipment (production, visualization, and printing) and the archival systems. Image production (e.g., individual modalities) and high-level processing and visualization are independent components that communicate through the PACS but are based on different technical principles. A PACS interacts with hospital information systems (HISs) and radiologic information systems (RISs). Whereas the HIS handles the demographics of a patient and his or her global management within the hospital mainly for administrative purposes, the RIS is targeted at radiology’s specific needs and deals with workflow management, including modality booking, clinical reading, and reporting. By natural extension in the age of the Internet, PACSs often include connections to the outside world for teleradiology and telemedicine applications.
Although the PACS concept initially suffered from a relatively closed proprietary approach of most manufacturers, PACSs now benefit from the widespread acceptance and deployment of the DICOM standard from the American College of Radiology–National Electrical Manufacturers Association.205 This standard provides a realistic foundation for the exchange and storage of all medical imaging data across and between compatible imaging and therapy equipment. Through its relative openness, DICOM has also provided a means for independent companies or academic entities to develop archival, imaging, and processing systems that can nicely complement the ones proposed by the major manufacturers.
Image Processing
Windowing
Most digital display systems have historically had a depth of 8 bits (also called a byte). This depth produces 256 (28) gray levels or monochrome luminance values from 0 to 255 (= 28−1), which is enough dynamic range for the gray nuances that can be differentiated by the human eye. In medical imaging, for example, because of the initial design of CT and limitations of analog-digital converters (ADCs), images generally have a depth of 12 bits (212 > values from 0 to 4095 = 212 −1, e.g., for CT) or more. From this discrepancy came early the need to optimally convert a 12-bit data set to an 8-bit representation. For this conversion, a simple proportional scaling ([0,4095] > [0,255]) is the most obvious solution. Because of the dynamic under-sampling that it implies, however (16 successive input values would produce only one output value), such an approach would then make it very difficult to assess the subtle dynamic variations that could actually be contained within the initial 12-bit (or more) data range. Because the full spectrum of 12-bit values is seldom of interest to radiologists, the concept of value windowing was introduced to expand the full contrast of the output/display range over the useful input dynamic range. For CT, absolute density (in Hounsfield units [HU], as described earlier) dynamic windows are either defined by minimum and maximum values or by center and width in absolute units. Most often on clinical systems, preset windows are used to increase the contrast of specific tissue types as the examples in Fig. 8-22A show. Combining several windows on a single representation also allows enhancement of the contrast of several normally disjoint density ranges (see Fig. 8-22A).
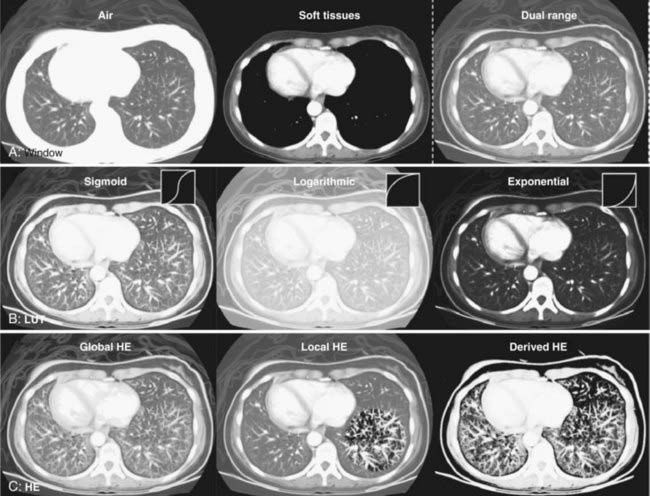
Lookup Tables
In current display systems, the conversion between a digital image and the display screen occurs through an LUT.206 An LUT simply converts an index derived from the input image data to an output value. This output value is then used to drive the luminance input on the display screen to produce a point with brightness proportional to the incoming signal at the corresponding image location (Fig. 8-22B).
Histogram Equalization
The appearance and contrast of images can be enhanced by other (e.g., nonlinear) means than display window or LUT shape. One such method is to redistribute the pixel values so that they optimally cover the complete available display range of Gy levels or intensities. The most common processing of this type relies on the histogram of the initial image. A histogram is a curve that shows, for every possible value in an image, the total number of all pixels at this value. Histogram equalization207,208 ends up redistributing the initial image values so that the new image’s histogram becomes uniform or linear. This range spreading, which can be confined only to select parts of the image, then produces an optimal contrast in the image (Fig. 8-22C), but, as with changing the shape of the LUT, will then suppress the direct linear relationship between displayed and original values.
Digital Filtering
Space versus Frequency
Any 2-D image can be described both in the spatial domain as a collection of pixels, or in the frequency domain (i.e., as a spectrum of frequency components) after a 2-D Fourier transform (FT).209 Because of the space/frequency duality of images through the FT, frequency-based filters can generally be defined and applied in either of these two domains (Fig. 8-23): (1) on spatial images, a kernel (2-D arrays of values defining a filter) is convoluted with the image: every pixel of the original image 2-D array is mathematically combined with the kernel to produce a new image; (2) on frequency representations, a filter function (frequency window, etc.) is multiplied with the 2-D frequency spectrum representing the FT of the original image. The result is then transformed back through an inverse FT to the original 2-D spatial domain in which the new image can be displayed.
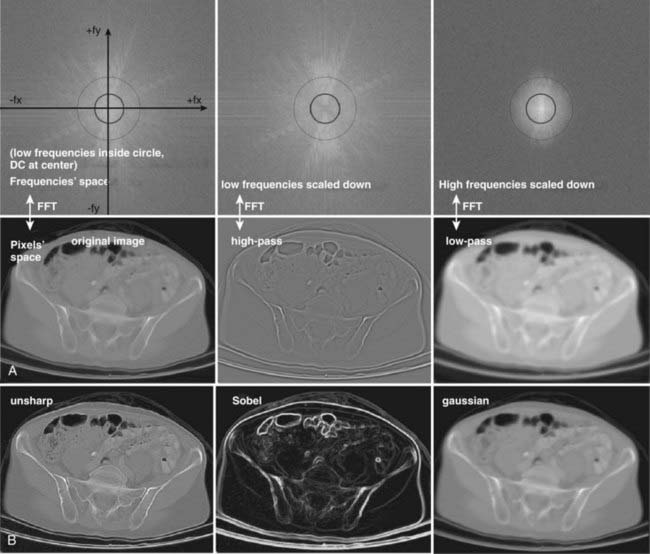
Smoothing Images
Images are smoothed to get rid of small details (e.g., irrelevant texture) or of some of the noise (e.g., high-frequency components). Such low-pass filtering preserves larger structures (e.g., characterized by low frequencies in the frequency domain) while strongly reducing the visibility of smaller ones (see Fig. 8-23).207,208 Although there are many more advanced ways, smoothing is most commonly performed through direct averaging of neighbor pixels through a kernel containing only 1s and 0s.
Enhancing Details and Edges
Several filters are designed to enhance or extract small features (i.e., high-frequency components) from images (see Fig. 8-23).207,208 High-pass and first- or second-derivative filters are generally based on the detection and enhancement of differences and discontinuities (characterized by high frequencies in the frequency domain) within the images. The major problem with such filters is their sensitivity to noise, which generally lies in the high frequencies. Therefore, enhancing small details and edges often results in simultaneously increasing noise in the same images. To reduce this effect, the output of the filters can be further combined with the original—smoother—image such as with the Laplacian-of-Gaussian and unsharp masking filters.
Image Segmentation
Contouring
A volume of interest (VOI) can be segmented from a volume of data with different techniques, depending on the data characteristics and on the requirements of the user.210,211 Contours can be drawn around a structure of interest on every slice that shows a part of it (Fig. 8-24). At the end of the process, these contours can be displayed on a workstation and interactively manipulated (translations, rotations, zooms) in real time to provide a relatively crude 3-D representation of the corresponding structure (see Visualization).
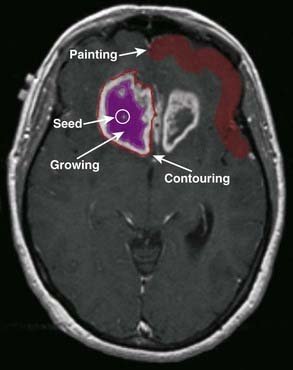
FIGURE 8-24 • Segmentation of a magnetic resonance brain tumor image through contour, painting, and region growing.
By preprocessing the initial image through edge filters, contouring can become semiautomatic and assist the user in defining more objective—and possibly accurate—outlines for the objects of interest. So-called active contours or snakes211,212 can be seen as an even more automated version of edge tracking. In active contouring approaches, an initial contour is modified (e.g., inflated) iteratively to maximize contents while preserving edges and minimizing the contour’s energy.
Tagging/Painting, Region Growing
Another manual way of extracting a structure of interest from an image volume is to paint or tag its pixels in every image that contains a part of it (see Fig. 8-24). A semiautomated variation of the painting approach is the thresholding of data that will extract only those voxels with a value—or other specific characteristics—that falls within a user-defined value range.
A variation of tagging is region growing, in which all voxels falling into some kind of user-defined condition (e.g., a combination of value range, texture, continuity, topology, gradient, shape, etc.) are joined together from one or several seeds inside the VOI.211,213,214 Providing that a good growing criterion can be defined, region growing is a very powerful semiautomated segmentation tool. The seeds can either be any specific location inside the 3-D volume, or the result of a previous segmentation operation. Tagging or region growing produce a 3-D mask over the structure of interest. The resulting mask can then be used to apply further processing on the data that belong to this structure of interest inside the full 3-D data set. Such a mask is generally more comprehensive than contouring because it may include finer and more complex details that are not always easy, or even possible, to extract through contours alone. Of special relevance in a “region-growing” paradigm, classification techniques—that can either rely on single or multicomponent data sets211—are able to provide statistical masks for the refined characterization of structures that may have a mixed content, either because of their biology or because of a relatively low spatial resolution for imaging.
More Advanced Segmentation
Research in segmentation—an ever-thriving domain in digital imaging—generally aims at providing clinically compliant techniques that are as automated as possible (including in 3-D) to reduce variability while increasing robustness, objectivity, accuracy, and possibly the speed of the process. Many techniques rely on improving and extending to higher dimensions approaches that have already been successfully implemented in 2-D.211,215,216 Other approaches rely on combining more information into an iterative segmentation process to drive it toward a solution that will satisfy all relevant criteria. For instance, among such approaches and in parallel with recent innovations in clinical imaging, the additional information that is available through multimodality protocols (see later text) can likely be further exploited for improving the characterization and segmentation of structures of interest.217,218
Presentation of Multidimensional (>2-D) Image Data
2.5-D Display of 3-D Data Sets: Slices and Multiplanar Reconstruction
For tomographic modalities, source images can be stacked together to recreate the volume in the field of view at the time of the acquisition. This volume can then be cut along orthogonal planes (standard MPR)219 to produce images with other orientations than the source images (Fig. 8-25A). Such a representation can be very useful to display structures that are not “well oriented” in regard to the original acquisition’s main axis. A natural extension of the classical orthogonal MPR approach is the oblique plane extraction and display, which shows a cut of the reconstructed volume along any arbitrary plane (Fig. 8-25B).220 Another extension of MPR is the curved plane extraction and display, which shows a bidimensional nonplanar cut along a 3-D curved path inside the reconstructed volume (Fig. 8-25C).
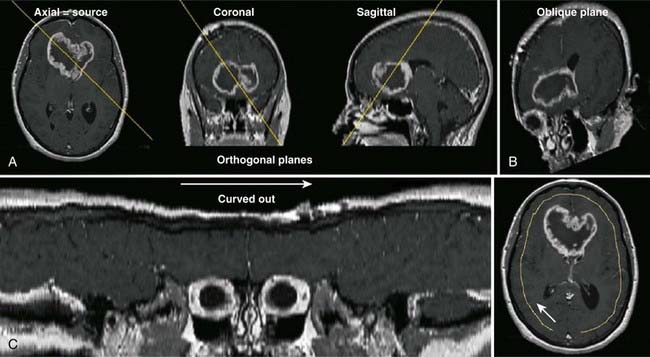
3-D Display of 3-D Data Sets
Contour, Wireframe Display
For a simpler approach, contours can be drawn manually or (semi-) automatically on the source images (see Image Segmentation section). Contours from the same structure can then be grouped together across slices and rendered in 3-D through the spatial parameters (e.g., pixel size and slice spacing) of the source images (Fig. 8-26A). When the contour points of the same structure are joined across slices, the final display makes up a wireframe enclosing the structure of interest (Fig. 8-26B), all of which can be manipulated interactively on a screen (see 3-D Manipulation section).
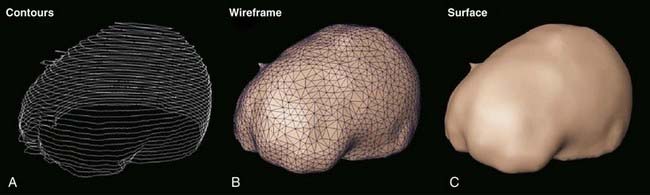
Surface Rendering
Defining Surfaces
To further refine the representation of objects, their defining voxels (contour points, mask elements, etc.), which can simply be specified by a given threshold, can be joined together by small triangular or polygonal surfaces or tiles, which will be merged to represent the outer shell of the structure of interest.221
Surface Visualization
Once a digital surface has been extracted, it can be given various properties regarding its representation, color, transparency (or opacity), and response to external lighting.221 The easiest way to understand how a digital object is represented on a screen to an observer is through the ray tracing paradigm (Fig. 8-26C).221 In ray tracing (ray casting being the opposite), rays extend from infinity through the object and toward the observer.
Volume Rendering
Compared with surface rendering, volume rendering (VR)210,221 does not intrinsically require the segmentation of structures, but uses all the voxels from the volume simultaneously. For VR, voxels are assigned a color and an opacity/transparency that can be linked to their value (e.g., through a LUT scheme) or to any other characteristics (Fig. 8-27A). The volume is then represented to the user or observer through the same ray tracing (or casting) paradigm as that previously described for rendering surfaces. A special (i.e., simplified) mode of VR is maximum intensity projection, in which only the highest value on a ray is projected to the observer (Fig. 8-27B). This technique is mainly used for rendering isolated, high-contrast objects such as bones or vascular structures in CT or MRI angiography. Because there is no binary decision such as when setting a surface threshold, VRs generally look more realistic and convey more textural information than surface renderings. A VR approach also allows arbitrary cuts to be performed through the whole volume and rendered to the user in relation to the 3-D VR.
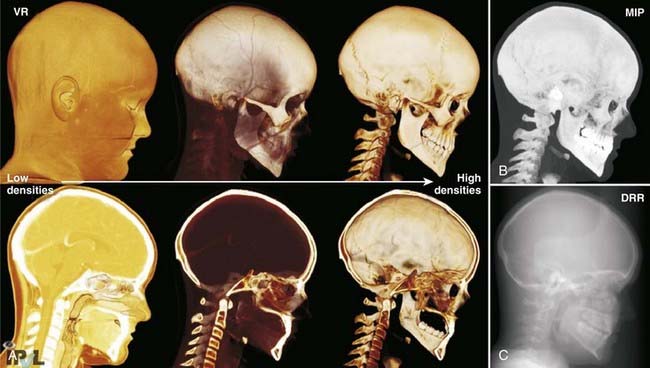
DRRs, which have been discussed previously in relation to treatment planning, are a special application of VR. They simulate a standard 2-D projection x-ray image (such as on a film or from a portal system) from the original CT volume data. By applying strict models based on the absolute H units of the CT image, on the properties of the x-rays, and on the response of the detector (e.g., film, phosphor, EPID) to be simulated, DRRs can be made to look very realistic. By tuning intensity and transparency, and selecting among various combination techniques (direct integration, weighed integration, etc.) of CT voxels along the rays, DRRs can also look many different ways (Fig. 8-27C). Radiation energies and transport characteristics that mimic standard x-rays, a CT simulator, or portal imaging can be simulated when generating the DRR. An obvious plus when compared with traditional x-ray planar projections (e.g., from film or C-arm) is that the DRR orientation can be totally arbitrary and linked to any given geometric transformation. This feature can be used, for example, when trying to align a planning data set to the patient during treatment. An important characteristic of DRRs that sets them apart from traditional VR is that they can also use a cone beam geometry for the simulation of a point x-ray source. Perspective imaging, which has not been addressed here but can simply be added to the viewing transformation during ray tracing, actually relates to such geometry.
Image Registration and Fusion
Parametric Imaging
Besides doses calculated by computerized planning systems, relevant parameters for radiotherapy targeting or assessment may be extracted from static or dynamic functional data sets through either PET or MRI. (Note that CT and SPECT may also provide additional functional information.) For MRI or PET, a contrast agent or radiotracer, respectively, is injected and rapid imaging provides a dynamic sequence of the flow and uptake of the material in the body. Image-based dynamic parameters such as time of arrival, maximum uptake slope, or time of maximum contrast can be extracted and mapped onto the anatomic image. Subtle variation in the dynamics of the contrast or tracer may then provide additional information to improve the identification of tumors or other structures.222,223 Slightly more complex compartmental modeling approaches indirectly estimate metabolic parameters.224
Multimodality Imaging
Because of different technical principles and responses to specific protocols, data coming from various modalities or protocols—and the parameters that can be extracted by further processing—are most often complementary when it comes to evaluating in vivo morphology or metabolism.225–227 The goal of multimodality imaging is therefore to merge all information at hand to better synthesize and assess its global content.226 This approach can be used either for visualizing information of a complementary nature simultaneously, or for enhancing information from one modality with data or parameters extracted from another one.225
Registration
The simpler way to align images with enough similar features is through the interactive manipulation of the geometric transformation (e.g., translations and rotations about the three axes; also scales for affine transformations) with direct feedback from the overlaid images.228 Although rather tedious at times, particularly with low-resolution data sets, this technique can achieve reasonably good results. Because it is the only interactive technique that can be implemented in clinical applications, it also is a necessary component of any registration system, either as a preliminary step (e.g., to get near the optimal solution) or as a final correction step for more complex and sensitive—but still error-prone—techniques.
Other simple registration techniques align paired features (either fiducial markers or anatomic landmarks) between two data sets.229
Various geometric features or landmarks—such as significant points, lines, curves, and surfaces—can also be combined and paired (e.g., through an iterative distance minimization algorithm).230,231 For iterative algorithms based on Euclidean distance, precalculating 3-D distance maps from the features to be aligned232,233 can drastically speed up calculations. As a general rule of thumb, the more distributed the landmarks, the more robust is the result of an alignment. This rule obviously puts a heavier weight on the landmark selection process, which therefore needs to be both objective and accurate. Although the most common way still is to select homologous features by hand or semiautomatically, fully automated methods aim to select the “best” contenders through criteria that are matched to the registration paradigm.234,235
Unsupervised (i.e., fully automatic) volume-based registration techniques can help to relieve the burden of selecting optimal homologous features. These techniques rely on the fact that even if the data to align are complementary and distinct, they should still appear similar enough (i.e., somewhat “connected”) to a given iterative registration algorithm. At each iteration, a similarity measure between the reference volume and the match volume (the volume to be realigned, which is transformed by the current geometric transformation) is calculated, and a new transformation is calculated through a given minimization technique.236,237 The similarity measure is analog to a distance or an alignment cost and can take several forms depending on the registration paradigm.238–240 For intramodality registration or similar enough modality pairs (e.g., CT–CT, MRI–MRI, PET–PET), voxel differences, ratios, or image correlation can be used as costs. For dissimilar modalities (e.g., CT–PET, CT–MRI, MRI–PET), voxel ratio or entropy-based measures (joint entropy, mutual information) are generally more relevant.241,242
Much of current multimodality imaging still relies on rigid or affine geometric transformations (i.e., a combination of translations, rotations, and scalings). Because the human body is not rigid, however, and is almost continuously subjected to motions of various type, most real-life problems call for nonrigid transformations. For instance, different breathing phases will redistribute structures inside the lung. Digestion or excretion process will also redistribute structures inside the abdomen. Nonrigid registration techniques are harder to implement than rigid ones, because, for example, they tend to be much costlier computing-wise and also harder to control to produce results that are consistent, relevant, and accurate.211,240 By applying various constraints and apriori information in their deformation models, these complex techniques can still be implemented successfully and exploited clinically or for advanced analysis of normally distinct data sets.243–247 Accordingly, more commercial systems manufacturers are now offering nonrigid registration as part of their clinical multimodality products. Still, although registration metrics for rigid transformations can remain relatively straightforward and easy to grasp by human users, more complex nonrigid registration techniques may require more advanced validation paradigms to ensure a reasonable compliance with clinical requirements.248
Fusion: Visualizing Multimodality Data Sets
Once registered, two data sets can be represented as two side-by-side 2-D sets of MPR images, with or without a coupled cursor. Another way is to blend both images—with different color scales and a varying blending ratio—into a single one. When dealing with 3-D objects, objects extracted from one data set can be visualized along objects extracted from the other one. Finally, information from one data set (e.g., the “functional” one) can be projected on the surface of objects from the other one (e.g., the “anatomic” one) (Fig. 8-28). Such merging of information226 can obviously also take place with volume-rendering techniques (Fig. 8-29). A special paradigm of multimodality imaging is the registration and fusion of information that comes from imaging instruments with information that may be entirely parametric or virtual. Such an example of hybrid registration and fusion is the combination of beams and dose estimates from a radiotherapy plan with follow-up PET–CT data sets. Once further established, the goal of such a protocol would be to assist physicians in differentiating what could be a tumor recurrence from what could be a radiotherapy-derived inflammatory response (see Fig. 8-29).

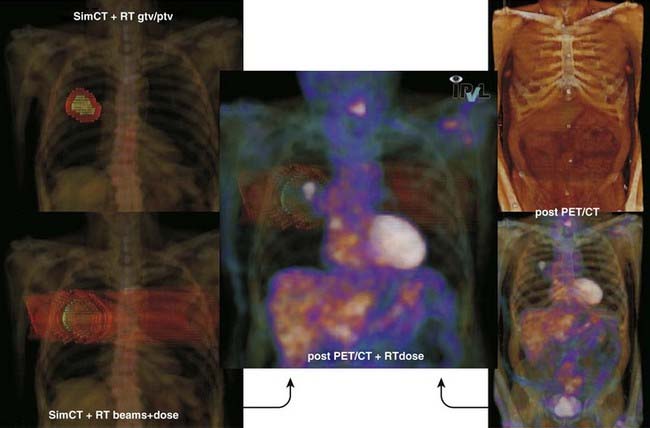
Summary and Conclusions
Perhaps the most needed improvement, and the most difficult to achieve, is the ability to better define the extent of disease, including regions of microscopic extensions. Related to this is the substantial variability in delineating target volumes.249 Another deficiency is the poor contrast of portal images (caused by the high photon energies), which negatively affects treatment delivery verification. The use of low-energy photons for portal imaging is being explored to circumvent this problem. A related issue, the uncertainty introduced by organ motion during treatment, which compromises treatment accuracy and the valid comparison of planning and verification images, is also being actively studied with great and promising strides.
1 Fuks Z, Leibel SA, Wallner KE, et al. The effect of local control on metastatic dissemination in carcinoma of the prostate: Long-term results in patients treated with 125-I implantation. Int J Radiat Oncol Biol Phys. 1991;21:537.
2 Leibel SA, Kutcher GJ, Mohan RM, et al. Three-dimensional conformal radiation therapy at the Memorial Sloan-Kettering Cancer Center. Semin Radiat Oncol. 1992;2:274.
3 Leibel SA, Ling CC, Kutcher GJ, et al. The biological basis for conformal three-dimensional radiation therapy. Int J Radiat Oncol Biol Phys. 1991;21:805.
4 Leibel SA, Heimann R, Kutcher GJ, et al. Three dimensional conformal radiation therapy in locally advanced carcinoma of the prostate: Preliminary results of a phase I dose escalation study. Int J Radiat Oncol Biol Phys. 1994;20:55.
5 Seco J, Evans PM. Assessing the effect of electron density in photon dose calculations. Med Phys. 2006;33:540.
6 Rybicki FJ, Otero HJ, Steigner ML, et al. Initial evaluation of coronary images from 320-detector row computed tomography. Int J Cardiovasc Imaging. 2008;24:535.
7 Ford E, Mageras GS, Yorke E, et al. Evaluation of respiratory movement during gated radiotherapy using film and electronic portal imaging. Int J Radiat Oncol Biol Phys. 2002;52:522.
8 Low DA, Nystrom M, Kalinin E, et al. A method for the reconstruction of four-dimensional synchronized CT scans acquired during free breathing. Med Phys. 2003;30:1254.
9 Mageras GS, Pevsner A, Yorke ED, et al. Measurement of lung tumor motion using respiration-correlated CT. Int J Radiat Oncol Biol Phys. 2004;60:933.
10 Hamilton RJ, Sweeney PJ, Pelizzari PA, et al. Functional imaging in treatment planning of brain lesions. Int J Radiat Oncol Biol Phys. 1997;37:181.
11 Lee YK, Bollet M, Charles-Edwards G, et al. Radiotherapy treatment planning of prostate cancer using magnetic resonance imaging alone. Radiother Oncol. 2003;66:203.
12 Pickett B, Vigneault E, Kurhanewicz J, et al. Static field intensity modulation to treat a dominant intra-prostatic lesion to 90 Gy compared to seven field 3-dimensional radiotherapy. Int J Radiat Oncol Biol Phys. 1999;44:921.
13 DiBiase SJ, Hosseinzadeh K, Giullapalli RP, et al. Magnetic resonance spectroscopic imaging-guided brachytherapy for localized prostate cancer. Int J Radiat Oncol Biol Phys. 2002;52:429.
14 Kurhanewicz J, Vigneron DB, Hiracak K, et al. Three-dimensional H-1 MR spectroscopic imaging of the in situ human prostate with high (0.24–0.7-cm3) spatial resolution. Radiology. 1996;198:795.
15 Zakian KL, Koutcher JA, Ballon D, et al. Developments in nuclear magnetic resonance imaging and spectroscopy: Application to radiation oncology. Semin Radiat Oncol. 2001;11:3.
16 Cao Y, Platt JF, Francis IR, et al. The prediction of radiation-induced liver dysfunction using a local dose and regional venous perfusion model. Med Phys. 2007;34:604.
17 Padhani AR, Khoo VS, Suckling J, et al. Evaluating the effect of rectal distension and rectal movement on prostate gland position using cine MRI. Int J Radiat Oncol Biol Phys. 1999;44:525.
18 Koch N, Liu HH, Starkschall G, et al. Evaluation of internal lung motion for respiratory-gated radiotherapy using MRI: Part I—correlating internal lung motion with skin fiducial motion. Int J Radiat Oncol Biol Phys. 2004;60:1459.
19 Hricak H, Humm J, Ling C, et al. Innovations in oncologic imaging. In: DeVita VT, Hellman S, Rosenberg SA, editors. Principles and practice of oncology, vol. 15. Philadelphia: Lippincott Williams & Wilkins; 2001:1. no. 11
20 Kini VR, Edmundson GK, Vicini FA, et al. Use of three-dimensional radiation therapy planning tools and intraoperative ultrasound to evaluate high dose rate prostate brachytherapy implants. Int J Radiat Oncol Biol Phys. 1999;43:571.
21 Taylor KJ, Merritt C, Piccoli C, et al. Ultrasound as a complement to mammography and breast examination to characterize breast masses. Ultrasound Med Biol. 2002;28:19.
22 Kuban DA, Dong L, Cheung R, et al. Ultrasound-based localization. Semin Radiat Oncol. 2005;15:180.
23 Meeks SL, Buatti JM, Bouchet LG, et al. Ultrasound-guided extracranial radiosurgery: technique and application. Int J Radiat Oncol Biol Phys. 2003;55:1092.
24 Reinstein LE, Amols HI, Droege RT, et al, Radiotherapy portal film quality, (AAPM Technical Report No. 24); 1987; Medical Physics Publishing, Reinstein, LE, Amols HI, Madison, WI.
25 Herman MG. Clinical use of electronic portal imaging. Semin Radiat Oncol. 2005;15:157.
26 Litzenberg D, Dawson LA, Sandler H, et al. Daily prostate targeting using implanted radiopaque markers. Int J Radiat Oncol Biol Phys. 2002;52:699.
27 Herman MG, Balter JM, Jaffray DA, et al. Clinical use of electronic portal imaging: Report of AAPM Radiation Therapy Committee Task Group 58. Med Phys. 2001;28:712.
28 Kutcher GJ, Coia L, Gillin M, et al. Comprehensive QA for radiation oncology: Report of AAPM Radiation Therapy Committee Task Group 40. Med Phys. 1994;21:581.
29 Van Esch A, Depuydt T, Huyskens DP. The use of an aSi-based EPID for routine absolute dosimetric pre-treatment verification of dynamic IMRT fields. Radiother Oncol. 2004;71:223.
30 Siebers JV, Kim JO, Ko L, et al. Monte Carlo computation of dosimetric amorphous silicon electronic portal images. Med Phys. 2004;31:2135.
31 McDermott LN, Wendling M, Sonke JJ, et al. Anatomy changes in radiotherapy detected using portal imaging. Radiother Oncol. 2006;79:211.
32 Amols HI, Reinstein LE, Lagueux B. A quantitative assessment of portal film contrast as a function of beam energy. Med Phys. 1986;13:711.
33 Jaffray DA, Drake DG, Moreau M, et al. A radiographic and tomographic imaging system integrated into a medical linear accelerator for localization of bone and soft-tissue targets. Int J Radiat Oncol Biol Phys. 1999;45:773.
34 Shirato H, Shimizu S, Kitamura K, et al. Four-dimensional treatment planning and fluoroscopic real-time tumor tracking radiotherapy for moving tumor. Int J Radiat Oncol Biol Phys. 2000;48:435.
35 Murphy MJ, Chang SD, Gibbs IC, et al. Patterns of patient movement during frameless image-guided radiosurgery. Int J Radiat Oncol Biol Phys. 2003;55:1400-1408.
36 Yan H, Yin FF, Kim JH. A phantom study on the positioning accuracy of the Novalis Body system. Med Phys. 2003;30:3052-3060.
37 Berbeco RI, Jiang SB, Sharp GC, et al. Integrated radiotherapy imaging system (IRIS): design considerations of tumour tracking with linac gantry-mounted diagnostic x-ray systems with flat-panel detectors. Phys Med Biol. 2004;49:243-255.
38 Kuriyama K, Onishi H, Sano N, et al. A new irradiation unit constructed of self-moving gantry-CT and linac. Int J Radiat Oncol Biol Phys. 2003;55:428.
39 Jaffray DA, Siewerdsen JH, Wong JW, et al. Flat-panel cone-beam computed tomography for image-guided radiation therapy. Int J Radiat Oncol Biol Phys. 2002;53:1337.
40 Morin O, Gillis A, Chen J, et al. Megavoltage cone-beam CT: system description and clinical applications. Med Dosim. 2006;31:51.
41 Balter JM, Wright JN, Newell LJ, et al. Accuracy of a wireless localization system for radiotherapy. Int J Radiat Oncol Biol Phys. 2005;61:933.
42 Willoughby TR, Kupelian PA, Pouliot J, et al. Target localization and real-time tracking using the Calypso 4D localization system in patients with localized prostate cancer. Int J Radiat Oncol Biol Phys. 2006;65:528.
43 Meeks SL, Bova FJ, Wagner TH, et al. Image localization for frameless stereotactic radiotherapy. Int J Radiat Oncol Biol Phys. 2000;46:1291.
44 Wang LT, Solberg TD, Medin PM, et al. Infrared patient positioning for stereotactic radiosurgery of extracranial tumors. Comput Biol Med. 2001;31:101.
45 Bert C, Metheany KG, Doppke KP, et al. Clinical experience with a 3D surface patient setup system for alignment of partial-breast irradiation patients. Int J Radiat Oncol Biol Phys. 2006;64:1265.
46 Brahme A, Nyman P, Skatt B. 4D laser camera for accurate patient positioning, collision avoidance, image fusion and adaptive approaches during diagnostic and therapeutic procedures. Med Phys. 2008;35:1670.
47 McSheehy PM, Leach MO, Judson IR, et al. Metabolites of 2′-fluoro-2′-deoxy-D-glucose detected by 19F magnetic resonance spectroscopy in vivo predict response of murine RIF-1 tumors to 5-fluorouracil. Cancer Res. 2000;60:2122.
48 Maxon HR. Detection of residual and recurrent thyroid cancer by radionuclide imaging. Thyroid. 1999;9:443.
49 Krasnow AZ, Hellman RS, Timins ME, et al. Diagnostic bone scanning in oncology. Semin Nucl Med. 1997;27:107.
50 Imbriaco M, Larson SM, Yeung HW, et al. A new parameter for measuring metastatic bone involvement by prostate cancer: The bone scan index. Clin Cancer Res. 1998;4:1765.
51 Weiner RE, Thakur ML. Radiolabeled peptides in the diagnosis and therapy of oncological diseases. Appl Radiat Isot. 2002;57:749.
52 Lumachi F, Zucchetta P, Marzola MC, et al. Positive predictive value of 99mTc sestamibi scintimammography in patients with non-palpable, mammographically detected, suspicious, breast lesions. Nucl Med Commun. 2002;23:1073.
53 Brisse H, Edeline V, Michon J, et al. Current strategy for the imaging of neuroblastoma. [Article in French]. J Radiol. 2001;82:447.
54 Monsieurs M, Brans B, Bacher K, et al. Patient dosimetry for (131)I-MIBG therapy for neuroendocrine tumours based on (123)I-MIBG scans. Eur J Nucl Med Mol Imaging. 2002;29:1581.
55 Anderson KC, Leonard RC, Canellos GP, et al. High-dose gallium imaging in lymphoma. Am J Med. 1983;75:327.
56 Chajari M, Lacroix J, Peny AM, et al. Gallium-67 scintigraphy in lymphoma: Is there a benefit of image fusion with computed tomography? Eur J Nucl Med Mol Imaging. 2002;29:380.
57 Lorberboym M, Mandell LR, Mosesson RE, et al. The role of thallium-201 uptake and retention in intracranial tumors after radiotherapy. J Nucl Med. 1997;38:223.
58 Alexander EIII, Loeffler JS, Schwartz RB, et al. Thallium-201 technetium-99m HMPAO single-photon emission computed tomography (SPECT) imaging for guiding stereotactic craniotomies in heavily irradiated malignant glioma patients. Acta Neurochir (Vienna). 1993;122:215.
59 Bischof Delaloye A. Radioimmunoimaging and radioimmuno therapy: Will these be routine procedures? Semin Nucl Med. 2000;30:186.
60 Park SI, Press OW. Radioimmunotherapy for treatment of B-cell lymphomas and other hematologic malignancies. Curr Opin Hematol. 2007;14(6):632-638. Review
61 Macklis RM. Radioimmunotherapy as a therapeutic option for Non-Hodgkin’s lymphoma. Semin Radiat Oncol. 2007;17(3):176-183.
62 Zelenetz AD. A clinical and scientific overview of tositumomab and iodine I 131 tositumomab. Semin Oncol. 2003;30(2 Suppl 4):22-30.
63 Jacobs SA, Foon KA. The expanding role of rituximab and radioimmunotherapy in the treatment of B-cell lymphomas. Expert Opin Biol Ther. 2007;7(11):1749-1762.
64 Makrauer FL, Oates E, Becker J, et al. Does local irradiation affect gastric emptying in humans? Am J Med Sci. 1999;317:33.
65 Boersma LJ, Damen EM, de Boer RW, et al. Estimation of overall pulmonary function after irradiation using dose-effect relations for local functional injury. Radiother Oncol. 1995;36:15.
66 Boersma LJ, Damen EM, de Boer RW, et al. A new method to determine dose-effect relations for local lung-function changes using correlated SPECT and CT data. Radiother Oncol. 1993;29:110.
67 Damen EM, Muller SH, Boersma LJ, et al. Quantifying local lung perfusion and ventilation using correlated SPECT and CT data. J Nucl Med. 1994;35:784.
68 Seppenwoolde Y, Muller SH, Theuws JC, et al. Radiation dose-effect relations and local recovery in perfusion for patients with non-small-cell lung cancer. Int J Radiat Oncol Biol Phys. 2000;47(3):681-690.
69 Valdes Olmos RA, van Zandwijk N, Boersma LJ, et al. Radiation pneumonitis imaged with indium-111-pentetreotide. J Nucl Med. 1996;37:584.
70 Seppenwoolde Y, Engelsman M, De Jaeger K, et al. Optimizing radiation treatment plans for lung cancer using lung perfusion information. Radiother Oncol. 2002;63:165.
71 Lavrenkov K, Christian JA, Partridge M, et al. A potential to reduce pulmonary toxicity: the use of perfusion SPECT with IMRT for functional lung avoidance in radiotherapy of non-small cell lung cancer. Radiother Oncol. 2007;83(2):156-162.
72 Chapman JD, Schneider RF, Urbain JL, et al. Single-photon emission computed tomography and positron-emission tomography assays for tissue oxygenation. Semin Radiat Oncol. 2001;11(1):47-57. Review
73 Stypinski D, McQuarrie SA, Wiebe LI, et al. Dosimetry estimations for 123I-IAZA in healthy volunteers. J Nucl Med. 2001;42(9):1418-1423.
74 de Jong HW, van Velden FH, Kloet RW, et al. Performance evaluation of the ECAT HRRT: an LSO-LYSO double layer high resolution, high sensitivity scanner. Phys Med Biol. 2007;52(5):1505-1526.
75 Humm JL, Rosenfeld A, Del Guerra A. From PET detectors to PET scanners. Eur J Nucl Med Mol Imaging. 2003;30(11):1574-1597.
76 Hoh CK. Clinical use of FDG PET. Nucl Med Biol. 2007;34(7):737-742.
77 Phelps ME. Positron computed tomography studies of cerebral glucose metabolism in man: Theory and application in nuclear medicine. Semin Nucl Med. 1981;11:32.
78 Kinahan PE, Townsend DW, Beyer T, Sashin D. Attenuation correction for a combined 3D PET/CT scanner. Med Phys. 1998;25(10):2046-2053.
79 Kinahan PE, Hasegawa BH, Beyer T. X-ray-based attenuation correction for positron emission tomography/computed tomography scanners. Semin Nucl Med. 2003;33(3):166-179.
80 Carney JP, Townsend DW, Rappoport V, et al. Method for transforming CT images for attenuation correction in PET/CT imaging. Med Phys. 2006;33(4):976-983.
81 Wahl RL, editor. Principles and practice of positron emission tomography. Philadelphia: Lippincott Williams & Wilkins, 2002.
82 Huang SC. Anatomy of SUV. Standardized uptake value. Nucl Med Biol. 2000;27:643.
83 Czernin J, Allen-Auerbach M, Schelbert HR. Improvements in cancer staging with PET/CT: literature-based evidence as of September 2006. J Nucl Med. 2007;48(Suppl 1):78S-88S.
84 Vansteenkiste JF, Stroobants SS. PET scan in lung cancer: current recommendations and innovation. J Thorac Oncol. 2006;1(1):71-73.
85 Pillot G, Siegel BA, Govindan R. Prognostic value of fluorodeoxyglucose positron emission tomography in non-small cell lung cancer: a review. J Thorac Oncol. 2006;1(2):152-159.
86 Kasamon YL, Jones RJ, Wahl RL. Integrating PET and PET/CT into the risk-adapted therapy of lymphoma. J Nucl Med. 2007;48(Suppl 1):19S-27S.
87 Macapinlac HA. FDG PET and PET/CT imaging in lymphoma and melanoma. Cancer J. 2004;10(4):262-270.
88 Mawlawi O, Erasmus JJ, Munden RF, et al. Quantifying the effect of IV contrast media on integrated PET/CT: clinical evaluation. AJR Am J Roentgenol. 2006;186(2):308-319.
89 Dizendorf E, Hany TF, Buck A, et al. Cause and magnitude of the error induced by oral CT contrast agent in CT-based attenuation correction of PET emission studies. J Nucl Med. 2003;44(5):732-738.
90 Cohade C, Osman M, Nakamoto Y, et al. Initial experience with oral contrast in PET/CT: phantom and clinical studies. J Nucl Med. 2003;44(3):412-416.
91 Nehmeh SA, Erdi YE, Kalaigian H, et al. Correction for oral contrast artifacts in CT attenuation-corrected PET images obtained by combined PET/CT. J Nucl Med. 2003;44(12):1940-1944.
92 Mawlawi O, Erasmus JJ, Pan T, et al. Truncation artifact on PET/CT: impact on measurements of activity concentration and assessment of a correction algorithm. AJR Am J Roentgenol. 2006;186(5):1458-1467.
93 Nehmeh SA, Erdi YE, Ling CC, et al. Effect of respiratory gating on quantifying PET images of lung cancer. J Nucl Med. 2002;43(7):876-881.
94 Li XA, Stepaniak C, Gore E. Technical and dosimetric aspects of respiratory gating using a pressure-sensor motion monitoring system. Med Phys. 2006;33(1):145-154.
95 Nehmeh SA, Erdi YE, Ling CC, et al. Effect of respiratory gating on reducing lung motion artifacts in PET imaging of lung cancer. Med Phys. 2002;29:366.
96 Nehmeh SA, Erdi YE, Pan T, et al. Four-dimensional (4D) PET/CT imaging of the thorax. Med Phys. 2004;31(12):3179-3186.
97 Qiao F, Pan T, Clark JWJr, Mawlawi O. Joint model of motion and anatomy for PET image reconstruction. Med Phys. 2007;34(12):4626-4639.
98 Qiao F, Pan T, Clark JW, Mawlawi OR. Region of interest motion compensation for PET image reconstruction. Phys Med Biol. 2007;52(10):2675-2689.
99 Reyes M, Malandain G, Koulibaly PM, et al. Model-based respiratory motion compensation for emission tomography image reconstruction. Phys Med Biol. 2007 21;52(12):3579-3600.
100 Nehmeh SA, Erdi YE, Pan T, et al. Quantitation of respiratory motion during 4D-PET/CT acquisition. Med Phys. 2004;31(6):1333-1338.
101 Erdi YE, Nehmeh SA, Pan T, et al. The CT motion quantitation of lung lesions and its impact on PET-measured SUVs. J Nucl Med. 2004;45(8):1287-1292.
102 Pan T, Mawlawi O, Nehmeh SA, et al. Attenuation correction of PET images with respiration-averaged CT images in PET/CT. J Nucl Med. 2005 Sep;46(9):1481-1487.
103 Chi PC, Mawlawi O, Nehmeh SA, et al. Design of respiration averaged CT for attenuation correction of the PET data from PET/CT. Med Phys. 2007;34(6):2039-2047.
104 Meirelles GS, Erdi YE, Nehmeh SA, et al. Deep-inspiration breath-hold PET/CT: clinical findings with a new technique for detection and characterization of thoracic lesions. J Nucl Med. 2007;48(5):712-719.
105 Nehmeh SA, Erdi YE, Meirelles GS, et al. Deep-inspiration breath-hold PET/CT of the thorax. J Nucl Med. 2007;48(1):22-26.
106 Israel O, Keidar Z, Iosilevsky G, et al. The fusion of anatomic and physiologic imaging in the management of patients with cancer. Semin Nucl Med. 2001;31:191.
107 Erdi YE, Mawlawi O, Larson SM, et al. Segmentation of lung lesion volume by adaptive positron emission tomography image thresholding. Cancer. 1997;80(12 Suppl):2505.
108 Schinagl DA, Vogel WV, Hoffmann AL, et al. Comparison of five segmentation tools for 18F-fluoro-deoxy-glucose-positron emission tomography-based target volume definition in head and neck cancer. Int J Radiat Oncol Biol Phys. 2007;69(4):1282-1289.
109 Pugachev A, Ruan S, Carlin S, et al. Dependence of FDG uptake on tumor microenvironment. Int J Radiat Oncol Biol Phys. 2005;62(2):545-553.
110 Aristophanous M, Penney BC, Martel MK, et al. A Gaussian mixture model for definition of lung tumor volumes in positron emission tomography. Med Phys. 2007;34(11):4223-4235.
111 Geets X, Lee JA, Bol A, et al. A gradient-based method for segmenting FDG-PET images: methodology and validation. Eur J Nucl Med Mol Imaging. 2007;34(9):1427-1438.
112 Greco C, Rosenzweig K, Cascini GL, et al. Current status of PET/CT for tumour volume definition in radiotherapy treatment planning for non-small cell lung cancer (NSCLC). Lung Cancer. 2007;57(2):125-134.
113 Schwartz DL, Ford EC, Rajendran J, et al. FDG-PET/CT-guided intensity modulated head and neck radiotherapy: a pilot investigation. Head Neck. 2005;27(6):478-487.
114 Heron DE, Andrade RS, Flickinger J, et al. Hybrid PET-CT simulation for radiation treatment planning in head-and-neck cancers: a brief technical report. Int J Radiat Oncol Biol Phys. 2004;60(5):1419-1424.
115 Paulino AC, Koshy M, Howell R, et al. Comparison of CT- and FDG-PET-defined gross tumor volume in intensity-modulated radiotherapy for head-and-neck cancer. Int J Radiat Oncol Biol Phys. 2005;61(5):1385-1392.
116 Grégoire V, Bol A, Geets X, Lee J. Is PET-based treatment planning the new standard in modern radiotherapy? The head and neck paradigm. Semin Radiat Oncol. 2006;16(4):232-238.
117 Daisne JF, Duprez T, Weynand B, et al. Tumor volume in pharyngolaryngeal squamous cell carcinoma: comparison at CT, MR imaging, and FDG PET and validation with surgical specimen. Radiology. 2004;233(1):93-100.
118 Brianzoni E, Rossi G, Ancidei S, et al. Radiotherapy planning: PET/CT scanner performances in the definition of gross tumour volume and clinical target volume. Eur J Nucl Med Mol Imaging. 2005;32(12):1392-1399.
119 Yahalom J. Transformation in the use of radiation therapy of Hodgkin lymphoma: new concepts and indications lead to modern field design and are assisted by PET imaging and intensity modulated radiation therapy (IMRT). Eur J Haematol Suppl. 2005;66:90-97.
120 Grosu AL, Piert M, Weber WA, et al. Positron emission tomography for radiation treatment planning. Strahlenther Onkol. 2005;181(8):483-499.
121 van Baardwijk A, Baumert BG, Bosmans G, et al. The current status of FDG-PET in tumour volume definition in radiotherapy treatment planning. Cancer Treat Rev. 2006;32(4):245-260.
122 Rembielak A, Price P. The role of PET in target localization for radiotherapy treatment planning. Onkologie. 2008;31(1–2):57-62.
123 Ling CC, Humm J, Larson S, et al. Towards multidimensional radiotherapy (MD-CRT): biological imaging and biological conformality. Int J Radiat Oncol Biol Phys. 2000;47(3):551-560.
124 Grosu AL, Wiedenmann N, Molls M. Biological imaging in radiation oncology. Z Med Phys. 2005;15(3):141-145.
125 Madani I, Duthoy W, Derie C, et al. Positron emission tomography-guided, focal-dose escalation using intensity-modulated radiotherapy for head and neck cancer. Int J Radiat Oncol Biol Phys. 2007;68(1):126-135.
126 Pugachev A, Ruan S, Carlin S, et al. Dependence of FDG uptake on tumor microenvironment. Int J Radiat Oncol Biol Phys. 2005;62(2):545-553.
127 Rajendran JG, Mankoff DA, O’Sullivan F, et al. Hypoxia and glucose metabolism in malignant tumors: evaluation by [18F]fluoromisonidazole and [18F]fluorodeoxyglucose positron emission tomography imaging. Clin Cancer Res. 2004;10(7):2245-2252.
128 Thorwarth D, Soukup M, Alber M. Dose painting with IMPT, helical tomotherapy and IMXT: a dosimetric comparison. Radiother Oncol. 2008;86(1):30-34.
129 Schwartz DL, Ford EC, Rajendran J, et al. FDG-PET/CT-guided intensity modulated head and neck radiotherapy: a pilot investigation. Head Neck. 2005;27(6):478-487.
130 Shields AFG, Dohmen JR, Machulla BM, et al. Imaging proliferation in vivo with [F-18]FLT and positron emission tomography. Nature Medicine. 1998;4:1334-1336.
131 Shields AF. PET imaging with 18F-FLT and thymidine analogs: promise and pitfalls. J Nucl Med. 2003;44:1432-1434.
132 Vesselle H, Grierson J, Muzi M, et al. In Vivo Validation of 3′deoxy-3′-[18F]fluorothymidine ([18F]FLT) as a Proliferation Imaging Tracer in Humans. Clin Canc Res. 2002;8:3315-3323.
133 Schwartz JL, Tamura Y, Jordan R, et al. Monitoring tumor cell proliferation by targeting DNA synthetic processes with thymidine and thymidine analogs. J Nucl Med. 2003;44:2027-2032.
134 Salskov A, Tammisetti VS, Grierson J, et al. FLT: measuring tumor cell proliferation in vivo with positron emission tomography and 3′-deoxy-3′-[18F]fluorothymidine. Semin Nucl Med. 2007;37(6):429-439.
135 Tian J, Yang X, Yu L, et al. A multicenter clinical trial on the diagnostic value of dual-tracer PET/CT in pulmonary lesions using 3′-deoxy-3′-18F-fluorothymidine and 18F-FDG. J Nucl Med. 2008;49(2):186-194.
136 Ullrich R, Backes H, Li H, et al. Glioma proliferation as assessed by 3′-fluoro-3′-deoxy-L-thymidine positron emission tomography in patients with newly diagnosed high-grade glioma. Clin Cancer Res. 2008;14(7):2049-2055.
137 Rasey JS, Koh WJ, Evans ML, et al. Quantifying regional hypoxia in human tumors with positron emission tomography of [18F] fluoromisonidazole: A pretherapy study of 37 patients. Int J Radiat Oncol Biol Phys. 1996;36:417.
138 Rajendran JG, Mankoff DA, O’Sullivan F, et al. Hypoxia and glucose metabolism in malignant tumors: evaluation by [18F]fluoromisonidazole and [18F]fluorodeoxyglucose positron emission tomography imaging. Clin Cancer Res. 2004;10:2245.
139 Nehmeh SA, Lee NY, Schröder H, et al. Reproducibility of intratumor distribution of (18)F-fluoromisonidazole in head and neck cancer. Int J Radiat Oncol Biol Phys. 2008;70(1):235-242.
140 Lee NY, Mechalakos JG, Nehmeh S, et al. Fluorine-18-labeled fluoromisonidazole positron emission and computed tomography-guided intensity-modulated radiotherapy for head and neck cancer: a feasibility study. Int J Radiat Oncol Biol Phys. 2008;70(1):2-13.
141 Lin Z, Mechalakos J, Nehmeh S, et al. The influence of changes in tumor hypoxia on dose-painting treatment plans based on 18F-FMISO positron emission tomography. Int J Radiat Oncol Biol Phys. 2008;70(4):1219-1228.
142 Lehtiö K, Eskola O, Viljanen T, et al. Imaging perfusion and hypoxia with PET to predict radiotherapy response in head-and-neck cancer. Int J Radiat Oncol Biol Phys. 2004;59(4):971-982.
143 Gronroos T. New Doctorial Cancer Research. [18F] Fluoroerythronitroimidazole, Tumor Hypoxia and Positron Emission Tomography/951-29-3265-2. Crit Rev Oncog. 2007;13(1):85-87.
144 Ziemer LS, Evans SM, Kachur AV, et al. Noninvasive imaging of tumor hypoxia in rats using the 2-nitroimidazole 18F-EF5. Eur J Nucl Med Mol Imaging. 2003;30(2):259-266.
145 Koch CJ, Evans SM. Non-invasive PET and SPECT imaging of tissue hypoxia using isotopically labeled 2-nitroimidazoles. Adv Exp Med Biol. 2003;510:285-292.
146 Grosu AL, Souvatzoglou M, Röper B, et al. Hypoxia imaging with FAZA-PET and theoretical considerations with regard to dose painting for individualization of radiotherapy in patients with head and neck cancer. Int J Radiat Oncol Biol Phys. 2007;69(2):541-551.
147 Evans SM, Judy KD, Dunphy I, et al. Comparative measurements of hypoxia in human brain tumors using needle electrodes and EF5 binding. Cancer Res. 2004;64(5):1886-1892.
148 Evans SM, Du KL, Chalian AA, et al. Patterns and levels of hypoxia in head and neck squamous cell carcinomas and their relationship to patient outcome. Int J Radiat Oncol Biol Phys. 2007;69(4):1024-1031.
149 Thorwarth D, Eschmann SM, Paulsen F, et al. A kinetic model for dynamic [18F]-Fmiso PET data to analyse tumour hypoxia. Phys Med Biol. 2005;50(10):2209-2224.
150 Thorwarth D, Eschmann SM, Scheiderbauer J, et al. Kinetic analysis of dynamic 18F-fluoromisonidazole PET correlates with radiation treatment outcome in head-and-neck cancer. BMC Cancer. 2005;5:152.
151 Casciari JJ, Graham MM, Rasey JS. A modeling approach for quantifying tumor hypoxia with [F-18]fluoromisonidazole PET time-activity data. Med Phys. 1995;22(7):1127-1139.
152 Dehdashti F, Mintun MA, Lewis JS, et al. In vivo assessment of tumor hypoxia in lung cancer with 60Cu-ATSM. Eur J Nucl Med Mol Imaging. 2003;30(6):844-850.
153 Dehdashti F, Grigsby PW, Mintun MA, et al. Assessing tumor hypoxia in cervical cancer by positron emission tomography with 60Cu-ATSM: relationship to therapeutic response-a preliminary report. Int J Radiat Oncol Biol Phys. 2003;55(5):1233-1238.
154 Dehdashti F, Grigsby PW, Lewis JS, et al. Assessing tumor hypoxia in cervical cancer by PET with 60Cu-labeled diacetyl-bis(N4-methylthiosemicarbazone). J Nucl Med. 2008;49(2):201-205.
155 Chao KS, Bosch WR, Mutic S, et al. A novel approach to overcome hypoxic tumor resistance: Cu-ATSM-guided intensity-modulated radiation therapy. Int J Radiat Oncol Biol Phys. 2001;15(49):171.
156 Bonnitcha PD, Vāvere AL, Lewis JS, et al. In vitro and in vivo evaluation of bifunctional bisthiosemicarbazone 64Cu-complexes for the positron emission tomography imaging of hypoxia. J Med Chem. 2008;51(10):2985-2991.
157 Xiao Z, Donnelly PS, Zimmermann M, et al. Transfer of copper between bis(thiosemicarbazone) ligands and intracellular copper-binding proteins. insights into mechanisms of copper uptake and hypoxia selectivity. Inorg Chem. 2008;47(10):4338-4347.
158 O’Donoghue JA, Zanzonico P, Pugachev A, et al. Assessment of regional tumor hypoxia using 18F-fluoromisonidazole and 64Cu(II)-diacetyl-bis(N4-methylthiosemicarbazone) positron emission tomography: Comparative study featuring microPET imaging, Po2 probe measurement, autoradiography, and fluorescent microscopy in the R3327-AT and FaDu rat tumor models. Int J Radiat Oncol Biol Phys. 2005;61(5):1493-1502.
159 Mogard J, Kihlstrom L, Ericson K, et al. Recurrent tumor vs radiation effects after gamma knife radiosurgery of intracerebral metastases: Diagnosis with PET-FDG. J Comput Assist Tomogr. 1994;18:177.
160 Oku S, Nakagawa K, Momose T, et al. FDG-PET after radiotherapy is a good prognostic indicator of rectal cancer. Ann Nucl Med. 2002;16:409.
161 Allal AS, Dulguerov P, Allaoua M, et al. Standardized uptake value of 2-[18F] fluoro-2-deoxy-D-glucose in predicting outcome in head and neck carcinomas treated by radiotherapy with or without chemotherapy. J Clin Oncol. 2002;20:1398.
162 Greven KM, Williams DWIII, McGuirt WFSr, et al. Serial positron emission tomography scans following radiation therapy of patients with head and neck cancer. Head Neck. 2001;23:942.
163 Erdi YE, Macapinlac H, Rosenzweig KE, et al. Use of PET to monitor the response of lung cancer to radiation treatment. Eur J Nucl Med. 2000;27(7):861-866.
164 Flamen P, Van Cutsem E, Lerut A, et al. Positron emission tomography for assessment of the response to induction radiochemotherapy in locally advanced oesophageal cancer. Ann Oncol. 2002;13(3):361-368.
165 Downey RJ, Akhurst T, Ilson D, et al. Whole body 18FDG-PET and the response of esophageal cancer to induction therapy: results of a prospective trial. J Clin Oncol. 2003;21(3):428-432.
166 Wieder HA, Brucher BL, Zimmermann F, et al. Time course of tumor metabolic activity during chemoradiotherapy of esophageal squamous cell carcinoma and response to treatment. J Clin Oncol. 2004;22(5):900-908.
167 Guillem JG, Moore HG, Akhurst T, et al. Sequential preoperative fluorodeoxyglucose-positron emission tomography assessment of response to preoperative chemoradiation: a means for determining longterm outcomes of rectal cancer. J Am Coll Surg. 2004;199(1):1-7.
168 Moore HG, Akhurst T, Larson SM, Minsky BD, et al. A case-controlled study of 18-fluorodeoxyglucose positron emission tomography in the detection of pelvic recurrence in previously irradiated rectal cancer patients. J Am Coll Surg. 2003;197(1):22-28.
169 Zinzani PL, Magagnoli M, Chierichetti F, et al. The role of positron emission tomography (PET) in the management of lymphoma patients. Ann Oncol. 1999;10(10):1181-1184.
170 Zinzani PL, Chierichetti F, Zompatori M, et al. Advantages of positron emission tomography (PET) with respect to computed tomography in the follow-up of lymphoma patients with abdominal presentation. Leuk Lymphoma. 2002;43(6):1239-1243.
171 Patronas NJ, Di Chiro G, Brooks RA, et al. Work in progress: [18F] fluorodeoxyglucose and positron emission tomography in the evaluation of radiation necrosis of the brain. Radiology. 1982;144(4):885-889.
172 Patronas NJ, Di Chiro G, Kufta C, et al. Prediction of survival in glioma patients by means of positron emission tomography. J Neurosurg. 1985;62(6):816-822.
173 Di Chiro G. Positron emission tomography using [18F] fluorodeoxyglucose in brain tumors. A powerful diagnostic and prognostic tool. Invest Radiol. 1987;22(5):360-371.
174 Farber LA, Benard F, Machtay M, et al. Detection of recurrent head and neck squamous cell carcinomas after radiation therapy with 2-18F-fluoro-2-deoxy-D-glucose positron emission tomography. Laryngoscope. 1999;109(6):970-975.
175 Goerres GW, Schmid DT, Bandhauer F, et al. Positron emission tomography in the early follow-up of advanced head and neck cancer. Arch Otolaryngol Head Neck Surg. 2004;130(1):105-109.
176 Kubota K, Yokoyama J, Yamaguchi K, et al. FDG-PET delayed imaging for the detection of head and neck cancer recurrence after radio-chemotherapy: comparison with MRI/CT. Eur J Nucl Med Mol Imaging. 2004;31(4):590-595.
177 Frank SJ, Chao KS, Schwartz DL, et al. Technology insight: PET and PET/CT in head and neck tumor staging and radiation therapy planning. Nat Clin Pract Oncol. 2005;2(10):526-533.
178 Ding M, Newman F, Raben D. New radiation therapy techniques for the treatment of head and neck cancer. Otolaryngol Clin North Am. 2005;38(2):371-395. vii–viii
179 Ryan WR, Fee WEJr, Le QT, Pinto HA. Positron-emission tomography for surveillance of head and neck cancer. Laryngoscope. 2005;115(4):645-650.
180 Morris MJ, Akhurst T, Osman I, et al. Fluorinated deoxyglucose positron emission tomography imaging in progressive metastatic prostate cancer. Urology. 2002;59:913.
181 Macapinlac HA, Humm JL, Akhurst T, et al. Differential metabolism and pharmacokinetics of L-[1-11C-] methionine and 2-[18F] fluoro-2-deoxy-D-glucose (FDG) in androgen independent prostate cancer. Clin Positron Imaging. 1999;2:173-181.
182 Nunez R, Macapinlac HA, Yeung HW, et al. Combined 18F-FDG and 11C-methionine PET scans in patients with newly progressive metastatic prostate cancer. J Nucl Med. 2002;43:46.
183 Wells P, Gunn RN, Alison M, et al. Assessment of proliferation in vivo using 2-[11C]thymidine positron emission tomography in advanced intra-abdominal malignancies. Cancer Res. 2002;62:5698.
184 Blasberg RG, Roelcke U, Weinreich R, et al. Imaging brain tumor proliferative activity with [124I]iododeoxyuridine. Cancer Res. 2000;60:624.
185 Vesselle H, Grierson J, Muzi M, et al. In vivo validation of 3′deoxy-3′-[18F]fluorothymidine ([18F]FLT) as a proliferation imaging tracer in humans: Correlation of [18F]FLT uptake by positron emission tomography with Ki-67 immunohistochemistry and flow cytometry in human lung tumors. Clin Cancer Res. 2002;8:3315.
186 De Jong IJ, Pruim J, Elsinga PH, et al. Visualization of prostate cancer with 11C-choline positron emission tomography. Eur Urol. 2002;42:18.
187 Kato T, Tsukamoto E, Kuge Y, et al. Accumulation of [11C]acetate in normal prostate and benign prostatic hyperplasia: Comparison with prostate cancer. Eur J Nucl Med Mol Imaging. 2002;29:1492.
188 Hofmann M, Maecke H, Borner R, et al. Biokinetics and imaging with the somatostatin receptor PET radioligand 68Ga-DOTATOC: Preliminary data. Eur J Nucl Med. 2001;28:1751.
189 DeGrado TR, Coleman RE, Wang S, et al. Synthesis and evaluation of 18F-labeled choline as an oncologic tracer for positron emission tomography: Initial findings in prostate cancer. Cancer Res. 2001;61:110.
190 Hara T, Kosaka N, Shinoura N, et al. PET imaging of brain tumor with [methyl-11C]choline. J Nucl Med. 1997;38:842.
191 Kobori O, Kirihara Y, Kosaka N, et al. Positron emission tomography of esophageal carcinoma using 11C-choline and 18F-fluorodeoxyglucose: A novel method of preoperative lymph node staging. Cancer. 1999;1(86):1638.
192 Shoup TM, Olson J, Hoffman JM, et al. Synthesis and evaluation of [18F]1-amino-3-fluorocyclobutane-1-carboxylic acid to image brain tumors. J Nucl Med. 1999;40(2):331-338.
193 Schuster DM, Votaw JR, Nieh PT, et al. Initial experience with the radiotracer anti-1-amino-3-18F-fluorocyclobutane-1-carboxylic acid with PET/CT in prostate carcinoma. J Nucl Med. 2007;48(1):56-63.
194 Rutten I, Cabay JE, Withofs N, et al. PET/CT of skull base meningiomas using 2-18F-fluoro-L-tyrosine: initial report. J Nucl Med. 2007;48(5):720-725.
195 Kwee SA, Degrado T. Prostate biopsy guided by 18F-fluorocholine PET in men with persistently elevated PSA levels. Eur J Nucl Med Mol Imaging. 2008;3:1567-1569.
196 Kwee SA, Thibault GP, Stack RS, et al. Use of Step-Section Histopathology to Evaluate (18)F-Fluorocholine PET Sextant Localization of Prostate Cancer. Mol Imaging. 2008;7(1):12-20.
197 Shields AF, Mankoff DA, Link JM, et al. Carbon-11-thymidine and FDG to measure therapy response. J Nucl Med. 1998;39(10):1757-1762.
198 Freudenberg LS, Antoch G, Frilling A, et al. Combined metabolic and morphologic imaging in thyroid carcinoma patients with elevated serum thyroglobulin and negative cervical ultrasonography: role of (124)I-PET/CT and FDG-PET. Eur J Nucl Med Mol Imaging. 2008;35(5):950-957.
199 Dehdashti F, Mortimer JE, Trinkaus K, et al. PET-based estradiol challenge as a predictive biomarker of response to endocrine therapy in women with estrogen-receptor-positive breast cancer. Breast Cancer Res Treat. 2009;113:509-517.
200 Peterson LM, Mankoff DA, Lawton T, et al. Quantitative imaging of estrogen receptor expression in breast cancer with PET and 18F-fluoroestradiol. J Nucl Med. 2008;49(3):367-374.
201 Larson SM, Morris M, Gunther I, et al. Tumor localization of 16beta-18F-fluoro-5alpha-dihydrotestosterone versus 18F-FDG in patients with progressive, metastatic prostate cancer. J Nucl Med. 2004;45(3):366-373.
202 Dehdashti F, Picus J, Michalski JM, et al. Positron tomographic assessment of androgen receptors in prostatic carcinoma. Eur J Nucl Med Mol Imaging. 2005;32(3):344-350.
203 Divgi CR, Pandit-Taskar N, Jungbluth AA, et al. Preoperative characterisation of clear-cell renal carcinoma using iodine-124-labelled antibody chimeric G250 (124I-cG250) and PET in patients with renal masses: a phase I trial. Lancet Oncol. 2007;8(4):304-310.
204 Ratib O, Ligier Y, Scherrer JR. Digital image management in medicine. Comput Med Imaging Graph. 1994;18:73.
205 American College of Radiology, National Electrical Manufacturers Association. Digital Imaging and Communications in Medicine (DICOM): Version 3.0. Washington, DC: Draft Standard of the ACR-NEMA Committee Working Group VI; 1993.
206 Lutz RW, Pun T, Pellegrini C. Colour displays and look-up tables: real time modification of digital images. Comput Med Imaging Graph. 1991;15:73.
207 Gonzalez RC, Wintz P. Digital image processing. Boston: Addison-Wesley; 1987.
208 Russ JC. The image processing handbook. Boca Raton, FL: CRC Press; 1994.
209 Oran BE. Fast Fourier transform and its applications. Upper Saddle River, NJ: Prentice Hall; 1988.
210 Robb RA. Three dimensional biomedical imaging. New York: VCH Publishers, Inc; 1995.
211 Sonka M, Fitzpatrick JM. Handbook of medical imaging, Volume 2: medical image processing and analysis. Bellingham, WA: SPIE; 2000.
212 Kass M, Witkin A, Terzopoulos D. Snakes: Active contour models. Int J Comp Vision. 1988;2(4):321-331.
213 Castleman KR. Digital image processing, Upper Saddle River. NJ: Prentice Hall; 1996.
214 Sonka M, Hlavac V, Boyle R. Image processing, analysis, and machine vision. London: Chapman and Hall Computing; 1993.
215 Ragan D, Starckschall G, McNutt T, et al. Semiautomated four-dimensional computed tomography segmentation using deformable models. Med Phys. 2005;32(7):2254.
216 Le Guyader C, Vese LA. Self-repelling snakes for topology-preserving segmentation models. IEEE Trans Imag Proc. 2008;17(5):767.
217 Barber DC, Hose DR. Automatic segmentation of medical images using image registration: diagnostic and simulation applications. J Med Eng Tech. 2005;29(2):53.
218 El Naqa I, Yang D, Apte A, et al. Concurrent multimodality image segmentation by active contours for radiotherapy treatment planning. Med Phys. 2007;34(12):4738.
219 Peters TM. Multi-planar transformations of CT images. J Can Assoc Radiol. 1980;31:126.
220 Rhodes ML, Glenn WV, Azzawi YM. Extracting oblique planes from serial CT sections. J Comput Assist Tomogr. 1980;4:649.
221 Watt A. 3D computer graphics. Boston: Addison-Wesley; 1993.
222 Semelka RC, Shoenut JP, Kroeker MA, et al. Focal liver disease: Comparison of dynamic contrast-enhanced CT and T2 weighted fat suppressed, FLASH, and dynamic gadolinium-enhanced MR imaging at 1.5T. Radiology. 1992;184:687.
223 Whitney WS, Herfkens RJ, Jeffrey RB, et al. Dynamic breath-hold multiplanar spoiled gradient-recalled MR imaging with gadolinium enhancement for differentiating hepatic hemangiomas from malignancies at 1.5T. Radiology. 1993;189:863.
224 Jacquez JA. Compartmental analysis in biology and medicine. Ann Arbor: The University of Michigan Press; 1988.
225 Bidaut LM. Composite PET and MRI for accurate localization and metabolic modeling: A very useful tool for research and clinic. SPIE Medical Imaging. 1991;1445:66.
226 Bidaut LM, Pascual-Marqui R, Delavelle J, et al. Three- to five dimensional biomedical multisensor imaging for the assessment of neurological (dys)function. J Digit Imaging. 1996;9:185.
227 Ferris JV, Marsh JW, Little AF. Presurgical evaluation of the liver transplant candidate. Radiol Clin North Am. 1995;33:497.
228 Pietrzyk U, Herholz K, Fink G, et al. An interactive technique for three-dimensional image registration: Validation for PET, SPECT, MRI and CT brain studies. J Nucl Med. 1994;35:2011.
229 Arun KS, Huang TS, Blostein SD. Least square fitting of two 3D point sets. IEEE Trans Pattern Mach Intell. 1987;9:698.
230 Pelizzari CA, Chen GTY, Spelbring DR, et al. Accurate three-dimensional registration of CT, PET, and/or MR images of the brain. J Comput Assist Tomogr. 1989;13:20.
231 Meyer CR, Leichtman GS, Brunberg JA, et al. Simultaneous usage of homologous points, lines and planes for optimal 3D linear registration of multimodality imaging data. IEEE Trans Med Imaging. 1995;14:1.
232 Mangin JF, Frouin V, Bloch I, et al. Fast nonsupervised 3D registration of PET and MR images of the brain. J Cereb Blood Flow Metab. 1994;14:749.
233 van Herk M, Kooy HM. Automatic three-dimensional correlation of CT-CT, CT-MRI, and CT-SPECT using chamfer matching. Med Phys. 1994;21:1163.
234 Bruce J, Giblin P, Tari F. Ridges, crests and sub-parabolic lines of evolving surfaces. Int J Comp Vision. 1996;18:195.
235 Schreibmann E, Xing L. Image registration with auto-mapped control volumes. Med Phys. 2006;33(4):1165.
236 Nelder JA, Mead R. A Simplex method for function minimization. Comput J. 1965;7:308.
237 Powell MJD. Restart procedure of the conjugate gradient method. Math Programming. 1977;12:241.
238 Woods R, Mazziotta JC, Cherry S. MRI-PET registration with automated algorithm. J Comput Assist Tomogr. 1993;17:536.
239 Maes F, Collignon A, Vandermeulen D, et al. Multimodality image registration by maximization of mutual information. IEEE Trans Med Imaging. 1997;2:187.
240 Meyer CR, Boes JL, Kim B, et al. Demonstration of accuracy and clinical versatility of mutual information for automatic multimodality image fusion using affine and thin plate spline warped geometric deformations. Med Image Anal. 1997;3:195.
241 Loew MH. Issues in multimodality medical image registration. J Digit Imaging. 1997;10:24.
242 West J, Fitzpatrick JM, Wang MY, et al. Comparison and evaluation of retrospective intermodality brain registration techniques. J Comp Assist Tomogr. 1997;21:554.
243 Vemuri BC, Ye J, Chen Y, et al. Image registration via level-set motion: applications to atlas-based segmentation. Med Imag Anal. 2003;7:1.
244 Guerrero T, Zhang G, Huang TC, et al. Intrathoracic tumour motion estimation from CT imaging using the 3D optical flow method. Phys Med Biol. 2004;49:4147.
245 Shekhar R, Walimbe V, Raja S, et al. Automated 3-dimensional elastic registration of whole-body PET and CT from separate or combined scanners. J Nucl Med. 2005;46(9):1488.
246 Guerrero T, Sanders K, Castillo E, et al. Dynamic ventilation imaging from four-dimensional computed tomography. Phys Med Biol. 2006;51:777.
247 Kaus MR, Brock KK, Pekar V, et al. Assessment of a model-based deformable image registration approach for radiation therapy planning. Int J Radiation Oncology Biol Phys. 2007;68(2):572.
248 Jannin P, Grova C, Maurer CR. Model for defining and reporting reference-based validation protocols in medical image processing. Int J CARS. 2006;1:63.
249 Austin-Seymour M. Interinstitutional comparison of defining target volumes. Int J Radiat Oncol Biol Phys. 1994;30(suppl 1):117.