Chapter 66 Heart Rate Variability and Heart Rate Turbulence
Heart Rate Variability
Heart rate variability (HRV) refers to beat-to-beat changes in R-R intervals and is believed to reflect the continuous interplay between sympathetic and vagal tones.1–4 Under normal physiological conditions, a sinus node plays a role of a heart’s pacemaker, possessing its own intrinsic activity and being under the influence of the autonomic nervous system. A variety of internal and external stimuli are known to change the balance between sympathetic and vagal tones. Consequent changes in heart rate may therefore occur in response to mental or physical stresses, cardiac or noncardiac disease conditions, or medications. Autonomic nervous system imbalance, which is generally defined as an increased sympathetic tone and decreased vagal tone, has been proven to be associated with increased risk of cardiac mortality. Therefore, HRV has become an important tool in identifying patients at risk of cardiovascular death.1–7
Heart Rate Variability Measurements
Assessment of HRV is performed by several methods, including time-domain and frequency-domain analyses as well as nonlinear techniques.1–7 The analysis is usually based on long-term (at least 18-hour) Holter electrocardiogram (ECG) recordings. Short-term analyses could be performed on recordings of as short as 5 minutes’ duration, which usually are obtained under controlled, standardized conditions to avoid the influence of external stimuli that may affect the autonomic nervous tone.
Time-Domain Heart Rate Variability Analysis
Time-domain HRV parameters can be derived from direct measurements of N-N intervals or from the differences between N-N intervals.1–35 The simplest, and most commonly used HRV parameter is the standard deviation of all N-N intervals (SDNN) calculated over a long-term period (Figure 66-1). rMSSD and pNN50 (defined in Table 66-1, along with other parameters derived from the time-domain analysis) are considered as measurements predominantly reflecting parasympathetic modulation of the heart.1,2 SDNN, SDANN, and SDNNIX (also defined in Table 66-1) reflect the overall variability as well as the variability with a predominant parasympathetic influence. Among time-domain HRV parameters, no parameter could be considered to represent predominantly sympathetic modulation of the heart. Values of time-domain HRV parameters are frequently decreased in patients with cardiac (post-infarction status, cardiomyopathies) and noncardiac conditions (diabetes) and may indicate increased risk of mortality.1–5
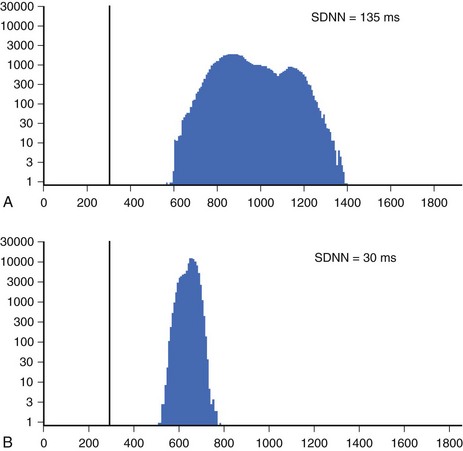
Table 66-1 Time-Domain and Frequency-Domain Heart Rate Variability Parameters
| VARIABLE | UNITS | DESCRIPTION |
|---|---|---|
| TIME-DOMAIN | ||
| SDNN | ms | Standard deviation of all N-N intervals |
| SDANN | ms | Standard deviation of the averages of N-N intervals in all 5-minute segments of the entire recording |
| SDNNIX | ms | Mean of all the 5-minute standard deviations of N-N during the entire recording intervals |
| rMSSD | ms | Square root of the mean of the sum of the squares of differences between adjacent N-N intervals |
| pNN50 | Percent of difference between adjacent N-N intervals >50 ms | |
| FREQUENCY-DOMAIN | ||
| Total power | ms2 | Variance of all N-N intervals <0.4 Hz |
| ULF | ms2 | Ultra-low frequency <0.003 Hz |
| VLF | ms2 | Very low frequency <0.003 to 0.04 Hz |
| LF | ms2 | Low frequency power 0.04 to 0.15 Hz |
| HF | ms2 | High frequency power 0.15 to 0.4 Hz |
| LF/HF | Ratio | Ratio of low-/high-frequency power |
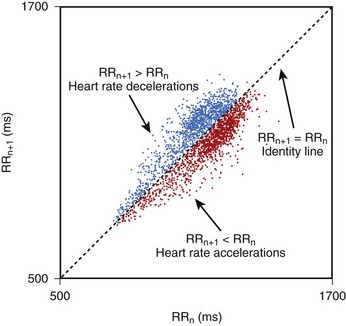
Geometric methods convert a series of R-R intervals into geometric patterns such as sample density distribution of N-N intervals or the Lorenz plot of N-N intervals.5,8 Geometric methods create histograms of various interval frequencies and are believed to be less affected by noise and artifacts during computerized processing of ECG recordings. The HRV triangular index is determined by dividing the total number of N-N intervals by the maximum of the density distribution.8 This index represents overall HRV, and lower values are associated with increased mortality. In the case of Lorenz or Poincaré plots, subjects with preserved HRV are characterized by a fan-shaped plot, whereas those with depressed HRV are characterized by narrow plots.1–3 Heart rate asymmetry is a recently discovered physiological phenomenon that reflects the larger contribution of heart rate decelerations compared with accelerations to short-term heart rate variability. (Figure 66-2).9 An abnormal structure of heart rate asymmetry has been shown to be associated with increased risk of all-cause mortality in patients with previous myocardial infarction (MI).
It is recommended that for time-domain measurement over the long term, at least 18-hour ECG recordings encompassing morning and night hours should be used. It is also emphasized that time-domain measurements of HRV, obtained from periods of different durations, should not be compared because the length of recording significantly influences the overall variability values.1,10,11 The task force on HRV analysis recommends the following measures for time-domain assessment: SDNN, HRV triangular index, SDANN, and rMSSD.1 It is assumed that SDNN and HRV triangular index estimate the overall HRV, SDANN reflects the long-term component of HRV, and rMSSD and pNN50 estimate predominantly parasympathetic modulation.
Frequency-Domain Heart Rate Variability Analysis
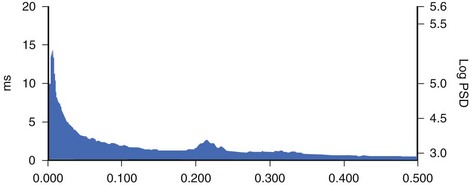
Spectral analysis provides information on how the power of HRV is distributed as a function of frequency and is usually performed on the basis of short-term recordings (5 minutes), even though long-term recordings may also be used.1,6 Such analysis aims to separate the different frequency components of an entire R-R interval modulation (Figure 66-3). The most frequently used approach to compute spectral indexes is based on the fast Fourier transformation. The total power of R-R interval variability is the total variance and corresponds to the sum of the four spectral bands: low frequency (LF), high frequency (HF), very low frequency (VLF), and ultra-low frequency (ULF) (see Table 66-1). Spectral analysis obtained from short-term recordings is characterized by three major components: (1) the HF component, (2) the LF component, and (3) the VLF component. Although vagal tone is considered a major contributor to the HF component, LF is believed to reflect both sympathetic and vagal influences. Sympathovagal balance is frequently expressed by an LF/HF ratio. In a healthy subject during resting, controlled conditions, a slight predominance of LF over HF is seen; therefore, the LF/HF ratio is usually between 1 and 2. VLF represents the numerous influences on the heart, including thermoregulation, the renin-angiotensin system, and endothelial factors, but it is also considered a measure of sympathetic activity. The ULF spectral component represents very low oscillations and might reflect circadian and neuroendocrine rhythms. The power of the spectral components may be expressed in absolute (ms2) and normalized units (nu). Normalized units are obtained as follows:
For frequency-domain methods, at least a 1-minute recording is needed to assess the HF component, whereas 2 minutes are required for LF analysis. Nevertheless, for standardization, 5-minute recordings in controlled conditions are recommended.1,10
Despite different techniques of analysis, time and frequency parameters are strongly correlated to each other. Time-domain methods are preferred for long-term recording analysis. Currently, the majority of commercial Holter devices provide an automatic measurement of HRV parameters. It should be considered, however, that independent of the method applied, careful editing of R-R intervals is needed. The task force on HRV recommends that for standardization of physiological and clinical studies, two types of recordings should be used: (1) short-term 5- minute recordings in stable conditions with frequency domain analysis; and (2) 24-hour recordings with time-domain analysis. Spectral analysis could also be performed on the entire 24-hour period, from 5-minute segments yielding LF and HF values and averaged over the entire 24-hour period. The methodology of HRV measurement was standardized in a special report of the Task Force of the European Society of Cardiology/Heart Rhythm Society (ESC/HRS) in 1999 and in the American College of Cardiology/American Heart Association (ACC/AHA) guidelines for ambulatory electrocardiography.1,10
Nonlinear Heart Rate Variability Analysis
The last decade brought an increasing interest in nonlinear methods to analyze heart rate variability. Nonlinear analysis is believed to be less dependent on the pre-processing edition of beats and to express a more complex nature of R-R interval variability. Even though the exact pathophysiological background of nonlinear indices has not been fully clarified, evidence exists that a more complicated mathematical approach may be superior to conventional HRV parameters in risk stratification. Methods that have been proven to provide prognostic information are detrended fluctuation analysis, power law relationship analysis, and approximate entropy.7,11–13
Clinical Covariates of Heart Rate Variability
Numerous conditions affect sympathovagal status and influence heart rate and its variability. Age has been reported as a major determinant of HRV with constant decline in time-domain and frequency-domain parameters over the course of a person’s life.14 Approximately, a 15% decline in LF and HF power was reported for every 10 years, with an early fall in the HF component.15 Women tend to have lower SDNN and LF but higher HF values compared with men. Nevertheless, these differences weaken with age and gender; the diminishing of differences around menopausal age suggests a potential hormonal influence on the autonomic nervous system.16
Decrease in HRV has consistently been observed in patients after MI and is reported to contribute to both structural changes of the left ventricle and to a decrease in vagal activity or to blunted response of a sinus node to autonomic regulation.17 Consequently, it has been postulated that such a shift toward increased sympathetic activity and loss of vagal protection may contribute to enhanced arrhythmogenesis and subsequent sudden cardiac death (SCD) caused by lethal arrhythmias. Patients with previous MI are therefore characterized by a significant reduction in SDNN, which is correlated with the degree of left ventricular dysfunction and parallel decrease in spectral components.18,19 Decreased HRV parameters have been observed not only in patients after MI but also in nonischemic cardiomyopathy and in a steadily growing population of patients with heart failure, including those with preserved left ventricular function. The extent of HRV reduction correlates with the advancement of heart failure expressed by measurements of ejection fraction (EF), New York Heart Association (NYHA) class, or B-type natriuretic peptide (BNP) levels.20–23
HRV is known to be modified by a variety of drugs, reperfusion strategies, regular exercise training, and cardiac resynchronization. The initial impact of thrombolysis on HRV in patients with acute MI was confirmed more recently by studies involving patients undergoing invasive reperfusion procedures with percutaneous coronary angioplasty.24 Recent years have brought additional information that in patients with heart failure changes in HRV after cardiac resynchronization therapy (CRT), implantation may identify CRT responders. Low HRV values before implantation and no increase during postprocedural follow-up identify patients at risk of progression to heart failure.25,26
Clinical Applications of Heart Rate Variability
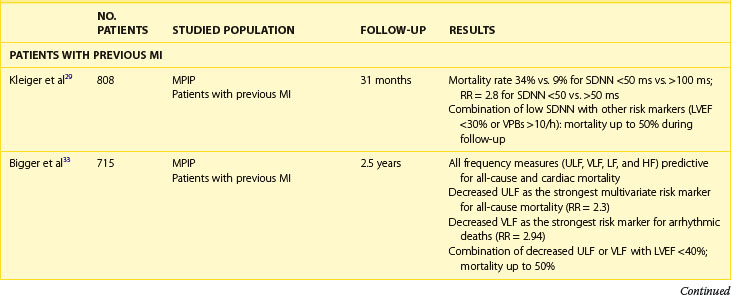
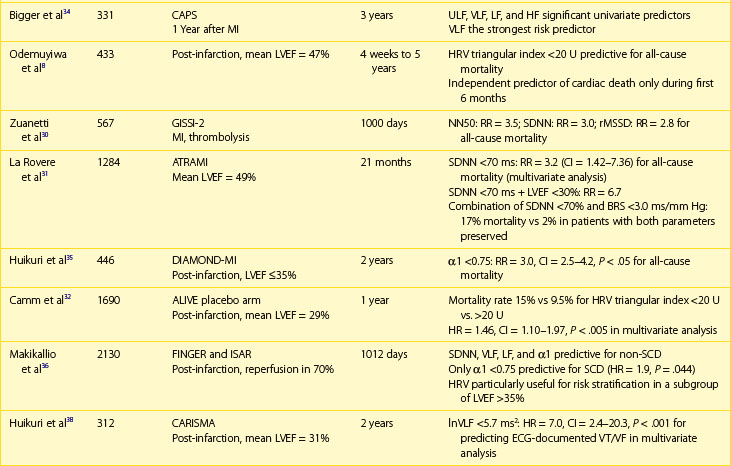
The association between abnormal HRV, impaired autonomic nervous tone, and cardiovascular mortality is well documented (Table 66-2). Even though experimental data indicated an association between impaired HRV and the preponderance toward ventricular arrhythmias, data on the association between decreased HRV and SCD are conflicting. Most post-infarction and heart failure studies indicate that depressed HRV mainly identifies patients at risk of overall mortality, with less evidence for the association with arrhythmic death. Evidence linking depressed HRV with implantable cardioverter-defibrillator (ICD)–documented ventricular tachycardia (VT) or ventricular fibrillation (VF) is limited.1–7
Patients with Previous Myocardial Infarction
The clinical relevance of HRV as a prognostic tool was first appreciated in 1965 by Hon and Lee.27 Nevertheless, its history in cardiac risk stratification came about in the late 1980s when the first publications on HRV as a risk stratifier in patients with previous MI were published.28,29 In 1987, Kleiger et al, of the Multicenter Post-Infarction Project (MPIP), reported than an SDNN of less than 50 ms was associated with more than a fivefold higher risk of mortality during a 31-month follow-up of more than 800 survivors of MI, compared with those with SDNN greater than 100 ms.29 Low HRV remained a significant predictor of mortality after adjustment for other significant stratifiers such as EF, Killip Kimball class, and ventricular premature beats (VPBs). However, a combination of reduced SDNN with any of a group of risk markers (≥10 VPBs per hour, left ventricular ejection fraction [LVEF] <30%, failure to perform exercise test, or heart rate >80 beats/min) identified patients with a mortality rate of 50% during a follow-up.
Multiple publications from the 1990s consistently confirmed the predictive value of HRV parameters in patients with previous MI.30–32 The Grupo Italiano per 10 Studio della Sopravvivenza nell’Infarto miocardico (GISSI) study in 567 males treated with thrombolysis revealed that SDNN, pNN50, and rMSSD were independently associated with all-cause mortality during a 3-year follow-up and thus confirmed the predictive value of HRV in the thrombolytic era.30 The Autonomic Tone and Reflexes After Myocardial Infarction (ATRAMI) study enrolled low-risk patients with previous MI and demonstrated that SDNN less than 70 ms was associated with a threefold higher mortality rate (relative risk [RR], 3.2).31 Both SDNN less than 70 ms as well as low baroreflex sensitivity (BRS; <3 ms/RR) were significantly associated with an adverse outcome, and a combination of having both decreased SDNN and decreased BRS identified patients with a 17% mortality rate compared with 2% in patients with both parameters within higher value.31 Predictive accuracy of SDNN was further significantly improved when analyzed together with low EF. In the placebo arm of the Azimilide Post-Infarct Survival Evaluation (ALIVE) trial of patients with previous MI and depressed LVEF, low HRV triangular index (<20 U) was found to identify patients at higher risk for death at 1 year compared with those with HRV index greater than 20 U (15 vs. 9.5%, P < .005).32 Nevertheless, no significant relationship with arrhythmic events was observed. The majority of studies focused on time-domain parameters assessed from 24-hour Holter recordings; however, other reports have provided information on the prognostic role of spectral HRV measurements.33–35 Bigger et al found that 5-minute time-domain and frequency-domain parameters calculated on the basis of randomly chosen 5-minute periods, provided significant, although weaker, prognostic information compared with the same parameters calculated over a 24-hour period in patients from MPIP.33
Acute coronary syndromes are currently managed with the wide use of primary angioplasty and β-blockers. Makikallio et al addressed the prognostic role of Holter-derived risk parameters in the stratification of patients with previous MI treated according to current guidelines.36 On the basis of a study of 2130 patients, of whom 70% underwent invasive coronary revascularization and 94% were treated with a β-blocker, the authors documented that all HRV parameters except HF (SDNN <70 ms, lnVLF <5.3, lnLF <3.85, and degree of frequency analysis [DFA, α1]) were significant univariate predictors of SCD and non-SCD deaths, but only LF and α1 predicted non-SCD mortality when adjusted for significant clinical covariates. Only reduced α1 was able to independently identify patients at risk of SCD during a median of 1012 days of follow-up (hazard ratio [HR], 1.9; 95% confidence interval [CI], 1.0 to 3.6; P = .0444). Of note, HRV parameters (α1 and VLF) were able to predict SCD among patients with previous MI who had an LVEF greater than 35%. Nevertheless, it should be stressed that in concordance with recent observations on lower incidence of SCD in patients with previous MI undergoing aggressive reperfusion, only 52 SCDs occurred in a studied population (2.5%), with the majority in patients with LVEF greater than 35%. The Risk Estimation Following Infarction Non-invasive Evaluation (REFINE) study failed to demonstrate the usefulness of decreased SDNN in predicting cardiac death or resuscitated cardiac arrest in 322 patients with an acute infarction and LVEF less than 50%.37
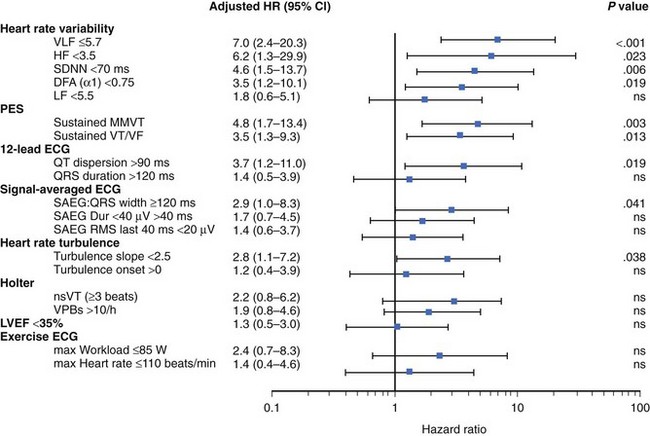
The recently published Clopidogrel for High Atherothrombotic Risk and Ischemic Stabilization, Management, and Avoidance (CARISMA) study is the first study to evaluate a variety of ECG markers in predicting arrhythmic events (VF or VT) documented by the implantable loop recorder.38 In patients evaluated 6 weeks after an acute MI, SDNN, VLF, LF, and the fractal scaling component analyzed as continuous variables were independently associated with all-cause mortality as well as primary arrhythmic endpoint documented by the implantable loop recorder. It is worth emphasizing that only α1 was associated with arrhythmic events when risk stratifiers were evaluated in an early post-infarction period (1 week). When categorized values were used, a decreased VLF component (VLF ≤5.7) had the highest HR (7.0, P < .001), followed by HF less than 3.5 (HR, 6.2; P = .023), SDNN less than 70 ms (HR, 4.6; P = .006), and α1 less than 0.75 (HR, 3.5; P = .019) (Figure 66-4).
Patients with Heart Failure
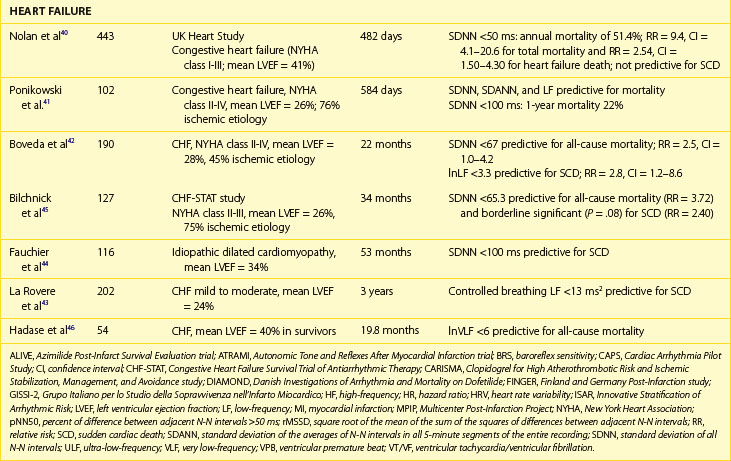
Decreased HRV has been considered for years to be an independent and strong marker of risk for all-cause mortality or death caused by heart failure, whereas data on predicting SCD in this population are limited.38–44 Early reports on the predictive value of HRV showed that reduced HRV parameters were related to a 20-fold increased risk of death in patients awaiting heart transplantation.39 In the UK-Heart Study SDNN, less than 50 ms was associated with death from progressive heart failure but failed to predict SCD.40 SDNN is the most extensively studied HRV risk stratifier, but no consensus on the cut-off has been achieved so far. The other studies indicated SDNN less than 100 ms, 67 ms, or 65.3 ms as predictors of death in patients with heart failure.41,42 Despite different cut-offs, a constant trend is seen in all the published studies toward the high prognostic value of depressed HRV in predicting death from heart failure and all-cause mortality.
More controversies exist in terms of frequency-domain components. The findings of these studies are difficult to compare, mainly because of different methodologic approaches. Decreased LF and VLF components are the most frequently reported HRV spectral measures related with poor outcome in patients with heart failure.43–47 La Rovere et al reported that low-frequency power measured from short-term recordings during controlled breathing was a powerful predictor of SCD in 202 patients with moderate to severe congestive heart failure.43 It should also be emphasized that different components of spectral analysis were documented to be related to different types of death. In a group of 330 patients with congestive heart failure in NYHA class I to III, decreased nighttime VLF was related to progressive heart failure, whereas decreased nighttime LF values were associated with SCD.47 Nonlinear HRV measures were also reported to provide prognostic information on mortality in patients with CHF.11–13 Maestri et al, who aimed to compare several nonlinear HRV methods in predicting mortality in patients with congestive heart failure, demonstrated that despite differences in prognostic values, assessment of nonlinear indexes provides important prognostic information in addition to clinical data.13
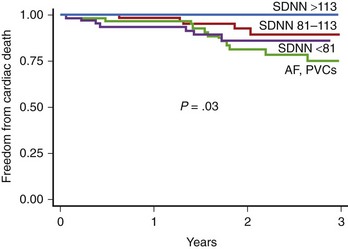
The prognostic role of HRV in the prediction of SCD in patients with congestive heart failr remains controversial. Most studies support the prognostic value of HRV in predicting the progression of heart failure. Only a study of Fauchier et al showed that reduced SDNN (less than 100 ms) was an independent risk predictor of SCD and arrhythmic events in patients with dilated cardiomyopathy.44 Rashba et al in the Defibrillators in Non-ischemic Cardiomyopathy Treatment Evaluation (DEFINITE) trial demonstrated that SDNN greater than 113 ms identified patients with 0% mortality during a 3-year follow-up.48 Preserved SDNN also identified patients with 0% SCD and ICD shocks rates (Figure 66-5). It is therefore plausible that preserved function of the autonomic nervous system may serve to identify low-risk patients with previous MI. It cannot be excluded that the paucity of clear evidence for the association between depressed HRV parameters and SCD might be associated with difficulty in categorizing the sudden or arrhythmic nature of death. The autonomic nervous system operates differently in various patients, depending on the disease as well as the advancement of the disease process. HRV parameters successfully predict worsening of the congestive heart failure and total mortality in patients with congestive heart failure, indicating that autonomic dysfunction is part of the overall clinical picture in such patients, but these parameters seem to have little or no prognostic significance for predicting arrhythmic events in these patients.
Heart Rate Turbulence
Heart rate turbulence (HRT), a heart rate–derived noninvasive parameter that tracks the response of heart rate to ventricular arrhythmias, was introduced into electrocardiology in 1999.49 Since then, abnormal HRT reaction has been proven to provide significant and independent prognostic information in various populations, including patients with MI and heart failure.50
Heart Rate Turbulence Measurement
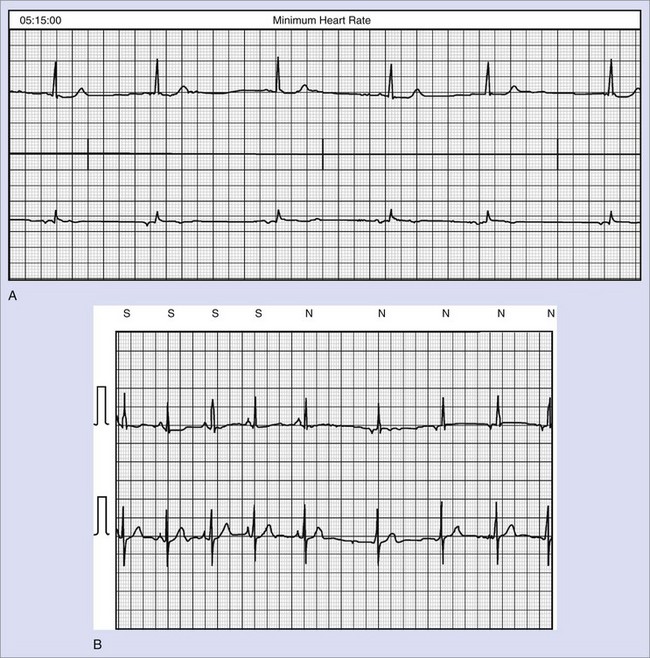
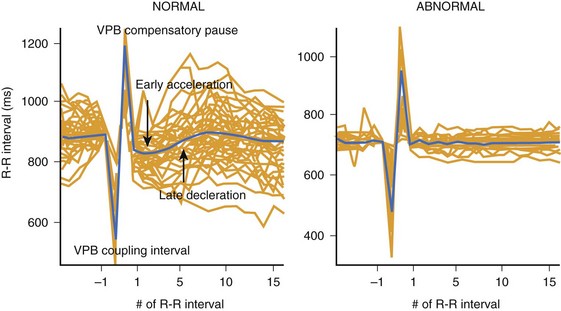
Schmidt et al described HRT as a pattern of the response of a sinus node to a VPB, which, under normal physiological conditions, consists of a biphasic reaction characterized by an early acceleration phase and subsequent deceleration of heart rate following VPB.49 The above-mentioned changes in sinus rhythm are observed within 15 R-R intervals following VPB and, because of their subtle nature, these changes require computer algorithms for detection (Figure 66-6). HRT reaction is described by two numeric parameters: (1) turbulence onset (TO), reflecting the initial acceleration, and (2) turbulence slope (TS), describing subsequent deceleration of sinus rhythm. TO is defined is a percentage of relative change of the mean of 2 R-R intervals before and two R-R intervals after a VPB, whereas TS is described as a maximum regression line computed in every five consecutive R-R intervals following VPB and is expressed in ms/RR. TO is calculated as a mean of all TO values corresponding to subsequent VPBs, and TS is calculated on the basis of a local averaged VPBs tachogram (see Figure 66-6). Special algorithms are applied to calculate a reliable HRT reaction. An ECG strip, including a VPB with neighboring 20 R-R intervals free of artifacts and other premature beats, is required for analysis. In addition, because it was considered that only a VPB provoking a long compensatory pause may trigger the classic biphasic HRT reaction, different algorithms were applied to exclude interpolated VPBs. Recent guidelines on HRT measurements suggest that at least five VPBs should be present in the entire recording to consider HRT analysis as reliable. Nevertheless, it should be noted that early papers that reported a high prognostic value of HRT in predicting outcome in patients with previous MI and heart failure included patients with at least one VPB present.49,51–54 HRT analysis was developed and primarily applied to 24-Holter recordings; nevertheless, data indicating that HRT may also be assessed from shorter recordings (e.g., 10 minutes) or from R-R data retrieved from implanted devices are available. A possibility to assess HRT parameters using induced VPBs during electrophysiological studies or via ICDs also exists.55–57
A detailed methodology of HRT calculation is available at www.h-r-t.org, and standards of measurement, physiological interpretation, and clinical use are summarized in the consensus statement written under the auspices of the International Society for Holter and Noninvasive Electrocardiology.50
Pathophysiological Mechanism of Heart Rate Turbulence
Even though the exact mechanism of the HRT phenomenon has not been fully clarified, most data have indicated that it may be mediated via the baroreceptor reflex. Baroreceptors, localized in the aortic arch and carotid sinus, are constantly stimulated by tonic arterial blood pressure and, being more responsive to sudden hypotonia than to an increase in blood pressure, they constitute one of the basic mechanisms of heart rate and blood pressure control. VPBs result in a short transient drop in blood pressure, which triggers the activation of baroreceptors, leading to immediate withdrawal of parasympathetic activation and predominance of sympathetic activation, resulting in heart rate acceleration. The subsequent increase in blood pressure, explained also by augmented myocardial contractility following the premature contraction, leads to an opposite reaction—activation of the parasympathetic arch and decrease in heart rate.58–60 These two subsequent phases therefore create a biphasic curve of HRT reaction. Post-extrasystolic potentiation is the other mechanism possibly interplaying with different HRT patterns, such as that documented in patients with dilated cardiomyopathy.61
A significant correlation between HRT and baroreflex reaction was confirmed by numerous experimental and clinical studies.51,60,61 Retrospective analysis of ATRAMI data documented a significant correlation between spontaneous as well as phenylephrine-induced baroreflex sensitivity and heart rate turbulence.51 Abnormal HRT is also believed to reflect the loss of vagal protection against arrhythmic events, which may explain its role as an SCD risk stratifier. As documented by a few small clinical studies, HRT parameters remain significantly attenuated (decreased TS and increased TO) after atropine-induced blockade.60,62
Clinical and Electrocardiogram Covariates of Heart Rate Turbulence
HRT parameters were found to correlate with a variety of clinical (age, LVEF, coexisting diabetes) and ECG covariates (mean heart rate, HRV, BRS).63–67 Age-related changes include decrease in TS and increase in TO, which might be explained as an effect of a reduced arterial compliance. Attenuated HRT parameters are observed in patients with autonomic nervous system disorders such as diabetes. Lower TS values and higher TO values are observed in patients with decreased LVEF. In patients with chronic heart failure, HRT was significantly correlated with not only LVEF but also with parameters reflecting heart failure advancement, such as NT-proBNP or NYHA class, giving insight into hemodynamic changes.68 In a small clinical study, abnormal HRT parameters attributed to heart failure were restored by 3 months of β-blocker therapy in 10 patients with heart failure. The evolution of TS was accompanied by parallel changes in HRV parameters reflecting parasympathetic tone.69
HRT parameters, especially TS, were found to correlate with mean heart rate and the number of VPBs.64,70 Patients with a slower heart rate and a low number of VPBs present with a steeper TS. Whether this is a pure mathematical relationship or the expression of real lower risk remains controversial. HRT was also found to be significantly correlated to HRV parameters both in time domain and frequency domain.71 HRT dependence on heart rate, number of VPBs, strong correlations with baroreflex sensitivity, and HRV should not be surprising because HRT combines all these factors. Whether these correlations strengthen or weaken the predictive value of HRT remains controversial. On one hand, the optimal risk predictor should be independent. On the other hand, a combination of risk predictors reflecting the different mechanisms participating in the chain of events leading to SCD may increase the positive predictive value and lead to more accurate identification of high-risk patients.
Temporal and circadian changes in HRT parameters were observed.70,72 Turbulence slope values were reported to be lowest in the afternoon hours in coronary in-patients, whereas no significant changes in TO values were observed.72 According to Hallstrom et al, ECG recording during daytime hours (8 AM to 6 PM) should be chosen for TS evaluation for prognostic purposes. HRT parameter dynamics after the acute phase of MI and after coronary revascularization were observed.73–75 Restoration of blunted TO values were observed 12 months after acute MI, whereas TS remained unchanged over this period.73 Percutaneous coronary intervention resulted in the restoration of HRT parameters assessed within 12 hours after the procedure compared with pre-procedure values, but only in patients with Thrombolysis in Myocardial Infarction (TIMI) grade 3 and not TIMI grade 2 flow, suggesting that attenuated microcirculation might be responsible for this finding.74 However, significant attenuation of HRT parameters, more likely because of the impairment of autonomic nervous fibers in the course of aorta clamping, was observed in patients undergoing coronary artery bypass grafting.75 TO returned to preoperative values after 12 months, whereas TS remained attenuated. This observation suggests that HRT should not be used for risk stratification purposes during the 12 months after coronary artery bypass grafing.
Heart Rate Turbulence in Risk Stratification
The concept of HRT as a risk marker is based on a fact that the above-mentioned biphasic reaction of a sinus node may be observed in healthy subjects, whereas in high-risk patients, this pattern is blunted or entirely missing (see Figure 66-6). Therefore, high-risk patients are characterized by weaker HRT reaction expressed as the absence of an immediate acceleration or even deceleration of a sinus rhythm (positive values of TO) and a weaker rate of subsequent deceleration with lower TS values (flattened slope). The original report by Schmidt et al proposed TO of 0% or greater and TS of 2.5 ms/RR or less as the abnormal values cutoffs. For risk stratification purposes, patients are categorized into three groups: (1) HRT0: both HRT parameters (TO and TS) normal; (2) HRT1: one of the parameters abnormal; and (3) HRT2: both parameters abnormal. Patients in whom HRT analysis cannot be performed because of lack of VPBs in the ECG recording are placed in the HRT0 category; for risk stratification, they are usually merged with the HRT0 group and are therefore considered to be at low risk of subsequent events.
Patients with Previous Myocardial Infarction
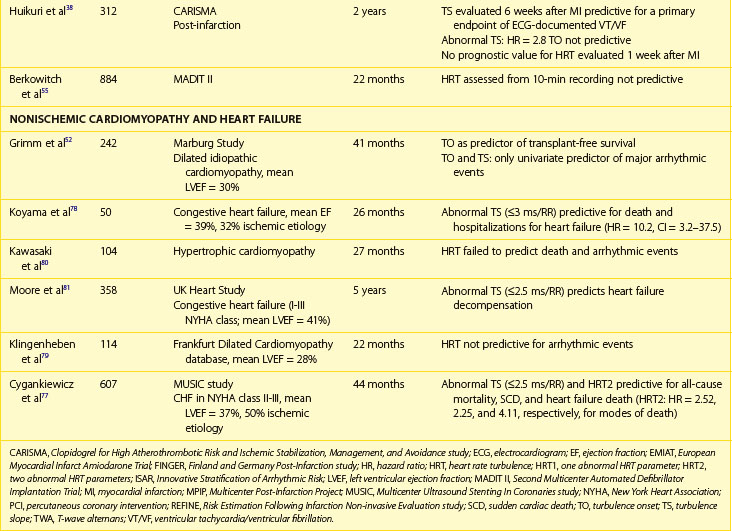
The post-infarction population is a group in which the prognostic value of HRT is particularly well documented (Table 66-3). The prognostic value of abnormal HRT reaction for predicting death was first confirmed in patients with previous MI enrolled in MPIP studies.49 In these populations, a blunted HRT reaction was independently associated with total mortality. Patients with abnormal TO and TS (HRT2) had a higher risk of death than could be evaluated just on the basis of EF assessment. In the MPIP population, 2-year mortality rates were 9%, 15%, and 32% in patients with HRT0, HRT1, and HRT2, respectively. Analysis of the placebo arm of the European Myocardial Infarct Amiodarone Trial (EMIAT) showed a similar pattern of mortality rates of 9%, 18%, and 34%, respectively (Figure 66-7).
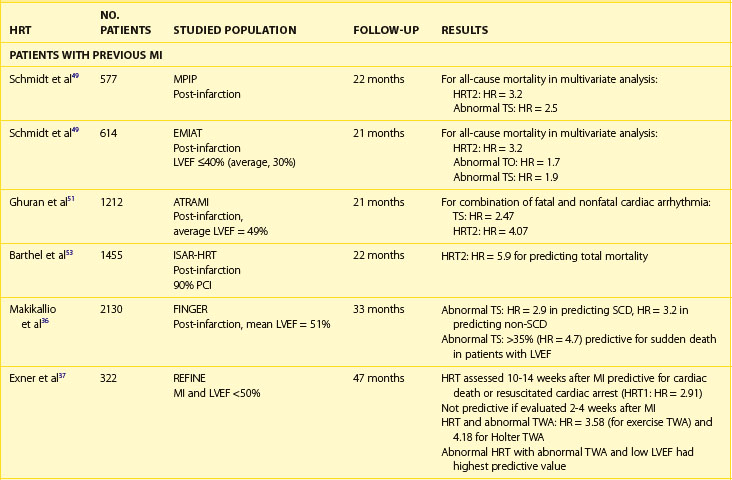
Retrospective analysis of HRT in the ATRAMI trial showed that abnormal HRT reaction can identify patients with previous MI at risk of arrhythmic events during follow-up.51 In this study, the combination of abnormal TO and TS parameters was found to be the strongest risk predictor (RR, 4.07) of cardiac arrhythmic death. Barthel et al, in the Innovative Stratification of Arrhythmic Risk (ISAR-HRT) study, documented a high predictive value of abnormal HRT parameters in 1455 patients with acute MI treated mostly with percutaneous coronary angioplasty.53 Patients from this population were treated according to recent guidelines; thus, 93% received β-blockers, 90% rceived angiotensin-converting enzyme inhibitors, and 85% received statins. In this study, HRT2 was found to be an independent predictor of 2-year mortality, providing the highest HR (5.9) followed by decreased LVEF, age, diabetes, and HRT class 1 (one abnormal parameter). Of note, HRT was found to be an independent predictor of death in patients with significantly decreased LVEF (<30%) as well as in those with LVEF greater than 30%. Because HRT2, analyzed in combination with LVEF, increased the positive predictive value to 40%, the simultaneous assessment of HRT with other parameters, especially those reflecting the myocardial substrate, could be recommended. These observations were confirmed by a study by Makikalio et al, who analyzed patients from the Finland and Germany Post-Infarction (FINGER) study and documented that abnormal TS was related with an almost threefold higher risk (HR, 2.9; CI, 1.6 to 5.5; P = .0008) of sudden death during the 33 months of follow-up in more than 2000 patients assessed in the early post-infarction period.35 Similar to what was observed in the ISAR-HRT population, TS 2.5 ms/RR or less, which was of special interest in a subgroup of patients with relatively preserved LVEF, was related to a 4.7 higher risk of SCD in patients with LVEF greater than 35%.
The results of further prospective trials strengthen the position of HRT as a strong and independent prognostic value in identifying patients at risk for mortality. The REFINE trial aimed to assess the prognostic value of noninvasive combined evaluation of autonomic nervous tone and electrical instability in predicting a primary endpoint of cardiac death or resuscitated cardiac arrest.37 The trial enrolled 322 patients with LVEF less than 50% who were followed up for a median of 47 months. Impaired HRT, abnormal T-wave alternans (TWA), and LVEF less than 50% assessed beyond 8 weeks after acute MI were significant predictors of a primary endpoint. Abnormal HRT in this study was defined as having either TO or TS abnormal versus both parameters being normal. The noninvasive parameters were analyzed twice: 2 to 4 weeks after MI and 10 to 14 weeks after an event. Only HRT analyzed between 10 and 14 weeks after MI was predictive for cardiac death of resuscitated cardiac arrest, with the highest hazard ratio among significant ECG predictors (HR, 2.91; CI, 1.13–7.48; P = .026). Interestingly, a combined assessment of HRT and abnormal TWA increased the predictive value of studied parameters significantly. Patients with abnormal HRT and TWA were characterized by a fourfold higher risk of a primary endpoint. When noninvasive ECG parameters were further combined with low LVEF, the predictive value reached a hazard ratio of 6.22, providing the highest accuracy in detecting the high-risk group. Of note, none of the ECG markers assessed in an early post-infarction phase predicted outcome. Similar findings were observed in the CARISMA study, which, for the first time, documented an arrhythmic endpoint by means of an implantable loop recorder.38 A variety of noninvasive ECG risk markers were assessed at the first and sixth weeks after an MI, and patients were followed up at 3-month intervals for up to 24 months after MI. The turbulence slope, evaluated both as a continuous as well as dichotomized value (≤2.5 ms/RR) at 6 weeks after MI, was predictive for a primary endpoint defined as ECG-documented VF or symptomatic VT. Abnormal TS was related to a 2.8 higher risk of arrhythmic event when adjusted for other significant covariates. The association was nonsignificant when HRT was assessed in an early post-infarction phase (1 week after MI). Furthermore, it should be stressed that similar to what was observed in other studies, TO alone did not provide prognostic information. Of note, combined data from the REFINE and CARISMA studies indicated that HRV and HRT improved over time following an acute MI. Attenuated recovery of HRT, defined as change in TS less than 2.0 ms/RR, identified patients at the highest risk of arrhythmic events during follow-up.76
Nonischemic Cardiomyopathy and Chronic Heart Failure
HRT, which was primarily designed to predict mortality in patients with previous MI, was subsequently applied in patients with heart failure (see Table 66-3). Unlike in patients with previous MI, contradictory risk stratification results exist in patients with chronic heart failure and nonischemic cardiomyopathies.52,77–82 In a study by Koyama et al, in a population of 50 patients with heart failure (72% with nonischemic cardiomyopathy), HRT was highly predictive for death from progression of heart failure and for rehospitalization rate but failed to predict arrhythmic events.78 The Magdeburg study showed that HRT was predictive for total mortality and heart transplantation in a group of 242 patients with idiopathic dilated cardiomyopathy; nevertheless, no significance was found to predict arrhythmic events in this group of patients.52 Analysis based on the Frankfurt dilated cardiomyopathy database did not document the prognostic value of HRT.79 In patients with hypertrophic cardiomyopathy, HRT parameters did not differ from the control group and were not predictive for clinical prognosis.80
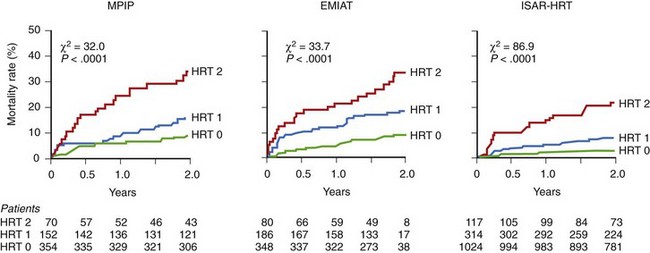
Most of the papers on HRT in patients with heart failure show that an abnormal HRT reaction identifies patients at risk of progression of heart failure during follow-up.78,80,82 It is not surprising, when considering that, as mentioned above, HRT parameters are strongly correlated to advancement of heart failure. In the study by Moore et al, based on 358 patients with CHF in NYHA class II to III with available HRT, decreased TS was predictive for decompensated heart failure but not for SCD at 5-year follow-up.80 Our group documented for the first time that abnormal HRT, especially TS, predicts not only heart failure progression but also SCD in patients with mild to moderate heart failure in the Multicenter Ultrasound Stenting In Coronaries (MUSIC) study.77 MUSIC included ambulatory patients with congestive heart failure of both ischemic and nonischemic origin who presented with NYHA class II to III at the time of enrollment. HRT was analyzed in 607 patients in sinus rhythm. Abnormal HRT response based on at least one HRT parameter was found to be abnormal in 57% of patients, which is much higher than the percentage observed in post-infarction populations. During a median follow-up of 44 months, 129 patients died, 52 of them from SCD. Abnormal TS and HRT2 were independently associated with increased all-cause mortality (HR, 2.10; CI, 1.41-3.12; P < .001; and HR, 2.52; CI, 1.56-4.05; P < .001, respectively), SCD (HR, 2.25; CI, 1.13-4.46; P = .021 for HRT2), and death from heart failure progression (HR, 4.11; CI, 1.84-9.19; P < .001 for HRT2) after adjustment for clinical covariates in multivariate analysis. Similar to what was reported in post-infarction studies, the predictive value was driven by TS and not TO (Figure 66-8). In our study, abnormal HRT was found to be predictive for all modes of death. Consistent with the postulated mechanisms of HRT relating this phenomenon to abnormal baroreflex sensitivity and autonomic imbalance, abnormal HRT showed a trend toward a stronger association with death from heart failure than with SCD. Importantly, HRT seems to be particularly useful in identifying high-risk patients with preserved left ventricular function, the group of patients not covered by current indications for ICDs. A combination of abnormal HRT, decreased HRV, and impaired repolarization dynamics provided the highest accuracy in identifying the high-risk group among patients with heart failure and relatively preserved LVEF (>35%).82
Other Applications
HRT was found to be impaired in various cohorts of patients characterized by autonomic nervous system abnormalities, such as patients with connective tissue diseases, diabetes mellitus, or obstructive sleep apnea.83–85 The CARISMA investigators documented that abnormal TS, associated with altered cardiac autonomic regulation, was associated with an increased risk of new-onset atrial fibrillation as documented by ILRs.86
Deceleration Capacity and Severe Autonomic Failure
In 2006, Bauer at al proposed a novel risk predictor called deceleration capacity (DC), which was based on the assessment of deceleration-related modulations of heart rate believed to reflect the vagal activity of the autonomic nervous system.87 The authors postulated that such a selected analysis of HRV exclusively related to deceleration moments may provide information on the autonomic nervous system balance. To calculate DC, a signal processing technique of phase-rectified signal averaging is used to process sequences of R-R intervals obtained from Holter recordings. The technique provides separate characterizations of deceleration-related and acceleration-related modulations, quantified by DC and acceleration capacity (AC). For computation of DC, heart beat intervals longer than the preceding interval are identified as anchors. For computation of AC, heart beat intervals shorter than the preceding interval are identified as anchors. Detailed explanation of the DC calculation process is provided at www.prsa.eu as well as in original reports. For risk stratification purposes, patients are categorized, according to original publication, into low-risk (>4.5), medium-risk (4.5 to 2.5), and high-risk (≤2.5) groups, taking cut-offs of DC published in the original paper by Bauer et al. This study demonstrated that decreased DC was a significant risk predictor of death in patients with previous MI, which encompassed the prognostic value of LVEF and standard HRV measures. Of note, decreased DC (≤2.5 ms) identified high-risk patients in a group with LVEF greater than 30%.87
A few years later, the same group presented the results of the Improved Stratification of Autonomic Regulation for Risk Prediction in Post-Infarction Patients with Preserved Left Ventricular Function (ISAR-Risk) study, which demonstrated that a combination of abnormal HRT and abnormal DC may be defined as severe autonomic failure (SAF) and was able to identify a subset of patients with previous MI and LVEF greater than 30%, with a mortality risk comparable with a high-risk group of patients with significantly depressed LVEF during 5 years of follow-up. The 5-year mortality rate in SAF-positive patients was 38.6% compared with 6.1% in a SAF-negative group (P < .001), with similar patterns observed for cardiac death and SCD.88 These findings were further confirmed by a retrospective analysis of four trials (ISAR-Risk, St George Hospital Medical School Post-Infarction Survey, placebo arm of the EMIAT trial, and Multiple Risk Factor Analysis Trial [MRFAT]).89 It is believed that merging DC and HRT into SAF provides an insight into an overall status of the autonomic nervous system, expressed by DC with the reflex reactivity of a system reflected by HRT reaction; such a combination of abnormal tone and reflex significantly increases the accuracy of risk stratification.
Further Directions
Despite extensive research in the field of noninvasive electrocardiology and several reports that documented the predictive value of HRV and HRT in predicting death, neither of these two techniques is currently recommended for SCD stratification. The ACC/AHA statement on ventricular arrhythmias recommends HRV and HRT as class IIb for risk stratification.90 According to the recently published AHA/ACC/HRS Scientific Statement on noninvasive risk stratification techniques for identifying patients at risk of SCD, data on short-term HRV that link HRV to risk of SCD are limited; therefore, the use of HRV for risk stratification is not recommended.91 Depressed HRV from long-term recordings is predictive for all-cause mortality but is not specific for SCD. In the Defibrillator in Acute Myocardial Infarction Trial (DINAMIT), patients with previous MI and an EF less than 30% and depressed HRV or elevated heart rate, randomized to ICD implantation in the early post-infarction period did not benefit from ICD implantation, even though the arrhythmic mortality was significantly lower.92 It is therefore plausible that low HRV selected a subpopulation of patients who were more likely to develop heart failure. It seems that HRV assessment will play a role in the selection of patients who might benefit from CRT to prevent hemodynamic deterioration and in SCD risk prediction. HRT is a likely SCD risk factor. Nevertheless, its clinical utility to guide ICD implantation has not been demonstrated yet. Therefore, the need to find whether HRT may serve as a marker to guide prophylactic ICD implantation or heart failure progression persists. The ongoing Deceleration Capacity and Heart Rate Turbulence in Decompensated Heart Failure study (DECIDE-HF), aims to predict heart failure decompensation by DC and HRT assessment based on 8-hour R-R intervals from implanted devices in patients with congestive heart failure in NYHA class II to III.The REFINE-ICD trial aims to evaluate whether high-risk patients selected on the basis of the presence of abnormal HRT and abnormal TWA assessed at 8 weeks after an acute MI will benefit from prophylactic ICD implantation. Inclusion criteria are based on the results of the REFINE study, which documented a combination of parameters reflecting the autonomic nervous system and electrical instability in the best manner to predict unfavorable outcome in post-infarction patients. The authors also report two planned studies ISAR-ICD and CAF-HEFT trials to be initiated soon. The ISAR-ICD will assess the benefit of ICD in patients with preserved LVEF stratified by abnormal SAF, whereas CAF-HEFT will test the ability of a noninvasive ECG risk marker to guide pharmacotherapy in HF patients with NYHA class II and LVEF of 45% or less and heart failure–related hospitalization within the last year.93
Bauer A, Barthel P, Schneider R, et al. Improved Stratification of Autonomic Regulation for risk prediction in post-infarction patients with preserved left ventricular function (ISAR-Risk). Eur Heart J. 2009;30:576-583.
Bauer A, Malik M, Schmidt G, et al. Heart rate turbulence: Standards of measurement, physiological interpretation, and clinical use: International Society for Holter and Noninvasive Electrophysiology Consensus. J Am Coll Cardiol. 2008;52:1353-1365.
Bauer A, Kantelhardt JW, Barthel P, et al. Deceleration capacity of heart rate as a predictor of mortality after myocardial infarction: cohort study. Lancet. 2006;367:1674-1681.
Cygankiewicz I, Zareba W, Vazquez R, et al. Heart rate turbulence predicts all-cause mortality and sudden death in congestive heart failure patients, Muerte Subita en Insuficiencia Cardiaca Investigators. Heart Rhythm. 2008;5:1095-1102.
Exner DV, Kavanagh KM, Slawnych MP, et al. Noninvasive risk assessment early after a myocardial infarction the REFINE study. J Am Coll Cardiol. 2007;50(24):2275-2284.
Goldberger JJ, Cain ME, Hohnloser SH, et al. American Heart Association/American College of Cardiology Foundation/Heart Rhythm Society Scientific Statement on noninvasive risk stratification techniques for identifying patients at risk for sudden cardiac death. J Am Coll Cardiol. 2008;52:1179-1199.
Huikuri HV, Raatikainen MJ, Moerch-Joergensen R, et al. Prediction of fatal or near-fatal cardiac arrhythmia events in patients with depressed left ventricular function after an acute myocardial infarction, and Cardiac Arrhythmias and Risk Stratification after Acute Myocardial Infarction study group. Eur Heart J. 2009;30:689-698.
Kleiger RE, Miller JP, Bigger JT, Moss AJ. Decreased heart rate variability and its association with increased mortality after acute myocardial infarction, and the Multicenter Post-Infarction Research Group. Am J Cardiol. 1987;59:256-262.
Lahiri MK, Kannankeril PJ, Goldberger JJ. Assessment of autonomic function in cardiovascular disease. Physiological basis and prognostic implications. J Am Coll Cardiol. 2008;51:1725-1733.
La Rovere MT, Bigger JTJr, Marcus FI, et al. Baroreflex sensitivity and heart rate variability in prediction of total cardiac mortality after myocardial infarction, for the ATRAMI investigators. Lancet. 1998;351:478-484.
La Rovere MT, Pinna GD, Maestri R, et al. Short-term heart rate variability strongly predicts sudden death in chronic heart failure. Circulation. 2003;107:565-570.
Makikallio TH, Barthel P, Schneider R, et al. Prediction of sudden cardiac death after acute myocardial infarction: Role of Holter monitoring in the modern treatment era. Eur Heart J. 2005;26:762-769.
Nolan J, Batin PD, Andrews R, et al. Prospective study of heart rate variability and mortality in chronic heart failure: Results of the United Kingdom heart failure evaluation and assessment of risk trial (UK-Heart). Circulation. 1998;98:1510-1516.
Schmidt G, Malik M, Barthel P, et al. Heart rate turbulence after ventricular premature beats as a predictor of mortality after myocardial infarction. Lancet. 1999;353:1360-1396.
Task Force of the European Society of Cardiology and the North American Society of Pacing and Electrophysiology. Heart Rate Variability. Standards of measurement, physiological interpretation and clinical use. Circulation. 1996;93:1043-1065.
1 Task Force of the European Society of Cardiology and the North American Society of Pacing and Electrophysiology. Heart Rate Variability. Standards of measurement, physiological interpretation and clinical use. Circulation. 1996;93:1043-1065.
2 Kleiger RE, Stein PK, Bigger TJ. Heart rate variability: Measurement and clinical utility. Ann Noninvasive Electrocardiol. 2005;10:88-101.
3 Bilchick K, Berger RD. Heart rate variability. J Cardiovasc Electrophysiol. 2006;17:691-694.
4 Lahiri MK, Kannankeril PJ, Goldberger JJ. Assessment of autonomic function in cardiovascular disease. Physiological basis and prognostic implications. J Am Coll Cardiol. 2008;51:1725-1733.
5 Malik M. Standard measurement of heart rate variability. In: Malik M, Camm AJ, editors. Dynamic electrocardiography. New York: Blackwell Futura, 2004.
6 Lombardi F. Frequency domain analysis of heart rate variability. In: Zareba W, Maison-Blanche P, Locati EH, editors. Noninvasive electrocardiology in clinical practice. Armonk, NY: Futura Publishing Company, 2001.
7 Perkiomaki JS, Makikallio TH, Huikuri HV. Nonlinear analysis of heart rate variability: Fractal and complexity measures of heart rate behaviour. Ann Noninvasive Electrocardiol. 2000;5:179-187.
8 Odemuyiwa O, Poloniecki J, Malik M, et al. Temporal influences on the prediction of postinfarction mortality by heart rate variability: A comparison with the left ventricular ejection fraction. Br Heart J. 1994;71:521-527.
9 Guzik P, Piskorski J, Krauze T, et al. Heart rate asymmetry by Poincaré plots of RR intervals. Biomed Tech (Berl). 2006;51:272-275.
10 Crawford MH, Bernstein SJ, Deedwania PC, et al. ACC/AHA guidelines for ambulatory electrocardiography: A report of the American College of Cardiology/American Heart Association Task Force on Practice Guidelines. J Am Coll Cardiol. 1999;34:912-948.
11 Guzzetti S, Mezzetti S, Magatelli R, et al. Linear and non-linear 24 h heart rate variability in chronic heart failure. Auton Neurosci. 2000;86:114-119.
12 Makikallio TH, Huikuri HV, Hintze U, et al. DIAMOND Study Group (Danish Investigations of Arrhythmia and Mortality ON Dofetilide) Fractal analysis and time- and frequency-domain measures of heart rate variability as predictors of mortality in patients with heart failure. Am J Cardiol. 2001;87:178-182.
13 Maestri R, Pinna GD, Accardo A, et al. Nonlinear indices of heart rate variability in chronic heart failure patients: Redundancy and comparative clinical value. J Cardiovasc Electrophysiol. 2007;18:425-433.
14 Umetani K, Singer DH, McCraty R, Atkinson M. Twenty-four hour time domain heart rate variability and heart rate: Relations to age and gender over nine decades. J Am Coll Cardiol. 1998;31:593-601.
15 Moolgard H, Hermansen K, Bjerregaard P. Spectral components of short-term RR interval variability in healthy subjects and effects of risk factors. Eur Heart J. 1994;15:1174-1183.
16 Stein PK, Kleiger RE, Rottman JN. Differing effect of age on heart rate variability in men and women. Am J Cardiol. 1997;80:302-305.
17 Casolo GC, Stroder P, Signorini C, et al. Heart rate variability during the acute phase of myocardial infarction. Circulation. 1992;85:2073-2079.
18 Schwartz PJ, Vanoli E, Stramba-Badiale M, et al. Autonomic mechanisms and sudden death: New insights from the analysis of baroreceptor reflexes in conscious dogs with and without a myocardial infarction. Circulation. 1988;78:969-979.
19 Lombardi F, Sandrone G, Pernpruner S, et al. Heart rate variability as an index of sympathovagal interaction after myocardial infarction. Am J Cardiol. 1987;60:1239-1245.
20 Casolo G, Balli E, Taddei T, et al. Decreased spontaneous heart rate variability in congestive heart failure. Am J Cardiol. 1989;64:1162-1167.
21 Nolan J, Flapan AD, Capewell S, et al. Decreased cardiac parasympathetic activity in chronic heart failure and its relation to left ventricular function. Br Heart J. 1992;69:761-767.
22 Arora R, Krummerman A, Vijayaraman P, et al. Heart rate variability and diastolic heart failure. Pacing Clin Electrophysiol. 2004;27:299-303.
23 Reference deleted in proofs.
24 Gomes ME, Aengevaeren WR, Lenders JW, et al. Improving myocardial perfusion by percutaneous coronary intervention reduces central sympathetic activity in stable angina. Clin Cardiol. 2010;33:E16-E21.
25 Landolina M, Gasparini M, Lunati M, et al. InSync/InSync ICD Italian Registry Investigators. Heart rate variability monitored by the implanted device predicts response to CRT and long-term clinical outcome in patients with advanced heart failure. Eur J Heart Fail. 2008;10:1073-1079.
26 Gilliam FR3rd, Singh JP, Mullin CM, et al. Prognostic value of heart rate variability footprint and standard deviation of average 5-minute intrinsic R-R intervals for mortality in cardiac resynchronization therapy patients. J Electrocardiol. 2007;40(4):336-342.
27 Hon EH, Lee ST. Electronic evaluations of the fetal heart rate patterns preceding fetal death: further observations. Am J Obstet Gynecol. 1965;87:814-826.
28 Malik M, Farrell T, Cripps T, Camm AJ. Heart rate variability in relation to prognosis after myocardial infarction: Selection of optimal processing techniques. Eur Heart J. 1989;10:1060-1074.
29 Kleiger RE, Miller JP, Bigger JT, Moss AJ, and the Multicenter Post-Infarction Research Group. Decreased heart rate variability and its association with increased mortality after acute myocardial infarction. Am J Cardiol. 1987;59:256-262.
30 Zuanetti G, Neilson JMM, Latini R, et al. Prognostic significance of heart rate variability in post-myocardial infarction patients in the fibrinolytic era. The GISSI-2 results, on behalf of GISSI2 Investigators. Circulation. 1996;94:432-436.
31 La Rovere MT, Bigger JTJr, Marcus FI, et al. Baroreflex sensitivity and heart rate variability in prediction of total cardiac mortality after myocardial infarction, for the ATRAMI investigators. Lancet. 1998;351:478-484.
32 Camm AJ, Pratt CJ, Schwartz PJ, et al. A randomized, placebo-controlled trial of azimilide using heart rate variability for risk stratification, Azimilide post Infarct surVival Evaluation (ALIVE) investigators. Circulation. 2004;109:990-996.
33 Bigger JTJr., Fleiss JL, Steinman RC, et al. Frequency domain measures of heart period variability and mortality after myocardial infarction. Circulation. 1992;85:164-171.
34 Bigger JTJr., Fleiss J, Rolnitzky LM, et al. Frequency domain measures of heart period variability to assess risk late after myocardial infarction. J Am Coll Cardiol. 1993;21:729.
35 Huikuri HV, Makikallio TH, Peng CK, et al. Fractal correlation properties of RR interval dynamics and mortality in patients with depressed left ventricular function after an acute myocardial infarction, for the DIAMOND study group. Circulation. 2000;101:47.
36 Makikallio TH, Barthel P, Schneider R, et al. Prediction of sudden cardiac death after acute myocardial infarction: Role of Holter monitoring in the modern treatment era. Eur Heart J. 2005;26:762-769.
37 Exner DV, Kavanagh KM, Slawnych MP, et al. Noninvasive risk assessment early after a myocardial infarction the REFINE study. J Am Coll Cardiol. 2007;50(24):2275-2284.
38 Huikuri HV, Raatikainen MJ, Moerch-Joergensen R, et al. Prediction of fatal or near-fatal cardiac arrhythmia events in patients with depressed left ventricular function after an acute myocardial infarction, and Cardiac Arrhythmias and Risk Stratification after Acute Myocardial Infarction study group. Eur Heart J. 2009;30:689-698.
39 Binder T, Frey B, Porenta G, et al. Prognostic value of heart rate variability in patients awaiting cardiac transplantation. PACE. 1992;15:2215-2220.
40 Nolan J, Batin PD, Andrews R, et al. Prospective study of heart rate variability and mortality in chronic heart failure: Results of the United Kingdom heart failure evaluation and assessment of risk trial (UK-heart). Circulation. 1998;98:1510-1516.
41 Ponikowski P, Anker SD, Chua TP, et al. Depressed heart rate variability as an independent predictor of death in chronic congestive heart failure secondary to ischemic or idiopathic dilated cardiomyopathy. Am J Cardiol. 1997;79:1645-1650.
42 Boveda S, Galinier M, Pathak A, et al. Prognostic value of heart rate variability in time domain analysis in congestive heart failure patients. J Interv Card Electrophysiol. 2001;5:181-187.
43 La Rovere MT, Pinna GD, Maestri R, et al. Short-term heart rate variability strongly predicts sudden death in chronic heart failure. Circulation. 2003;107:565-570.
44 Fauchier L, Babuty D, Cosnay P, Fauchier JP. Prognostic value of heart rate variability for sudden death and major arrhythmic events in patients with idiopathic dilated cardiomyopathy. J Am Coll Cardiol. 1999;33:1203-1207.
45 Bilchick KC, Fetics B, Djoukeng R, et al. Prognostic value of heart rate variability in chronic congestive heart failure (Veterans affairs survival trial of antiarrhythmic therapy in congestive heart failure). Am J Cardiol. 2002;90:24-28.
46 Hadase M, Azuma A, Zen K, et al. Very low frequency power of heart rate variability is a powerful predictor of clinical prognosis in patients with congestive heart failure. Circ J. 2004;68:343-347.
47 Guzetti S, La Rovere MT, Pinna GD, et al. Different spectral components of 24h heart rate variability are related to different modes of death in congestive heart failure. Eur Heart J. 2005;26:357i-362i.
48 Rashba EJ, Estes NA, Wang P, et al. Preserved heart rate variability identifies low-risk patients with nonischemic dilated cardiomyopathy: Results from the DEFINITE trial. Heart Rhythm. 2006;3:281-286.
49 Schmidt G, Malik M, Barthel P, et al. Heart rate turbulence after ventricular premature beats as a predictor of mortality after myocardial infarction. Lancet. 1999;353:1360-1396.
50 Bauer A, Malik M, Schmidt G, et al. Heart rate turbulence: standards of measurement, physiological interpretation, and clinical use: International Society for Holter and Noninvasive Electrophysiology Consensus. J Am Coll Cardiol. 2008;52:1353-1365.
51 Ghuran A, Reid F, La Rovere MT, et al. Heart rate turbulence-based predictors of fatal and nonfatal cardiac arrest (The Autonomic Tone and Reflexes After Myocardial Infarction substudy). Am J Cardiol. 2002;89:184-190.
52 Grimm W, Schmidt G, Maisch B, et al. Prognostic significance of heart rate turbulence following ventricular premature beats in patients with idiopathic dilated cardiomyopathy. J Cardiovasc Electrophysiol. 2003;14:819-824.
53 Barthel P, Schneider R, Bauer A, et al. Risk stratification after acute myocardial infarction by heart rate turbulence. Circulation. 2003;108:1221-1226.
54 Cygankiewicz I, Wranicz JK, Bolinska H, et al. Prognostic significance of heart rate turbulence in patients undergoing coronary artery bypass grafting. Am J Cardiol. 2003;91:1471-1474.
55 Berkowitsch A, Zareba W, Neumann T, et al. Risk stratification using heart rate turbulence and ventricular arrhythmia in MADIT II: Usefulness and limitations of a 10-minute Holter recording. Ann Noninvasive Electrocardiol. 2004;9:270-279.
56 Watanabe MA, Marine JE, Sheldon R, Josephson ME. Effects of ventricular premature stimulus coupling interval on blood pressure and heart rate turbulence. Circulation. 2002;106:325-330.
57 Watanabe MA. Heart rate turbulence slope reduction in imminent ventricular tachyarrhythmia and its implications. J Cardiovasc Electrophysiol. 2006;17:735-740.
58 Wichterle D, Melenovsky V, Malik M. Mechanisms involved in heart rate turbulence. Card Electrophysiol Rev. 2002;6:262-266.
59 Wichterle D, Melenovsky V, Simek J, et al. Hemodynamics and autonomic control of heart rate turbulence. J Cardiovasc Electrophysiol. 2006;17:286-291.
60 Lin LY, Lai LP, Lin JL, et al. Tight mechanism correlation between heart rate turbulence and baroreflex sensitivity: Sequential autonomic blockade analysis. J Cardiovasc Electrophysiol. 2002;13:427-431.
61 Voss A, Baier V, Schirdewan A, Leder U. Physiological hypotheses on heart rate turbulence. In: Malik M, Camm AJ, editors. Dynamic electrocardiography. Oxford: Blackwell Publishing, 2002.
62 Marine JE, Watanabe MA, Smith TW, Monahan KM. Effect of atropine on heart rate turbulence. Am J Cardiol. 2002;89:767-769.
63 Sestito A, Valsecchi S, Infusino F, et al. Differences in heart rate turbulence between patients with coronary artery disease and patients with ventricular arrhythmias but structurally normal hearts. Am J Cardiol. 2004;93:1114-1118.
64 Cygankiewicz I, Wranicz JK, Bolinska H, et al. Relationship between heart rate turbulence and heart rate, heart rate variability, and number of ventricular premature beats in coronary patients. J Cardiovasc Electrophysiol. 2004;15:731-737.
65 Grimm W, Sharkova J, Christ M, et al. Heart rate turbulence following ventricular premature beats in healthy controls. Ann Noninvasive Electrocardiol. 2003;8:127-131.
66 Jeron A, Kaiser T, Hengstenberg C, et al. Association of the heart rate turbulence with classic risk stratification parameters in postmyocardial infarction patients. Ann Noninvasive Electrocardiol. 2003;8:296-301.
67 Schwab JO, Eichner G, Shlevkov N, et al. Impact of age and basic heart rate on heart rate turbulence in healthy persons. Pacing Clin Electrophysiol. 2005;28(Suppl 1):S198-S201.
68 Cygankiewicz I, Zareba W, Vazquez R, et al. Relation of heart rate turbulence to severity of heart failure. Am J Cardiol. 2006;98:1635-1640.
69 Lin LY, Hwang JJ, Lai LP, et al. Restoration of heart rate turbulence by titrated beta-blocker therapy in patients with advanced congestive heart failure: Positive correlation with enhanced vagal modulation of heart rate. J Cardiovasc Electrophysiol. 2004;15:752-756.
70 Hallstrom AP, Stein PK, Schneider R, et al. Characteristics of heart beat intervals and prediction of death. Int J Cardiol. 2005;100:37-45.
71 Cygankiewicz I, Wranicz JK, Zaslonka J, et al. Clinical covariates of abnormal heart rate turbulence in coronary patients. Ann Noninvasive Electrocardiol. 2003;8:289-295.
72 Cygankiewicz I, Wranicz JK, Zaslonka J, et al. Circadian changes in heart rate turbulence parameters. J Electrocardiol. 2004;37:297-303.
73 Jokinen V, Tapanainen JM, Seppanen T, Huikuri HV. Temporal changes and prognostic significance of measures of heart rate dynamics after acute myocardial infarction in the beta-blocking era. Am J Cardiol. 2003;92:907-912.
74 Bonnemeier H, Wiegand UKH, Friedlbinder J, et al. Reflex cardiac activity in ischemia and reperfusion. Heart rate turbulence in patients undergoing direct percutaneous coronary intervention for acute myocardial infarction. Circulation. 2003;108:958-964.
75 Cygankiewicz I, Wranicz JK, Bolinska H, et al. Influence of coronary artery bypass grafting on heart rate turbulence parameters. Am J Cardiol. 2004;94:186-189.
76 Huikuri HV, Exner DV, Kavanagh KM, et al. Attenuated recovery of heart rate turbulence early after myocardial infarction identifies patients at high risk for fatal or near-fatal arrhythmic events, CARISMA and REFINE Investigators. Heart Rhythm. 2010;7:229-235.
77 Cygankiewicz I, Zareba W, Vazquez R, et al. Heart rate turbulence predicts all-cause mortality and sudden death in congestive heart failure patients, Muerte Subita en Insuficiencia Cardiaca Investigators. Heart Rhythm. 2008;5:1095-1102.
78 Koyama J, Watanabe J, Yamada A, et al. Evaluation of heart-rate turbulence as a new prognostic marker in patients with chronic heart failure. Circ J. 2002;66:902-907.
79 Klingenheben T, Ptaszynski P, Hohnloser S. Heart rate turbulence and other autonomic risk markers for arrhythmia risk stratification in dilated cardiomyopathy. J Electrocardiol. 2008;41:306-311.
80 Kawasaki T, Azuma A, Asada S, et al. Heart rate turbulence and clinical prognosis in hypertrophic cardiomyopathy and myocardial infarction. Circ J. 2003;67:601-604.
81 Moore RK, Groves DG, Barlow PE, et al. Heart rate turbulence and death due to cardiac decompensation in patients with chronic heart failure. Eur J Heart Fail. 2006;8:585-590.
82 Cygankiewicz I, Zareba W, Vazquez R, et al. Risk stratification of mortality in patients with heart failure and left ventricular ejection fraction >35%, MUSIC Investigators. Am J Cardiol. 2009;103:1003-1010.
83 Balcioglu S, Arslan U, Turkoglu S, et al. Heart rate variability and heart rate turbulence in patients with type 2 diabetes mellitus with versus without cardiac autonomic neuropathy. Am J Cardiol. 2007;100:890-893.
84 Yang A, Schafer H, Manka R, et al. Influence of obstructive sleep apnea on heart rate turbulence. Basic Res Cardiol. 2005;100:439-445.
85 Bienias P, Ciurzyński M, Glińska-Wielochowska M, et al. Heart rate turbulence impairment and ventricular arrhythmias in patients with systemic sclerosis. Pacing Clin Electrophysiol. 2010;33:920-928.
86 Jons C, Raatikainen P, Gang UJ, et al. Autonomic dysfunction and new-onset atrial fibrillation in patients with left ventricular systolic dysfunction after acute myocardial infarction: A CARISMA substudy, Cardiac Arrhythmias and Risk Stratification after Acute Myocardial Infarction (CARISMA) Study Group. J Cardiovasc Electrophysiol. 2010;21:983-990.
87 Bauer A, Kantelhardt JW, Barthel P, et al. Deceleration capacity of heart rate as a predictor of mortality after myocardial infarction: Cohort study. Lancet. 2006;367:1674-1681.
88 Bauer A, Barthel P, Schneider R, et al. Improved Stratification of Autonomic Regulation for risk prediction in post-infarction patients with preserved left ventricular function (ISAR-Risk). Eur Heart J. 2009;30:576-583.
89 Bauer A, Barthel P, Muller A, et al. Risk prediction by heart rate turbulence and deceleration capacity in postinfarction patients with preserved left ventricular function retrospective analysis of 4 independent trials. J Electrocardiol. 2009;42:597-601.
90 Zipes DP, Camm AJ, Borggrefe M, et al. ACC/AHA/ESC 2006 guidelines for management of patients with ventricular arrhythmias and the prevention of sudden cardiac death: A report of the American College of Cardiology/American Heart Association Task Force and the European Society of Cardiology Committee for Practice Guidelines (writing committee to develop Guidelines for Management of Patients With Ventricular Arrhythmias and the Prevention of Sudden Cardiac Death): Developed in collaboration with the European Heart Rhythm Association and the Heart Rhythm Society. Circulation. 2006;114:e385-e484.
91 Goldberger JJ, Cain ME, Hohnloser SH, et al. American Heart Association/American College of Cardiology Foundation/Heart Rhythm Society Scientific. Statement on noninvasive risk stratification techniques for identifying patients at risk for sudden cardiac death. J Am Coll Cardiol. 2008;52:1179-1199.
92 Hohnloser SH, Kuck KH, Dorian P, et al. Prophylactic use of an implantable cardioverter-defibrillator after acute myocardial infarction, DINAMIT Investigators. N Engl J Med. 2004;351:2481-2488.
93 Bauer A, Zurn CS, Schmidt G. Heart rate turbulence to guide treatment for prevention of sudden death. J Cardiovasc Pharmacol. 2010;55:531-538.