[level-membership-for-anesthesiology-category]
Chapter 12 Haemodynamic monitoring
Haemodynamics is the study of blood flow. Haemodynamic monitoring therefore refers to the monitoring of blood flow through the cardiovascular system. In the intensive care unit (ICU), haemodynamic monitoring is used to detect cardiovascular insufficiency, differentiate contributing factors and guide therapy.
There has been debate over the risks and benefits of invasive haemodynamic monitoring in critically ill patients. Because there are scant data to show that invasive monitoring leads to improved survival, there has been a steady trend toward less invasive monitoring in the ICU. Regular clinical assessment remains an important component of haemodynamic monitoring, and any acquired physiological data must be interpreted in the clinical context. Importantly, monitoring must be combined with effective therapy in order to demonstrate an impact on outcome.1
ARTERIAL BLOOD PRESSURE
In the absence of sophisticated waveform analysis, arterial pressure is poorly correlated with cardiac output. Hence clinical estimation of cardiac output from arterial pressure and heart rate is unreliable until extreme hypotension occurs.2
NON-INVASIVE ARTERIAL BLOOD PRESSURE (NIBP) MEASUREMENT
Oscillometry overestimates low pressures and underestimates high pressures, but for the normotensive range the 95% confidence limits are ± 15 mmHg (2 kPa). Dysrhythmias increase the error. Cuff width should be 40% of the mid-circumference of the limb. Narrower cuffs overestimate and wider cuffs underestimate blood pressures.
INVASIVE BLOOD PRESSURE MEASUREMENT3
The radial artery is the most common site for cannulation. Nothing larger than a 20-gauge cannula is advisable, and either a modified Seldinger technique or direct cannulation can be used. Once inserted, the cannula is usually infused with normal or heparinised saline at 3 ml/h, with a snap flush rate of 30–60 ml/h. Although it appears not to prolong patency, the use of heparinised saline (2–4 units/ml) might improve accuracy.4 It should be avoided if heparin-induced thrombocytopenia syndrome is suspected.
The axillary, brachial, femoral, posterior tibial and dorsalis pedis arteries can all be used without apparently raising the complication profile (Table 12.1). In severe circulatory compromise, gaining peripheral arterial access may be difficult and time-consuming. Rapid femoral cannulation by the Seldinger percutaneous technique usually remains feasible, with the added advantage that femoral arterial monitoring more accurately reflects aortic pressure in low-output states.
Table 12.1 Complications of arterial cannulation, with suggested preventive and treatment options61
| Complication | Prevention | Treatment |
|---|---|---|
| Vascular thrombosis (ranges from 7 to 30% following radial artery cannulation). Risk factors for digital ischaemia include: shock, sepsis, embolus of air or clot, hyperlipoproteinaemia, vasculitis, female sex, prothrombotic states, accidental intra-arterial injection of drugs | Risks reduced by smaller catheter, larger artery, decreased duration of cannulation, avoiding traumatic insertion and multiple attempts. Allen’s test (including modifications such as Doppler, plethysmography and digital blood pressure) is probably unhelpful | Remove cannula. Arterial thrombosis is usually self-limiting. Severe ischaemic damage estimated at < 0.01%. Anticoagulation and/or vascular surgery/intervention may be necessary |
| Distal embolisation | Diligent catheter care and observation | As for thrombosis |
| Proximal embolisation of clot or air (can result in stroke) | Diligent catheter care and observation. Exclude air from pressurised system. Avoid axillary, subclavian or carotid access | Tailored to sequelae |
| Vascular spasm | Smaller catheter, larger artery. Avoid traumatic insertion and multiple attempts | Remove cannula. Resite if necessary |
| Skin necrosis at catheter site | Diligent catheter care and observation | Surgical debridement and skin grafting may be necessary |
| Line disconnection and bleeding/exsanguination | Minimise connections. Diligent catheter care and observation | Control bleeding. Transfusion may be necessary |
| Accidental drug injection | Clearly label arterial line near ports | Leave cannula in situ to facilitate treatment if required. Depends on drug injected. May require papaverine or procaine, analgesia, sympathetic block of limb and anticoagulation |
| Infection – local or systemic | Diligent catheter care and observation | Remove cannula and send tip for culture. Resite if necessary. Immobilise and elevate affected upper limb. Start empiric antibiotics if sepsis or septic shock is present |
| Damage to nearby structures such as nerves, directly or due to haematoma (e.g. compartment syndrome or carpal tunnel syndrome). Arteriovenous fistula. Femoral approach can be associated with bowel damage | Careful insertion technique. Seek assistance from experienced operator | Tailored to sequelae. Haematomas can develop into pseudoaneurysms requiring surgery |
Cannulae are usually removed or resited between days 5 and 7, or earlier if a complication is suspected. Distal perfusion should be checked at least 8-hourly, and the cannula removed if there is persistent blanching, coolness with sluggish capillary refill, loss of pulses or evidence of raised muscle compartment pressures. Complications associated with arterial cannulation are presented in Table 12.1.
PHYSICAL PROPERTIES OF CLINICAL PRESSURE MEASUREMENT SYSTEMS5,6
The natural resonant frequency of the system should ideally exceed 30 Hz (> 10 harmonics) for heart rates up to 180 beats/min (3 Hz) to prevent distortion of the biological signal by sine-wave system oscillations. Damping refers to any property of an oscillatory system that reduces the amplitude of oscillations. Factors that increase oscillation in the system, such as increased tubing length, diameter or compliance, cause underdamping. Overdamping tends to smooth the waveform, causing underestimation of SBP and overestimation of DBP, while MAP tends to be preserved. Contributing factors include clots, air bubbles and loose connections. Damping can be assessed clinically by the fast-flush test (Table 12.2).7
Table 12.2 Fast-flush test to assess dynamic response (damping) of the blood pressure-monitoring system
| Make a paper record of transducer output |
| Snap the valve of the continuous flush system. This produces a square wave on the output trace |
| Repeat the process at least twice |
| Resonant frequency is the distance between successive peaks divided by the paper speed in millimetres per second |
| Damping is satisfactory (critical damping) if each snap test has two to three oscillation waves, with each wave one-third or less the size of the preceding wave |
ADDITIONAL INFORMATION FROM THE ARTERIAL WAVEFORM
ESTIMATION OF STROKE VOLUME AND CARDIAC OUTPUT8
Estimation of stroke volume by analysis of the arterial pressure waveform, in particular various properties of the pulse pressure (pressure above diastolic) component, has been studied for many years. Pulse contour analysis calculates stroke volume from the area under the systolic portion of the arterial pressure waveform. After individual calibration, these monitors can determine stroke volume beat-to-beat. Cardiac output, derived by multiplying stroke volume by heart rate, appears to offer reliable continuous cardiac output monitoring, even during haemodynamic instability.9 However, accuracy in the presence of arrhythmia has not been validated.
Transpulmonary indicator dilution (discussed below) is the usual method of calibration. Pulse contour devices that use thermodilution or lithium ion calibration are commercially available.10 Comparisons with pulmonary artery catheter (PAC) cardiac output measurements have shown good agreement, with mean bias values ≤ 0.1 l/min and precision (SD of bias) of the order of 0.6 l/min.
Disadvantages of such techniques can include:
Recently developed proprietary algorithms continuously measure stroke volume and cardiac output without requiring calibration against another method.11 Additional clinical validation is awaited.
CENTRAL VENOUS CATHETERISATION (CVC)
CVC is indicated for monitoring of central venous pressure (CVP) and administration of certain drugs and parenteral nutrition. Modified catheters are also available which continuously monitor central venous oxygen saturation (ScvO2). Contraindications to CVC are relative and reflect potential complications of the procedure (Table 12.3). These should be considered in selecting the site for catheter insertion. Particular attention should be paid to the coagulation profile and factors which affect coagulation such as thrombolysis and activated protein C therapy.
Table 12.3 Complications of central venous catheterisation, with preventive and treatment options62
| Complication | Prevention | Treatment |
|---|---|---|
| Intravascular loss of guidewire | Ensure guidewire is always secured. Avoid retracting guidewire into insertion needle. Seek assistance from experienced operator | Interventional radiology or surgery may be required for retrieval |
| Air embolism | Proper patient positioning, including Trendelenburg (head-down tilt) for jugular or subclavian insertion. Consider alternative insertion sites. Ensure connections are tight | Left lateral Trendelenburg position. Administer 100% oxygen and ventilatory support. If catheter in place, tighten all connections and attempt to aspirate air. Basic/advanced life support if necessary |
| Dysrhythmias and conduction defects such as right bundle branch block | Continuous electrocardiographic monitoring during insertion. Correct placement of catheter tip | Withdraw or remove guidewire or catheter |
| Damage to nearby structures: Pneumothorax/haemothorax/chylothorax/hydrothorax, particularly with approaches to subclavian vein. Nerve injury such as phrenic, recurrent laryngeal, Horner’s syndrome. Arterial puncture – including injury to carotid, subclavian, aorta or pulmonary artery. Haematoma, pseudoaneurysm, arteriovenous fistula can result. Stroke may result from carotid artery injury. Tracheal injury. Femoral approach can be associated with bowel damage | Identify risk factors such as previous surgery, skeletal deformity or scarring at site of insertion. Seek assistance from experienced operator. Select insertion site depending on impact of potential complications. Consider ultrasound guidance. Scheduled, routine replacement of catheter increases risk of mechanical complications | Tailored to sequelae |
| Line disconnection and bleeding | Minimise connections. Proper catheter care and observation | Control bleeding. Transfusion may be necessary |
| Infection – local or systemic (including endocarditis) | Aseptic insertion technique. Lower risk with subclavian compared to internal jugular or femoral insertion. Antimicrobial-impregnated catheters. Disinfect catheter hubs. Routine scheduled resiting appears not to reduce systemic infection rates. Remove catheter when no longer required | Remove catheter; resite if necessary. Culture blood and catheter tip. Start empiric antibiotics if sepsis or septic shock is present |
| Superior vena caval erosion can result in haemothorax or cardiac tamponade | Remove catheter when no longer required | Early detection and surgical intervention |
| Thrombosis | Remove catheter when no longer required. Subclavian insertion lower risk than internal jugular or femoral | Anticoagulation, vascular or endovascular intervention may be required |
Traditionally, puncture of the central vein is performed by passing a needle along the anticipated line of the vein with reference to surface anatomical landmarks (landmark method). Catheterisation is usually achieved via the subclavian, internal jugular or external jugular veins into the superior vena cava.12 The median cubital and basilic veins are used less commonly. Access to the subclavian vein is usually via the infraclavicular approach, but the supraclavicular approach is safe and reliable in experienced hands.
The use of ultrasound has been advocated to optimise the success rate of CVC insertion and minimise complications.13 Two-dimensional imaging can be used to localise the vein and define anatomy prior to placement of a CVC by standard landmark techniques. Ultrasound can also provide real-time, two-dimensional guidance during CVC insertion. Alternatively, audio-guided Doppler ultrasound can aid localisation of the vein and differentiate it from its companion artery during CVC insertion.
In 2002, the UK National Institute for Clinical Excellence issued guidelines recommending the use of ultrasound for elective catheterisation of the internal jugular vein, and consideration of ultrasound guidance in most clinical situations.14 These recommendations for ultrasound-guided internal jugular catheterisation are supported by meta-analysis.15 However, there are limited data supporting its use for subclavian and femoral veins.
The right tracheobronchial angle and carina are common radiological markers of insertion depth. In an attempt to reduce further the incidence of venous erosion (which is rare but potentially catastrophic), some practitioners place the catheter tip lower in superior vena cava or even in the upper right atrium, ensuring that the catheter is parallel to the long axis of the vein so that the tip does not abut the vein or heart wall end-on.16
Femoral venous catheterisation with radiological positioning of the tip close to the right atrium produces pressure measurements in good agreement with the subclavian CVP.17
CENTRAL VENOUS PRESSURE
The normal CVP in the spontaneously breathing supine patient is 0–5 mmHg, while 10 mmHg is generally accepted as the upper limit during mechanical ventilation. In health there is a good correlation between CVP and pulmonary artery occlusion pressures (PAOP), but this is lost in many types of critical illness such as pulmonary hypertension, pulmonary embolism, right ventricular infarction, left ventricular hypertrophy and myocardial ischaemia. The relationship between CVP and right ventricular end-diastolic volume (RVEDV: preload) is altered in critical illness by changes in right ventricular diastolic compliance and juxtacardiac pressures.18
Except at extreme values, static measures of CVP do not differentiate patients likely to respond to fluid therapy from non-responders. However, dynamic changes in CVP either in response to volume loading or related to respiration can assist in evaluating volume status.19 For instance, a steep increase in CVP following volume challenge suggests the heart is functioning on the plateau portion of the Frank–Starling curve. Severe hypotension with a low or normal CVP is unlikely to be due to acute pulmonary embolism, cardiac tamponade or tension pneumothorax.
Although fluid manometry is sufficient to measure the CVP, the frequency response is low and waveform analysis impossible (Table 12.4). Therefore, an electrical transducer system is normally used.
| Condition | Pressure changes | Waveform changes |
|---|---|---|
| Tricuspid regurgitation | Increased RA pressure | Prominent v-wave, x descent obliterated, y descent steep |
| Right ventricular infarction | RA and RV pressure elevated. RAP does not fall and may rise in inspiration | Prominent x and y descents |
| Constrictive pericarditis | RA, RV diastolic, PA diastolic and occlusion pressures elevated and equalised. RAP may rise in inspiration | Prominent x and y descents |
| Pericardial tamponade | RA, RV diastolic, PA diastolic and occlusion pressures elevated and equalised. RAP usually falls in inspiration | y descent damped or absent |
RA, right atrial; RV, right ventricular; RAP, right atrial pressure; PA, pulmonary artery.
In a trend toward less invasive monitoring, peripheral venous pressure and non-invasive estimates of CVP have demonstrated potential as alternatives to direct CVP measurement.20,21
ScvO2
A recent prospective randomised study of patients with severe sepsis and septic shock demonstrated a survival advantage with the use of this monitoring technique and an emergency department treatment protocol (early goal-directed therapy).22 ScvO2 has been proposed as a marker of tissue hypoxia (see Chapter 14). It is mentioned here as an example of the scant data relating haemodynamic monitoring to improved survival.
PULMONARY ARTERY CATHETER
Right-heart catheterisation using a flow-directed balloon-tipped catheter was introduced by Swan and Ganz in 1970.23 The ability to monitor sophisticated haemodynamic and gas exchange variables at the bedside appealed to clinicians, and the PAC was rapidly accepted into routine critical care.
In 1996 a non-randomised cohort study of PAC use in American teaching hospitals appeared to show that, in any of nine major disease categories, PAC in the first 24 hours increased 30-day mortality (odds ratio 1.24, 95% confidence interval (CI) 1.03–1.49), mean length of stay and mean cost per hospital stay.24 A simultaneous editorial called for a moratorium on PAC use, and for a prospective multicentre trial.25
A subsequent Cochrane database systematic review of PAC monitoring in adult ICU patients incorporated data from two recent multicentre trials and 10 other studies.26 The pooled mortality odds ratio for studies of general ICU patients was 1.05 (95% CI 0.87–1.26) and for studies of high-risk surgery patients was 0.99 (95% CI 0.73–1.24). PAC monitoring had no impact on ICU or hospital length of stay (where reported). A recent multicentre trial incorporating protocolised haemodynamic management of patients with acute lung injury compared PAC-guided with CVC-guided therapy.27 There were no significant differences in 60-day mortality or organ function between groups. Overall, these data suggest that PAC monitoring in critically ill patients is not associated with increased mortality or with survival benefit.
On the other hand, recent data suggest a differential association between PAC use and mortality dependent upon severity of illness. Logistic regression analyses of data from a tertiary-care university teaching hospital28 and from the National Trauma Data Bank (American College of Surgeons)29 suggest that PAC use may be associated with survival benefit in the most severely ill/injured patients.
Overall, the PAC still finds application as a haemodynamic monitoring tool in the ICU and the operating room. However, its role is under increasing scrutiny, and continues to decline in favour of less invasive alternatives. It could be argued that future PAC use should be guided by studies to determine optimal management protocols and appropriate patient groups.26
Traditional indications for PAC monitoring have been to:
CATHETER INSERTION30
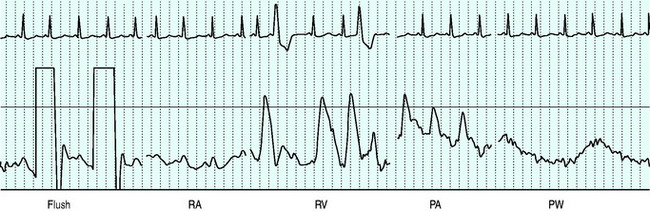
Balloon volume is 1.5 ml. The balloon should be tested prior to insertion into the sheath. Deflation should always occur passively to minimise the risk of balloon damage. Before passage through the heart the balloon should be inflated to assist flow guidance and protect against myocardial injury and dysrhythmias. Inflation should not be forced, and should not alter the waveform prior to wedging. The right atrium is reached at 15–20 cm from the internal jugular vein, 10–15 cm from the subclavian vein, 30–40 cm from the femoral vein and 40 and 50 cm respectively from the right and left basilic veins. The right ventricle and pulmonary artery (PA) are then entered at additional 10-cm intervals, with a further 10 cm to PA occlusion.31 Waveforms seen as the catheter floats to the wedged position are shown in Figure 12.1.
MEASURED VARIABLES
The PAC remains unique in its ability to measure right ventricular and pulmonary arterial pressures directly at the bedside. In acute respiratory distress syndrome (ARDS), where pulmonary hypertension and increased right ventricular afterload are linked to excess mortality,32 a PAC can assist in the titration of afterload-reducing therapies such as inhaled prostacyclin or nitric oxide.
In this context echocardiography might be considered as a less invasive alternative, since it provides a qualitative assessment of right ventricular loading33 and can estimate PA pressures via Doppler techniques.34 However, these are largely confined to intermittent ‘snapshot’ assessments, and can be challenging in mechanically ventilated patients.
Normal pressures are given in Table 12.5.
Table 12.5 Measured and derived variables from pulmonary artery catheter
| Site | mmHg | kPa |
|---|---|---|
| Right atrium: mean | −1–7 | 0.13–0.93 |
| Right ventricle: systolic | 15–25 | 2.0–3.3 |
| Right ventricle: diastolic | 0–8 | 0–1.1 |
| Pulmonary artery: systolic | 15–25 | 2.0–3.3 |
| Pulmonary artery: diastolic | 8–15 | 1.1–2.0 |
| Pulmonary artery: mean | 10–20 | 1.3–2.6 |
| Pulmonary artery occlusion pressure | 6–15 | 0.8–2.0 |
PULMONARY ARTERY OCCLUSION PRESSURE
Measurements of PAOP should be performed by slow injection of air into the balloon while watching the PA waveform. Overwedging can lead to falsely high occlusion pressures or pulmonary arterial rupture. Less than 1.5 ml air may be required. Deflation after PAOP measurement should re-establish the normal pulmonary arterial waveform. If not, distal migration has occurred and the catheter should be withdrawn until the waveform is re-established.
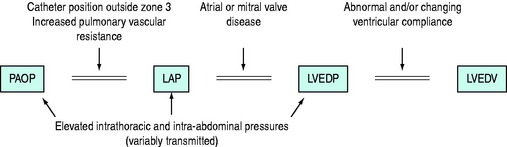
PAOP should be measured during end-expiration and ideally in end-diastole, using the electrocardiogram (ECG) P-wave as a marker. PAOP has been termed the back-pressure to pulmonary blood flow,35 and is also a key determinant of pulmonary capillary pressure (see below) and hence extravascular lung water. When the catheter wedges in a branch of the PA it creates a static column of blood which equilibrates with downstream pressure at the site where it rejoins the flowing pulmonary venous system (the j point). Here the blood is very near the left atrium. PAOP therefore closely approximates left atrial pressure (LAP), which approximates left ventricular end-diastolic pressure (LVEDP). The validity of PAOP as a surrogate of preload depends on a number of assumptions (Figure 12.2). These assumptions are often incorrect in critically ill patients and the use of PAOP to reflect preload has been questioned.36
Zone 3 or not?37
The catheter tip usually floats to a level at or below the left atrium. To maintain a column of fluid between the pressure transducer and the LAP, the tip should be in West’s zone 3 (alveolar pressure < pulmonary venous pressure). Factors which increase the likelihood of wedging in zones 1 and 2 include high intrathoracic pressures when there is normal or increased lung compliance (e.g. obstructive pulmonary disease and high intrinsic positive end-expiratory pressure (PEEP)) and low cardiac output states. Here, rotating the relevant lung down maximises the likelihood of zone 3 positioning.
At the bedside, tests which suggest appropriate zone 3 catheter tip positioning include:
Potential substitutes for PAOP
Measurement of PAOP requires wedging, which is associated with a number of risks (Table 12.6). The normal PA diastolic pressure (PADP) to PAOP gradient is < 5 mmHg, so that PADP may normally be used as a close approximation for PAOP. However, tachycardia (> 120 beats/min) and conditions that increase pulmonary vascular resistance (such as ARDS, chronic obstructive pulmonary disease and pulmonary embolism) variably increase this gradient, invalidating direct substitution of PADP for PAOP. The relationship between PADP and PAOP tends to be stable over hours. Once this is determined, PADP can be used to track PAOP in the short term without repeated wedge manoeuvres.
Table 12.6 Complications encountered with the pulmonary artery catheter (PAC) with proposed measures for prevention and treatment63
| Complications | Prevention | Treatment |
|---|---|---|
| During insertion | ||
| Damage to adjacent structures | As for central venous cannulation | As for central venous cannulation |
| Perforation of pulmonary artery | Ensure balloon inflated throughout insertion. Continuously monitor pulmonary artery waveform. Avoid distal PAC tip position | As for pulmonary artery rupture below |
| Air embolism | Raise venous pressure prior to insertion. Always occlude open ends during insertion. Use sheaths with pneumatic valve. Periodically check and tighten all connections. Remove air from fluid bag and tubing. Dress site with occlusive dressing after removal | Left lateral Trendelenburg position. Administer 100% oxygen and ventilatory support. If PAC in place, tighten all connections and attempt to aspirate air from right atrium or right ventricle. Basic/advanced life support if necessary |
| Dysrhythmia | Keep balloon inflated during passage from RA to PA. Minimise insertion time | For sustained ventricular tachycardia, remove PAC from right ventricle. For ventricular fibrillation, remove PAC and defibrillate |
| Right bundle branch block/complete heart block | Avoid PAC insertion in patients with left bundle branch block (LBBB) if possible. Insert PAC with pacing electrodes in patients with LBBB | Use pacing equipment as required |
| Catheter knotting/kinking | Minimise insertion time. Do not advance catheter against resistance. Check for waveform change from RA to RV or RV to PA after advancing 15 cm; if not, withdraw catheter | Check chest X-ray. Pull knot back then remove the sheath and catheter. If no sheath used, a cut-down to vein under local anaesthesia may be required. Exploration by a vascular surgeon is indicated if unsuccessful (5% of occasions) |
| Valve damage | Ensure balloon is inflated during forward passage through the heart and deflated prior to any retraction | Cardiothoracic consultation |
| During maintenance | ||
| Dysrhythmia (37%) | Remove PAC when no longer required | See above |
| Thrombosis | As for central venous cannulation | As for central venous cannulation |
| Pulmonary artery rupture (0.2%) | Risk factors include pulmonary hypertension, anticoagulation and in situ duration > 3 days. Maintain high level of suspicion. Avoid distal PAC tip position. Minimise wedge procedures. Continuously monitor pulmonary artery waveform – withdraw PAC if spontaneous wedging occurs, inflate with only enough air to change PA to PAOP waveform. Withdraw PAC if PAOP obtained with < 1.25 ml air | Check PAC position on chest X-ray, deflate and pull back. If applicable, stop anticoagulation therapy. Lateral position, affected side down. Selective bronchial intubation. PEEP. Surgical repair |
| Pulmonary infarction | As for pulmonary artery rupture | Check PAC position on chest X-ray, deflate and pull back. Observe |
| Infection – including endocarditis | As for central venous cannulation | As for central venous cannulation |
| Air embolism | High suspicion of balloon rupture. Avoid repeating failed attempts to inflate | See above |
RA, right atrial; PA, pulmonary artery; RV, right ventricular; PEEP, positive end-expiratory pressure; PAOP, pulmonary artery occlusion pressure.
Echocardiographic (non-invasive) estimation of PAOP has recently been described in critically ill patients.38
PULMONARY CAPILLARY HYDROSTATIC PRESSURE (Pcap)39
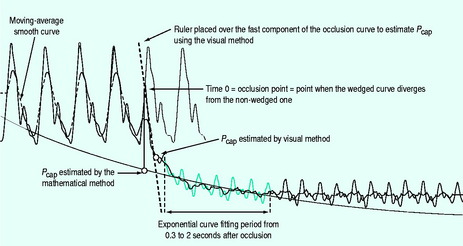
Pcap tends to force fluid out of the pulmonary capillaries into the interstitium, and when elevated can contribute to the development of pulmonary oedema. In critical illness such as ARDS and sepsis, variability in the distribution of the precapillary and postcapillary resistance alters the relationship between Pcap and PAOP. Because of this, a normal PAOP may substantially underestimate the tendency for fluid leakage from the pulmonary capillaries. Although it can be challenging, measurement of Pcap can be performed at the bedside by analysis of a pressure transient after an acute PA occlusion (Figure 12.3).
BOLUS THERMODILUTION CARDIAC OUTPUT
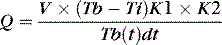
where Q = cardiac output; V = volume injected; Tb = blood temperature; Ti = injectate temperature; K1 and K2 = corrections for specific heat and density of injectate and for blood and dead space volumes; and Tb(t)dt = change in blood temperature as a function of time.
Too much or too little injectate will respectively underestimate and overestimate cardiac output. Cold injectate (preferably 0–4° C, but up to 12° C is usually accepted) improves the signal-to-noise ratio, but causes a brief decrease in heart rate, reducing cardiac output while it is being measured. Room temperature injectate introduces a small decrement in bias and precision, but has acceptable accuracy. However, the accuracy using room temperature injectate is further degraded at extremes of cardiac index, high ambient temperatures (and thus injectate temperature) or in patient hypothermia.29
Respiration causes fluctuations in cardiac output and PA temperature. Reproducibility is improved by taking measurements in expiration, though this may not reflect cardiac output throughout the respiratory cycle. Timing can be difficult and in practice an average of three evenly spaced measurements is taken. Causes of inaccurate measurements are listed in Table 12.7.
Table 12.7 Causes of inaccurate bolus thermodilution cardiac output measurements
| Catheter malposition |
| Wedge position |
| Thermistor impinging on vessel wall |
| Abnormal respiratory pattern |
| Intracardiac shunts |
| Tricuspid regurgitation (common in mechanically ventilated patients) |
| Cardiac dysrhythmias |
| Incorrect recording of injectate temperature (minimised by siting thermistor on injection port) |
| Rapid intravenous infusions, especially if administered via the introducer sheath |
| Injectate port close to or within introducer sheath |
| Abnormal haematocrit values (affecting K2 value) |
| Extremes of cardiac output (room temperature injectate) |
| Poor technique |
| Slow injection (> 4 s) |
| Incorrect injectate volume |
SEMICONTINUOUS THERMODILUTION CARDIAC OUTPUT41
This method uses the same principles as bolus thermodilution, but allows semicontinuous measurement by employing a thermal filament wrapped around the right ventricular segment of the catheter. This transmits low-power pulses of heat. ‘On–off’ heat pulses in pseudo-random binary code are delivered in cycles. The downstream thermistor detects the heat pulses, which are then cross-correlated with the input sequence and power (to allow differentiation of thermal signal from noise).
Drawbacks of the technique are:
DERIVED VARIABLES
A number of variables can be derived from the measurements obtained with a standard PAC (Table 12.8).
VOLUMETRIC PAC43

RVEDV is calculated from cardiac output (CO) and RVEF as follows:

The correlation between thermodilution RVEDV and thermodilution cardiac output is not fully explained by mathematical coupling of these variables.44 Thermodilution techniques appear to overestimate RVEDV and underestimate RVEF.45 However, right ventricular geometry is complex and there are limited options for bedside volumetric evaluation.
TRANSPULMONARY INDICATOR DILUTION
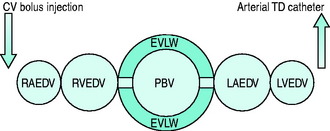
With this technique, thermal and other indicators injected into a central vein are detected in a systemic artery. Because the indicators pass through all chambers of the heart as well as the entire pulmonary circulation, information additional to cardiac output can be gained. In particular, central blood volumes and indices of extravascular lung water can be quantified (Figure 12.4).
TRANSPULMONARY THERMODILUTION8,46
USE OF A SECOND INDICATOR
Combining thermal dilution with simultaneous dye dilution is the basis of the double-indicator technique. Indocyanine green is used because it is non-toxic and highly albumin-bound, remaining confined to the intravascular space on its initial circulation. Rapid-response measurements can now be achieved using an in vivo fibreoptic sensor at the catheter tip.

EXTENDED APPLICATION OF TRANSPULMONARY THERMODILUTION (SINGLE INDICATOR)8,46
The pulmonary thermal volume (PTV; Figure 12.4) can be determined from the product of cardiac output and the ‘exponential downslope time’ (DST) on the semilogarithmic thermodilution curve. This relationship assumes that the majority of temperature decay occurs in the largest mixing chamber (PTV). This allows calculation of the global end-diastolic volume (GEDV), which is said to represent the volume of blood in all chambers of the heart at end-diastole. Hence:

ITBV* can be derived as a linear function of GEDV:

Like ITBV, GEDV has been shown to be a more reliable measure of cardiac preload than conventional pressure-based surrogates.49 Interpretation of measurements should account for the lack of differentiation between left and right cardiac volumes. For example, the clinical context and supplemental data may be important in differentiating acute cor pulmonale from left ventricular failure. Both these conditions could result in elevated ITBV/GEDV but require different therapy. Also low ITBV/GEDV does not mandate fluid challenge. For instance, low ITBV/GEDV in the setting of restrictive or constrictive pathology might not represent inadequate intravascular volume. These conditions may be associated with high CVP despite low ITBV/GEDV.
LITHIUM DILUTION CARDIAC OUTPUT50
Lithium can also serve as a transpulmonary indicator. The small doses of lithium required are non-toxic and easily measured with an ion-selective electrode. Following injection, there is no significant first-pass loss from the circulation. Blood is sampled from an arterial line via a three-way tap. A peristaltic pump limits sampling to 4 ml/min. After passing through the sensor, blood is discarded.
ULTRASOUND
Two approaches are available to measure stroke volume (and thereby, cardiac output) using sound waves. The first involves the use of echocardiography to measure systolic and diastolic left ventricular volumes. Stroke volume is calculated as the difference between these two volumes. Access to expensive echocardiographic equipment and trained personnel limits the usefulness of this technique for haemodynamic monitoring. The second method uses Doppler techniques to measure stroke volume (Figure 12.5).52 This approach is less dependent on image quality and shows better agreement with thermodilution.53 Although ultrasonic measurements tend to be operator-dependent, Doppler measurement of aortic blood flow demonstrates good reproducibility (intraobserver, interobserver and day-to-day variability 3.2 ± 2.9%, 5.4 ± 3.4% and 3.3 ± 3.1%, respectively).54
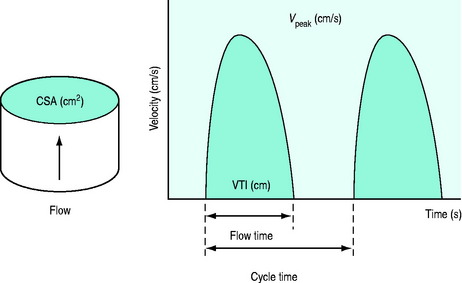
The Doppler principle states that the frequency of reflected sound is altered by a moving target, such as red blood cells. Continuous and pulsed-wave Doppler are the main techniques employed to measure flow. Physical principles for the two techniques are similar. Pulsed-wave Doppler allows the site (depth) of sampling to be specified; the target sample is usually central laminar flow. With continuous-wave Doppler, a piezoelectric crystal transmits the ultrasound beam while another measures the frequency ofreflected waves. The velocities of all the red blood cells moving along the path of the ultrasound beam are recorded. As a result, a continuous-wave Doppler recording consists of a full spectral envelope with the outer border corresponding to the fastest-moving blood cells. The flow velocity (V) of red cells can be determined from the Doppler shift in the frequency of reflected waves.
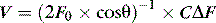
where C is the speed of ultrasound in tissue (1540 m/s), ΔF is the frequency shift, F0 is the emitted ultrasound frequency, and θ is the angle of incidence. The most accurate results are obtained when the ultrasound beam is parallel to flow (θ = 0°, cos θ = 1; θ =180°, cos θ = –1). However, angles up to 20° still yield acceptable results (θ = 20°, cos θ = 0.94).
In addition to measuring stroke volume, Doppler assessment of aortic blood flow can provide additional haemodynamic information. For instance, the duration of the aortic velocity signal corrected for heart rate (corrected flow time: FTc) is inversely related to the systemic vascular resistance; hence, it is a marker of left ventricular afterload. A decrease in left ventricular preload can be associated with an increase in afterload (low FTc). Other causes include excessive vasopressor doses, heart failure and hypothermia (all produce a low FTc).55 The peak velocity of aortic blood flow (Vpeak) has been proposed as an index of contractility. Also, respiratory variation in Vpeak (ΔVpeak) has been described as a predictor of increased cardiac output in response to fluid challenge.56
OESOPHAGEAL DOPPLER MONITORING8,57
ADVANTAGES
DISADVANTAGES
TRANSCUTANEOUS DOPPLER MONITORING
In the past, stroke volume and cardiac output have been measured with varying success by placing Doppler probes externally at the cardiac apex and suprasternal notch. Recently, an external continuous-wave Doppler monitoring device capable of measuring transpulmonary (parasternal) and transaortic (suprasternal) cardiac output has become available. Flow diameters are estimated by a proprietary algorithm based upon the linear association between height and cardiovascular dimensions.58 This allows measurement of stroke volume without two-dimensional echocardiographic measurements of valve diameters, which can be technically difficult.52 If diameters are known, this information can be entered into the device.
Like oesophageal Doppler, this method appears to offer a clinically useful alternative to thermodilution techniques for monitoring cardiac output and its variation.59 The technique can be used in all age groups and can be comfortably performed in non-sedated patients.
PARTIAL REBREATHING OF CO28,10,51
The Fick principle is an extension of the law of conservation of mass and states that the amount of a substance taken up by an organ (or the whole body) per unit time is the product of the arteriovenous concentration difference by the blood flow to the organ (or body). Historically it has been used to determine cardiac output by analysing oxygen uptake from the lungs (direct Fick method). This method requires PA catheterisation to sample mixed venous blood. Traditionally, it has been considered the ‘gold standard’, but in most ICU patients the stringent preconditions for accuracy are not met. Further error is introduced by the elevated oxygen consumption of inflamed lungs. Use is therefore mainly confined to cardiac laboratories.

where VCO2 is whole-body CO2 elimination, and CaCO2 and CvCO2 are the CO2 contents of arterial and mixed venous blood respectively.

PROBLEMS WITH THE PARTIAL REBREATHING OF CO2 METHOD
FUNCTIONAL HAEMODYNAMIC MONITORING
The recently coined term, functional haemodynamic monitoring, implies a therapeutic application, independent of diagnosis.60 It has been posed in response to the observation that, although stated in physiological terms, haemodynamic questions must be practical and concrete in order to address clinical problems. Arguably the most relevant functional haemodynamic question is: ‘Will stroke volume (or consequently cardiac output) increase with volume loading?’ This question can help guide the resuscitation of haemodynamically unstable patients and defines the clinical usefulness of predicting fluid responsiveness. This is an area of increasing research and clinical interest beyond the scope of this chapter. For reference, variables that have been described as indices of preload or predictors of fluid responsiveness in critically ill patients are presented in Table 12.9.
Table 12.9 Variables described as indices of cardiac preload or fluid responsiveness in critically ill patients
| Static | Dynamic |
|---|---|
| Intracardiac pressures | Spontaneous respiratory effort |
| Central venous pressure (CVP)/right atrial pressure (RAP) | Inspiratory decrease in right atrial pressure (ΔRAP) |
| Pulmonary artery occlusion pressure (PAOP) | |
| Mandatory mechanical ventilation | |
| Cardiovascular volumes | Systolic pressure variation (SPV) |
| Thermodilution right ventricular end-diastolic volume (RVEDV) | Decrease in systolic pressure (Δdown) |
| Echocardiographic RVEDV | Pulse pressure variation (PPV) |
| Echocardiographic left ventricular end-diastolic area (LVEDA)/volume (LVEDV) | Pulse contour analysis stroke volume variation (SVV) |
| Transpulmonary thermodilution global end-diastolic volume (GEDV) | Respiratory variation in peak aortic blood velocity (ΔVpeak) |
| Transpulmonary thermodilution intrathoracic blood volume (ITBV) | Respiratory change in the pre-ejection period (ΔPEP) |
| Respiratory systolic variation test (RSVT) | |
| Doppler | |
| Duration of the aortic velocity signal corrected for heart rate (FTc) | Passive leg raising |
| Change in aortic blood flow | |
| Change in pulse pressure | |
Variables have been divided into static and dynamic categories. Static variables are estimates of ventricular preload at a point in time, usually end-expiration. Dynamic variables are characterised by measurement of variation in haemodynamic measurements in response to changes in cardiac loading conditions.47,49,56,64–69
1 Bellomo R, Uchino S. Cardiovascular monitoring tools: use and misuse. Curr Opin Crit Care. 2003;9:225-229.
2 Wo CC, Shoemaker WC, Appel PL, et al. Unreliability of blood pressure and heart rate to evaluate cardiac output in emergency resuscitation and critical illness. Crit Care Med. 1993;21:218-223.
3 Cousins TR, O’Donnell JM. Arterial cannulation: a critical review. AANA J. 2004;72:267-271.
4 Whitta RK, Hall KF, Bennetts TM, et al. Comparison of normal or heparinised saline flushing on function of arterial lines. Crit Care Resusc. 2006;8:205-208.
5 Bentley MW, Lee CM. The frequency response of direct pressure measurement systems. Australas Phys Eng Sci Med. 1988;11:150-155.
6 Ercole A. Attenuation in invasive blood pressure measurement systems. Br J Anaesth. 2006;96:560-562.
7 Gardner RM. Direct blood pressure measurement – dynamic response requirements. Anesthesiology. 1981;54:227-236.
8 Chaney JC, Derdak S. Minimally invasive hemodynamic monitoring for the intensivist: current and emerging technology. Crit Care Med. 2002;30:2338-2345.
9 Godje O, Hoke K, Goetz AE, et al. Reliability of a new algorithm for continuous cardiac output determination by pulse-contour analysis during hemodynamic instability. Crit Care Med. 2002;30:52-58.
10 Parmley CL, Pousman RM. Noninvasive cardiac output monitoring. Curr Opin Anaesthesiol. 2002;15:675-680.
11 Manecke GR. Edwards FloTrac sensor and Vigileo monitor: easy, accurate, reliable cardiac output assessment using the arterial pulse wave. Exp Rev Med Devices. 2005;2:523-527.
12 Venus B, Satish P. Vascular cannulation. In: Civetta JM, Taylor RW, Kirby RR, editors. Critical Care. Philadelphia: Lippincott-Raven; 1997:521-544.
13 Tan PL, Gibson M. Central venous catheters: the role of radiology. Clin Radiol. 2006;61:13-22.
14 National Institute for Clinical Excellence. Guidance on the Use of Ultrasound Locating Devices for Placing Central Venous Catheters. London: National Institute for Clinical Excellence, 2002. Technology Appraisal Guidance no. 49
15 Keenan SP. Use of ultrasound to place central lines. J Crit Care. 2002;17:126-137.
16 Fletcher SJ, Bodenham AR. Safe placement of central venous catheters: where should the tip of the catheter lie? Br J Anaesth. 2000;85:188-191.
17 Joynt GM, Gomersall CD, Buckley TA, et al. Comparison of intrathoracic and intra-abdominal measurements of central venous pressure. Lancet. 1996;347:1155-1157.
18 Sturgess DJ, Marwick TH, Venkatesh B. Diastolic (dys)function in sepsis. In: Vincent JL, editor. Yearbook of Intensive Care and Emergency Medicine. Berlin: Springer-Verlag; 2007:444-454.
19 Magder S. How to use central venous pressure measurements. Curr Opin Crit Care. 2005;11:264-270.
20 Desjardins R, Denault AY, Belisle S, et al. Can peripheral venous pressure be interchangeable with central venous pressure in patients undergoing cardiac surgery? Intens Care Med. 2004;30:627-632.
21 Ward KR, Tiba MH, Barbee RW, et al. A new noninvasive method to determine central venous pressure. Resuscitation. 2006;70:238-246.
22 Rivers E, Nguyen B, Havstad S, et al. Early goal-directed therapy in the treatment of severe sepsis and septic shock. N Engl J Med. 2001;345:1368-1377.
23 Swan HJ, Ganz W, Forrester J, et al. Catheterization of the heart in man with use of a flow-directed balloon-tipped catheter. N Engl J Med. 1970;283:447-451.
24 Connors AFJr, Speroff T, Dawson NV, et al. The effectiveness of right heart catheterization in the initial care of critically ill patients. SUPPORT investigators. JAMA. 1996;276:889-897.
25 Dalen JE, Bone RC. Is it time to pull the pulmonary artery catheter? JAMA. 1996;276:916-918.
26 Harvey S, Young D, Brampton W, et al. Pulmonary artery catheters for adult patients in intensive care. Cochrane Database Syst Rev. 3, 2006. CD003408
27 Wheeler AP, Bernard GR, Thompson BT, et al. Pulmonary-artery versus central venous catheter to guide treatment of acute lung injury. N Engl J Med. 2006;354:2213-2224.
28 Chittock DR, Dhingra VK, Ronco JJ, et al. Severity of illness and risk of death associated with pulmonary artery catheter use. Crit Care Med. 2004;32:911-915.
29 Friese RS, Shafi S, Gentilello LM. Pulmonary artery catheter use is associated with reduced mortality in severely injured patients: a National Trauma Data Bank analysis of 53 312 patients. Crit Care Med. 2006;34:1597-1601.
30 Preas HLII, Suffredini AF. Pulmonary artery catheterization: insertion and quality control. In: Tobin MJ, editor. Principles and Practice of Intensive Care Monitoring. New York: McGraw Hill; 1998:773-795.
31 Worthley LIG. Vascular cannulation and haemodynamic pressure. In: Worthley LIG, editor. Synopsis of Intensive Care Medicine. Edinburgh: Churchill Livingstone; 1994:83-95.
32 Leeman M. Pulmonary hypertension in acute respiratory distress syndrome. Monaldi Arch Chest Dis. 1999;54:146-149.
33 McLean AS, Huang SJ. Intensive care echocardiography. In: Vincent JL, editor. Yearbook of Intensive Care and Emergency Medicine. Berlin: Springer-Verlag; 2006:131-141.
34 Ristow B, Ali S, Ren X, et al. Elevated pulmonary artery pressure by Doppler echocardiography predicts hospitalization for heart failure and mortality in ambulatory stable coronary artery disease: the Heart and Soul Study. J Am Coll Cardiol. 2007;49:43-49.
35 Pinsky MR. Hemodynamic profile interpretration. In: Tobin MJ, editor. Principles and Practice of Intensive Care Monitoring. New York: McGraw Hill; 1998:871-888.
36 Calvin JE, Driedger AA, Sibbald WJ. Does the pulmonary capillary wedge pressure predict left ventricular preload in critically ill patients? Crit Care Med. 1981;9:437-443.
37 Summerhill EM, Baram M. Principles of pulmonary artery catheterization in the critically ill. Lung. 2005;183:209-219.
38 Bouhemad B, Nicolas-Robin A, Benois A, et al. Echocardiographic Doppler assessment of pulmonary capillary wedge pressure in surgical patients with postoperative circulatory shock and acute lung injury. Anesthesiology. 2003;98:1091-1100.
39 Ganter BG, Jakob SM, Takala J. Pulmonary capillary pressure. A review. Minerva Anestesiol. 2006;72:21-36.
40 Stetz CW, Miller RG, Kelly GE, et al. Reliability of the thermodilution method in the determination of cardiac output in clinical practice. Am Rev Respir Dis. 1982;126:1001-1014.
41 Bennett JA. Equipment review: Edwards vigilance continuous cardiac output monitor. Am J Anesthesiol. 1995;22:269-272.
42 Haller M, Zollner C, Briegel J, et al. Evaluation of a new continuous thermodilution cardiac output monitor in critically ill patients: a prospective criterion standard study. Crit Care Med. 1995;23:860-866.
43 Wiesenack C, Fiegl C, Keyser A, et al. Continuously assessed right ventricular end-diastolic volume as a marker of cardiac preload and fluid responsiveness in mechanically ventilated cardiac surgical patients. Crit Care. 2005;9:R226-233.
44 Nelson LD, Safcsak K, Cheatham ML, et al. Mathematical coupling does not explain the relationship between right ventricular end-diastolic volume and cardiac output. Crit Care Med. 2001;29:940-943.
45 Globits S, Pacher R, Frank H, et al. Comparative assessment of right ventricular volumes and ejection fraction by thermodilution and magnetic resonance imaging in dilated cardiomyopathy. Cardiology. 1995;86:67-72.
46 Hudson ERGN, Beale RF. Lung water and blood volume measurements in the critically ill. Curr Opin Crit Care. 2000;6:222-226.
47 Reuter DA, Felbinger TW, Schmidt C, et al. Stroke volume variations for assessment of cardiac responsiveness to volume loading in mechanically ventilated patients after cardiac surgery. Intens Care Med. 2002;28:392-398.
48 Kuzkov VV, Kirov MY, Sovershaev MA, et al. Extravascular lung water determined with single transpulmonary thermodilution correlates with the severity of sepsis-induced acute lung injury. Crit Care Med. 2006;34:1647-1653.
49 Hofer CK, Furrer L, Matter-Ensner S, et al. Volumetric preload measurement by thermodilution: a comparison with transoesophageal echocardiography. Br J Anaesth. 2005;94:748-755.
50 Jonas MM, Tanser SJ. Lithium dilution measurement of cardiac output and arterial pulse waveform analysis: an indicator dilution calibrated beat-by-beat system for continuous estimation of cardiac output. Curr Opin Crit Care. 2002;8:257-261.
51 Hofer CK, Zollinger A. Less invasive cardiac output monitoring: characteristics and limitations. In: Vincent JL, editor. Yearbook of Intensive Care and Emergency Medicine. Berlin: Springer-Verlag; 2006:162-175.
52 Quinones MA, Otto CM, Stoddard M, et al. Recommendations for quantification of Doppler echocardiography: a report from the Doppler Quantification Task Force of the Nomenclature and Standards Committee of the American Society of Echocardiography. J Am Soc Echocardiogr. 2002;15:167-184.
53 McLean AS, Needham A, Stewart D, et al. Estimation of cardiac output by noninvasive echocardiographic techniques in the critically ill subject. Anaesth Intens Care. 1997;25:250-254.
54 Gardin JM, Dabestani A, Matin K, et al. Reproducibility of Doppler aortic blood flow measurements: studies on intraobserver, interobserver and day-to-day variability in normal subjects. Am J Cardiol. 1984;54:1092-1098.
55 Singer M. The FTc is not an accurate marker of left ventricular preload. Intens Care Med. 2006;32:1089.
56 Feissel M, Michard F, Mangin I, et al. Respiratory changes in aortic blood velocity as an indicator of fluid responsiveness in ventilated patients with septic shock. Chest. 2001;119:867-873.
57 Cholley BP, Payen D. Noninvasive techniques for measurements of cardiac output. Curr Opin Crit Care. 2005;11:424-429.
58 Nidorf SM, Picard MH, Triulzi MO, et al. New perspectives in the assessment of cardiac chamber dimensions during development and adulthood. J Am Coll Cardiol. 1992;19:983-988.
59 Tan HL, Pinder M, Parsons R, et al. Clinical evaluation of USCOM ultrasonic cardiac output monitor in cardiac surgical patients in intensive care unit. Br J Anaesth. 2005;94:287-291.
60 Pinsky MR. Functional hemodynamic monitoring. Intens Care Med. 2002;28:386-388.
61 Durbin CGJr. Radial arterial lines and sticks: what are the risks? Respir Care. 2001;46:229-231.
62 McGee DC, Gould MK. Preventing complications of central venous catheterization. N Engl J Med. 2003;348:1123-1133.
63 Complications encountered with the PAC. Available online at www.pacep.org, 2006. Accessed November 2006
64 Bendjelid K, Romand JA. Fluid responsiveness in mechanically ventilated patients: a review of indices used in intensive care. Intens Care Med. 2003;29:352-360.
65 Monnet X, Rienzo M, Osman D, et al. Esophageal Doppler monitoring predicts fluid responsiveness in critically ill ventilated patients. Intens Care Med. 2005;31:1195-1201.
66 Perel A, Minkovich L, Preisman S, et al. Assessing fluid-responsiveness by a standardized ventilatory maneuver: the respiratory systolic variation test. Anesth Analg. 2005;100:942-945.
67 Monnet X, Rienzo M, Osman D, et al. Passive leg raising predicts fluid responsiveness in the critically ill. Crit Care Med. 2006;34:1402-1407.
68 Bendjelid K, Suter PM, Romand JA. The respiratory change in preejection period: a new method to predict fluid responsiveness. J Appl Physiol. 2004;96:337-342.
69 Magder S, Georgiadis G, Cheong T. Respiratory variations in right atrial pressure predict the response to fluid challenge. J Crit Care. 1992;7:76-85.
[/level-membership-for-anesthesiology-category][not-level-membership-for-anesthesiology-category]
Chapter 12 Haemodynamic monitoring
Haemodynamics is the study of blood flow. Haemodynamic monitoring therefore refers to the monitoring of blood flow through the cardiovascular system. In the intensive care unit (ICU), haemodynamic monitoring is used to detect cardiovascular insufficiency, differentiate contributing factors and guide therapy.
There has been debate over the risks and benefits of invasive haemodynamic monitoring in critically ill patients. Because there are scant data to show that invasive monitoring leads to improved survival, there has been a steady trend toward less invasive monitoring in the ICU. Regular clinical assessment remains an important component of haemodynamic monitoring, and any acquired physiological data must be interpreted in the clinical context. Importantly, monitoring must be combined with effective therapy in order to demonstrate an impact on outcome.1
ARTERIAL BLOOD PRESSURE
In the absence of sophisticated waveform analysis, arterial pressure is poorly correlated with cardiac output. Hence clinical estimation of cardiac output from arterial pressure and heart rate is unreliable until extreme hypotension occurs.2
NON-INVASIVE ARTERIAL BLOOD PRESSURE (NIBP) MEASUREMENT
Oscillometry overestimates low pressures and underestimates high pressures, but for the normotensive range the 95% confidence limits are ± 15 mmHg (2 kPa). Dysrhythmias increase the error. Cuff width should be 40% of the mid-circumference of the limb. Narrower cuffs overestimate and wider cuffs underestimate blood pressures.
INVASIVE BLOOD PRESSURE MEASUREMENT3
The radial artery is the most common site for cannulation. Nothing larger than a 20-gauge cannula is advisable, and either a modified Seldinger technique or direct cannulation can be used. Once inserted, the cannula is usually infused with normal or heparinised saline at 3 ml/h, with a snap flush rate of 30–60 ml/h. Although it appears not to prolong patency, the use of heparinised saline (2–4 units/ml) might improve accuracy.4 It should be avoided if heparin-induced thrombocytopenia syndrome is suspected.
The axillary, brachial, femoral, posterior tibial and dorsalis pedis arteries can all be used without apparently raising the complication profile (Table 12.1). In severe circulatory compromise, gaining peripheral arterial access may be difficult and time-consuming. Rapid femoral cannulation by the Seldinger percutaneous technique usually remains feasible, with the added advantage that femoral arterial monitoring more accurately reflects aortic pressure in low-output states.
Table 12.1 Complications of arterial cannulation, with suggested preventive and treatment options61
| Complication | Prevention | Treatment |
|---|---|---|
| Vascular thrombosis (ranges from 7 to 30% following radial artery cannulation). Risk factors for digital ischaemia include: shock, sepsis, embolus of air or clot, hyperlipoproteinaemia, vasculitis, female sex, prothrombotic states, accidental intra-arterial injection of drugs | Risks reduced by smaller catheter, larger artery, decreased duration of cannulation, avoiding traumatic insertion and multiple attempts. Allen’s test (including modifications such as Doppler, plethysmography and digital blood pressure) is probably unhelpful | Remove cannula. Arterial thrombosis is usually self-limiting. Severe ischaemic damage estimated at < 0.01%. Anticoagulation and/or vascular surgery/intervention may be necessary |
| Distal embolisation | Diligent catheter care and observation | As for thrombosis |
| Proximal embolisation of clot or air (can result in stroke) | Diligent catheter care and observation. Exclude air from pressurised system. Avoid axillary, subclavian or carotid access | Tailored to sequelae |
| Vascular spasm | Smaller catheter, larger artery. Avoid traumatic insertion and multiple attempts | Remove cannula. Resite if necessary |
| Skin necrosis at catheter site | Diligent catheter care and observation | Surgical debridement and skin grafting may be necessary |
| Line disconnection and bleeding/exsanguination | Minimise connections. Diligent catheter care and observation | Control bleeding. Transfusion may be necessary |
| Accidental drug injection | Clearly label arterial line near ports | Leave cannula in situ to facilitate treatment if required. Depends on drug injected. May require papaverine or procaine, analgesia, sympathetic block of limb and anticoagulation |
| Infection – local or systemic | Diligent catheter care and observation | Remove cannula and send tip for culture. Resite if necessary. Immobilise and elevate affected upper limb. Start empiric antibiotics if sepsis or septic shock is present |
| Damage to nearby structures such as nerves, directly or due to haematoma (e.g. compartment syndrome or carpal tunnel syndrome). Arteriovenous fistula. Femoral approach can be associated with bowel damage | Careful insertion technique. Seek assistance from experienced operator | Tailored to sequelae. Haematomas can develop into pseudoaneurysms requiring surgery |
Cannulae are usually removed or resited between days 5 and 7, or earlier if a complication is suspected. Distal perfusion should be checked at least 8-hourly, and the cannula removed if there is persistent blanching, coolness with sluggish capillary refill, loss of pulses or evidence of raised muscle compartment pressures. Complications associated with arterial cannulation are presented in Table 12.1.
PHYSICAL PROPERTIES OF CLINICAL PRESSURE MEASUREMENT SYSTEMS5,6
The natural resonant frequency of the system should ideally exceed 30 Hz (> 10 harmonics) for heart rates up to 180 beats/min (3 Hz) to prevent distortion of the biological signal by sine-wave system oscillations. Damping refers to any property of an oscillatory system that reduces the amplitude of oscillations. Factors that increase oscillation in the system, such as increased tubing length, diameter or compliance, cause underdamping. Overdamping tends to smooth the waveform, causing underestimation of SBP and overestimation of DBP, while MAP tends to be preserved. Contributing factors include clots, air bubbles and loose connections. Damping can be assessed clinically by the fast-flush test (Table 12.2).7
Table 12.2 Fast-flush test to assess dynamic response (damping) of the blood pressure-monitoring system
| Make a paper record of transducer output |
| Snap the valve of the continuous flush system. This produces a square wave on the output trace |
| Repeat the process at least twice |
| Resonant frequency is the distance between successive peaks divided by the paper speed in millimetres per second |
| Damping is satisfactory (critical damping) if each snap test has two to three oscillation waves, with each wave one-third or less the size of the preceding wave |
ADDITIONAL INFORMATION FROM THE ARTERIAL WAVEFORM
ESTIMATION OF STROKE VOLUME AND CARDIAC OUTPUT8
Estimation of stroke volume by analysis of the arterial pressure waveform, in particular various properties of the pulse pressure (pressure above diastolic) component, has been studied for many years. Pulse contour analysis calculates stroke volume from the area under the systolic portion of the arterial pressure waveform. After individual calibration, these monitors can determine stroke volume beat-to-beat. Cardiac output, derived by multiplying stroke volume by heart rate, appears to offer reliable continuous cardiac output monitoring, even during haemodynamic instability.9 However, accuracy in the presence of arrhythmia has not been validated.
Transpulmonary indicator dilution (discussed below) is the usual method of calibration. Pulse contour devices that use thermodilution or lithium ion calibration are commercially available.10 Comparisons with pulmonary artery catheter (PAC) cardiac output measurements have shown good agreement, with mean bias values ≤ 0.1 l/min and precision (SD of bias) of the order of 0.6 l/min.
Disadvantages of such techniques can include:
Recently developed proprietary algorithms continuously measure stroke volume and cardiac output without requiring calibration against another method.11 Additional clinical validation is awaited.
CENTRAL VENOUS CATHETERISATION (CVC)
CVC is indicated for monitoring of central venous pressure (CVP) and administration of certain drugs and parenteral nutrition. Modified catheters are also available which continuously monitor central venous oxygen saturation (ScvO2). Contraindications to CVC are relative and reflect potential complications of the procedure (Table 12.3). These should be considered in selecting the site for catheter insertion. Particular attention should be paid to the coagulation profile and factors which affect coagulation such as thrombolysis and activated protein C therapy.
Table 12.3 Complications of central venous catheterisation, with preventive and treatment options62
| Complication | Prevention | Treatment |
|---|---|---|
| Intravascular loss of guidewire | Ensure guidewire is always secured. Avoid retracting guidewire into insertion needle. Seek assistance from experienced operator | Interventional radiology or surgery may be required for retrieval |
| Air embolism | Proper patient positioning, including Trendelenburg (head-down tilt) for jugular or subclavian insertion. Consider alternative insertion sites. Ensure connections are tight | Left lateral Trendelenburg position. Administer 100% oxygen and ventilatory support. If catheter in place, tighten all connections and attempt to aspirate air. Basic/advanced life support if necessary |
| Dysrhythmias and conduction defects such as right bundle branch block | Continuous electrocardiographic monitoring during insertion. Correct placement of catheter tip | Withdraw or remove guidewire or catheter |
| Damage to nearby structures: Pneumothorax/haemothorax/chylothorax/hydrothorax, particularly with approaches to subclavian vein. Nerve injury such as phrenic, recurrent laryngeal, Horner’s syndrome. Arterial puncture – including injury to carotid, subclavian, aorta or pulmonary artery. Haematoma, pseudoaneurysm, arteriovenous fistula can result. Stroke may result from carotid artery injury. Tracheal injury. Femoral approach can be associated with bowel damage | Identify risk factors such as previous surgery, skeletal deformity or scarring at site of insertion. Seek assistance from experienced operator. Select insertion site depending on impact of potential complications. Consider ultrasound guidance. Scheduled, routine replacement of catheter increases risk of mechanical complications | Tailored to sequelae |
| Line disconnection and bleeding | Minimise connections. Proper catheter care and observation | Control bleeding. Transfusion may be necessary |
| Infection – local or systemic (including endocarditis) | Aseptic insertion technique. Lower risk with subclavian compared to internal jugular or femoral insertion. Antimicrobial-impregnated catheters. Disinfect catheter hubs. Routine scheduled resiting appears not to reduce systemic infection rates. Remove catheter when no longer required | Remove catheter; resite if necessary. Culture blood and catheter tip. Start empiric antibiotics if sepsis or septic shock is present |
| Superior vena caval erosion can result in haemothorax or cardiac tamponade | Remove catheter when no longer required | Early detection and surgical intervention |
| Thrombosis | Remove catheter when no longer required. Subclavian insertion lower risk than internal jugular or femoral | Anticoagulation, vascular or endovascular intervention may be required |
Traditionally, puncture of the central vein is performed by passing a needle along the anticipated line of the vein with reference to surface anatomical landmarks (landmark method). Catheterisation is usually achieved via the subclavian, internal jugular or external jugular veins into the superior vena cava.12 The median cubital and basilic veins are used less commonly. Access to the subclavian vein is usually via the infraclavicular approach, but the supraclavicular approach is safe and reliable in experienced hands.
The use of ultrasound has been advocated to optimise the success rate of CVC insertion and minimise complications.13 Two-dimensional imaging can be used to localise the vein and define anatomy prior to placement of a CVC by standard landmark techniques. Ultrasound can also provide real-time, two-dimensional guidance during CVC insertion. Alternatively, audio-guided Doppler ultrasound can aid localisation of the vein and differentiate it from its companion artery during CVC insertion.
In 2002, the UK National Institute for Clinical Excellence issued guidelines recommending the use of ultrasound for elective catheterisation of the internal jugular vein, and consideration of ultrasound guidance in most clinical situations.14 These recommendations for ultrasound-guided internal jugular catheterisation are supported by meta-analysis.15 However, there are limited data supporting its use for subclavian and femoral veins.
The right tracheobronchial angle and carina are common radiological markers of insertion depth. In an attempt to reduce further the incidence of venous erosion (which is rare but potentially catastrophic), some practitioners place the catheter tip lower in superior vena cava or even in the upper right atrium, ensuring that the catheter is parallel to the long axis of the vein so that the tip does not abut the vein or heart wall end-on.16
Femoral venous catheterisation with radiological positioning of the tip close to the right atrium produces pressure measurements in good agreement with the subclavian CVP.17
CENTRAL VENOUS PRESSURE
The normal CVP in the spontaneously breathing supine patient is 0–5 mmHg, while 10 mmHg is generally accepted as the upper limit during mechanical ventilation. In health there is a good correlation between CVP and pulmonary artery occlusion pressures (PAOP), but this is lost in many types of critical illness such as pulmonary hypertension, pulmonary embolism, right ventricular infarction, left ventricular hypertrophy and myocardial ischaemia. The relationship between CVP and right ventricular end-diastolic volume (RVEDV: preload) is altered in critical illness by changes in right ventricular diastolic compliance and juxtacardiac pressures.18
Except at extreme values, static measures of CVP do not differentiate patients likely to respond to fluid therapy from non-responders. However, dynamic changes in CVP either in response to volume loading or related to respiration can assist in evaluating volume status.19 For instance, a steep increase in CVP following volume challenge suggests the heart is functioning on the plateau portion of the Frank–Starling curve. Severe hypotension with a low or normal CVP is unlikely to be due to acute pulmonary embolism, cardiac tamponade or tension pneumothorax.
Although fluid manometry is sufficient to measure the CVP, the frequency response is low and waveform analysis impossible (Table 12.4). Therefore, an electrical transducer system is normally used.
| Condition | Pressure changes | Waveform changes |
|---|---|---|
| Tricuspid regurgitation | Increased RA pressure | Prominent v-wave, x descent obliterated, y descent steep |
| Right ventricular infarction | RA and RV pressure elevated. RAP does not fall and may rise in inspiration | Prominent x and y descents |
| Constrictive pericarditis | RA, RV diastolic, PA diastolic and occlusion pressures elevated and equalised. RAP may rise in inspiration | Prominent x and y descents |
| Pericardial tamponade | RA, RV diastolic, PA diastolic and occlusion pressures elevated and equalised. RAP usually falls in inspiration | y descent damped or absent |
RA, right atrial; RV, right ventricular; RAP, right atrial pressure; PA, pulmonary artery.
In a trend toward less invasive monitoring, peripheral venous pressure and non-invasive estimates of CVP have demonstrated potential as alternatives to direct CVP measurement.20,21
ScvO2
A recent prospective randomised study of patients with severe sepsis and septic shock demonstrated a survival advantage with the use of this monitoring technique and an emergency department treatment protocol (early goal-directed therapy).22 ScvO2 has been proposed as a marker of tissue hypoxia (see Chapter 14). It is mentioned here as an example of the scant data relating haemodynamic monitoring to improved survival.
PULMONARY ARTERY CATHETER
Right-heart catheterisation using a flow-directed balloon-tipped catheter was introduced by Swan and Ganz in 1970.23 The ability to monitor sophisticated haemodynamic and gas exchange variables at the bedside appealed to clinicians, and the PAC was rapidly accepted into routine critical care.
In 1996 a non-randomised cohort study of PAC use in American teaching hospitals appeared to show that, in any of nine major disease categories, PAC in the first 24 hours increased 30-day mortality (odds ratio 1.24, 95% confidence interval (CI) 1.03–1.49), mean length of stay and mean cost per hospital stay.24 A simultaneous editorial called for a moratorium on PAC use, and for a prospective multicentre trial.25
A subsequent Cochrane database systematic review of PAC monitoring in adult ICU patients incorporated data from two recent multicentre trials and 10 other studies.26 The pooled mortality odds ratio for studies of general ICU patients was 1.05 (95% CI 0.87–1.26) and for studies of high-risk surgery patients was 0.99 (95% CI 0.73–1.24). PAC monitoring had no impact on ICU or hospital length of stay (where reported). A recent multicentre trial incorporating protocolised haemodynamic management of patients with acute lung injury compared PAC-guided with CVC-guided therapy.27 There were no significant differences in 60-day mortality or organ function between groups. Overall, these data suggest that PAC monitoring in critically ill patients is not associated with increased mortality or with survival benefit.
On the other hand, recent data suggest a differential association between PAC use and mortality dependent upon severity of illness. Logistic regression analyses of data from a tertiary-care university teaching hospital28 and from the National Trauma Data Bank (American College of Surgeons)29 suggest that PAC use may be associated with survival benefit in the most severely ill/injured patients.
Overall, the PAC still finds application as a haemodynamic monitoring tool in the ICU and the operating room. However, its role is under increasing scrutiny, and continues to decline in favour of less invasive alternatives. It could be argued that future PAC use should be guided by studies to determine optimal management protocols and appropriate patient groups.26
Traditional indications for PAC monitoring have been to:
CATHETER INSERTION30
Balloon volume is 1.5 ml. The balloon should be tested prior to insertion into the sheath. Deflation should always occur passively to minimise the risk of balloon damage. Before passage through the heart the balloon should be inflated to assist flow guidance and protect against myocardial injury and dysrhythmias. Inflation should not be forced, and should not alter the waveform prior to wedging. The right atrium is reached at 15–20 cm from the internal jugular vein, 10–15 cm from the subclavian vein, 30–40 cm from the femoral vein and 40 and 50 cm respectively from the right and left basilic veins. The right ventricle and pulmonary artery (PA) are then entered at additional 10-cm intervals, with a further 10 cm to PA occlusion.31 Waveforms seen as the catheter floats to the wedged position are shown in Figure 12.1.
