Chapter 43 Global Developmental Delay and Mental Retardation/Intellectual Disability
Definitions
Global developmental delay and mental retardation are related, complementary, nonsynonymous terms featuring both common and distinctive characteristics. In a manner analogous to cerebral palsy, each is a symptom complex highlighting a clinically recognizable entity that is etiologically heterogeneous, and which mandates a particular evaluation, management, and intervention approach. Both can be conceptualized as neurodevelopmental disabilities that can be defined as early-onset, chronic disorders that share the essential feature of a predominant disturbance in the acquisition of cognitive, motor, language, or social skills, which has a significant and continuing impact on the developmental progress of an individual [APA, 1994]. Diagnosis of these disorders occurs against a backdrop of a wide variation in “normality” of what can be highly individualized developmental trajectories that may not be smooth [Darrah et al., 2003]. Clear boundary lines may not be evident, mandating diagnosis over time rather than at a single point of clinical contact.
The consensus definition put forward in 2002 by the American Association on Mental Retardation (AAMR) defines mental retardation as “a disability characterized by a significant limitation both in intellectual functioning and in adaptive behavior as expressed in conceptual, social, practical, and adaptive skills.” This disability originates before the age of 18 [AAMR, 2002] and manifests with severe problems in the individual’s capacity to perform (i.e., impairment), ability to perform (i.e., activity limitations), and opportunity to function (i.e., participation restrictions) [WHO, 2001]. Correct and consistent application of this definition requires an awareness of five inherent contextual assumptions:
For the young child, the term global developmental delay has emerged to describe a disturbance across a variety of developmental domains [Batshaw and Shapiro, 1997; Fenichel, 2001; Kinsbourne and Graf, 2001; Majnemer and Shevell, 1995; Shevell et al., 2000; Simeonsson and Simeonsson, 2001]. Such a child has limitations or delay in the acquisition of developmental and functional skills that are both observable and measurable within the context of the natural progression of infants and young children [Shevell, 2008]. The latest consensus definition used by the American Academy of Neurology (AAN) practice parameter statement defines global developmental delay operationally as a significant delay in two or more developmental domains (e.g., gross/fine motor, cognitive, speech/language, personal/social, activities of daily living) [Shevell et al., 2003]. Typically, if there is delay in two domains, this implies delay across all domains.
Global developmental delay and intellectual disability are frequently diagnosed on the basis of experienced clinical judgment in advance of or as a substitute for detailed standardized assessments. Potential errors in measurements create a zone of uncertainty or range of confidence captured in the concept of the standard error of measurement (SEM) [Reschly, 1987]. This contributes to a conceptual hesitation regarding the application of strict numerical cutoffs. Accuracy is increased by repeated application of a particular measure over a longitudinal time interval [Batshaw, 1993]. The precise relationship between the diagnoses of mental retardation and global developmental delay must still be determined [Petersen et al., 1998; Yatchmink, 1996]; however, limitations and delay in the widespread acquisition of developmental skills, especially language, may be a harbinger of later intellectual disability.
Epidemiology
Much information has been ascertained regarding the prevalence and causes of mental retardation; however, interpretation of these data necessitates an understanding of the assumptions inherent in these analyses. The operational parameters for mental retardation usually include an intelligence quotient (IQ) value that is 2 standard deviations below the mean (IQ below 70), identification before the age of 18, and difficulties in adaptive functioning. Although definitions are arbitrary, they allow for agreement on standardization of measurement. Assuming a normal distribution of IQ scores, approximately 2.25 percent of individuals will have an IQ below 70. Many of these individuals (given the high correlation between scores on IQ tests and standardized adaptive functioning tests) will also have adaptive difficulties, meeting the definition of mental retardation. Early population-based studies seem to have confirmed this point. Hagberg and Kyllerman [1983] documented a rate of mental retardation of 2 percent; 1.5 percent had mild mental retardation (IQ of 50–70), and 0.5 percent had moderate or severe mental retardation (IQ of less than 50). The population studied and the instruments used can influence the rate of mild mental retardation, but they seem to have little effect on the rate of severe mental retardation. The prevalence rates for mild mental retardation in 15 subsequent studies varied from 5 to 80 cases per 1000 people, with an average prevalence of 35 per 1000. In contrast, in 37 studies the prevalence of severe mental retardation varied only between 2.5 and 7 per 1000, with an average of 3.6 per 1000 [Leonard and Wen, 2002].
Because the highest percentage of children with mental retardation are in the mild range, any change between measured populations in mental retardation definitions or in the type or severity of deleterious environmental exposures (e.g., poor education, nutrition, environmental toxins, such as lead) can have a significant effect on the overall numbers of children with mild mental retardation. One of the more comprehensive investigations of mental retardation, the Metropolitan Atlanta Developmental Disabilities Study, identified a smaller than average rate for mild mental retardation (IQ of 50–70) of 8.4 per 1000, whereas that for severe mental retardation, at 3.6 per 1000, was consistent with the meta-analysis average [Boyle et al., 1996; Yeargin-Allsopp et al., 1997]. This study also documented two additional observations about the prevalence of mental retardation: race disparity and gender imbalance. The Atlanta study found that mental retardation was overrepresented by 50 percent among blacks relative to the white population [Yeargin-Allsopp et al., 1995], and that the male to female ratio was 1.4:1.0. A California study reported a similar rate of racial disparity for all categories of mental retardation and found that there was a substantial increased risk associated with low birth weight and maternal age [Croen et al., 2001]. Additional maternal influences observed in this study that increase the risk for mental retardation include poor nutritional status, tobacco smoking, and alcohol consumption. Paternal smoking also increases the risk of having affected children. In almost every study, gender disparity is a consistent finding, with males accounting for 20–40 percent more of the cases than females. A significant component of this difference may be related to X chromosome disorders, but studies have shown that maternal smoking or low birth weight has a more direct effect on IQ in male infants, suggesting that this disparity has many causes [Leonard and Wen, 2002].
Many individuals with severe or mild mental retardation are unable to become productive members of society and require institutionalized or group-home care. The economic costs to society are substantial. In a Dutch study, mental retardation was the disease category with the largest health-care costs, almost equal to the economic impact of stroke, heart disease, and cancer combined [Meerding et al., 1998]. An analysis by the U.S. Centers for Disease Control and Prevention (CDC) estimates lifetime costs of more than $1 million dollars per person with mental retardation, which is more than that for cerebral palsy, hearing loss, or vision impairment [CDC, 2004].
History and Ethics
The first to draw a clear distinction between mental retardation and mental illness was the English philosopher John Locke, who wrote in his essay Concerning Human Understanding (1690), “Herein seems to lie the difference between idiots and madmen, that madmen put wrong ideas together and reason from them, but idiots make very few or no propositions and reason scarce at all.” The development of intelligence testing by Alfred Binet and Theodore Simon in 1905 ushered in an era of a more rigorous, scientific approach to defining mental retardation that became the basis for formulating an approach to its comprehensive management [Sherr and Ferriero, 2003].
Early 20th-century definitions of mental retardation focused on its incurability with permanent predetermined limitations and consistent prevention of participation in society (e.g., “mental deficiency is a state of incomplete mental development of such a kind and degree that the individual is incapable of adapting himself to the normal environment of his fellows in such a way to maintain existence independently of supervision, control or external support”; [Tredgold, 1937]). In the middle of the 20th century, adaptive behavior limitations were added as criteria for diagnosing mental retardation [Heber, 1961]. This addition was meant to implement a reduction in rigid reliance on IQ scores and to better reflect the social characteristics of the disability that is attached to mental retardation. Adaptive behavior deficiency was conceptualized as problems in maturation, learning, or social adjustment that were based on difficulties in adjusting to ordinary demands. By 1973, the AAMR definition of mental retardation required concurrent manifested deficits in general intellectual function and adaptive behavior [Grossman, 1973]. A 1992 AAMR definition specified the adaptive skill areas affected and emphasized limitations in current functioning across the individual’s life span [Luckasson et al., 1992]. As captured in the most recent effort of consensus definition, adaptive deficits lead to both activity limitations and participation restrictions that necessitate contextually driven systems of support to enable the individual’s fullest actualization of inherent potential and broadest societal integration [AAMR, 2002].
Evolution of the concept of mental retardation has been marked by an on-going debate regarding the nature of intelligence and its measurement. Despite the changing nuances of its definition, the primary criterion for diagnosing mental retardation over time has always been a deficit in intellectual ability [Gottfredson, 1997]. Factor analysis of data obtained from administering cognitive tests to large groups of individuals permitted the objectification of a unifactorial latent trait (i.e., general intelligence) to account for the variance between cognitive scores [Spearman, 1927]. Within this framework, intelligence was conceptualized as general mental capability that includes the ability to reason, solve problems, think abstractly, plan, and learn from experience [Carroll, 1997]. In essence, it is a reflection of a person’s ability to comprehend his or her surroundings. In contradistinction to the established unifactorial position of intelligence, several theoretical models of intelligence as a multidimensional construct have been put forward, with each intelligence component featuring distinctive developmental trajectories, problem-solving, and information-processing capacities [Gardner, 1993]. Validation by standardized and quantifiable measures of these intriguing and intuitively appealing constructs of intelligence remains elusive.
Historical controversy exists regarding the mechanisms by which intelligence can be measured and the social, cultural, and ethnic contexts of its measurement [Gould, 1981]. Establishing cutoff points for the labeling of “subaverage intellectual functioning” has also been problematic [MacMillan et al., 1995], especially with the single application of a particular measure and with scores that fall near the cutoff point within the range of the test SEM. IQ scores have also unfortunately been used at various historical points to further biologically determinist agendas and potentially to demonize minority groups [Gould, 1981].
A survey of the past century reveals a remarkable trajectory in the treatment of those affected by mental retardation or global developmental delay in Western society. With the prominence of eugenics (i.e., science of the improvement of the human race by better breeding) in the first part of the 20th century, those with mental retardation were targeted for involuntary eugenic sterilization in many jurisdictions [Kevles, 1985; Parent and Shevell, 1998; Proctor, 1988]. The global emphasis after World War II on individual civil rights resulted in national and international mandates that provided for legislative and judicial protection for the intellectually disabled from active discrimination (e.g., Americans with Disabilities Act of 1990 is but one national example). Early educational, rehabilitation, and school programs financed by public funds for those at risk of developmental disability or affected by mental handicap (e.g., Early Intervention Amendments to the Education of the Handicapped Act, Education for All Handicapped Children Act) have been implemented. These mandates for protection against discrimination and service provision exist with broad community and political support, providing a level of class protection not previously encountered. Legal standards have been upheld consistently by judicial authorities.
The medical care of individuals with global developmental delay and intellectual disability has been included in the thrust of broad medical principles. A common morality has emerged, framed by a generally accepted understanding of socially approved norms of human conduct [Shevell, 2009a]. Within this framework, ethical behavior is driven by mutually recognized duties and obligations. Within the medical sphere of human interactions, these duties and obligations focus on issues of autonomy, beneficence, non-maleficence, and justice [Bernat, 2002].
The absence of the capacity for competence (defined as “the ability to understand the context of the decision, the choices available, the likely outcomes of the varying choices, and to rationally process this information to make a decision”), together with minority age (typically less than 18 years), renders the pediatric patient with global developmental delay or intellectual disability doubly vulnerable with respect to ethical issues [Bernat, 2002]. The cornerstone of ethical modern medical practice is the respect for individual autonomy reflected in the primacy accorded to informed consent in all aspects of medical decision-making [Faden et al., 1986]. For those unable ever to provide informed consent, a “best interest” model for decision-making must be implemented that mandates careful selection of responsible proxy decision-makers and consideration of the risks and benefits for intervention from the unique perspective of the affected individual [Shevell, 1998]. Consensus exists that cognitive disability alone should never be the only reason to withhold or withdraw care. Developmentally appropriate models of assent that respect the cognitive capacity of the intellectually disabled offer an alternative to enhance our ethical efforts and are increasingly a feature of clinical practice. A determined effort must be made not to use the challenges faced in ethical practice with this population to abandon efforts through research to improve all aspects of care and outcome [Shevell, 2002].
Justice concerns itself with the fair distribution within society of what ultimately are limited resources in a broader socioeconomic context [Outka, 1974]. An appropriate standard would be objectively applied, equally valuing individual worth. Within the health-care sector, access frequently requires effective advocacy, which may favor better publicly organized and financially enabled disease advocacy groups.
Diagnosis
Definitions and Testing
Accurate diagnosis of global developmental delay or intellectual disability is an essential precondition to proper management and service provision. Accurate diagnosis serves many functions, including understanding the specific associated medical and psychiatric complications, eligibility for service and support provision and its specific attributes, family counseling, and legal recognition of disability [Shevell, 2009b].
The diagnosis of intellectual disability, as presently defined, requires demonstration of significant limitations in intellectual functioning and adaptive behavior [AAMR, 2002]. Intelligence, conceptualized as general mental capabilities, is represented “objectively” by an IQ score obtained through proper application of an appropriate assessment measure [Hernstein and Murray, 1994]. Adaptive behavior refers to skills (i.e., conceptual, social, and practical) that a person learns in order to function within the context of the expectations and challenges of everyday life. Limitations in these skills affect the ability to respond to changes and demands encountered, affecting performance in daily life and participation in available opportunities. Multiple standardized, age-appropriate measures have been normed and validated on normal populations to assess adaptive behavior skills [Spreat, 1999]. For intellectual function and adaptive behavior, a significant limitation thought sufficient to trigger possible inclusion under the rubric of intellectual disability is performance at least 2 standard deviations below the mean for an appropriate test [AAMR, 2002]. Some of the standardized measures for the evaluation of intellectual, neurodevelopmental, and behavioral testing are summarized in Table 43-1, and a qualitative description of IQ and index scores on Wechsler tests that categorize intelligence levels is provided in Table 43-2.
Table 43-1 Measures for Evaluation of Intellectual, Neurodevelopmental, and Behavioral Progress
| Test Name, Age Range Of Subjects, And Test Publication Data | Test Description | Administration and Scoring Information |
|---|---|---|
| DEVELOPMENTAL TESTS | ||
| Bayley Scales of Infant Development, Second Edition (Bayley II) | ||
| 16 days to 3 years 6 months 15 days Nancy Bayley, The Psychological Corporation, 1993, www.psychcorp.com (Bayley III, 2005) |
Standardized assessment of cognitive, motor, and behavioral development for children aged 1–42 months Mental Scale has 178 items, Psychomotor Scale has 111 items, and Behavior Rating Scale has 30 items Mental Scale yields a normalized standard score called the Mental Development Index, evaluating a variety of abilities, including sensory/perceptual acuities, learning, and problem-solving; verbal communication; abstract thinking; and mathematical concept formation Motor Scale assesses skills of degree of body control, large muscle coordination, finer manipulatory skills of the hands and fingers, dynamic movement, dynamic praxis, postural imitation, and stereognosis Behavior Rating Scale assesses the child’s relevant test-taking behaviors and measures the following factors: attention/arousal, orientation/ engagement, emotional regulation, and motor quality |
Yields: Mental Development Index (MDI) and Psychomotor Development Index (PDI); and five behavior factors: Attention/Arousal, Orientation/Engagement, Emotional Regulation, Motor Quality, and Total Behavior Rating MDI and PDI means = 100, SD = 15 Behavior ratings as percentile ranks: Administration time: younger, about 30 minutes; older, about 60 minutes |
Glen P Aylward, The Psychological Corporation, 1995, www.psychcorp.com
Four domains: Neurological Functions/Intactness (N), Receptive Functions (R), Expressive Functions (E), and Cognitive Processes (C)
The infant is administered 11 or 13 items and scored as optimal or non-optimal performance
Total scores can range from 0 to 11 or 13, with a higher score indicating better functioning
This screen can be used to prompt a more comprehensive evaluation
Chart shows age-appropriate cut-off values for high, moderate, or low risk for developmental delay or neurologic impairments
Administration time: 10 minutes
WK Frankenburg and JB Dodds et al., Denver Developmental Materials, 1992, www.denverii.com
It is not intended as a diagnostic tool and may be more appropriate as a developmental chart or inventory rather than as a screener
Four domains: Personal-Social, Language, Fine Motor-Adaptive, and Gross Motor; 125 items
David Wechsler, The Psychological Corporation, 2003 (Spanish version, 2005), www.psychcorp.com
It is the most commonly used intelligence test for school-age children
Ten core subtests and five optional subtests
Subtest means = 10, SD = 3
Index and IQ means = 100, SD = 15
Administration time: 65–80 minutes for core subtests
David Wechsler, The Psychological Corporation, 2002, www.psychcorp.com
Subtest means = 10, SD = 3
IQ, PSQ, GLC means = 100, SD = 15
Administration times:
Gale H Roid, Riverside Publishing, 2003, www.riversidepublishing.com
Two domains: Verbal (V) and Nonverbal (NV)
Each has five factors of cognitive ability: Fluid Reasoning (FR), Knowledge (KN), Quantitative Reasoning (QR), Visual-Spatial Processing (VS), and Working Memory (WM)
Use of Change-Sensitive Score (CSS) makes it possible to compare changes in an individual’s scores over time if retested
Change-Sensitive Scores (CSS) are criterion-referenced (rather than norm-referenced) and therefore reference absolute levels of ability from the 2-year-old level to the adult level
Subtest score means = 10, SD = 3
Index and IQ means = 100, SD = 15
Change-Sensitive Scores range = 376-592, from 2-year-old level to adult (most fall in the range of 420–530); 500 is an average score for an individual 10 years 0 months old Administration time: 50–60 minutes for all ten subtests
Colin D. Elliott, The Psychological Corporation, 1990 (DAS-II, 2006), www.psychcorp.com
For language-impaired and non-English-speaking children, the examiner can obtain Special Nonverbal Composite
Academic Achievement: Basic Number Skills, Spelling, and Word Reading scores Subtest T-score means = 50, SD = 10
General Conceptual Ability (GCA), Cluster, and Academic Achievement means = 100, SD = 15
Administration time:
Gale H Roid and Lucy J Miller, Stoelting Company, 1997, www.stoelting.com
Two domains: Visualization and Reasoning (VR) for measuring IQ, and Attention and Memory (AM)
There are 10 subtests in each domain
Includes four social-emotional rating scales (by Examiner, Parent, Self-Rating, and Teacher)
Nonverbal tasks, especially suited for children and adolescents who are nonverbal, do not speak English, or use English as Second Language (ESL); speech-hearing-motor impaired; attention-deficit hyperactivity disorder (ADHD), autistic; delayed; disadvantaged; or traumatic brain injury (TBI)
Five composite scores: Fluid Reasoning, Fundamental Visualization, Spatial Visualization, Attention, and Memory; and Brief IQ (based on four VR subtests) and Full Scale IQ scores
Growth-scale scores for subtests and IQ in a metric that can track growth over time if retested
Subtest score means = 10, SD = 3
Composite and IQ score means = 100, SD = 15
Administration time: VR, about 40 minutes; AM, about 35 minutes
Donald D Hammill, Nils A Pearson, and J Lee Wiederholt, The Psychological Corporation, 1997, www.psychcorp.com
Analogical Reasoning, Categorical Classifications, and Sequential Reasoning in two different contexts: pictures of familiar objects and geometric designs; and solving problems
Six subtests: Pictorial Analogies, Pictorial Categories, Pictorial Sequences, Geometric Analogies, Geometric Categories, Geometric Sequences
Subtest means = 10, SD = 3
Composite and overall means = 100, SD = 15
Administration time: 1 hour
Marit Korkman, Ursula Kirk, and Sally Kemp, The Psychological Corporation, 1997, www.psychcorp.com (NEPSY-II, 2007)
Subtests can be used in various combinations, according to the needs of the child
Five domains: Attention and Executive Functions, Language, Sensorimotor Functions, Visuospatial Processing, and Memory and Learning
Subtest Scaled Score means = 10, SD = 3
Core Domain Score means = 100, SD = 15
Percentile ranks:
Administration times:
Dean C Delis, Edith Kaplan, and Joel H Kramer, The Psychological Corporation, 2001, www.psychcorp.com
Nine stand-alone tests
Scaled score means = 10, SD = 3
Administration time: 90 minutes for all nine tests
3 to 21 years 11 months (teachers)
Sara S Sparrow, Domenic V Cicchetti, and David A Balla, American Guidance Service (AGS), 2004, www.agsnet.com
Four domains: Communication, Daily Living Skills, Socialization, and Motor Skills, with 11 subdomains
The Survey Interview, Expanded Interview, and Parent/Caregiver Rating Forms contain an optional maladaptive behavior domain for pinpointing undesirable behaviors that may interfere with adaptive functioning
Domain and Adaptive Behavior Composite score means = 100, SD = 15
Administration Time: Survey Interview and Parent/Caregiver Rating Forms, 20–60 minutes
Harold Ireton, Behavior Science Systems, 1994, www.childdevelopmentreview.com
Five areas: Social, Self-Help, Gross Motor, Fine Motor, and Language
The child’s level of development in each area is determined by asking the parent, “What’s your baby doing?” and by observing the infant. The questionnaire can be completed by the parent or done as an interview
The child’s level of development in each area is compared with the child’s actual age
Administration time: 10 minutes
Harold Ireton and Edward J. Thwing, Behavior Science Systems, 2005, www.childdevelopmentreview.com
Nine scales: Social, Self-Help, Gross Motor, Fine Motor, Expressive Language, Language Comprehension, Letters, Numbers, and an overall General Development
On an inventory of the child’s observed developmental skills, parents answer “yes” (present or already acquired) or “no” (not yet)
There are 270 statements about the child’s behavior and 30 problem items describing various symptoms and behavior problems
The age level assigned to each behavior item was defined as the age at which at least 75% of parents answered “yes” to that statement
Administration time: 30–50 minutes
(Courtesy of Rita J Jeremy, Ph.D., Developmental Psychologist, Department of Pediatrics, University of California, San Francisco, CA.)
Table 43-2 Qualitative Description of IQ and Index Scores on Wechsler Tests
| Score | Classification | Percentage Included in Theoretical Normal Curve |
|---|---|---|
| 130 and above | Very superior | 2.2 |
| 120–129 | Superior | 6.7 |
| 110–119 | High average | 16.1 |
| 90–109 | Average | 50.0 |
| 80–89 | Low average | 16.1 |
| 70–79 | Borderline | 6.7 |
| 69 and below | Extremely low | 2.2 |
Widely used measures for intelligence testing for children (5 to 16 years old) include the Wechsler Intelligence Scale for Children III (WISC-III) [Wechsler, 1991], the Cognitive Assessment System (CAS) [Naglieri and Das, 1997], and the Kaufman Assessment Battery for Children (K-ABC) [Kaufman and Kaufman, 1983]. For adults, the Wechsler Adult Intelligence Scale III (WAIS-III) is widely used [Wechsler, 1997]. The Stanford–Binet IV has applicability for children and adults [Thorndike et al., 1986]. The Wechsler Preschool and Primary Scale of Intelligence – Revised (WPPSI-R) [Wechsler, 1967] has been standardized for children as young as 3 years and has recognized limitations in interpretability [Sattler, 1982]. The standard for a systematic measurement of adaptive behavior from birth to adulthood has been the Vineland Adaptive Behavior Scale (VABS) [Sparrow et al., 1984], although acceptable alternatives exist, including the AAMR Adaptive Behavior Scale (ABS) [Lembert et al., 1993; Nihira et al., 1983], the Scales of Independent Behavior – Revised (SIB-R) [Bruininks et al., 1996], the Comprehensive Test of Adaptive Behavior – Revised (CTAB-R) [Adams, 1999], and the Adaptive Behavior Assessment System (ABAS) [Harrison and Oakland, 2000].
For an accurate diagnosis of global developmental delay, careful attention must be paid to its underlying concept and operational definition [Shevell, 1998, 2002, 2003, 2006]. A significant delay (i.e., greater than 2 standard deviations below the mean) needs to be demonstrated in two or more developmental domains exclusive of the qualitative impairment in language and social interaction that has been used to define an autistic spectrum disorder. Practically, delay in the child with global developmental delay is typically evident across all developmental domains. The practitioner should be aware of the general psychometric properties of testing instruments, their intended domains of evaluation and potential sources of error, and inherent standard error of measurement.
Standardized tests for assessment of infant, toddler, or preschool child development exist and include the Bayley Scales of Infant Development (2nd edition) [Bayley, 1993], the Battelle Developmental Inventory [Newborg et al., 1984], and the Denver Developmental Screening Test (2nd edition) [Frankenburg et al., 1992]. Frequently, rather than using a broad developmental instrument, domain-specific measures are individually applied and an overall assessment arrived at. Examples of domain-specific developmental measures include the following groups:
Often, diagnosis may be initially formulated or, less frequently, entirely based on clinical judgment [AAMR, 2002]. To be valid, such clinical judgment must be based on extensive direct experience with individuals with global developmental delay or intellectual disability. Typically, clinical judgment may be necessary because of various social, cultural, and linguistic contexts or because of unavailability, inappropriateness, or delay in the administration of standardized assessment procedures. Validation of clinical judgment is increased by direct observation, reliance on reliable third-party informants, input from an interdisciplinary team skilled in multidimensional standardized assessments, and repeated observations of an individual over time.
Advances in Diagnostic Testing
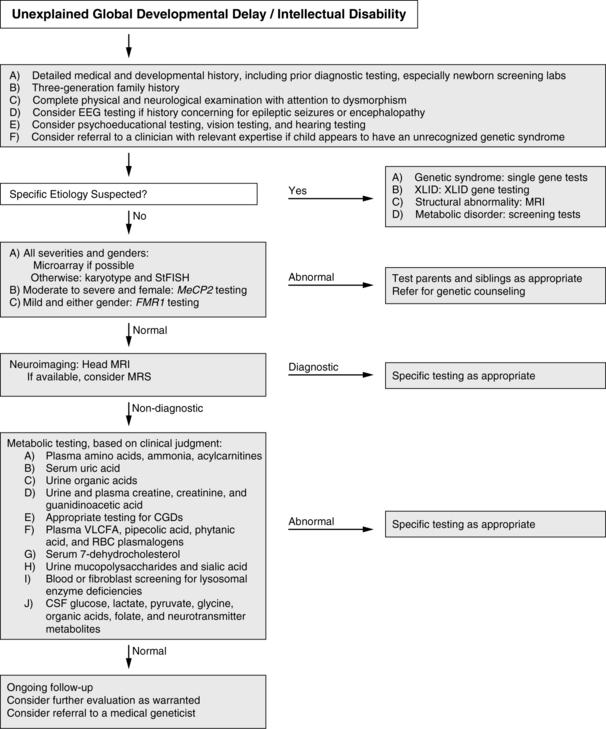
How does the clinician approach the diagnostic evaluation of a child with global developmental delay or intellectual disability? The AAN practice parameter and evidence report for global developmental delay [Shevell et al., 2003; Michelson et al., 2011] provide a framework for such an evaluation (Figure 43-1). The recommendations incorporate a combination of broad screening tools and disease-specific testing based on a heightened pretest probability, given identifying clinical features. Correctly applied, each has a reasonable pretest probability (>1 percent) of diagnosis. The current algorithm begins with a complete clinical assessment. For those patients in whom a specific diagnosis is considered, targeted testing is recommended, whether this be an MRI for an asymmetric physical examination or methylation testing for Angelman’s syndrome. For the remaining patients a step-wise approach is recommended that begins with array comparative genomic hybridization (CGH), followed by chromosomal karyotype if that is negative. This recommendation is an outgrowth of many recent studies showing the enhanced utility of array CGH to detect clinically relevant chromosomal changes, and is also recommended by a consortium of clinical genetics laboratories and clinicians [Miller et al., 2010; Michelson et al., 2011]. Fragile X is recommended to evaluate mildly affected children of both genders and MeCP2 the gene that causes Rett syndrome testing is considered important in severely affected females. If these tests are unrevealing, the algorithm recommends conducting head magnetic resonance imaging (MRI; with single proton spectroscopy, where that is available). If this approach is not diagnostic, comprehensive metabolic testing is then recommended (see Figure 43-1). This then diverges based on an a priori consideration of a specific diagnosis. As all these diagnostic tools advance (a discussion of some recent advances are expanded upon below), these algorithms will continue to change to reflect these technical improvements. Regardless, clinical judgment will still be tantamount.
Genomic Microarray
Genomic microarray technology is an evolving platform that arrays a representation of the human chromosome on a glass slide and hybridizes fluorescently labeled control and patient DNA to detect copy number changes in the genome [Bejjani et al., 2005]. The first-generation chips had approximately 3000 elements spaced approximately every 1.0 Mb [Pinkel et al., 1998]. Newer-generation chips have been developed that completely cover the genome (i.e., tiling arrays) using more than 100,000-oligonucleotide spots [Ishkanian et al., 2004]. All of these platforms aim to identify interstitial copy number changes or copy number variants. Initially, this approach has been used very successfully to identify chromosomal regions (and genes) involved in cancer progression. Studies done thus far suggest that this approach will likely find many additional regions that are implicated in neurodevelopmental disabilities, even in the setting of prior normal high-resolution karyotyping [Harada et al., 2004; Shaw-Smith et al., 2004; Engels et al., 2007; Shevell et al., 2008]. Many studies in autism, mental retardation, and cohorts with multiple congenital anomalies (who also have neurodevelopmental disabilities) show that a few loci occur repetitively and at a much higher frequency in affected individuals than in controls [Berkel et al., 2010; Koolen et al., 2006; Sharp et al., 2008]. This type of large-scale analysis can provide clinicians with the necessary information to advise families about the significance of these genetic findings.
However, one challenge that arises from this whole-genome analysis is distinguishing normal variation from disease-causing changes, particularly in cases in which the genetic variation has never been reported previously in the literature, or has been reported but its incidence in cases and controls is not well documented. The first step is to establish whether a documented copy number change is de novo or familial; this is essential with respect to determining the possible pathogenicity of such changes [Speicher and Carter, 2005], although there is an increasing number of reported cases now in which inherited loci have been shown to correlate with disease presentation [Girirajan et al., 2010; Kumar et al., 2008; Shinawi et al., 2009; Weiss et al., 2008]. As we continue to make strides in genetics that move away from simple mendelian disorders, this concept of “partial penetrance” will grow in clinical relevance. The establishment of comprehensive, computerized, publicly available genotype–phenotype databases will aid in the process of establishing pathogenicity of these less common copy number changes in the future [Speicher and Higgins, 2007].
Advances in Imaging
High-quality MRI has significantly advanced the ability to detect many brain malformations. Certain studies suggest that MRI is useful for detecting abnormalities in up to 50 percent of children with developmental delay. In some cases, such as bifrontal polymicrogyria, lissencephaly, and bilateral periventricular nodular heterotopia, certain genes are known to cause these inherited syndromes [Gaitanis and Walsh, 2004]. For most cases, the genetic or other cause of the malformation has yet to be determined. Proton MR spectroscopy measures the resonance of molecules in the brain. Given the unique resonance frequencies of many molecules, their abundance can be noninvasively measured. This approach has been useful for detecting changes in cerebral lactate in mitochondrial disorders, and for observing the absence of creatine in the three disorders of creatine deficiency [Stromberger et al., 2003], another cause of potentially treatable nonsyndromic mental retardation [Schulze, 2003]. This technique also has been useful for the detection of abnormalities in succinic semialdehyde dehydrogenase deficiency [Ethofer et al., 2004], and for those changes that precede the changes on conventional T2-weighted MRI for X-linked adrenoleukodystrophy patients [Eichler et al., 2002].
Another mode of MRI that holds promise for refinement of diagnostics is diffusion tensor imaging (DTI). Predicated on the assumption that water molecules most likely diffuse along the trajectory of axons within the white matter, DTI can measure this water diffusion and, by employing certain algorithms, can approximate the position and direction of the major white matter tracts in the cerebrum. This approach should refine the imaging results for mental retardation or autism in which no changes can be identified by conventional MRI [Barnea-Goraly et al., 2004].
Proteomics in Disease Analysis
Practical and theoretical concerns limit exclusive reliance on genetic information to understand the causes of mental retardation (even including only those that are genetically based). Proteomics potentially offers a rapid means to screen individuals for many specific diseases within a general category, particularly when the proteins are expressed in the blood or other tissue that is readily available for analysis. For example, the true prevalence of mitochondrial dysfunction as a cause of mental retardation is unknown, but some studies suggest that mitochondrial abnormalities can be detected in a high percentage of patients with developmental delay, seizures, and hypotonia [Fillano et al., 2002; Marin-Garcia et al., 1999]. Mitochondrial genetics are too complex to be approached directly, because most patients are thought to have autosomal-recessive mitochondrial disease, and hundreds of genes are necessary for proper mitochondrial function. In cases of maternal inheritance, this problem can be addressed by full sequencing of the mitochondrial genome in muscle samples of affected individuals. Given that the mitochondrial genome contains only 16,500 base pairs (bp), this is a feasible goal in the short term. Investigators have begun to undertake whole mitochondrial proteomics approaches (i.e., combining immunocapture with mass spectrometry peptide fingerprinting) to determine the quantitative values for the specific polypeptides in these multiprotein complexes [Lib et al., 2003]. Missing subunits can be readily identified, and the post-translational modifications (e.g., phosphorylation) can be monitored [Schulenberg et al., 2004].
Etiology
General Considerations
The known specific causes of mental retardation are too numerous to be listed here. The term mental retardation returns more than 1200 entries in the Online Mendelian Inheritance in Man site alone, and this catalogs only identifiable genetic causes. Mental retardation usually is classified by prenatal, perinatal, postnatal, and undetermined causes (Table 43-3). In most studies, the largest category of known primary causes is genetic or chromosomal [Leonard and Wen, 2002]. Many of the environmental causes, such as low birth weight and prematurity, are measured as risk factors and do not rise to the level of actual biomedical causes. Just as the prevalence varies, the percentage of mental retardation resulting from each group of causes varies by location and by definitions. In a California epidemiologic study of mental retardation, 75 percent of the known cases of mental retardation were due to chromosomal aberrations, whereas fewer than 3 percent were caused by any endocrine or metabolic abnormality [Croen et al., 2001]. In a Taiwanese study, 82 percent of all the chromosomal causes of mental retardation were a result of Down syndrome, but these data were collected before the clinical use of subtelomeric fluorescent in situ hybridization (FISH) probes [Hou et al., 1998]. In some regions of the world, cretinism from severe iodine deficiency occurs in up to 2–10 percent of the population of isolated communities [Delange et al., 2001]. Mild mental impairment from iodine deficiency occurs five times more frequently than cretinism, making iodine deficiency the most common preventable cause of mental retardation. Treatment during the first trimester has a significant effect on the frequency of cretinism [Cao et al., 1994]. In regions of mainland China with iodine deficiency, children score on average 10 IQ points less than cohorts in iodine-rich regions. This link between iodine deficiency and mental retardation also has a strong genetic component, because specific alleles for the deiodinase type II gene and the ApoE4 allele confer a significantly greater risk of mental retardation when the pregnant mother is iodine-deficient [Guo et al., 2004; Wang et al., 2000]. Despite the tremendous wealth of information about the causes of mental retardation, the cause remains unknown in most individuals. Genetic and epidemiologic approaches likely will continue to make progress toward unraveling and treating these currently unelucidated causes.
| Categories | Causes |
|---|---|
| Prenatal | Genetic |
Genetic Causes
Fragile X Syndrome
The fragile X syndrome, caused by inactivation of the FMR1 gene, has an estimated prevalence of 1 in 3000 males and is one of the most common causes of mental retardation [Crawford et al., 2001]. Expansion of the trinucleotide sequence CGG to more than 200 copies results in CpG methylation and inactivation of the FMR1 gene. Patients have narrow and elongated faces, large protruding ears, macro-orchidism, and joint hyperlaxity. Up to 20 percent have epilepsy, and most have complex partial seizures [Willemsen et al., 2004]. Carrier females and males with somatic mutations have various levels of intellectual impairment; studies demonstrate that the amount of the residual FMR protein detected in hair roots correlates well with IQ [Willemsen et al., 2003]. Research on the FMR protein has shown that it participates in the transport of mRNA and the regulation of protein translation in neuronal dendrites [Zalfa et al., 2003]. This function perhaps explains the paucity of dendrites seen in autopsy series of these patients [Greenough et al., 2001]. Although previous studies suggested that premutation male carriers (55–200 repeats) were asymptomatic, later work from Hagerman and colleagues [1988] documented a progressive neurologic disorder, the fragile X-associated tremor/ataxia syndrome (FXTAS). After the age of 50, male patients present with intention tremor and cerebellar ataxia, and they may have cognitive decline [Jacquemont et al., 2004]. This syndrome, which is unique to these premutation males, may result from an increase in expanded repeat FMR1 mRNA that is consistent with a toxic “gain of function” mechanism [Hagerman and Hagerman, 2004]. Because the level of FMR protein correlates with disease severity, a number of investigators have tried to identify demethylating or hyperacetylating drugs as a means to activate FMR1 transcription [Chiurazzi et al., 1998, 1999]. Although these methods do not offer treatment for patients, this approach is generating new agents that can be tested for their ability to activate FMR1 without associated toxicity.
Other X-Linked Mental Retardation Conditions
The increased prevalence of mental retardation in males and the relative ease of detecting the familial transmission of X-chromosome mutations have facilitated the effort to uncover the genes on the X chromosome that cause mental retardation. Many excellent reviews have detailed the syndromic and nonsyndromic forms of X-linked mental retardation [Chelly and Mandel, 2001; Gecz, 2004]. Since 1996, more than 15 genes have been identified as causes of nonsyndromic mental retardation without other associated organ involvement or significant dysmorphology (Table 43-4).
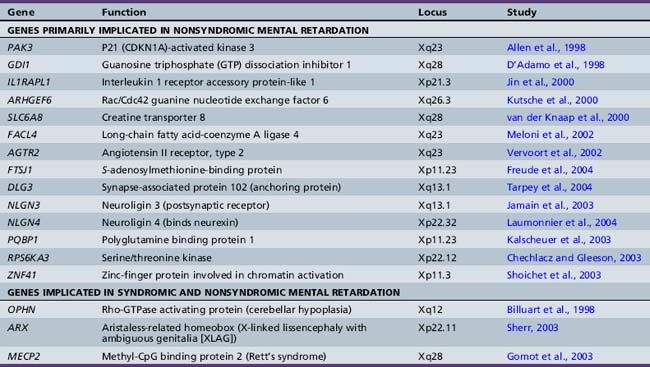
An initial assumption had been that these genes would work directly at the level of the synapse. In certain cases, in vitro and animal model data confirm this idea. For example, the protein neuroligin on the postsynaptic membrane, and its binding partner neurexin on the presynaptic side, have been shown to promote synapse formation in vitro [Dean et al., 2003; Scheiffele et al., 2000]. Some reports have shown that two X-linked neuroligin genes (NLGN3 and NLGN4) are implicated in mental retardation and autism [Jamain et al., 2003; Laumonnier et al., 2004]. Similarly, multiple genes that participate in signaling through the small G protein RHO are mutated in many cases of X-linked mental retardation: GDI1, PAK3, OPHN1, and ARHGEF6 [Ramakers, 2002]. In a mouse gene deletion of oligophrenin (OPHN1), there were clear deficits in the formation of spines along dendrites, the critical subcellular structure on which central nervous system excitatory synapses form [Govek et al., 2004]. However, involvement in synapse formation does not preclude possibly important roles more generally in organ and body development. For example, further analysis showed that mutations in oligophrenin are also found in patients with epilepsy, profound cerebellar hypoplasia, and cerebral cortical atrophy [Bergmann et al., 2003; Philip et al., 2003]. The genes ARX and MECP2 can cause syndromic mental retardation (as in patients with X-linked lissencephaly with ambiguous genitalia [XLAG] and Rett’s syndrome) and nonsyndromic mental retardation, depending on the severity of the mutation [Gomot et al., 2003; Sherr, 2003]. These observations demonstrate the complexity of understanding how genetic alteration causes mental retardation, what form it takes, and how genotype may correlate with phenotype.
Nonsyndromic Autosomal Mental Retardation
The inheritance pattern of X-linked diseases accelerates the discovery of genes. However, because nonsyndromic mental retardation is not clinically unique, it is difficult to link families together by common features to find causative genes. In the only autosomal-recessive mental retardation gene identified, a single 4-bp deletion was found in the synapse-localized serine protease neurotrypsin [Molinari et al., 2002]. Although this same 4-bp deletion was identified in another proband with mental retardation, no confirmatory mutations were identified. Investigators have used an inclusive approach, sequencing candidate genes in many dozens of mental retardation families that link to the X chromosome. Looking for additional autosomal-recessive mental retardation genes by this approach will increase the complexity more than 20-fold.
Evaluation of the Patient
History
The assessment of a child with suspected global developmental delay or intellectual disability begins with a detailed history, and much time and effort should be directed to this evaluation [Shevell, 1998, 2002, 2006, 2009c]. Fundamental to this process is obtaining a careful family history, searching for other affected family members with similar or other potentially relevant neurologic impairments. The possible presence of early postnatal deaths should be questioned. Parental or intrafamilial consanguinity needs to be ascertained, along with the ethnic heritage of the parents. Clues to consanguinity (which may not be willingly acknowledged by parents) include origin from the same village or sharing of the same last name within the family tree. The mother’s prior gestational history and her pregnancy with the affected child must be carefully probed, seeking evidence for adverse events or toxin exposures and clues to intrauterine difficulties. Timing and mode of delivery should be determined, and the reason for any forceps application or cesarean section must be identified. Birth weight, Apgar scores, head circumference measurement at birth, and duration of postnatal hospital stay are important objective markers of newborn health status. Difficulties in the newborn nursery, especially pertaining to possible clues for a neonatal encephalopathy (e.g., seizures, feeding difficulties prompting gavage), must be searched for and carefully documented. Box 43-1 lists commonly accepted risk factors for later developmental disability that can be apparent on maternal, gestational, or neonatal history-taking.
Box 43-1 Factors that Increase the Risk of Neonatal Mortality and Mental Retardation


(Data from Denhoff E. Cerebral palsy, the preschool years. Springfield, IL: Charles C Thomas, 1967; from Pearson PH. The physician’s role in diagnosis and management of the mentally retarded. Pediatr Clin North Am 1968;15:835.)
The domain of first concern is the age at which this concern became manifested to the parents; it should be documented. The timing of developmental milestones across developmental domains should be determined for the affected child. Observant parents can usually and reliably recall motor skills in the first year of life, such as when their child rolled over, sat, crawled, cruised, and took the first steps. Parental recall of meaningful speech and language milestones is often not as certain [Majnemer and Rosenblatt, 1994]. The possibility of any loss or regression of previously acquired developmental skills should be specifically questioned, as this would mandate a different and more urgent approach to etiologic evaluation and follow-up. Current skill level in the various developmental domains and the degree of independence in activities of daily living must be ascertained. For the school-age child, important points include scholastic history, with special reference to actual school and classroom placement, and identification of the provision of any supplemental educational resources.
Physical Examination
Within the clinical office setting, several test instruments exist for use as objective screening assessments of development during the first years of life (i.e., Denver Developmental Screening Test [Frankenburg and Dodds, 1967], the Denver II [Frankenburg et al., 1992], and the CAT/CLAMS [Capute and Accardo, 1991], which focuses on language- and non-language-based reasoning abilities). These may be supplemented or complemented by the use of parent-based questionnaires (e.g., Child Developmental Inventory [Ireton, 1992], and Ages and Stages Questionnaire [Bricker, 1999]) that provide an aspect of objective developmental screening. Observed signs and symptoms and their association with various diagnostic entities that can result in global developmental delay or intellectual disability are summarized in Boxes 43-2 to 43-10. Definitive diagnosis of these associated entities often requires specific laboratory testing.
Box 43-2 Eye Abnormalities


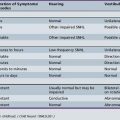
Box 43-5 Hearing Abnormalities


Box 43-10 Other Abnormalities
Anterior horn cell disease (includes electrodiagnostic evidence of normal nerve conduction time in the presence of muscular denervation potentials)


Laboratory Testing
Laboratory testing is directed at establishing the possible cause of the individual’s delay or intellectual disability [Schaefer and Bodensteiner, 1992]. This testing may be confirmatory, directed at a suggested cause from the history and/or physical examination, or it may be undertaken on a screening basis, directed at finding a previously unsuspected cause. Some data exist on the diagnostic yield of various laboratory investigations of community-derived samples of children with global developmental delay or mental retardation, with older series restricted to more severe variants of institutionalized individuals [Hagberg and Kyllerman, 1983; Hunter et al., 1980; McLaren and Bryson, 1987], and more recent series derived from ambulatory community settings [Srour et al., 2006]. Controversy exists regarding the extent to which diagnostic investigations should be undertaken for a developmentally delayed or cognitively disabled child. However, consensus does exist that an all-inclusive “shotgun” approach is not warranted or feasible from medical, personal, or economic viewpoints [Shevell et al., 2003]. Laboratory testing is undertaken in the spirit that, although yield may be lower than in other clinical situations, the potential value of a definitive etiologic diagnosis from individual and familial perspectives may be substantial. Technologic advances, especially in the domains of genetic testing and neuroimaging, have resulted in improved diagnostic yield and precision. This is reflected in improved etiologic yield in community samples studied retrospectively and prospectively [Majnemer and Shevell, 1995; Shevell et al., 2000; Srour et al., 2006]. Aiding the formulation of a rational approach to laboratory investigations in this clinical population is the AAN practice parameter evidence report (see Figure 43-1) [Shevell et al., 2003; Michelson et al., 2011], the American College of Medical Genetics consensus [Curry et al., 1997], and the AAP technical document [Moeschler and Shevell, 2006] on this topic.
Routine metabolic testing for an extensive list of potential inborn errors of metabolism cannot presently be justified [Carson and Neill, 1962; Henderson et al., 1981; Reinecke et al., 1983]. However, diagnostic vigilance needs to be maintained for these disorders, given the implication for treatment, prognosis, and recurrent risk [Papavasiliou et al., 2000]. Clinical situations suggesting a possible inborn error of metabolism that should prompt careful and detailed metabolic testing include family history, parental consanguinity, documented developmental regression, suggestive dysmorphology, involvement of nonectodermal organ systems, and possible white matter involvement observed on imaging or peripheral electrophysiologic studies.
For the globally or intellectually delayed child without an apparent cause after history and physical examination, current recommendations would include beginning with microarray testing, followed, if clinically indicated, by a karyotype and high-resolution MRI [Miller et al., 2010; Michelson et al., 2011]. As mentioned above, if specific causes are considered, they should be tested for early on in the diagnostic evaluation. For instance, if the affected child is a male and his maternal uncles are similarly affected, there is good evidence to suggest that sequencing X chromosome mental retardation genes would be a high-yield diagnostic approach [Michelson et al., 2011].
Neuroimaging has greatly enhanced the clinical practice of neurology and improved etiologic yields. Although largely of little additional value in early reported studies [Lingham et al., 1982; Moeschler et al., 1981], later studies have indeed emphasized the added value of neuroimaging in detecting cerebral dysgenesis, acquired injury of various causes, or disturbances in white matter maturation [Bouhadiba et al., 2000; VanBogaert et al., 1992]. The superiority of MRI over computed tomography (CT) has made it the imaging modality of choice contingent on local availability and individual sedation restrictions.
Similar to metabolic studies, electrophysiologic studies, such as electroencephalography, should be undertaken only in the situation of a suspected coexisting paroxysmal disorder or evidence of language regression or behavioral abnormalities suggestive of an epilepsy syndrome, such as Landau–Kleffner or electrical status epilepticus during slow-wave sleep [Sheth, 1998]. Visual- and auditory-evoked potentials are of use in assessing the integrity of the visual and auditory systems in the young, uncooperative child.
The presence of certain clinical features predicts the success or failure of the etiologic search. Documented neonatal difficulties, microcephaly, focal neurologic findings, and positive family history all suggest an enhanced possibility of success. Coexisting autistic features have been found to be a negative predictor of detecting an underlying cause [Shevell et al., 2000; Srour et al., 2006].
Consultation and Follow-up
Concerns about the developmental and functional patterns highlighted at the time of specialty evaluation should prompt referrals to other health professionals with different but complementary expertise, permitting a multidisciplinary, comprehensive evaluation of the affected child [Shevell, 2002, 2006, 2009c]. These professionals, in addition to documenting various deficits objectively in a standardized way, usually assume responsibility for implementing goal-directed therapeutic interventions, and serve as conduits to appropriate community-based, long-term rehabilitation and educational resources. These health professionals represent occupational therapy (e.g., fine motor, activities of daily living, feeding), physical therapy (i.e., gross motor), speech and language pathology (i.e., language), and psychology (e.g., cognition, social, behavioral). Specific care needs, such as tube feeding, respite care, or financial difficulties, may prompt nursing or social service intervention. Vision and hearing screening is important because of the high frequency of potentially correctable primary sensory impairments in this population, and results should prompt ophthalmologic and audiologic evaluations [Kwok et al., 1996; Menacker, 1993; Warburg, 1994]. Concerns regarding a possible genetic cause or specific behavioral issues may require the expertise and intervention of genetic or psychiatric services.
Medical Management of Coexisting Conditions
Psychiatric Disorders in the Mentally Retarded
The prevalence of coexistent Axis I psychiatric conditions and challenging, disruptive, or injurious (towards self or others) behaviors is higher among patients with intellectual disability than among people in the general population [Marco, 2009]. These conditions are generally under-recognized and undertreated. Under-recognition is the byproduct of several factors:
Diagnosis of challenging behavior and mental illness in those with developmental delays or intellectual disabilities requires modification in recognition that both takes into account developmental and cognitive abilities, and focuses on behavioral domains and standards for inferential diagnosis in the absence of objective markers. Multiple screening tools have been developed to assist in recognition. These include the Developmental Behavioral Checklist for Pediatrics (DBC-P) [Clarke et al., 2003], the Children’s Depression Inventory [Meins, 1993], and the Psychiatric Assessment Schedule for Adults with Developmental Disability Checklist (PAS-ADD checklist) [Mohr et al., 2005], amongst other instruments.
In one population-based study, 40 percent of mental retardation patients had a Diagnostic and Statistical Manual of Mental Disorders (DSM-IV) diagnosis, one-fourth of this group had more than one diagnosis, and these disorders caused severe impairment in everyday functioning for more than one-half of patients. Of these mental retardation patients, 22 percent had anxiety disorders, 5 percent had mood disorders, and 25 percent had disruptive disorders. The most common diagnoses were specific phobias (17.5 percent), attention-deficit hyperactivity disorder (14.8 percent), and oppositional defiant disorder (13.9 percent). However, of all the children with a DSM-IV diagnosis, only 27 percent were receiving specific help for any of these problems [Dekker and Koot, 2003]. For those whose diagnoses caused severe impairment, only 41 percent received professional help. As is the case for the diagnosis of mental illness in children generally, eliciting a careful history from the parents or caretakers is essential to the accurate diagnosis and to the evaluation of treatment efficacy. Based on reasonable clinical inference, some modifications in specific diagnostic criteria are occasionally necessary.
Treatment of Psychiatric Disorders
Several studies support medical therapies for the treatment of psychiatric conditions in the intellectually disabled population. The newer neuroleptics (especially risperidone) have been effective for behavioral disorders, particularly aggression and impulsivity, in patients with mental retardation or autism, or both [Snyder et al., 2002]. However, side effects can include intolerable weight gain, particularly at higher doses [Cohen et al., 2001]. Other atypical antipsychotic agents, such as quetiapine and aripiprazole, have less effect on weight and may be effective for aggressive and aberrant behavior [Sajatovic, 2003; Stigler et al., 2004]. Clonidine has been effective for hyperactivity, hypersensitivity, and the less aggressive impulsive behaviors [Agarwal et al., 2001]. Methylphenidate is now available in varied long-acting formulations and has been effective for many patients with mental retardation [Aman et al., 2003; Pearson et al., 2004a, 2004b]; it is the most common class of medications used for fragile X syndrome males, in whom up to 67 percent showed a positive response in a controlled study [Hagerman et al., 1988]. Anxiety and compulsive and perseverative behaviors and mood symptoms can be managed with selective serotonin reuptake inhibitors (SSRIs). In particular, SSRIs have been shown to be helpful for the treatment of social anxiety and withdrawal [Santosh and Baird, 1999]. Chapter 49 reviews the psychopharmacologic agents that can be used for the treatment of some of these disorders.
Treatment of Epilepsy
Approximately 15–20 percent of intellectually disabled individuals also have epilepsy, a rate 10 times higher than the general population [Kelly et al., 2004; Mayville and Matson, 2004]. Many of these patients have intractable epilepsy. When treating seizures in these individuals, the same guidelines apply as for patients without intellectual disability: minimize side effects (i.e., sedation, altered mentation, behavioral changes) while eliminating or substantially reducing the number of seizures. Since many individuals with intellectual limitations will be unable to express their response to the medication verbally, the physician must be alert to other means of assessing side effects and seizure reduction. In the case of young children living at home, their parents or other primary caretakers can provide reasonable estimates of these parameters. In the case of multiple caretakers or of patients residing in assisted living environments, special care must be taken to ensure the accuracy and reliability of reporting between different observers. Clarification of which seizure types to record and maintaining a seizure diary before alteration of the medication regimen can help achieve this goal. In some instances, use of standardized instruments, such as the Glasgow epilepsy outcome measure, may be helpful [Espie et al., 2001]. Drug treatment should be guided primarily by the type of epilepsy. Patients with Lennox–Gastaut syndrome have responded well to lamotrigine, infantile spasms to vigabatrin, and nonsyndromic generalized seizures to valproic acid. In general, avoidance of barbiturates and benzodiazepines is preferable because of the propensity for sedation and impairment of cognition [Coulter, 1997]. Polypharmacy, with its cumulative and synergistic potential for side effects, should also be avoided whenever possible [Marco, 2009]. Intractable epilepsies may respond to the ketogenic diet, placement of a vagal nerve stimulator, or, especially if lesional in origin, surgical resection. Callosotomy is still rarely utilized for intractable atonic seizures.
Sleep Disorders
The most common sleep problem in the general population and among the developmentally impaired is insufficient sleep [Didde and Sigafoos, 2001]. Preadolescents sleep 9–10 hours per night, with sleep latencies of 20 minutes or more. Seizures during sleep are a frequent cause of sleep disruption. For generalized seizure disorders, one study determined that 34 percent of seizures occurred upon arousal to the waking state, 45 percent occurred only in sleep, and 21 percent occurred both diurnally and nocturnally [Marco, 2009]. Specific sleep epilepsy disorders, such as electrical status epilepticus of sleep, Landau–Kleffner syndrome, and nocturnal frontal lobe epilepsy, should be considered [Lancioni et al., 1999]. Many patients with intellectual disability also have hypotonia or extensive central nervous system abnormalities, or both, and central and obstructive sleep apnea is a common complication. Obstruction can occur at the pharyngeal level because of corticobulbar and bulbar weakness, or because of the inability of the muscles of respiration to overcome the normal change in airway resistance produced by progression from waking to non-rapid eye movement sleep to rapid eye movement sleep. This problem is exacerbated by the loss of muscle tone seen in rapid eye movement sleep. Since the circadian clock within the suprachiasmatic nucleus is chronobiologic and requires light input from the retina to entrain a rhythm, patients who are blind or who have had profound brain injury may suffer from disorganized sleep architecture.
In patients with a sleep problem, obtaining an accurate sleep history that includes sleep hygiene, nighttime awakenings, and daytime behavior is essential. If this approach is not informative, a formal sleep study with polysomnography may be indicated [Harvey and Kennedy, 2002]. Melatonin has been particularly useful for this population and has been effective for patients with global developmental delay and sleep disturbance in general [Coppola et al., 2004].
Vision and Hearing Impairment
Individuals with global developmental delay and intellectual disability are at an elevated risk for sensory impairment involving either hearing, vision, or both [MMWR, 1997]. These impairments may be congenital or acquired in origin, but often remains undiagnosed and untreated. This is indeed unfortunate, as early identification and treatment of these sensory impairments can improve overall outcome for these individuals [Yoshinaga-Itano, 2003]. Vigilant and early hearing and vision screening in this population should be a standard of clinical practice.
Feeding and Nutritional Disorders
Difficulties with nutritional intake, gut motility, and growth (i.e., failure to thrive) are common in individuals with global developmental delay and intellectual disability [Canadian Pediatric Society, 1994]. Oral motor incoordination and apraxia are frequent consequences of the underlying primary neurologic dysfunction. Altered esophageal sphincter tone, combined with oral motor incoordination, predisposes to gastro-esophageal reflux and frequent aspirations. Furthermore, the gastro-esophageal reflux may lead to pain and irritability that provoke additional management challenges. Swallowing studies employing video fluoroscopy are an indispensable tool for assessing upper gastrointestinal function. Both medical and behavioral interventions are available to improve feeding competency and comfort, but at times, the placement of a percutaneous feeding tube may be necessary if recurrent pain, aspiration, and malnutrition that limits functional status persists [Marco, 2009]. Enteric feeding may substantially improve quality of life for the affected individual and appreciably diminish the burdens of care upon the family [Sanders et al., 1990].
Pharmacologic Treatment of Cognitive Impairment
Pharmacologic treatment of cognitive impairment is a prominent goal of clinicians and researchers. There are tantalizing studies in animal models and some preliminary data from studies of patients. Unfortunately, there is not yet solid evidence supporting a role for pharmacologic enhancement of cognition in the mental retardation population as a whole. The animal model for the Rubinstein–Taybi syndrome exemplifies the potential of this approach [Bourtchouladze et al., 2003]. Rubinstein–Taybi syndrome, which manifests with mental retardation and characteristic physical findings (i.e., broad thumbs and toes, short stature, and craniofacial anomalies), occurs in approximately 1 in 125,000 births and is caused by mutations in the cAMP-responsive element binding protein (CREB)-binding protein (CBP). Many patients with Rubinstein–Taybi syndrome are heterozygous for de novo CBP truncation mutations or deletions involving the gene, implying that the phenotype is expressed in an autosomal-dominant fashion. Analogously, CBP heterozygous knockout (+/−) mice share features with Rubinstein–Taybi syndrome patients, whereas the CBP homozygous knockout (−/−) pattern in mice is embryonically lethal. In one study, treatment with inhibitors of phosphodiesterase-4 resulted in an improvement in cognitive performance for the CBP +/− mice [Bourtchouladze et al., 2003]. A similar improvement in cognition was demonstrated in the mouse model of neurofibromatosis type 1. Neurofibromatosis type 1 results from an autosomal-dominant heterozygous mutation in neurofibromin [Costa and Silva, 2002]. Additional experimental data suggest that overactivation of the small GTP protein RAS by the mutant neurofibromin is the cause of cognitive dysfunction. Inhibition of RAS through pharmacologic manipulation (i.e., farnesyl transferase inhibitors) or by genetic modification increases cognitive performance in neurofibromatosis type 1 mice and improves physiologic correlates for learning [Costa et al., 2002], such as long-term potentiation.
Successful changes in cognitive function in patients have been much more limited, and most reports are uncontrolled and anecdotal. One open-label study with these methodologic limitations suggested that donepezil (a cholinesterase inhibitor) improved language performance in patients with Down syndrome [Heller et al., 2003].
Outcome and Prognosis
The vast majority of developmentally delayed or intellectually disabled children presently remain at home with the best caregivers possible – a loving, supportive, and nurturing family. This represents a dramatic historical shift from the previous standard of segregated institutionalization that persisted until the latter half of the twentieth century. However, the child’s family should not be taken for granted, nor should the burden placed on the family be underestimated. Supportive counseling is often necessary to help family members accept the diagnosis, plan realistically for the future, and deal with any feelings of anger, guilt, loneliness, or even shame that are often regrettably but understandably experienced. The emotional states experienced by parents of a delayed child resemble those experienced during bereavement [Batshaw, 1993; Kübler-Ross, 1969]. Parental stress is often elevated over the long term and parents will frequently experience fatigue, isolation, and financial hardship [Majnemer and Limperopoulos, 2009]. Support to lessen the family burden, especially in the context of severe delay or intellectual disability, such as short-term respite care, frequently needs to be sought and made available to ensure family health and well-being. Access to available governmental supplemental financial resources should be facilitated. Siblings of the delayed child are often overlooked and are prone to more frequent peer and behavior problems [Bagenholm and Gillberg, 1991].
Longitudinal studies suggest continued intellectual development in those with mild or moderate delay [Eyman and Widaman, 1987; Hogg et al., 1988], and the absence of such improvement in those with severe or profound intellectual disability. Functional attainment for the child with severe neurodevelopmental disability by age 6 typically represents the functional attainment with respect to ambulation, feeding, toileting, and self-hygiene for the life span [Strauss et al., 1997]. Greater developmental progress has occurred in those provided home or foster care rather than institutional or residential care [Eyman and Widaman, 1987]. In the United States, federal law mandates with public funds the provision of early educational and rehabilitation services to the preschool child with a developmental disability and appropriate educational services to the school-age child, regardless of the severity of the mental impairment. The long-term benefits of early intervention remain speculative in the absence of definitive longitudinal studies, but a beneficial trend for sustained intervention in a programmatic approach with targeted screening and intervention at key points in the life span is suggested [Majnemer, 1998].
Studies have consistently demonstrated that early childhood developmental delays are correlated with later academic difficulties during the school years [Shapiro et al., 1990]. Persisting functional and developmental disabilities have also been demonstrated in longitudinal prospective studies, as well as suggesting a prognostic validity to the diagnostic label of global developmental delay [Shevell et al., 2005]. The degree of initial delay predicted functional attainment (i.e., what a child does do) to a greater extent than developmental attainment (what a child can do). The capacity of a family potentially to advocate on behalf of their child, as reflected in a higher socioeconomic status, resulted in better functional attainment, suggesting potential modifiability that should enable broader rehabilitation services provision across the spectrum of individuals and families with developmental disabilities.
The transition to adult life can be challenging for the intellectually disabled individual and involved family members. Transition concerns issues related to living situations (independent or assisted), limited access to entitlements, opportunities for participation, sexuality, and employment (sheltered or supported) [Batshaw, 1993], and the locus of medical care provision (i.e., pediatric to adult). Deterioration in ability or adaptive function has not been manifested in cohorts followed through this transitional phase [Eyman and Widaman, 1987]. Severe childhood intellectual disability can predict later adult dependence and disability, but investigators are only now evaluating the transition to adulthood of populations raised in an era after segregation to residential institutions [Clarke and Clarke, 1988]. Family involvement in transition planning and an individual’s educational attainment and ability to acquire basic living skills have been key factors in the successful adjustment to adult life [Reiter and Palnizky, 1996]. Individuals with mild to moderate intellectual disability have had higher unemployment rates than the general population and a tendency for placement in segregated (i.e., sheltered) environments [Kraemer and Blacher, 2001]. Periodic, on-going support often has been found to be a necessary precondition for continued employment. Since employment has been linked to a better quality of life and self-esteem, it should be sought for the individual patient or collectively for the class of individuals affected [Kraemer et al., 2003]. Since psychiatric and behavioral disorders occur with increased frequency in intellectually disabled individuals, this may be an added factor to precluding social inclusion and also a challenge to sufficient psychiatric service provision [O’Brien, 2000].
The life expectancy of a child with mild to moderate intellectual disability who is in good general health without evidence of cardiorespiratory disease or severe epilepsy can be considered similar to that of the general pediatric population. Significant mobility limitations (e.g., quadriplegia with inability to roll or sit independently), lack of functional hand use, and feeding dependency (especially the placement of a gastrostomy tube) have been associated with limitations in life expectancy. Other important variables include the nature of associated disabilities and the severity of coexisting medical conditions, together with the availability and accessibility of quality medical care. However, a temporal trend is evident, with life expectancy improving overall for those with intellectual disability, even for the most severely affected individuals [Eyman et al., 1990; Piloplys et al., 1998; Strauss et al., 1997; Strauss et al, 2008].
References
 The complete list of references for this chapter is available online at www.expertconsult.com.
Adams G.L. Comprehensive test of adaptive behavior – revisited. Seattle: Educational Achievement Systems; 1999.
Agarwal V., Sitholey P., Kumar S., et al. Double-blind, placebo-controlled trial of clonidine in hyperactive children with mental retardation. Ment Retard. 2001;39:259.
Allen K.M., Gleeson J.G., Bagrodia S., et al. PAK3 mutation in nonsyndromic X-linked mental retardation. Nat Genet. 1998;20:25.
Aman M.G., Buican B., Arnold L.E. Methylphenidate treatment in children with borderline IQ and mental retardation: Analysis of three aggregated studies. J Child Adolesc Psychopharmacol. 2003;13:29.
American Association on Mental Retardation (AAMR). Mental retardation: Definition, classification and systems of support. Washington, DC: American Association on Mental Retardation; 2002.
American Psychiatric Association. Diagnostic and statistical manual of mental disorders, ed 4. Washington, DC: American Psychiatric Association; 1994.
Bagenholm A., Gillberg C. Psychosocial effects on siblings of children with autism and mental retardation: A population based study. J Ment Defic Res. 1991;35:291.
Barnea-Goraly N., Kwon H., Menon V., et al. White matter structure in autism: Preliminary evidence from diffusion tensor imaging. Biol Psychiatry. 2004;55:323.
Batshaw M.L. Mental retardation. Pediatr Clin North Am. 1993;40:507.
Batshaw M.L., Shapiro B.K. Mental retardation. In: Batshaw M.L., editor. Children with disabilities. ed 4. Baltimore: Paul H. Brookes Publishing; 1997:335.
Bayley N. Bayley scales of infant development, ed 2. New York: Psychological Corp; 1993.
Bayley Scales of Infant and Toddler Development, third edition (Bayley III) http://www.pearsonassessments.com/HAIWEB/Cultures/en-us/Productdetail.htm
Bejjani B.A., Saleki R., Ballif B.C., et al. Use of targeted array-based CGH for the clinical diagnosis of chromosomal imbalance: Is less more? AM J Med Genet A. 2005;134A:259.
Bergmann C., Zerres K., Senderek J., et al. Oligophrenin 1 (OPHN1) gene mutation causes syndromic X-linked mental retardation with epilepsy, rostral ventricular enlargement and cerebellar hypoplasia. Brain. 2003;126:1537.
Berkel S., Marshall C.R., Weiss B., et al. Mutations in the shank2 synaptic scaffolding gene in autism spectrum disorder and mental retardation. Nat Genet. 2010;42:489-491.
Bernat J.L. Informed consent in pediatric neurology. Semin Pediatr Neurol. 2002;9:10.
Billuart P., Bienvenu T., Ronce N., et al. Oligophrenin 1 encodes a rho-GAP protein involved in X-linked mental retardation. Pathol Biol (Paris). 1998;46:678.
Bouhadiba Z., Dacher J., Monroe M., et al. MRI of the brain in the evaluation of children with developmental delay. J Radiol. 2000;81:870-873.
Bourtchouladze R., Lidge R., Catapano R., et al. A mouse model of Rubinstein-Taybi syndrome: Defective long-term memory is ameliorated by inhibitors of phosphodiesterase 4. Proc Natl Acad Sci USA. 2003;100:10518.
Boyle C.A., Yeargin-Allsopp M., Doernberg N.S., et al. Prevalence of selected developmental disabilities in children 3–10 years of age: The Metropolitan Atlanta Developmental Disabilities Surveillance Program, 1991. MMWR CDC Surveill Summ. 1996;45:1.
Bricker D. Ages and stages questionnaire: A parent-completed child monitoring system. Baltimore: Paul H. Brookes Publishing; 1999.
Bruininks R.H. Bruininks-Oseretsky test of motor proficiency. Circle Pines, MN: American Guidance Service; 1978.
Bruininks R.H., Woodcock R.W., Weatherman R.F., et al. Scales of independent behavior – revisited. Itasca, IL: Riverside; 1996.
Canadian Pediatric Soceity. Undernutrition in children with a neurodevelopmenal disability. Nutrition Committee, Canadian Peditric Society. Can Med Assoc J. 1994;151:753.
Cao X.Y., Jiang X.M., Dou Z.H., et al. Timing of vulnerability of the brain to iodine deficiency in endemic cretinism. N Engl J Med. 1994;331:1739.
Capute A.J., Accardo P.J. Language assessment in developmental disabilities. In: Capute A.J., Accardo P.J., editors. Developmental disabilities in infancy and childhood. Baltimore: Paul H. Brooks Publishing, 1991.
Carroll J.B. Psychometrics, intelligence and public perception. Intelligence. 1997;24:25.
Carson N.A.J., Neill D.W. Metabolic abnormalities detected in a survey of mentally backward individuals in northern Ireland. Arch Dis Child. 1962;37:505.
Centers for Disease Control and Prevention (CDC). Economic costs associated with mental retardation, cerebral palsy, hearing loss, and vision impairment – United States, 2003. MMWR Morb Mortal Wkly Rep. 2004;53:57.
Chechlacz M., Gleeson J.G. Is mental retardation a defect of synapse structure and function? Pediatr Neurol. 2003;29:11.
Chelly J., Mandel J.L. Monogenic causes of X-linked mental retardation. Nat Rev Genet. 2001;2:669.
Chiurazzi P., Pomponi M.G., Pietrobono R., et al. Synergistic effect of histone hyperacetylation and DNA demethylation in the reactivation of the FMR1 gene. Hum Mol Genet. 1999;8:2317.
Chiurazzi P., Pomponi M.G., Willemsen R., et al. In vitro reactivation of the FMR1 gene involved in fragile X syndrome. Hum Mol Genet. 1998;7:109.
Clarke A., Clarke A. The adult outcome of early behavioral abnormalities. Int J Behav Dev. 1988;11:3.
Clarke A.R., Tonge B.J., Einfeld S.L., et al. Assessment of change with the Developmental Behavior Checklist. J Intellect Disabil Res. 2003;47:210.
Cohen S., Glazewski R., Khan S., et al. Weight gain with risperidone among patients with mental retardation: Effect of calorie restriction. J Clin Psychiatry. 2001;62:114.
Coppola G., Iervolino G., Mastrosimone M., et al. Melatonin in wake-sleep disorders in children, adolescents and young adults with mental retardation with or without epilepsy: A double-blind, cross-over, placebo-controlled trial. Brain Dev. 2004;26:373.
Costa R.M., Federov N.B., Kogan J.H., et al. Mechanism for the learning deficits in a mouse model of neurofibromatosis type 1. Nature. 2002;415:526.
Costa R.M., Silva A.J. Molecular and cellular mechanisms underlying the cognitive deficits associated with neurofibromatosis 1. J Child Neurol. 2002;17:622.
Coulter D.L. Comprehensive management of epilepsy in persons with mental retardation. Epilepsia. 1997;38(Suppl 4):S24.
Crawford D.C., Acuna J.M., Sherman S.L. FMR1 and the fragile X syndrome: Human genome epidemiology review. Genet Med. 2001;3:359.
Croen L.A., Grether J.K., Selvin S. The epidemiology of mental retardation of unknown cause. Pediatrics. 2001;107:E86.
Curry C.J., Stevenson R.E., Aughton D., et al. Evaluation of mental retardation: Recommendations of a consensus conference: American College of Medical Genetics. Am J Med Genet. 1997;72:468.
D’Adamo P., Menegon A., Lo Nigro C., et al. Mutations in GDI1 are responsible for X-linked non-specific mental retardation. Nat Genet. 1998;19:134.
Darrah J., Hodge M., Magill-Evans J., et al. Stability of serial assessments of motor and communication abilities in typically developing infants-implications for screening. Early Hum Deve. 2003;72:97.
Dean C., Scholl F.G., Choih J., et al. Neurexin mediates the assembly of presynaptic terminals. Nat Neurosci. 2003;6:708.
Dekaban A. Leprechaunism – a syndrome. Trans Am Neurol Assoc. 1965;90:60-62.
Dekker M.C., Koot H.M. DSM-IV disorders in children with borderline to moderate intellectual disability. I. Prevalence and impact. J Am Acad Child Adolesc Psychiatry. 2003;42:915.
Delange F., de Benoist B., Pretell E., et al. Iodine deficiency in the world: Where do we stand at the turn of the century? Thyroid. 2001;11:437.
Didde R., Sigafoos J. A review of the nature and treatment of sleep disorders in individuals with developmental disabilities. Res Dev Disabil. 2001;22:255.
Dunn L.M., Dunn L.M. Peabody picture vocabulary test, ed 3. Circle Pines, MN: American Guidance Service; 1997.
Eichler F.S., Barker P.B., Cox C., et al. Proton MR spectroscopic imaging predicts lesion progression on MRI in X-linked adrenoleukodystrophy. Neurology. 2002;58:901.
Elliot C.D. The Psychological corporation. 2006.www.psychcorp.com. (DAS-II)
Engels H., Brockschmidt A., Hoischen A., et al. DNA microarray analysis identifies candidate regions and genes in unexplained mental retardation. Neurol. 2007;68:743-750.
Erhart M., Ravens-Sieberer U., Dickinson H.O., et al. Rasch Measurement Properties of the KIDSCREEN Quality of Life Instrument in Children with Cerebral Palsy and Differential Item Functioning between Children with and without Cerebral Palsy, Value in Health. 2009:782-792. 12
Espie C.A., Watkins J., Duncan R., et al. Development and validation of the Glasgow Epilepsy Outcome Scale (GEOS): A new instrument for measuring concerns about epilepsy in people with mental retardation. Epilepsia. 2001;42:1043.
Ethofer T., Seeger U., Klose U., et al. Proton MR spectroscopy in succinic semialdehyde dehydrogenase deficiency. Neurology. 2004;62:1016.
Eyman R.K., Grossman H.J., Chaney R.H., et al. The life expectancy of profoundly handicapped people with mental retardation. N Engl J Med. 1990;323:584.
Eyman R.K., Widaman K.F. Life-span development of institutionalized and community-based retarded persons, revisited. Am J Mental Defic. 1987;91:559-569.
Faden R., Beauchamp T.H., King N.M. A history and theory of informed consent. New York: Oxford University Press; 1986.
Fenichel G.M.. Psychomotor retardation and regression. Clinical pediatric neurology: A signs and symptoms approach. ed 4. Philadelphia: WB Saunders; 2001.
Fillano J.J., Goldenthal M.J., Rhodes C.H., et al. Mitochondrial dysfunction in patients with hypotonia, epilepsy, autism, and developmental delay: HEADD syndrome. J Child Neurol. 2002;17:435.
Folio R., Dubose R.F. Peabody developmental motor scales (revised experimental edition). Nashville, TN: Peabody College for Teachers; 1974.
Fougeyrollas P., Noreau L. Life Habits Measure-shortened version (LIFE-H 3.1). Lac St-Charles, Quebec, Canada: RIPPH; 2002.
Frankenburg W.K., Dodds J.B. Denver developmental screening test. J Pediatr. 1967;71:181.
Frankenburg W.K., Dodds J.B., Archer P., et al. The Denver II: A major revision and restandardization of the Denver developmental screening test. Pediatrics. 1992;89:91.
Freude K., Hoffmann K., Jensen L.R., et al. Mutations in the FTSJ1 gene coding for a novel S-adenosylmethionine-binding protein cause nonsyndromic X-linked mental retardation. Am J Hum Genet. 2004;75:305.
Gaitanis J.N., Walsh C.A. Genetics of disorders of cortical development. Neuroimaging Clin N Am. 2004;14:219.
Gardner H. Multiple intelligences. The theory in practice. New York: Basic Books; 1993.
Gardner M.F. Expressive one-word picture vocabulary test, rev. ed. Novato, CA: Academic Therapy Publication; 1990.
Gecz J. The molecular basis of intellectual disability: Novel genes with naturally occurring mutations causing altered gene expression in the brain. Front Biosci. 2004;9:1.
Girirajan S., Rosenfeld J.A., Cooper G.M., et al. A recurrent 16p12.1 microdeletion supports a two-hit model for severe developmental delay. Nat Genet. 2010;42:203-209.
Gomot M., Gendrot C., Verloes A., et al. MECP2 gene mutations in non-syndromic X-linked mental retardation: Phenotype-genotype correlation. Am J Med Genet. 2003;123A:129.
Gottfredson L.S. Mainstream science on intelligence. Intelligence. 1997;24:13.
Gould S.J. The mismeasure of man. New York: WW Norton; 1981.
Govek E.E., Newey S.E., Akerman C.J., et al. The X-linked mental retardation protein oligophrenin-1 is required for dendritic spine morphogenesis. Nat Neurosci. 2004;7:364.
Greenough W.T., Klintsova A.Y., Irwin S.A., et al. Synaptic regulation of protein synthesis and the fragile X protein. Proc Natl Acad Sci USA. 2001;98:7101.
Grossman H.J. A manual of terminology and classification in mental retardation. Washington, DC: American Association on Mental Deficiency; 1973.
Guo T.W., Zhang F.C., Yang M.S., et al. Positive association of the DIO2 (deiodinase type 2) gene with mental retardation in the iodine-deficient areas of China. J Med Genet. 2004;41:585.
Hagberg B., Kyllerman M. Epidemiology of mental retardation – a Swedish survey. Brain Dev. 1983;5:441.
Hagerman P.J., Hagerman R.J. Fragile X-associated tremor/ataxia syndrome (FXTAS). Ment Retard Dev Disabil Res Rev. 2004;10:25.
Hagerman R.J., Murphy M.A., Wittenberger M.D. A controlled trial of stimulant medication in children with the fragile X syndrome. Am J Med Genet. 1988;30:377.
Haley S.M., Coster W.J., Ludlow L.H., et al. Pediatric evaluation of disability inventory (PEDI). Boston: New England Medical Center Hospitals; 1992.
Harada N., Hatchwell E., Okamoto N., et al. Subtelomere specific microarray based comparative genomic hybridisation: A rapid detection system for cryptic rearrangements in idiopathic mental retardation. J Med Genet. 2004;41:130.
Harrison P.L., Oakland T. ABAS: Adaptive behavior assessment system. San Antonio, TX: Psychological Corp; 2000.
Harvey M.T., Kennedy C.H. Polysomnographic phenotypes in developmental disabilities. Int J Dev Neurosci. 2002;20:443.
Heber R., editor. A manual on terminology and classification in mental retardation. Washington, DC: American Association on Mental Retardation, 1961.
Heller J.H., Spiridigliozzi G.A., Sullivan J.A., et al. Donepezil for the treatment of language deficits in adults with Down syndrome: A preliminary 24-week open trial. Am J Med Genet. 2003;116A:111.
Henderson H.E., Goodman R., Schram J., et al. A biochemical screening for inherited metabolic disorders in the mentally retarded. S Afr Med J. 1981;60:731-733.
Hernstein R.J., Murray C. The bell curve. Intelligence and class structure in American life. New York: Free Press; 1994.
Hogg J., Moss S., Cooke D. Changes in intelligence and adaptive behavior. In: Hogg J., Moss S., Cooke D., editors. Ageing and Mental Handicap. London: Croom Helm; 1988:126.
Hou J.W., Wang T.R., Chuang S.M. An epidemiological and aetiological study of children with intellectual disability in Taiwan. J Intellect Disabil Res. 1998;42:137.
Hunter A.D.W., Evans J.A., Thompson D.R., et al. A study of institutionalized mentally retarded patients in Manitoba. Dev Med Child Neurol. 1980;22:145.
Ireton H. Child development inventory. Minneapolis, MN: Behavior Science Systems; 1992.
Ishkanian A.S., Malloff C.A., Watson S.K., et al. A tiling resolution DNA microarray with complete coverage of the human genome. Nat Genet. 2004;36:299.
Jacquemont S., Hagerman R.J., Leehey M.A., et al. Penetrance of the fragile X-associated tremor/ataxia syndrome in a premutation carrier population. JAMA. 2004;291:460.
Jamain S., Quach H., Betancur C., et al. Mutations of the X-linked genes encoding neuroligins NLGN3 and NLGN4 are associated with autism. Nat Genet. 2003;34:27.
Jin H., Gardner R.J., Viswesvaraiah R., et al. Two novel members of the interleukin-1 receptor gene family, one deleted in Xp22.1-Xp21.3 mental retardation. Eur J Hum Genet. 2000;8:87.
Kalscheuer V.M., Freude K., Musante L., et al. Mutations in the polyglutamine binding protein 1 gene cause X-linked mental retardation. Nat Genet. 2003;35:313.
Kaufman A., Kaufman N. Kaufman assessment battery for children. Circle Pines, MN: American Guidance Service; 1983.
Kelly K., Stephen L.J., Brodie M.J. Pharmacological outcomes in people with mental retardation and epilepsy. Epilepsy Behav. 2004;5:67.
Kevles D.J. In the name of eugenics: Genetics and the uses of human heredity. Berkeley, CA: University of California Press; 1985.
King G., Law M., King S., et al. Children’s Assessment of Participation and Enjoyment (CAPE) and Preferences for Activities of Children (PAC). 2004.
Kinsbourne M., Graf W.D. Disorders of mental development. In: Menkes J.H., Sarnat H.B., editors. Child neurology. ed 6. Philadelphia: Lippincott, Williams & Wilkins; 2001:115.
Koolen D.A., Vissers L.E., Pfundt R., et al. A new chromosome 17q21.31 microdeletion syndrome associated with a common inversion polymorphism. Nat Genet. 2006;38:999-1001.
Korkman M., Kirk U., Kemp S. The Psychological Corporation. 2007.www.psychcorp.com. (NEPSY-II)
Kraemer B.R., Blacher J. Transition for young adults with severe mental retardation: School preparation, parent expectation and family involvement. Ment Retard. 2001;39:423.
Kraemer B.R., McIntyre L.L., Blacher J. Quality of life for young adults with mental retardation during transition. Ment Retard. 2003;41:250.
Kübler-Ross E. On death and dying. New York: MacMillan; 1969.
Kumar R.A., Karamohamed S., Sudi J., et al. Recurrent 16p11.2 microdeletions in autism. Hum Mol Genet. 2008;17:628-638.
Kutsche K., Yntema H., Brandt A., et al. Mutations in ARHGEF6, encoding a guanine nucleotide exchange factor for Rho GTPases, in patients with X-linked mental retardation. Nat Genet. 2000;26:247.
Kwok S.K., Ho P.C., Chan A.K., et al. Ocular defects in children and adolescents with severe mental deficiency. J Intellect Disabil Res. 1996;40(Pt 4):330-335.
Lancioni G.E., O’Reilly M.F., Basili G. Review of strategies for treating sleep problems in persons with severe or profound mental retardation or multiple handicaps. Am J Ment Retard. 1999;104:170.
Laumonnier F., Bonnet-Brilhault F., Gomot M., et al. X-linked mental retardation and autism are associated with a mutation in the NLGN4 gene, a member of the neuroligin family. Am J Hum Genet. 2004;74:552.
Lembert N., Nihira K., Leland H. AAMR adaptive behavior scale – school and community. Austin, TX: Pro-Ed; 1993.
Leonard H., Wen X. The epidemiology of mental retardation: Challenges and opportunities in the new millennium. Ment Retard Dev Disabil Res Rev. 2002;8:117.
Lib M., Rodriguez-Mari A., Marusich M.F., et al. Immunocapture and microplate-based activity measurement of mammalian pyruvate dehydrogenase complex. Anal Biochem. 2003;314:121.
Lingham S., Read S., Holland I.M., et al. Value of computerized tomography in children with non-specific mental subnormality. Arch Dis Child. 1982;57:381.
Luckasson R., Coulter D.L., Polloway E.A., et al. Mental retardation: Definition, classification and systems of support, ed 9. Washington, DC: American Association on Mental Retardation; 1992.
MacMillan D.L., Gersham F.M., Superstein G.N. Heightened concerns over the 1992 AAMR definition: Advocacy versus precision. Ment Retard. 1995;100:87.
Majnemer A. Benefits of early intervention for children with developmental disabilities. Sem Pediatr Neurol. 1998;5:62-69.
Majnemer A., Limperopoulos C.. Outcomes in children with developmental disabilities. International Review of Child Neurology Series. London, UK: Wiley-Blackwell [Macketih Press]; 2009;24:470.
Majnemer A., Rosenblatt B. Reliability of parental recall of developmental milestones. Pediatr Neurol. 1994;10:304-308.
Majnemer A., Shevell M.I. Diagnostic yield of the neurologic assessment of the developmentally delayed child. J Pediatr. 1995;127:193-199.
Marco E.J.. Co-morbid conditions in neurodevelopmental disabilities. International Review of Child Neurology Series. London, UK: Wiley-Blackwell [Macketih Press]; 2009:442.
Marin-Garcia J., Ananthakrishnan R., Goldenthal M.J., et al. Skeletal muscle mitochondrial defects in nonspecific neurologic disorders. Pediatr Neurol. 1999;21:538.
Mayville E.A., Matson J.L. Assessment of seizures and related symptomatology in persons with mental retardation. Behav Modif. 2004;28:678.
McLaren J., Bryson S.E. Review of recent epidemiological studies of mental retardation: Prevalence, associated disorders, and etiology. Am J Ment Retard. 1987;92:243-254.
Meerding W.J., Bonneux L., Polder J.J., et al. Demographic and epidemiological determinants of healthcare costs in Netherlands: Cost of illness study. BMJ. 1998;317:111.
Meins W. Assessment of depression in mentally retarded adults: reliability and validity of the Children’s Depression Inventory (CDI). Res Dev Disabil. 1993;14:299.
Meloni I., Muscettola M., Raynaud M., et al. FACL4, encoding fatty acid-coA ligase 4, is mutated in nonspecific X-linked mental retardation. Nat Genet. 2002;30:436.
Menacker S.J. Visual function in children with developmental disabilities. Pediatr Clin North Am. 1993;40:659.
Menenzes M., Coker S. CHARGE and Joubert syndromes: Are they a single disorder? Pediatr Neurol. 1990;6:428.
Michelson D.J., Shevell M.I., Sherr E.H., et al. Report of the Quality Standards Subcommittee of the American Academy of Neurology and the Practice Committee of the Child Neurology Society. Practice Parameter: Evaluation of the Child with Global Developmental Delay/Intellectual Disability Focusing on Genetic and Metabolic Testing (an evidence-based review). Neurology. 2011. in press
Miller D.T., Adam M.P., Aradhya S., et al. Consensus statement: chromosomal microarray is a first-tier clinical diagnostic test for individuals with developmental disabilities or congenital anomalies. Am J Hum Genet. 2010;86:749-764.
MMWR. Serious hearing impairment among children aged 3–10 years: Atalanta, Georgia, 1991-1993. Morb Mortal Wkly Rep. 1997;46:1073.
Moeschler J.B., Bennett F.C., Cromwell L.D. Use of the CT scan in the medical evaluation of the mentally retarded child. J Pediatr. 1981;98:63-65.
Moeschler J.B., Shevell M.I., The AAP Committee on Genetics. Clinical genetic evaluation of the child with mental retardation or developmental delays. Pediatr. 2006;117:2304.
Mohr C., Tonge B.J., Einfeld S.L. The development of a new measure for the assessment of psychopathology in adults with intellectual disabiilty. J Intellect Disabil Res. 2005;49:469.
Molinari F., Rio M., Meskenaite V., et al. Truncating neurotrypsin mutation in autosomal recessive nonsyndromic mental retardation. Science. 2002;298:1779.
Msall M.E., DiGaudio K., Rogers B.T., et al. The functional independence measure for children (weefim). Conceptual basis and pilot use for children with developmental disabilities. Clin Pediatr (Phila). 1994;33:421-430.
Naglieri J.A., Das J.P. Cognitive assessment system. Interpretation handbook. Itasca, IL: Riverside; 1997.
Newborg J., Stock J.R., Wnek L., et al. Battelle developmental inventory: Examiner’s manual. Allen, TX: DIM LIUC Associates; 1984.
Nihira K., Leland H., Lambert N. AAMR adaptive behavior scale – residential and community version, ed 2. Austin, TX: Pro Ed; 1993.
O’Brien G. Learning disability. In: Gillberg C., O’Brien G., editors. Developmental disability and behavior. Clinics in developmental medicine. Cambridge: MacKeith Press, 2000.
Outka G. Social justic and equal access to health care. J Relig Ethics. 1974;2:11.
Papavasiliou A.S., Bazigou H., Paraskevoulakos E., et al. Neurometabolic testing in developmental delay. J Child Neurol. 2000;15:620.
Parent S., Shevell M.I. The “first to perish.” Child euthanasia in the Third Reich. Arch Pediatr Adolesc Med. 1998;152:79-86.
Pearson D.A., Lane D.M., Santos C.W., et al. Effects of methylphenidate treatment in children with mental retardation and ADHD: Individual variation in medication response. J Am Acad Child Adolesc Psychiatry. 2004;43:686.
Pearson D.A., Santos C.W., Casat C.D., et al. Treatment effects of methylphenidate on cognitive functioning in children with mental retardation and ADHD. J Am Acad Child Adolesc Psychiatry. 2004;43:677.
Petersen M.C., Kube D.A., Palmer F.B. Classification of developmental delays. Sem Pediatr Neurol. 1998;5:2-14.
Philip N., Chabrol B., Lossi A.M., et al. Mutations in the oligophrenin-1 gene (OPHN1) cause X linked congenital cerebellar hypoplasia. J Med Genet. 2003;40:441.
Piloplys A.V., Kasnicka I., Lewis S., et al. Survival rates among children with severe neurologic disabilities. South Med J. 1998;91:161-172.
Pinkel D., Segraves R., Sudar D., et al. High resolution analysis of DNA copy number variation using comparative genomic hybridization to microarrays. Nat Genet. 1998;20:207.
Piper M.C., Darrah J. Motor assessment of the developing infant. Philadelphia: WB Saunders; 1994.
Proctor R.N. Racial hygiene: Medicine under the Nazis. Cambridge: Harvard University Press; 1988.
Ramakers G.J. Rho proteins, mental retardation and the cellular basis of cognition. Trends Neurosci. 2002;25:191.
Reinecke C.J., Mienie L.J., Hitzeroth H.W., et al. Screening for inborn errors of metabolism among mentally retarded patients. Outcome of a survey at the Witrand Care and Rehabilitation Center. S Afr Med J. 1983;63:14-16.
Reiter S., Palnizky A. Transition from school to work of students with developmental disabilities and mental retardation: An Israeli perspective. Int J Rehab Res. 1996;19:27.
Reschly D.J. Hearing characteristics of mildly handicapped students: Implications for classification, placement, and programming. In: Wang W., Reynolds M.C., Wahlberg H.J., editors. The handbook of special education: Research and practice. Oxford: Pergamon Press, 1987.
Rubinstein J.H., Taybi H. Broad thumbs and toes and facial abnormalities. A possible mental retardation syndrome. Am J Dis Child. 1963;105:588-608.
Sajatovic M. Treatment for mood and anxiety disorders: quetiapine and aripiprazole. Curr Psychiatry Rep. 2003;5:320.
Sanders K.D., Cox K., Cannon R., et al. Growth response to enteral feeding by children with cerebral palsy. JPEN. 1990;14:23-26.
Santosh P.J., Baird G. Psychopharmacotherapy in children and adults with intellectual disability. Lancet. 1999;354:233.
Sattler J.M. Assessment of children’s intelligence and special abilities, ed 2. Boston: Allyn & Bacon; 1982.
Schaefer G.B., Bodensteiner J.B. Evaluation of the child with idiopathic mental retardation. Pediatr Clin North Am. 1992;39:929.
Scheiffele P., Fan J., Choih J., et al. Neuroligin expressed in nonneuronal cells triggers presynaptic development in contacting axons. Cell. 2000;101:657.
Schulenberg B., Goodman T.N., Aggeler R., et al. Characterization of dynamic and steady-state protein phosphorylation using a fluorescent phosphoprotein gel stain and mass spectrometry. Electrophoresis. 2004;25:2526.
Schulze A. Creatine deficiency syndromes. Mol Cell Biochem. 2003;244:143.
Semel E., Wiig E.H., Secord W.A. Clinical evaluation of language. Fundamentals 4 (SCELF-4). San Antonio, TX: Psychological Corp; 2003.
Shapiro B.K., Palmer F.B., Antell S., et al. Precursors of reading delay: neurodevelopmental milestones. Pediatrics. 1990;85:416.
Sharp A.J., Mefford H.C., Li K., et al. A recurrent 15q13.3 microdeletion syndrome associated with mental retardation and seizures. Nat Genet. 2008;40:322-328.
Shaw-Smith C., Redon R., Rickman L., et al. Microarray based comparative genomic hybridisation (array-CGH) detects submicroscopic chromosomal deletions and duplications in patients with learning disability/mental retardation and dysmorphic features. J Med Genet. 2004;41:241.
Sherr E.H. The ARX story (epilepsy, mental retardation, autism, and cerebral malformations): One gene leads to many phenotypes. Curr Opin Pediatr. 2003;15:567.
Sherr E.H., Ferriero D.M.. Mental retardation. Encyclopedia of the Neurological Sciences. 2003.
Sheth R.D. Electroencephalogram in developmental delay: Specific electroclinical syndromes. Sem Pediatr Neurol. 1998;5:45.
Shevell M., Ashwal S., Donley D., et al. Practice parameter: Evaluation of the child with global developmental delay. Report of the Quality Standards Subcommittee of the American Academy of Neurology and the Practice Committee of the Child Neurology Society. Neurology. 2003;60:367.
Shevell M., Majnemer A., Platt R.W., et al. Developmental and functional outcomes in children with global developmental delay or developmental language impairment. Dev Med Child Neurol. 2005;47:678.
Shevell M.I. Clinical ethics and developmental delay. Sem Pediatr Neurol. 1998;5:70.
Shevell M.I. Diagnostic approach to developmental delay. In Maria B., editor: Current management in child neurology, ed 2, Hamilton, Ontario: BC Decker, 2002.
Shevell M.I.. Office evaluation of the child with developmental delay. Dooley J.M., editor. Common Office Problems in Pediatric Neurology. Semin Pediatr Neurol. 2006;13:256.
Shevell M.I.. Global developmental delay and mental retardation/intellectual disability: Conceputalization evaluation and etiology. Patel D., editor. Developmental Disabilities. Pediatric Clinics of North America; 2008;55:107.
Shevell M.I.. Ethics and common morality, in neurodevelopmental disabilities. Shevell M.I., editor. Neurodevelopmental Disabilities: Clinical & Scientific Foundations, 43. London, UK: Wiley-Blackwell [MacKeith Press], 2009.
Shevell M.I. Present conceptualization of early childhood neurodevelopmental disabilities. J Child Neurol. 2009. (e-pub)
Shevell M.I.. Etiology and evaluation of neurodevelopmental disabilities. Shevell M.I., editor. Neurodevelopmental Disabilities: Clinical & Scientific Foundations, 106. London UK: Wiley-Blackwell [MacKeith Press], 2009.
Shevell M.I., Bejjani B.A., Srour M., et al. Array comparative genomic hybridization in global developmental delay. Am J Med Genet B Neuropsychiatr Genet. 2008;147:1101.
Shevell M.I., Majnemer A., Rosenbaum P., et al. Etiologic yield of subspecialists’ evaluation of young children with global developmental delay. J Pediatr. 2000;136:593.
Shinawi M., Liu P., Kang S.H., et al. Recurrent reciprocal 16p11.2 rearrangements associated with global developmental delay, behavioral problems, dysmorphism, epilepsy, and abnormal head size. J Med Genet. 2009.
Shoichet S.A., Hoffmann K., Menzel C., et al. Mutations in the ZNF41 gene are associated with cognitive deficits: Identification of a new candidate for X-linked mental retardation. Am J Hum Genet. 2003;73:1341.
Simeonsson R.J., Simeonsson N.W. Developmental surveillance and intervention. In: Hoekelman R.A., Adam H.M., Nelson N.M., et al, editors. Primary pediatric care. ed 4. St. Louis: Mosby; 2001:274.
Slossen R.L. Slossen intelligence test (SIT) and oral reading test (SORT) for children and adults. East Aurora, NY: Slossen Educational Publications; 1983.
Snyder R., Turgay A., Aman M., et al. Effects of risperidone on conduct and disruptive behavior disorders in children with subaverage IQs. J Am Acad Child Adolesc Psychiatry. 2002;4:1026.
Sparrow S.S., Balla D.A., Cicchette D.V. Vineland adaptive behavior scales, interview edition. Circle Pines, MN: American Guidance Service; 1984.
Spearman C. The abilities of man: Their nature and measurements. New York: MacMillan; 1927.
Speicher M.R., Carter N.P. The new cytogenetics: Blurring the boundaries with molecular biology. Nat Rev Genet. 2005;6:782.
Speicher M.R., Higgins J.J. Hybridize and personalize: The new age of syndromal mental retardation diagnostics. Neurology. 2007;68:721.
Spreat S. Psychometric standards for adaptive behavior assessment. In: Schalock R.L., editor. Adaptive behavior and its measurement: Implications for the field of mental retardation. Washington, DC: American Association on Mental Retardation, 1999.
Srour M., Mazer B., Shevell M.I. Diagnosing Sotos syndrome in the setting of global developmental delay and macrocephaly. J Child Neurol. 2006;21:287.
Stigler K.A., Potenza M.N., Posey D.J., et al. Weight gain associated with atypical antipsychotic use in children and adolescents: Prevalence, clinical relevance, and management. Paediatr Drugs. 2004;6:33.
Strauss D., Ashwal S., Shavelle R., et al. Prognosis for survival and improvement in function in children with severe developmental disabilities. J Pediatr. 1997;131:712.
Strauss D., Brooks J., Rosenbloom L., et al. Life expectancy in cerebral palsy: An update. Dev Med Child Neurol. 2008;50:487.
Stromberger C., Bodamer O.A., Stockler-Ipsiroglu S. Clinical characteristics and diagnostic clues in inborn errors of creatine metabolism. J Inherit Metab Dis. 2003;26:299.
Tarpey P., Parnau J., Blow M., et al. Mutations in the DLG3 gene cause nonsyndromic X-linked mental retardation. Am J Hum Genet. 2004;75:318.
Thorndike R., Hagen E., Sattler J. Technical manual for Stanford-Binet intelligence scale, ed 4. Chicago: Riverside; 1986.
Tredgold A.F. A textbook of mental deficiency. Baltimore: Wood; 1937.
Van Bogaert R., Baleriaux D., Christophe C., et al. MRI of patients with cerebral palsy and normal CT scan. Neuroradiology. 1992;34:52.
van der Knaap M.S., Verhoeven N.M., Maaswinkel-Mooij P., et al. Mental retardation and behavioral problems as presenting signs of a creatine synthesis defect. Ann Neurol. 2000;47:540.
Varni J.W., Burwinkle T.M., Berrin S.J., et al. The pedsqltm in pediatric cerebral palsy: Reliability, validity, and sensitivity of the Generic Core Scales and Cerebral Play Module. Dev Med Child Neurol. 2006;48:442.
Vervoort V.S., Beachem M.A., Edwards P.S., et al. AGTR2 mutations in X-linked mental retardation. Science. 2002;296:2401.
Wang H.Y., Zhang F.C., Gao J.J., et al. Apolipoprotein E is a genetic risk factor for fetal iodine deficiency disorder in China. Mol Psychiatry. 2000;5:363.
Warburg M. Visual impairment among people with developmental delay. J Intellect Disabil Res. 1994;38:423-432.
Wechsler D. Wechsler preschool and primary scale of intelligence. San Antonio, TX: Psychological Corporation–Harcourt Brace; 1967.
Wechsler D. Wechsler intelligence scale for children, ed 3. San Antonio, TX: Psychological Corporation–Harcourt Brace; 1991.
Wechsler D. Wechsler adult intelligence scale, ed 3. San Antonio, TX: Psychological Corporation–Harcourt Brace; 1997.
Weiss L.A., Shen Y., Korn J.M., et al. Association between microdeletion and microduplication at 16p11.2 and autism. N Engl J Med. 2008;358:667-675.
Willemsen R., Oostra B.A., Bassell G.J., et al. The fragile X syndrome: From molecular genetics to neurobiology. Ment Retard Dev Disabil Res Rev. 2004;10:60.
Willemsen R., Smits A., Severijnen L.A., et al. Predictive testing for cognitive functioning in female carriers of the fragile X syndrome using hair root analysis. J Med Genet. 2003;40:377.
World Health Organization (WHO). International classification of functioning, disability, and health (ICF). Geneva: WHO; 2001.
Yatchmink Y. Developmental delay: Maturational lag to mental retardation. In: Rudolph A.M., Hoffman J.I.E., Rudolph C.D., editors. Rudolph’s pediatrics. ed 20. Stamford, CT: Appleton & Lange; 1996:121.
Yeargin-Allsopp M., Drews C.D., Decoufle P., et al. Mild mental retardation in black and white children in metropolitan Atlanta: A case-control study. Am J Public Health. 1995;85:324.
Yeargin-Allsopp M., Murphy C.C., Cordero J.F., et al. Reported biomedical causes and associated medical conditions for mental retardation among 10-year-old children, metropolitan Atlanta, 1985 to 1987. Dev Med Child Neurol. 1997;39:142.
Yoshinaga-Itano C. Early intervention after universal neonatal hearing screening: impact on outcomes. Ment Retard Dev Disabil Res Rev. 2003;9:252.
Zalfa F., Giorgi M., Primerano B., et al. The fragile X syndrome protein FMRP associates with BC1 RNA and regulates the translation of specific mRNAs at synapses. Cell. 2003;112:317.