Fluorescein Angiography
Basic Principles and Interpretation
Robert N. Johnson, Arthur D. Fu, H. Richard McDonald, J. Michael Jumper, Everett Ai, Emmett T. Cunningham, Jr and Brandon J. Lujan
For nearly 50 years, fundus photography and fluorescein angiography have been valuable in expanding our knowledge of the anatomy, pathology, and pathophysiology of the retina and choroid.1 Initially, fluorescein angiography was used primarily as a laboratory and clinical research tool; only later was it used for the diagnosis of fundus diseases.1–5 An understanding of fluorescein angiography and the ability to interpret fluorescein angiograms are essential to accurately evaluate, diagnose, and treat patients with retinal vascular and macular disease.
Basic principles
Fluorescence
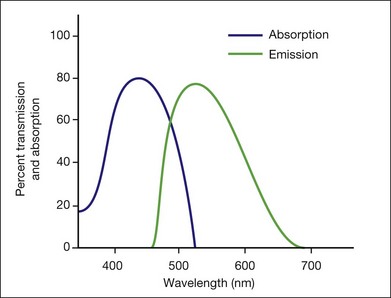
This is a fundamental principle of fluorescein angiography. In the procedure, the patient, whose eyes have been dilated, is seated behind the fundus camera, on which a blue filter has been placed in front of the flash. Fluorescein is then injected intravenously. Eighty percent of the fluorescein becomes bound to protein and is not available for fluorescence, but 20% remains free in the bloodstream and is available for fluorescence. The blue flash of the fundus camera excites the unbound fluorescein within the blood vessels or the fluorescein that has leaked out of the blood vessels. The blue filter shields out (reflects or absorbs) all other light and allows through only the blue excitation light. The blue light then changes those structures in the eye containing fluorescein to green–yellow light at 520–530 nm. In addition, blue light is reflected off the fundus structures that do not contain fluorescein. The blue reflected light and the green–yellow fluorescent light are directed back toward the film of the fundus camera. Just in front of the film a filter is placed that allows the green–yellow fluorescent light through but keeps out the blue reflected light. Therefore the only light that penetrates the filter is true fluorescent light (Fig. 1.1).
Pseudofluorescence
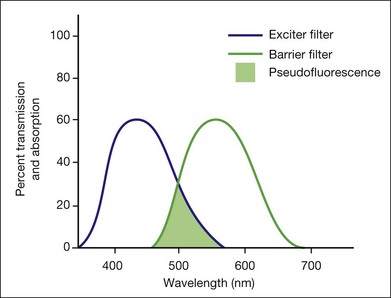
Pseudofluorescence occurs when nonfluorescent light passes through the entire filter system. If green–yellow light penetrates the original blue filter, it will pass through the entire system. If blue light reflected from nonfluorescent fundus structures penetrates the green–yellow filter, pseudofluorescence occurs (Fig. 1.2). Pseudofluorescence (i.e., fake fluorescence) causes nonfluorescent structures to appear fluorescent. It can confuse the physician interpreting the fluorescein angiogram and lead him or her to think that certain fundus structures or materials are fluorescing when they are not. Pseudofluorescence also causes decreased contrast, as well as decreased resolution. Because fluorescein angiography uses black-and-white film, the nonfluorescent or pseudofluorescent light appears as a background illumination. The background illumination from pseudofluorescence is especially heightened if there are white areas of the fundus, such as highly reflective, hard exudates. Pseudofluorescence must be avoided. Therefore the excitation (blue) and barrier (green–yellow) filters should be carefully matched so that the overlap of light between them is minimal.
Equipment
Film-based versus digital fluorescein angiography – historical perspectives
Fluorescein angiography finds its origins in the late 1960s with the publication of an original article describing its use as well as subsequent atlases and textbooks for a medical retinal specialty in its infancy.1,6 The landmark text Atlas of Macular Diseases by Dr J. Donald Gass set a new standard for the use of stereoscopic fluorescein angiography in fundus diagnosis.7
As digital photography has evolved with improved resolution, the convenience of digital-based fluorescein angiography has gained wider acceptance. Though film-based images offer the highest amounts of resolution and 35-mm negatives are often easier to view for stereo, images are relatively difficult to manipulate, and training and effort are required to process and duplicate film. Transmitting or sharing film-based images is also time-consuming compared with digital images (Box 1.1).8
Box 1.1 Equipment and materials needed for angiography
Fundus camera and auxiliary equipment
Matched fluorescein filters (barrier and exciter)
Digital photoprocessing unit (computer-based) and software user interface
5 mL of l0% fluorescein solution
20-gauge,  -inch needle to draw the dye
Camera and auxiliary equipment
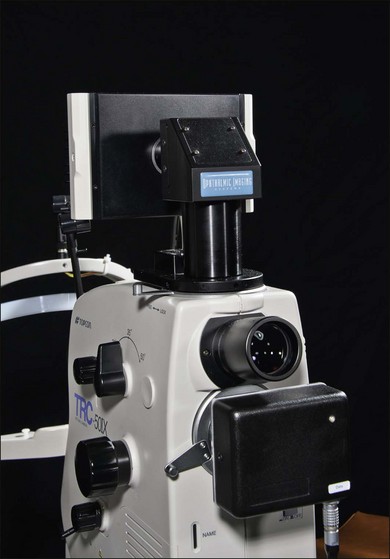
Cameras differ in the degree of fundus area included in the photographs. Fundus cameras may range from 35° to 200° wide-field camera systems such as Optos.9,10 In clinical retinal practice, cameras ranging from 35° to 50° are routinely used (Fig. 1.3). Regardless of range, a camera with the ability to yield high resolutions of the posterior pole is essential for most macular problems, especially when laser treatment is to be done, as with background diabetic retinopathy, branch-vein occlusion, or choroidal neovascularization.
Wide-angle angiography has the benefit of capturing a single image of the retina in high resolution well beyond the equator. The potential for clinical efficiency and sensitivity in detecting neovascularization in the far periphery as well as acquiring an excellent clinical picture of the degree of capillary retinal nonperfusion is an exciting development in fluorescein angiography (Fig. 1.4).
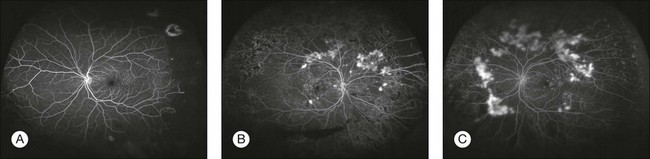
Fig. 1.4 Optos wide-field images. (A) Nonperfusion detected in the left eye with wide-field fluorescein imaging. (Courtesy of Umar Mian, MD. Image taken by Carolina Costa.) (B, C) Wide-field angiography of the right and left eyes of a patient with diabetic retinopathy. Note the multiple areas of leakage corresponding to areas of retinal neovascularization associated with capillary nonperfusion. It is often difficult in certain wide-field images to determine the presence of small neovascular complexes versus leakage from capillary nonperfusion, unless areas are magnified further. (Courtesy of Szilárd Kiss, MD.)
Light sources (viewing bulb and flash strobe)
In film-based cameras, bulbs burn out, but are easily replaced. A supply of each should always be kept on hand (Fig. 1.5).
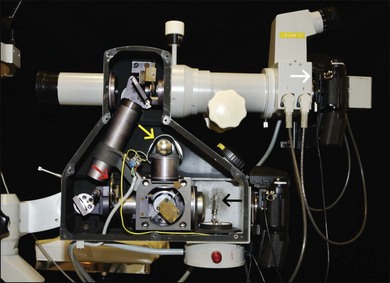
Fig. 1.5 Fundus film camera with side wall removed to view inside parts. Yellow arrow, viewing bulb; black arrow, flash bulb; red arrow, exciter filter wheel. The light from the flash goes through the system in this photograph from right to left. The light is reflected off a mirror and travels upward to another mirror; it is then reflected to the left, into the patient’s eye. From there it is reflected directly to the right of the fluorescein camera back (white arrow).
Fluorescein solution
Various side-effects and complications can occur with fluorescein injection (Box 1.2).11–15
Vomiting occurs infrequently, affecting only 0.3–0.4% of patients.11,13 When it does occur, it usually begins 40–50 seconds after injection. By this time most of the initial-transit photographs of the angiogram will have been taken. A receptacle and tissues should be available in case vomiting does occur. When patients experience nausea or vomiting, they must be reassured that the unpleasant and uncomfortable feeling will subside rapidly. Photographs can be taken after the vomiting episode has passed. A slower, more gradual injection may help to prevent vomiting.
Technique
Aligning camera and photographing
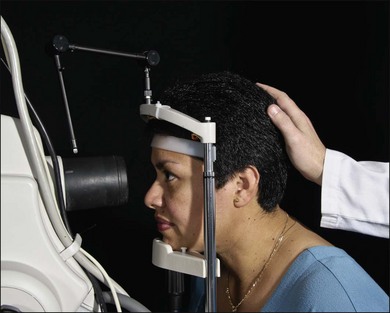
The photographer moves the camera from side to side to ascertain the width of the pupil and the focusing peculiarities of the particular cornea and lens. The photographer studies the eye through the camera lens, moving the camera back and forth and up and down, looking for fundus details (e.g., retinal blood vessels). The photographer then determines the single best position from which to photograph (Figs 1.6 and 1.7).
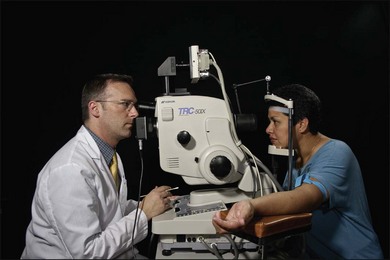
Fig. 1.6 The patient’s arm rests on an adjustable armrest that is elevated so that the patient’s arm is at or above the level of her heart. The armrest also facilitates easy placement of the intravenous needle and injection of fluorescein.
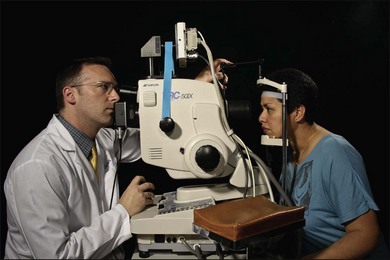
Fig. 1.7 The patient’s head is kept steady in the chinrest and headrest of the fundus camera. The photographer aligns the camera and focuses on the patient’s right fundus. Each is in a comfortable position, facilitating the stability necessary to achieve a good fluorescein angiogram.
Any abnormalities, such as an unusual light reflex or a poorly resolved image that the photographer sees through the camera system, will appear on the photograph. If the ophthalmoscopic view seen through the camera is not optimal, the photograph will not be optimal (Fig. 1.8). If the view is optimal, well aligned, in focus, and without reflexes, the photograph can be optimal. A helpful concept for the photographer is “what you see is what you get (or worse – never better).”
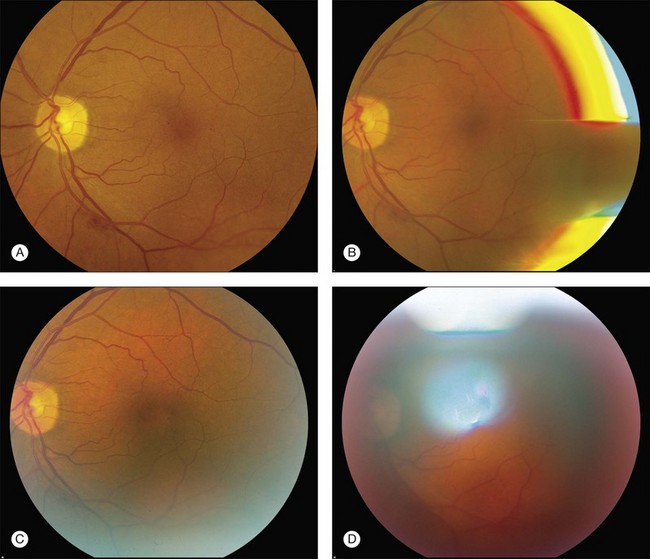
Fig. 1.8 Fundus photograph and reflexes. (A) Photograph of right fundus without reflexes. The camera was properly aligned and focused. (B) Note the bright red, yellow and blue arc on the right side. The flash is reflecting off the iris. This can be remedied by repositioning the camera slightly to the right or left. (C) In this case the camera was placed at the proper distance from the fundus but was placed too far to one side (down and to the right), which allowed the bright white arc reflex to the lower right. (D) Note white reflex, especially above, in, and below the papillomacular bundle. In this case the camera was in proper alignment but was placed too far away from the patient’s eye.
Focusing
The photographer first turns the eyepiece counterclockwise (toward the plus, or hyperopic, range) to relax his or her own accommodation; this causes the crosshairs to blur. The photographer then turns the eyepiece slowly clockwise to bring the crosshairs into sharp focus. The eyepiece is focused properly when the crosshairs appear sharp and clear (Fig. 1.9). They must remain perfectly clear while the photographer focuses on the fundus with the camera’s focusing detail. With experience, the photographer becomes expert in adjusting the eyepiece and in keeping the crosshairs in focus throughout the entire photographic sequence.
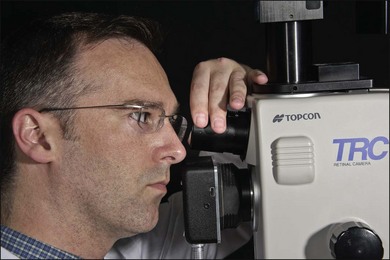
Fig. 1.9 The photographer focuses the eyepiece of the camera by initially turning the eyepiece counterclockwise, then clockwise, and stopping when it is in exact focus. The photographer must be sure that the eyepiece crosshairs remain in perfect focus throughout the photographic procedure.
Digital angiography
In theory, film-based photography has advantages over digital imaging: image resolution and stereoscopic viewing.8 Film-based images contain 10 000 lines of resolution, in contrast to digital imaging, which may have as little as 1000 lines of resolution.8 However, some argue that, despite higher resolution in film, the greater ability to magnify digital images makes the disadvantage of digital photography less clinically relevant.8 Digital angiography offers advantages, including the instantaneous availability of the angiogram, and the avoidance of the equipment and time necessary to develop film. With instantaneous images, digital angiography facilitates education and discussion concerning the patient’s condition and treatment options. Also, digital angiography facilitates training of ophthalmic personnel. We have found that it is useful to stay in the room during the initial frames of the angiogram to ensure that the desired pathology is photographed. Any changes can be promptly made, and the photographer can also learn from this prompt feedback. Digital angiography, however, necessitates an ongoing investment of money both in software updates and storage of digital electronic files. Also, excessive image manipulation with image-editing software may result in artifacts. Specifically, some areas may appear overly hyperfluorescent due to limited dynamic range in images and software manipulation. Care should be taken in avoiding misinterpretation of hyperfluorecence and hypofluorescence in digital images.
Using stereophotography
Stereophotography separates, photographically, the tissues of the eye for the observer. Stereo fluorescein angiography facilitates interpretation by separating in depth the retinal and choroidal circulation.16,17 Stereo angiography is considered absolutely essential in certain situations.18 The photographic protocol for the Macular Photocoagulation Study required stereo fluorescein angiography. Without well-resolved stereo images, interpretation of angiograms with, for instance, choroidal neovascularization associated with age-related macular degeneration, can be extremely difficult, if not impossible (Fig. 1.10). On the other hand, stereophotography, although extremely helpful in cases that are difficult to interpret, is not always absolutely necessary because other fundus features and characteristics usually indicate the level at which abnormal fluorescence is located.
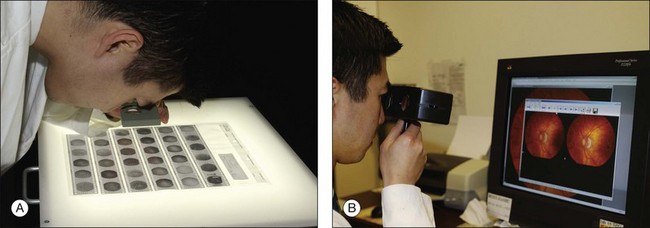
Fig. 1.10 Viewing stereo fundus photographs. (A) Negatives are placed on a viewing back-lit display. Two negative images are then viewed with an adjustable stereo lens. Reading the contact print of the angiogram. The stereo viewer can be easily made up using a trial frame. In viewing negative images, “hyperfluorescence” corresponds to dark objects while corresponding “hypofluorescent” objects are lighter. (B) Reading a stereo pair of digital angiograms. The special viewer allows the observer to focus both images. The software displayed is Ophthalmic Imaging Systems.
Photographing the periphery
Photographing the peripheral retina with a standard 50° fundus camera demands precision and skills acquired only after many hours of practice. Problems with patient position and camera alignment and focus are compounded by marginal corneal astigmatism, unsteadiness of patient fixation, light reflexes, and awkward camera placement. All steps necessary for taking posterior photographs, such as alignment and focusing, must be employed to achieve good peripheral fundus photography. The Zeiss camera comes with an astigmatic dial to help neutralize the induced astigmatism. A tilt mechanism, now standard on most cameras, helps position the camera for extreme superior and inferior peripheral photography (Fig. 1.11).
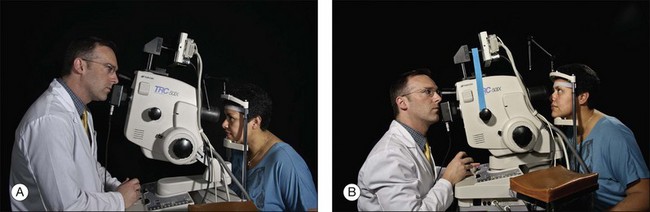
Fig. 1.11 Photographing the periphery. (A) The tilt mechanism of the camera allows the back of the camera to be lifted up (tilted to aim downward) for photography of the inferior periphery. The same tilt mechanism can be used to bring the camera far down (tilted to aim upward) to take pictures of the superior periphery (B). In photographing the inferior periphery, the photographer must sometimes stand. This photograph was a mock situation. In a real situation, the photographer or an assistant would have to lift the patient’s upper lid to view the inferior periphery properly.
Positioning the patient
The patient is positioned at the camera with the chin in the chinrest and the forehead against the head bar. Because the most common cause of poor fluorescein photographs is involuntary movement of the patient’s head, the photographer should prepare and make adjustment for this before the fluorescein is injected. The photographer should aim and focus the camera on the specific area of primary interest, at the same time noting the patient’s responses. If the photographer finds that the camera must continually be moved closer to the patient while aligning it or taking preliminary photographs, or if reflexes suddenly appear in the view even though the camera is steady, then the patient’s head has moved away from the chinrest. If so, the photographer can make some adjustment before injecting the fluorescein dye. Sometimes having an assistant hold the patient’s head in the chinrest is helpful (Fig. 1.12). The photographer either may lower the entire camera and chinrest or raise the patient’s chair. This causes the patient to lean forward in the chinrest and against the forehead bar, making it more difficult for the patient to pull back.
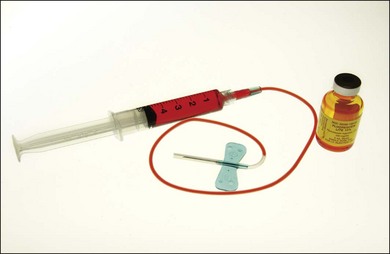
Injecting the fluorescein
The color stereoscopic fundus photographs are taken first, before the fluorescein is injected. For injection, we recommend a syringe with a 23-gauge scalp-vein needle (Fig. 1.13). The scalp-vein needle has several advantages: it is small enough to enter most visible veins, and an intravenous opening is then available in the event of an emergency. Once in the vein, it requires no further attention, and although it can be taped in place, this usually is unnecessary. Whenever an antecubital vein is not visible or accessible, the vein in the back of the hand or radial (thumb) side of the wrist can usually be used for injection. Injecting the fluorescein into a hand or wrist vein increases the circulation time by a few seconds, but this seldom makes any difference.
Developing a photographic plan
To photograph and print the fluorescein angiogram, we suggest the following comprehensive plan, designed to yield maximal angiographic information from each fundus and to facilitate a thorough and complete interpretation (Fig. 1.14). In contrast to film-based angiograms which required multiple duplicate attempts to assure at least one image would be optimal, fewer photographs are necessary in digital angiography. Although most angiograms will be complete by following this procedure, there will be exceptions. This plan must be modified if abnormalities occur in areas other than the macula and disc.

Fig. 1.14 Photographic plan for fluorescein angiography of macular disease. Film-based images printed upside down because the fundus camera inverts the image of the fundus, and, to read the angiogram upright, the film is printed with the frame numbers upside down. In digital photography, no inversion is required.
It is both essential and extremely cost-effective for the physician to indicate specifically what areas to photograph. The photographer should be directed as to where to start the angiogram and the issues important for each specific angiogram. It is most efficient to use a photographic instruction slip that indicates the specific number of color photographs to take of each area, where to start the angiogram, what the diagnosis is, and any other information about the patient or fundus that is pertinent to the photographic process (Fig. 1.15). Although digital color and angiograms avoid the issue of wasted film and developing costs, unnecessary computer storage of images and patient inconvenience can be avoided with good technique and a repeatable, accurate algorithm for angiography.
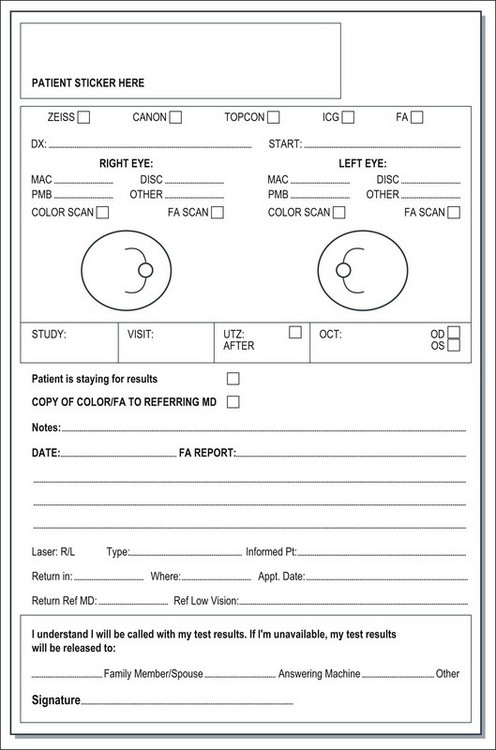
Fig. 1.15 Photographic request form. In the top left portion of the form, the physician indicates the number of color photographs required for each area in the fundus. The physician also indicates the diagnosis because experienced photographers will know which type of photographs to take for each particular diagnosis. The physician also indicates in which location of the fundus the initial-transit phase of the angiogram should take place or, in other words, where the photographer should start the angiogram. In the lower right portion of the photographic request form, the physician can indicate to the photographer specifics about the patient that will facilitate the photographic process and save the photographer time. The physician can indicate whether an eye can fixate on a light, whether the media are clear (so that if the photographer cannot get a clear view, he or she can immediately understand that it is caused by a problem of the eye), and what the patient’s refraction is so that the photographer can know which special lenses to use in the photographic process.
At this point the fluorescein injection is begun. The needle is inserted in a vein in the patient’s arm (Fig. 1.16). The photographer waits for confirmation of successful venous access and awaits verbal confirmation that infusion is about to begin. Once the injecting clinician starts the infusion of fluorescein, the photographer begins the initial “injection” image. When the injecting clinician has completed infusion, he or she announces “injection complete” and the photographer takes the “end-of-injection” image. Because it is important to observe the site of the needle tip for extravasation of fluorescein, the lights are turned off only at the end of the injection. An alternative method is to turn the lights off after the needle has been inserted in the vein. The person injecting can hold a hand light to observe the fluorescein flow into the vein to be sure extravasation is not occurring. With the lights off, the photographer can become dark-adapted, which allows him or her to be better able to see the flow of fluorescein into the fundus as it occurs.
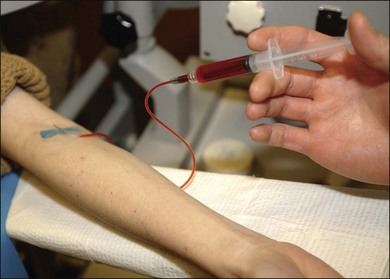
Fig. 1.16 After the needle is placed in the vein, the lights can be turned off so that the photographer can become dark-adapted and see fluorescein flow in the eye. With the use of a hand light, the person injecting can carefully observe the injection site so as to be sure extravasation is not occurring. In this way the fluorescein solution can be injected while the room lights are out.
Box 1.3 provides a checklist of important steps in the fluorescein angiography procedure.
Interpretation
1. preretinal area, where contraction from an epiretinal membrane may influence the retinal circulation and where hemorrhage may be located
2. vascular layers of the sensory retina, both superficial and deep
3. avascular portion of the sensory retina, particularly the outer plexiform layer, the principal site of intraretinal edema and exudate
4. retinal pigment epithelium, which has the potential for many manifestations, including proliferation, depigmentation, hyperpigmentation, and detachment
5. choroidal circulation, including the choriocapillaris and the large choroidal vessels
Throughout this chapter a modified schematic drawing relates various fluorescein angiographic abnormalities to fundus histopathologic changes (Fig. 1.17). The size and proportion of these various layers have been modified to include various pathologic manifestations and to illustrate the effects of these abnormalities on the angiogram. Because of its importance and various pathologic changes, the pigment epithelium is drawn to a larger scale in relation to other fundus structures. Only the inner portion of the sclera is represented because the outer portion of the sclera is usually of little importance to angiographic interpretation. The retinal and choroidal vessels are drawn larger and more numerous than they appear in a normal histopathologic section to emphasize the contribution of circulatory pathophysiologic interpretation.
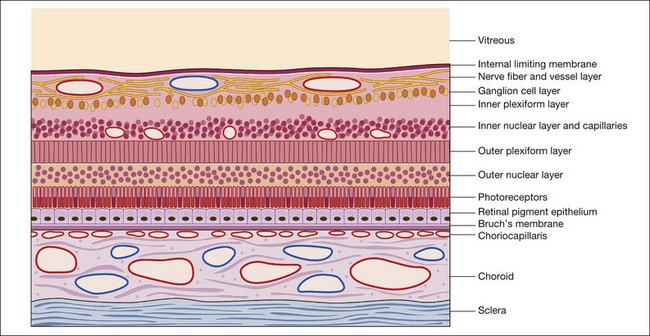
Fig. 1.17 Modified schematic drawing of a microscopic section of retina, pigment epithelium, and choroid.
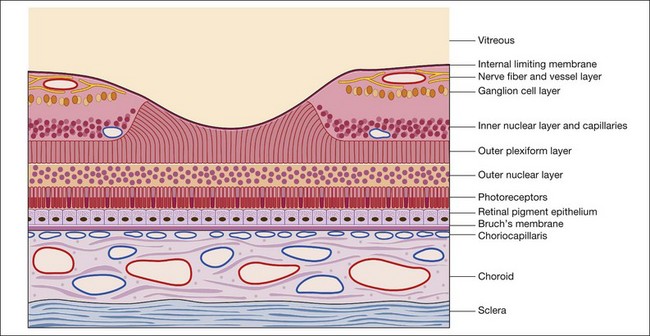
Two specialized areas of the fundus warrant more detailed discussion: the macula (Fig. 1.18) and the optic nerve head. The fovea is the center of the macula and contains only four layers of the retina: (1) the internal limiting membrane; (2) the outer plexiform layer; (3) the outer nuclear layer; and (4) the rods and cones. No intermediate layers exist between the internal limiting membrane and the outer plexiform layer in the fovea, which in the macula is oblique. This is an important factor in understanding the stellate appearance of cystoid edema in the macula as opposed to the honeycomb appearance of cystoid edema outside the macula. Beyond the macular region the outer plexiform layer is perpendicular rather than oblique.
Normal fluorescein angiogram
In the normal fluorescein angiogram (Fig. 1.19), the first true fluorescence begins to show in the choroid approximately 10–12 seconds after injection in young patients (e.g., adolescents) and 12–15 seconds after injection in older patients.
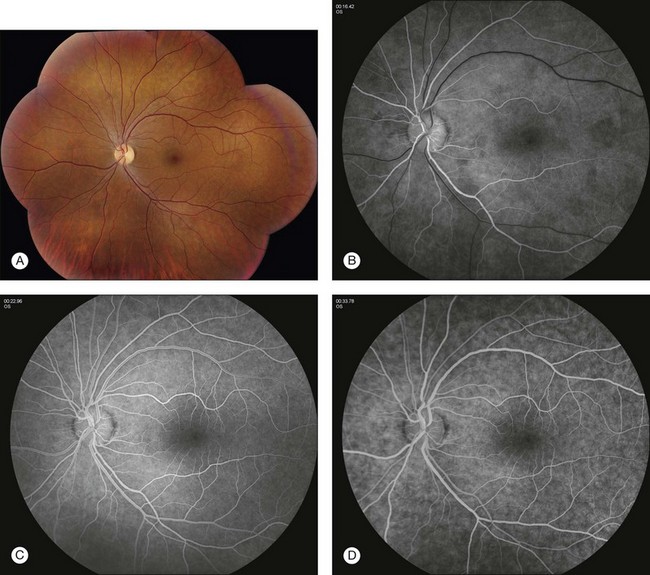
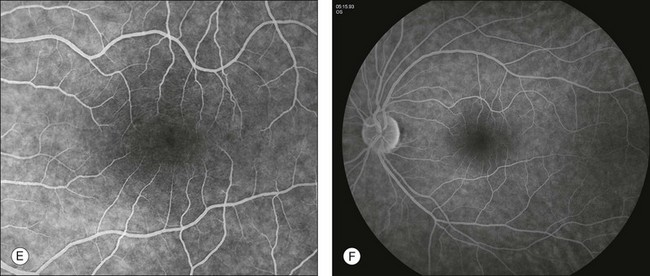
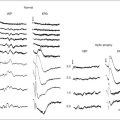
Fig. 1.19 Normal fundus photos and fluorescein angiogram of left disc and macula taken with a 50° camera. (A) Montage photograph of multiple fields shows normal macula, fovea, and retinal vessels. (B) Early arterial phase of the fluorescein angiogram. Note the ground-glass fluorescence of the choriocapillaris. There is very little fluorescence in the retinal veins; just the margins of the veins are fluorescent. This is the earliest portion of the laminar filling phase of the vein. Note some hyperfluorescence of choriocapillaris. These dark patches of the choroid are areas that have not fully filled, referred to as patchy choroidal filling. (C) The retinal arteries and capillaries have filled and the retinal veins have filled more substantially. Note the laminar flow in the retinal veins; this is indicated by the white line of fluorescence along the walls of the retinal veins. (D) Late venous phase. Laminar filling is no longer detectable and uniform filling is seen in both arterial and venous circulation. (E) Mid to later arteriovenous phase of fluorescein angiogram. Note that the ground-glass fluorescence of the choriocapillaris is complete. The retinal arteries and veins are completely filled. (F) Arteriovenous phase of fluorescein angiogram showing the disc. Again, there is diffuse fluorescence of the choriocapillaris. The arteries and veins have completely filled, and optic nerve fluorescence is normal.
Abnormal fluorescein angiogram
The purpose of this section is to offer a schema by which the interpretation of the fluorescein angiogram follows a simple and logical progression. The first step is to recognize areas of abnormal fluorescence and determine if they are hypofluorescent or hyperfluorescent (Fig. 1.20).
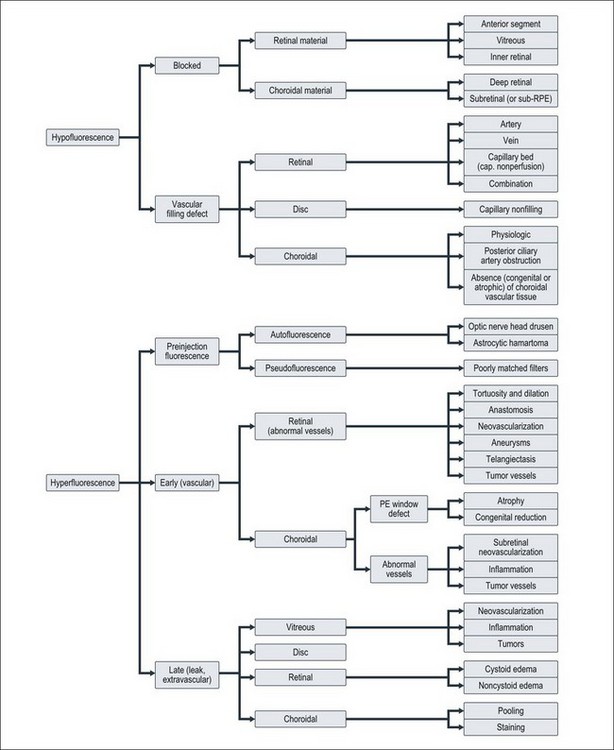
Hypofluorescence
Hypofluorescence is a reduction or absence of normal fluorescence, whereas hyperfluorescence is abnormally excessive fluorescence. A systematic series of decisions follows this initial differentiation to arrive at a proper diagnosis. These decisions relate to: (l) the anatomic location of various abnormalities; (2) the quality and quantity of the abnormal fluorescence; and (3) other unique characteristics, as indicated in Fig. 1.20.
Blocked retinal fluorescence
Any translucent or opacified material in the retina or in the nerve fiber layer blocks fluorescence from both planes of retinal vessels, as well as from the choroidal vessels. The large retinal vessels and precapillary arterioles are located in the nerve fiber layer in the anterior plane of the retina. The capillaries and postcapillary venules are located deeper in the retina, in the inner nuclear layer. If a blocking material lies in front of the nerve fiber layer, it blocks both planes of retinal vessels (Fig. 1.21). However, if the material lies beneath the nerve fiber layer but within or in front of the inner nuclear layer (where the smaller retinal vessels are located), it blocks only the retinal capillaries (and choroidal vessels), leaving the view of the large retinal vessels unobstructed. If a blocking material lies deeper than the retinal vascular structures, deep to the inner nuclear layer, it does not block the vessels but will block the choroidal vascular fluorescence. In other words, deep intraretinal blocking material, such as hemorrhage or exudate, does not obstruct retinal vascular fluorescence, since the retinal vessels are located in the inner half of the retina (Fig. 1.22).
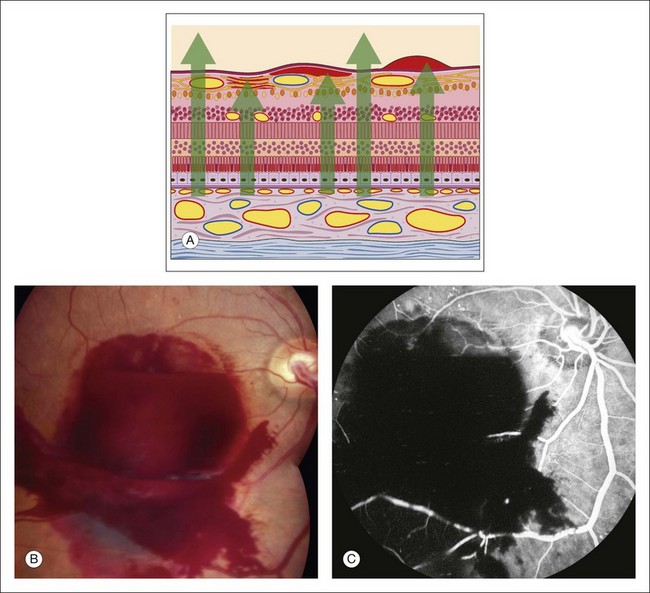
Fig. 1.21 Preretinal hemorrhage causing hypofluorescent blockage of all retinal and choroidal fluorescence. (A) Schematic drawing of subhyaloid (right), subinternal limiting membrane (central), and nerve fiber layer (left) hemorrhages. Each hemorrhage lies in front of the retinal, and therefore choroidal, vasculature, causing hypofluorescence-blocked fluorescence. (B) Color photograph of the right disc showing substantial preretinal hemorrhage. (C) Fluorescein angiogram of the right disc showing hypofluorescence caused by blockage as a result of the preretinal hemorrhage. Comment: all fluorescence of the fundus is blocked because the hemorrhage lies in front of the retinal vasculature.
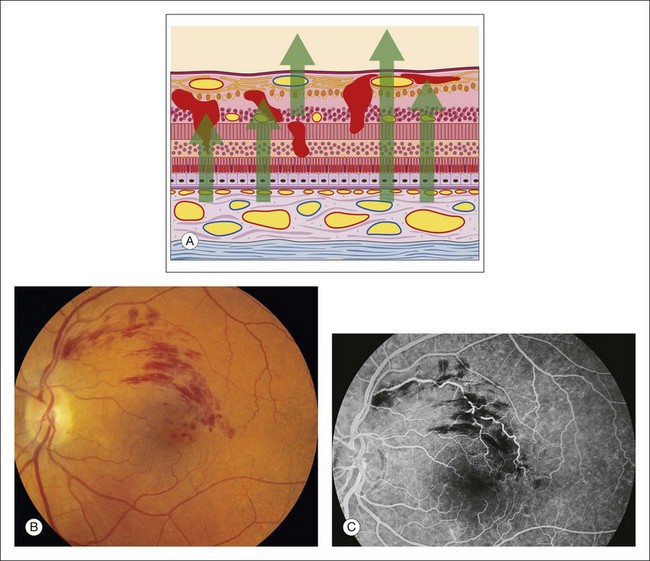
Fig. 1.22 Intraretinal hemorrhages causing hypofluorescent blockage. (A) Schematic of retina showing hemorrhages located in most of the layers of the retina from the internal limiting membrane to the outer nuclear layer. (B) Color photograph of left macula shows dot-and-blot, as well as flame-shaped hemorrhages just above the fovea. This is a case of branch-vein occlusion. (C) Fluorescein angiogram of left macula shows that the hemorrhage causes irregular hypofluorescent blockage. The flame-shaped hemorrhage located in the nerve fiber layer blocks all the retinal vasculature. The dot-and-blot hemorrhages do not block the large retinal vessels and therefore can be localized deeper in the retina. The hemorrhages that do not block retinal capillary fluorescence can be located deeper to the capillary layer, which is in the inner nuclear layer. Comment: Once hypofluorescent blockage is determined, an anatomic localization of the blocking material can be made by determining which fluorescent structures can be seen normally and which are being blocked.
If blocking material is present, the next step is to determine its anatomic location.
Blocked choroidal fluorescence
Hypofluorescence caused by blocked choroidal vasculature occurs when fluid, exudate, hemorrhage, pigment, scar, inflammatory material, or the like accumulates in front of the choroidal vasculature and deep to the retinal vasculature (Fig. 1.23).
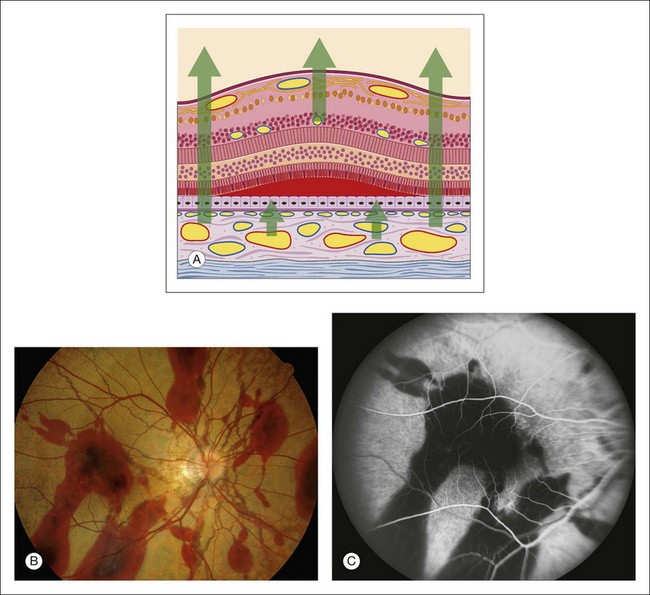
Fig. 1.23 Subretinal hemorrhage causing hypofluorescence, specifically, blockage of choroidal fluorescence. (A) Schematic of retina with subretinal hemorrhage (blood located between photoreceptors and pigment epithelium). (B) Color photograph of right macula of an eye with angioid streaks showing large scattered areas of subretinal hemorrhage. (C) Fluorescein angiogram of right macula shows marked hypofluorescence caused by blocked choroidal fluorescence (the retinal vessels are visible) that is due to the subretinal hemorrhage. Comment: The subretinal hemorrhage completely obscures fluorescence from the choroid. The retinal vessels are clearly seen overlying the subretinal hemorrhage.
Deep retinal material: Materials deposited in the deep retina that cause blockage of choroidal fluorescence are fluid, hard exudate, hemorrhage, and pigment.
Subretinal material: Any opaque or translucent substance located beneath the retina but in front of the choroid blocks fluorescence of the choroidal vasculature but does not block retinal vascular fluorescence (Fig. 1.23). Blood located under the retina causes complete blockage of choroidal fluorescence, with the retinal fluorescence showing through normally. Subretinal hemorrhage appears red, and subpigment epithelial hemorrhage is dark. Subretinal hemorrhage is generally scalloped with somewhat irregular margins, whereas subpigment epithelial hemorrhage is often quite round and well demarcated (Fig. 1.23).
Accumulated pigment (melanin and lipofuscin) from diseased retinal pigment epithelium causes blocked choroidal fluorescence (Fig. 1.24). Any hyperpigmentation of the pigment epithelium causes blocked choroidal fluorescence. Xanthophyll, the pigment present in the outer layers of the fovea, blocks choroidal fluorescence by selectively absorbing the blue exciting light, which results in less fluorescence. Finally, a choroidal nevus may block much of the choroidal fluorescence (Fig. 1.25) and especially blocks the later hyperfluorescent staining of the sclera. The choriocapillaris may be seen normally over the nevus.
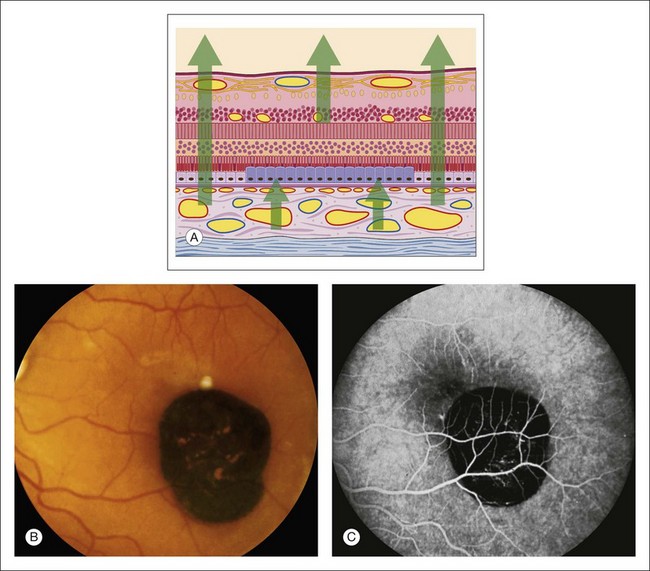
Fig. 1.24 Hypertrophy of the retinal pigment epithelium. (A) Schematic showing hypertrophic pigment epithelial cells. (B) Color photograph of the macula shows a well-demarcated hyperpigmented lesion. (C) Fluorescein angiogram of the same area shows marked hypofluorescence of the choroid resulting from blocked fluorescence. Comment: This patient had marked hypertrophy of the retinal pigment epithelium, which allowed normal retinal fluorescence; it completely blocked choroidal fluorescence.
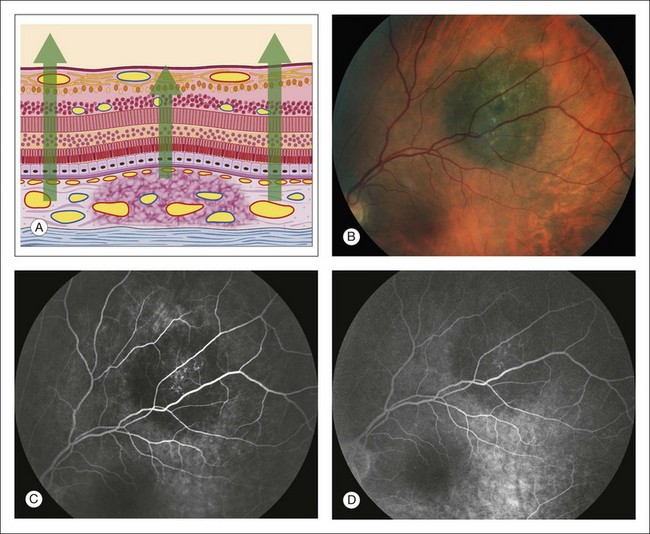
Fig. 1.25 Choroidal nevus hypofluorescent blockage. (A) Schematic drawing of retina showing choroidal nevus. Note that the choriocapillaris is intact. (B) Color photograph of nevus. (C) Arteriovenous phase of fluorescein angiogram shows hypofluorescence corresponding to the area of the nevus. (D) Later arteriovenous phase of fluorescein angiogram shows that the nevus is still hypofluorescent, although the choriocapillaris ground-glass fluorescence can be seen surrounding.
Vascular filling defect: The second cause of abnormal hypofluorescence is vascular filling defect. With blocked fluorescence, the fluorescein is present in the circulations of the fundus but is not visible because a tissue or fluid barrier conceals it. With vascular filling defect, fluorescein cannot be seen because it is not present. Since fluorescein reaches the retina and choroid by way of vessels, lack of the fluorescein dye in either vascular system indicates an obstructive problem or a lack of vessels (i.e., a vascular filling defect).
Retinal vascular filling defect: If a retinal vascular filling defect is present, the clinician then considers whether the defect results from obstruction of a retinal artery or vein, capillary bed, or any combination of these. Distinguishing the cause of the obstruction is not difficult because the fluorescein angiographic process is dynamic and timed. When nonfilling of a specific retinal vessel occurs, it is easy to differentiate an arterial occlusion from a venous occlusion because the retinal arteries fill first, then the retinal capillary bed, followed by the retinal veins. In addition, retinal vascular filling defects can be localized by tracing the course of a particular vessel; these defects correspond anatomically to the normal distribution of the retinal vasculature (Figs 1.26 and 1.27). Thus retinal vascular filling defects result from a variety of disease processes, but most are commonly associated with atherosclerosis and diabetes.
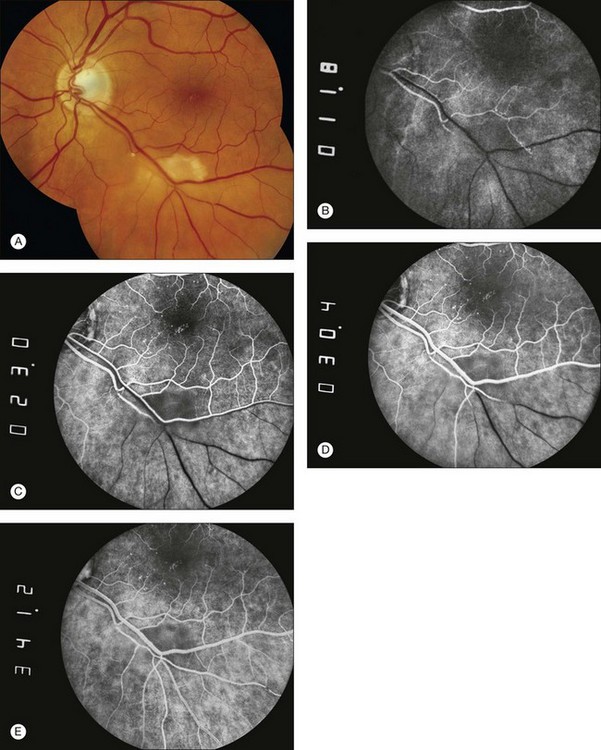
Fig. 1.26 Branch retinal artery occlusion. (A) Color photograph showing areas of retinal whitening inferior to the macula. An intra-arterial embolus is seen proximal to the whitened retina. (B) Earliest arterial filling. An area of hypofluorescence is located inferior to the macula. A small retinal artery feeding this area is occluded at the site of the embolus previously identified on Figure 1.26A. (C) Midarterial venous filling with a small area of intra-arterial hyperfluorescence distal to the site of embolic obstruction. (D) Late arteriovenous phase of fluorescein angiogram shows that the occluded artery is still mostly hypofluorescent. (E) Portions of the area did fill with fluorescein due to retrograde filling from surrounding areas. There is some mild staining of the occluded retinal artery.
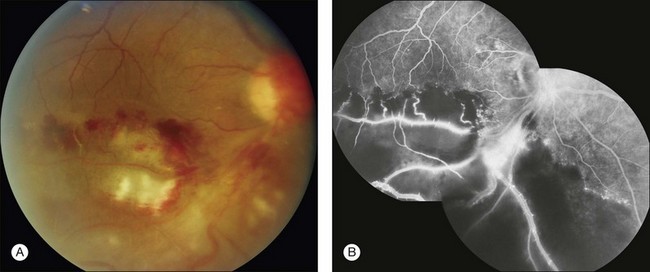
Fig. 1.27 Retinal branch-vein occlusion. (A) Color photograph of the right macula and disc. There are areas of retinal hemorrhage, retinal whitening, and cotton-wool spots. (B) The fluorescein angiogram of the right disc and macula shows normal fluorescence of the superior portion of the macula. The inferior portion shows substantial hypofluorescence due to retinal capillary nonperfusion. The very bright hyperfluorescent areas are due to neovascularization. Comment: This patient had a very ischemic inferotemporal branch retinal vein occlusion of the right eye. This was a severe occlusion, as evidenced by closure of large areas of the capillary bed. The hypofluorescence was caused not only by vascular filling defect but also by the nonperfused retina, which becomes partially opaque and caused hypofluorescence of the choroid. (In other words, there was blockage of choroidal fluorescence by the opaque retina, which was caused by the retinal capillary nonperfusion.)
Vascular filling defects of the disc: Vascular filling defects of the disc occur because of the failure of the capillaries of the optic nerve head to fill. This failure can be caused by: (1) congenital absence of disc tissue, as in an optic pit or optic nerve head coloboma (Fig. 1.28); (2) atrophy of the disc tissue and its vasculature, as in optic atrophy; or (3) vascular occlusion, as in an ischemic optic neuropathy.19,20 Each condition is characterized by early hypofluorescence caused by nonfilling and late hyperfluorescence resulting from staining of the involved tissue.
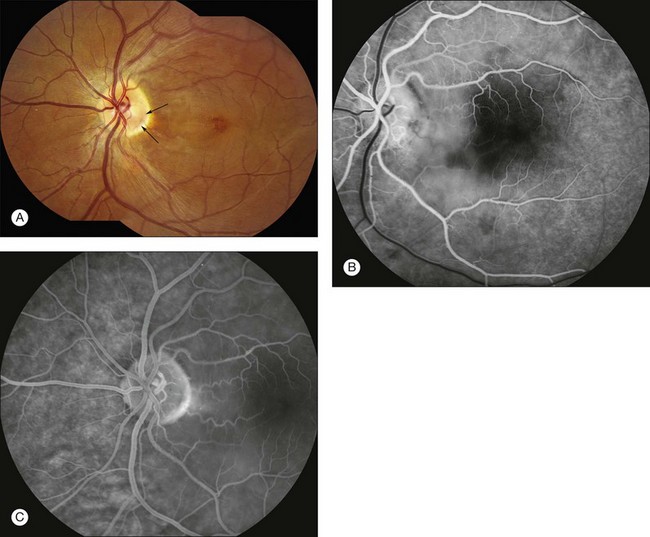
Fig. 1.28 Optic pit and sensory macula detachment. (A) Color photograph of left macula. Note the dark area of the optic pit (arrows). Cystic edema is present in the macula secondary to the macular schisis detachment from the optic pit. (B) Early arteriovenous phase of fluorescein angiogram shows hypofluorescence of the disc in the area of the pit due to absence of tissue and vessels. (C) In the late arteriovenous phase fluorescein angiogram, the hypofluorescent area of the pit is evident.
Choroidal vascular filling defect: The normal choroidal vasculature is usually difficult to document with fluorescein angiography because of the pigment epithelial barrier. If chronic choroidal vascular filling defects exist, the pigment epithelium is often secondarily depigmented or atrophied. In these cases the hypofluorescence caused by a vascular filling abnormality of the choroid and choriocapillaris can be documented angiographically.
When choroidal vessels do not fill, dark patches of hypofluorescence beneath the retina appear early in the angiogram. The distribution and morphology of the hypofluorescence vary according to the disease process. Because the choroidal circulation is completely separate from the retinal circulation, choroidal vascular filling defects do not correlate with the retinal vascular distribution. If the choriocapillaris is absent and the large choroidal vessels are still present, the choroidal and retinal vessels fluoresce, but hypofluorescent gaps appear because of the loss of the diffuse “ground-glass” fluorescence from the choriocapillaris (Fig. 1.29). When the choroidal vasculature does not fill, as in total occlusion or in atrophy, hypofluorescence occurs early in the angiogram. The hypofluorescence remains throughout the late stages of the procedure, although leakage from surrounding areas of normal choriocapillaris extends into the occluded area. When sufficient leakage occurs, the sclera retains fluorescein (stains) late in the angiogram. When the involved area is large and the leakage is minimal, the hypofluorescence remains throughout the later stages.
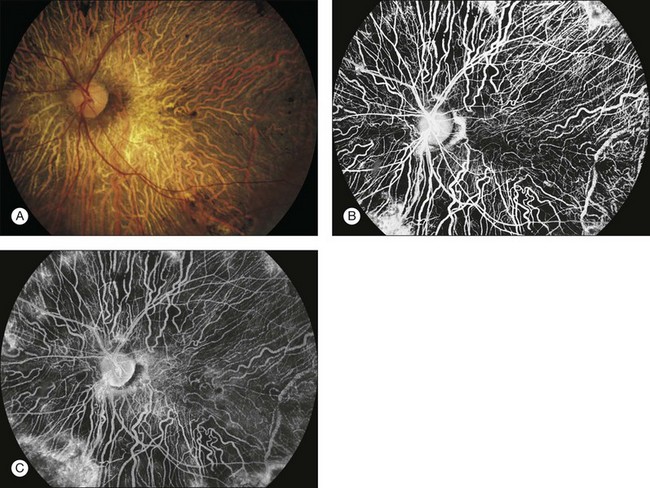
Fig. 1.29 Choroideremia: total loss of retinal pigment epithelium (RPE) and choriocapillaris with much of the large choroidal vasculature remaining. (A) Color photograph of the left disc and macula. The large choroidal vasculature can be seen as pale, irregular lines. Dark patches of pigment are located in the macula and around the disc. (B) Late venous phase of fluorescein angiogram of the left disc and macula. The large choroidal vessels can be seen filling, as can the retinal arteries. The choriocapillaris is not seen. (C) Recirculation phase of fluorescein angiogram. The large choroidal vessels and retinal vessels can be seen, but the choriocapillaris (usually seen as ground-glass fluorescence) is not seen except in the far edges of the view. Comment: This patient had a total loss of RPE and choriocapillaris in most areas of the fundus. The ground-glass choroidal fluorescence was absent from most areas. The large choroidal vessels could be seen. The large choroidal vessels do not leak fluorescein, and therefore the sclera did not stain in these areas. The RPE and choriocapillaris were partially intact in a few areas. These can be seen at the far extremes, where there is some mild ground-glass appearance.
In general, vascular filling defects of the choroid are caused by obstructive disorders or absence of tissue with the following fluorescein angiographic characteristics: (1) normal retinal vascular flow; (2) depigmentation of the pigment epithelium; (3) reduction of choroidal blood flow; and (4) hypofluorescence in the early phases of angiography caused by loss of the normal ground-glass choriocapillaris fluorescence. In some conditions the large choroidal vessels are also absent, resulting in total early hypofluorescence in the affected area, with scleral staining only on the circumference of the lesion because of the adjacent patent choriocapillaris. Choroidal vascular defects result from a variety of disease processes (Figs 1.30 and 1.31).
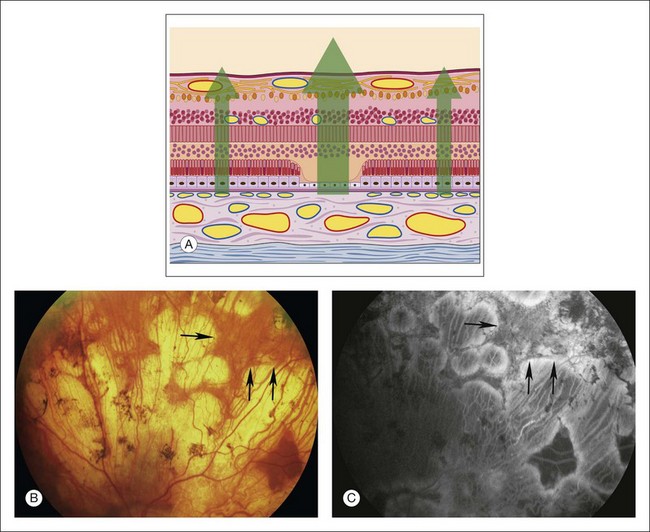
Fig. 1.30 Choroidal atrophy, with some remaining islands of choriocapillaris, due to choroideremia. (A) Schematic of retina shows loss of pigment epithelium and choriocapillaris and some of the outer retina (especially photoreceptors). (B) Color photograph of left superior retina showing areas of severe atrophy and more intact areas of retinal pigment epithelium (RPE) peripherally. Arrows delineate margins between normal RPE and RPE atrophy producing window defect. (C) The arteriovenous phase of fluorescein angiogram shows normal fluorescence of the retinal arteries. The large choroidal vessels can be seen temporally on the right side of the photograph. The ground-glass fluorescence of the choriocapillaris can be seen more peripherally on the left side of the angiogram, where the RPE and choriocapillaris are more intact. Comment: This patient had severe atrophy of the RPE and choriocapillaris. Large choroidal vessels could be seen causing hypofluorescence in relationship to absence of ground-glass choroidal fluorescence. Some areas of choriocapillaris remained and showed normal hyperfluorescence (perhaps increased hyperfluorescence caused by loss of overlying RPE).
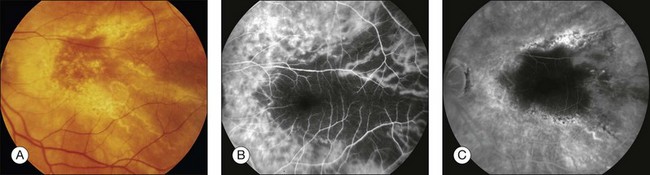
Fig. 1.31 Choroidal hypoperfusion caused by photodynamic therapy with verteporfin. (A) Left macula. Color photograph shows widespread retinal pigment epithelial alterations and drusen secondary to an occult choroidal neovascular membrane secondary to age-related macular degeneration. This treatment was considered standard therapy prior to the advent of intraocular antivascular endothelial growth factor medications. (B) The late arteriovenous phase of the fluorescein angiogram of the left macula shows hypofluorescence of the macula and a large area temporally. Larger choroidal vessels are perfused. The macular hypofluorescence corresponds to the laser treated area. The large area of hypofluorescence temporally represents an area of choroidal nonperfusion caused by selective choriocapillaris occlusion from photodynamic therapy. (C) Later phase of the fluorescein angiogram shows continued hypofluorescence of the area temporal to the macula despite relative restoration of perfusion to choriocapillaris temporal to macula.
Hyperfluorescence
Autofluorescence
Autofluorescence is the emission of fluorescent light from ocular structures in the absence of sodium fluorescein. Conditions that cause autofluorescence are optic nerve head drusen and astrocytic hamartoma (Fig. 1.32).
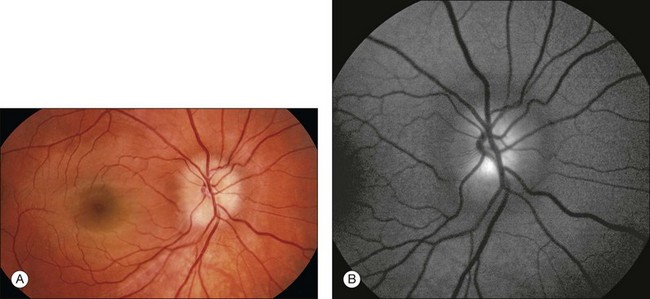
Fig. 1.32 Autofluorescence of optic nerve drusen. (A) Right disc and macula show a blurred disc margin with nonhyperemic vessels. Blurring of the central optic nerve is consistent with disc edema noted on stereophotos. (B) Preinjection or “control” photos are performed with filters in place, prior to any injection of fluorescein. This allowed for the identification of optic nerve drusen, which autofluoresce.
Pseudofluorescence occurs when the blue exciter and green barrier filters overlap. The blue filter overlaps into the green range, allowing the passage of green light, or the green barrier filter overlaps into the blue range, allowing the passage of blue light (Fig. 1.2). The overlapping light passes through the system, reflects off highly reflective surfaces (light-colored or white structures), and stimulates the film. This reflected nonfluorescent light is called pseudofluorescence.
Transmitted fluorescence (pigment epithelial window defect)
This fluorescence is an accentuation of the visibility of normal choroidal fluorescence. Transmitted fluorescence occurs when fluorescence from the choroidal vasculature appears to be increased because of the absence of pigment in the pigment epithelium, which normally forms a visual barrier to choroidal fluorescence. The major cause of pigment epithelial window defect is atrophy of the pigment epithelium (Figs 1.33–1.36).
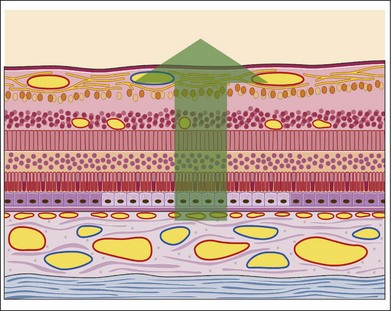
Fig. 1.33 Pigment epithelial window defect. This schematic of the retina shows that the pigment epithelium in the center of the section is less pigmented than the normal pigment epithelium. This allows the normal choroidal and choriocapillaris fluorescence to show through; that is, this pathologic condition would create a typical pigment epithelial window defect.
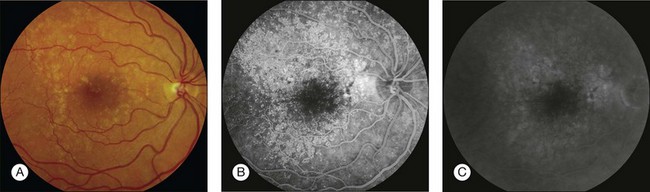
Fig. 1.34 An eye with drusen demonstrating pigment epithelial window defects. (A) Color photograph: right macula shows multiple drusen temporally. (B) Late arteriovenous phase of fluorescein angiogram shows marked hyperfluorescence in the areas of the drusen. (C) Late recirculation phase of fluorescein angiogram shows fading of fluorescence. Comment: Note the degree of fluorescence of the entire fundus vasculature. This is typical of a pigment epithelial window defect, which is a type of vascular fluorescence. The drusen allow a better view to the choriocapillaris because of the thinning of the pigment epithelium overlying them.
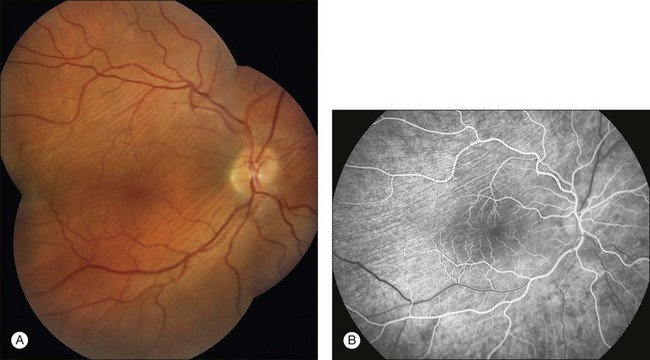
Fig. 1.35 Pigment epithelial window defect: choroidal folds. (A) Montage color photograph of right disc and macula. Note the pale lines (choroidal folds) scattered throughout the posterior pole. (B) Arteriovenous phase of fluorescein angiogram of the disc and macula. Hyperfluorescent lines correspond to the folds, and adjacent hypofluorescent lines are present throughout the macula and surrounding the disc. Comment: This patient had pigment epithelial folds caused by prolonged hypotony from a filtering bleb. The hyperfluorescent lines are thought to be the hills of the folds, in the apices of which the pigment epithelium is thinned, allowing hyperfluorescence in the early phases of the fluorescein angiogram (pigment epithelial window defect). The dark lines are thought to be the valleys of the folds, with an increase in pigmentation causing blockage of choroidal fluorescence. The later phases of fluorescein angiograms often show fading of fluorescence. Choroidal folds represent a type of pigment epithelial window defect with early vascular fluorescence and late fading of fluorescence.
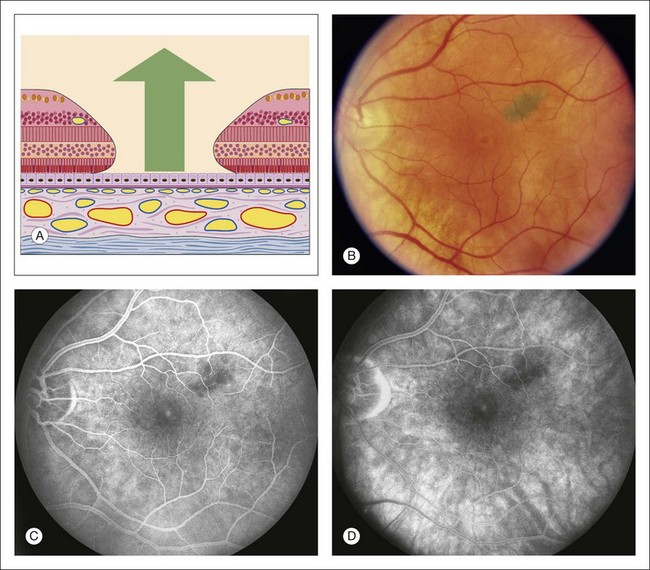
Fig. 1.36 Pigment epithelial window defect: macular hole. (A) Schematic drawing of macula showing loss of entire central foveal tissue. (B) Color photograph of the left macula. This patient has a macular hole. Note a corona of lighter detached, swollen retinal tissue surrounding the foveal center where the hole is located. (C) Late phase of fluorescein angiogram shows hyperfluorescence within the macular hole. (D) Later phase of the fluorescein angiogram shows some fading of the hyperfluorescence within the macular hole. Comment: The choriocapillaris was intact. Therefore the angiogram showed normal fluorescence of the choriocapillaris (early hyperfluorescence within the center of the fovea) and fading in the late phase of the angiogram.
Transmitted fluorescence has the following four basic characteristics:
1. It appears early in angiography, coincidental with choroidal filling.
2. It increases in intensity as dye concentration increases in the choroid.
3. It does not increase in size or shape during the later phases of angiography.
4. It tends to fade and sometimes disappear as the choroid empties of dye at the end of angiography.
Abnormal retinal and disc vessels: Abnormal vascular fluorescence occurs when abnormal vessels are present. Such pathologic vessels may be in the retina, on the disc, or at the level of the choroid. Normal and abnormal retinal and disc vessels are clearly visible on the angiogram because no barrier obscures them from view. Gross abnormalities of the retinal and disc vasculature and subtle microvascular changes that cannot be appreciated adequately by ophthalmoscopic examination will be well defined and easily distinguished by fluorescein angiography. These changes in the retinal vasculature can be classified into six morphologic categories: (1) tortuosity and dilation (Figs 1.37 and 1.38); (2) telangiectasis (Figs 1.39 and 1.40); (3) neovascularization (Fig. 1.41); (4) anastomosis (Fig. 1.38); (5) aneurysms (Figs 1.38 and 1.39); and (6) tumor vessels (Figs 1.42 and 1.43).
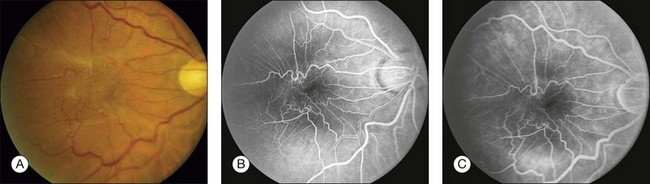
Fig. 1.37 Abnormal retinal vessels, tortuosity, and dilation: internal limiting membrane contraction. (A) Color photograph of right macula shows a pale membrane overlying the right macula, producing contraction of the retina and tortuosity of the retinal vessels. (B) Arteriovenous phase of fluorescein angiogram shows marked irregularity and tortuosity of the retinal vessels in association with the preretinal membrane (macular pucker). (C) Late phase of fluorescein angiogram shows a small amount of vascular leakage due to contraction of the membrane and pulling on the retinal vessels. Comment: This is tortuosity and dilation, a type of abnormal retinal vascular fluorescence. It is caused by the mechanical traction of an epiretinal membrane.
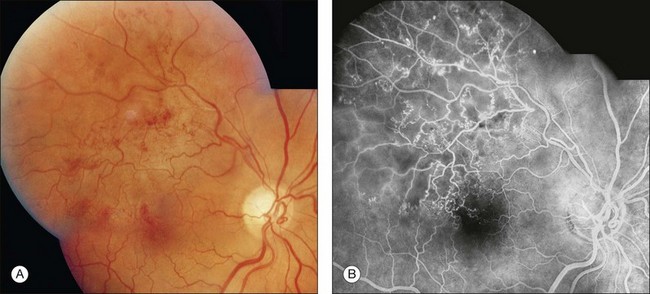
Fig. 1.38 Abnormal retinal vascular fluorescence: retinal vascular microaneurysms, telangiectasis, and anastomoses. (A) Color photography of right eye shows numerous telangiectatic retinal vessels due to a superotemporal branch-vein occlusion. (B) Arteriovenous-phase fluorescein angiogram shows multiple areas of smaller and larger microaneurysms and telangiectasis. Several small venous–venous anastomoses can be seen just temporal to the macula. The venous system of the occluded area has collateralized with patent vessels in uninvolved areas.
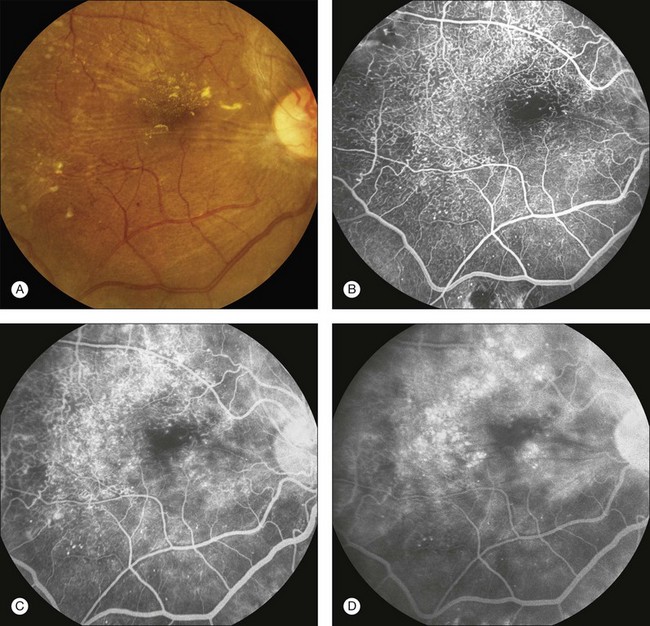
Fig. 1.39 Retinal telangiectasis and microaneurysms secondary to diabetic retinopathy. (A) Color photography of right macula showing retinal exudate, retinal striae, and irregularly dilated retinal vessels (telangiectasis). (B) Arteriovenous-phase fluorescein angiogram shows extensive hyperfluorescence from the numerous microaneurysms, and telangiectatic retinal vessels. (C) Later arteriovenous-phase fluorescein angiogram of right macula showing leakage from many of these vessels. (D) Late-phase fluorescein angiogram of right macula shows multiple circular areas of hyperfluorescence due to accumulation of dye in extensive cystoid spaces. Comment: This patient had significant retinal microvascular changes due to diabetic retinopathy.
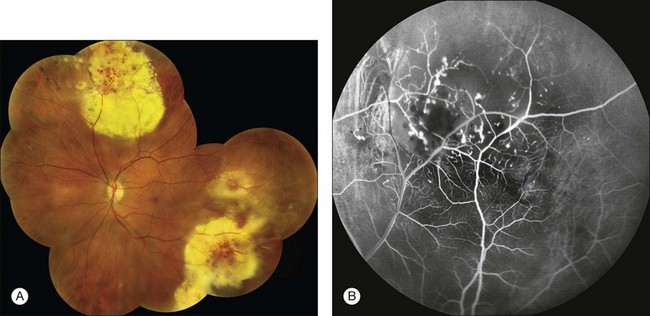
Fig. 1.40 Abnormal retinal vessels: telangiectasis. (A) Color montage photograph demonstrating severe areas of exudation, as well as dilated and telangiectatic vessels. The retina is very edematous. (B) Arteriovenous phase of fluorescein angiogram shows marked irregularity of the retinal vasculature. There are areas of capillary nonperfusion, telangiectasis, and tortuosity. Comment: This patient had Coats disease with a markedly abnormal retinal capillary bed, including telangiectasis and dilated vessels.
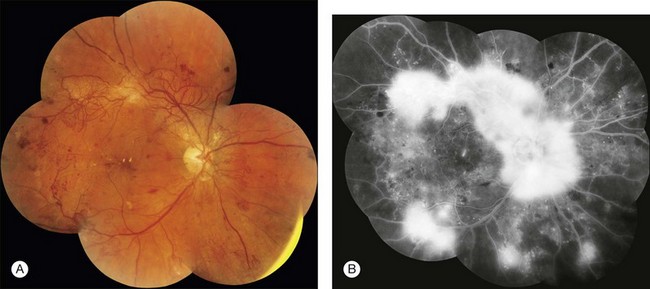
Fig. 1.41 Abnormal retinal vessels: retinal neovascularization due to proliferative diabetic retinopathy. (A) Montage color photograph of the posterior pole of the right eye. Extensive irregular tortuous vessels extend from the optic nerve along the vascular arcades and nasally. These vessels lie on the surface of the retina. (B) Later arteriovenous phase of fluorescein angiogram montage shows increasing hyperfluorescence of the retinal neovascularization. Comment: This patient had severe proliferative diabetic retinopathy with extensive neovascularization of the right disc. The vessels fluoresced early (vascular fluorescence) and leaked late. This is very typical of retinal or disc neovascularization.
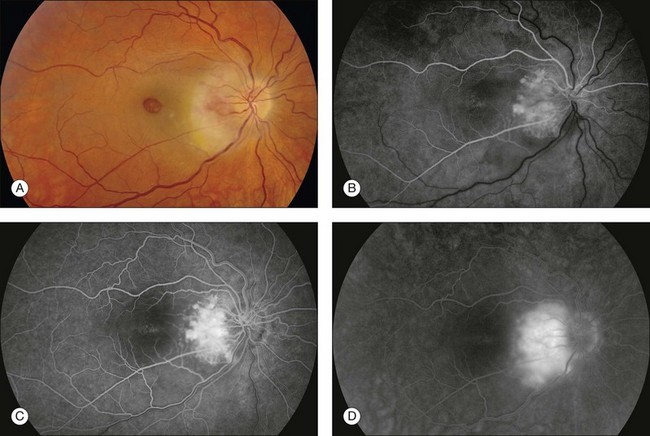
Fig. 1.42 Abnormal retinal vessels: tumor–retinal angioma as part of von Hippel’s disease. (A) Color photograph of right macula and disc shows exudate temporal and inferior to the disc. A very vascular, slightly elevated mass was noted on the temporal border of the disc. Ophthalmoscopy showed that it has a reddish appearance. A large full-thickness macular hole is also observed. (B) Early arterial phase of the fluorescein angiogram shows marked fluorescence of the mass. (C) Midarteriovenous phase of the fluorescein angiogram shows an increased fluorescence of the mass. (D) Late phase of the fluorescein angiogram shows leakage of fluorescein within the mass. Comment: This patient had a peripapillary retinal angioma. It was very vascular and showed early fluorescence and extensive late leakage.
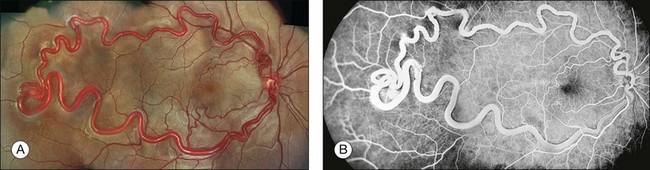
Fig. 1.43 Arteriovenous malformation: Wyburn–Mason type. (A) Color montage photograph of right macula and temporal retina showing enlarged, dilated retinal artery, with direct connection to an engorged draining vein. There is no intervening capillary bed. (B) Fluorescein angiogram showing marked hyperfluorescence of the abnormal, dilated retinal artery and vein. Two smaller arteriovenous malformations appear to be present, one just above the macula, and the other just below.
Abnormal choroidal vessels: Abnormal vessels that may be present under the retina and originate from the choroid are subretinal neovascularization and vessels within a tumor. When subretinal neovascularization is present, the early angiogram often shows a lacy, irregular, and nodular hyperfluorescence (Figs 1.44 and 1.45). With a choroidal tumor, the abnormal hyperfluorescence is a similar, early vascular-type fluorescence, although it may be coarser, as seen in choroidal hemangioma (Fig. 1.46) and malignant melanoma (Fig. 1.47).
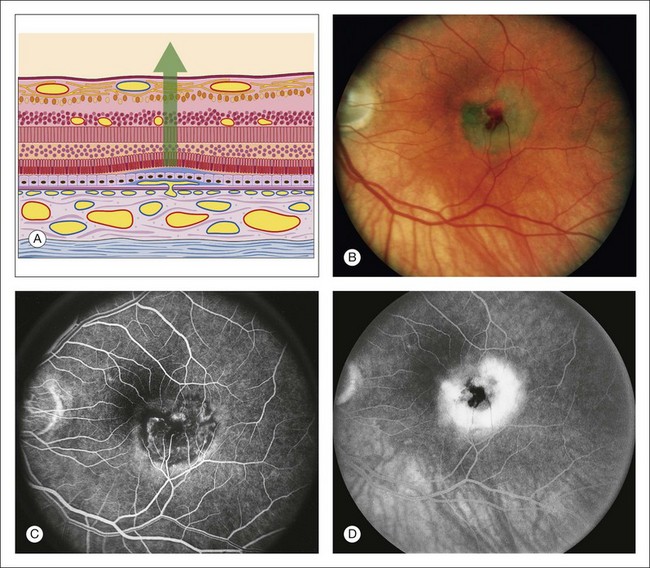
Fig. 1.44 Abnormal choroidal vessels: subretinal neovascularization. (A) Schematic view of the retina shows a small break in Bruch’s membrane, with a fine proliferation of capillaries through the break dissecting under and lifting up the pigment epithelium. There is a shallow sensory retinal detachment. (B) Color photograph of the left macula. There is a dirty-gray membrane involving the central macula. Note the small area of subretinal hemorrhage. There is a shallow sensory retinal detachment. (C) The arteriovenous phase of fluorescein angiogram shows fine, lacy, irregular hyperfluorescence corresponding to a small, fine patch of subretinal neovascularization. (D) Late phase of fluorescein angiogram shows leakage of these vessels into the subpigment epithelial and subretinal spaces. Comment: This patient had a small patch of subretinal neovascularization involving the central fovea. The angiogram shows typical, early vascular fluorescence (in a nodular, irregular, lacelike fashion) and late hyperfluorescent leakage.
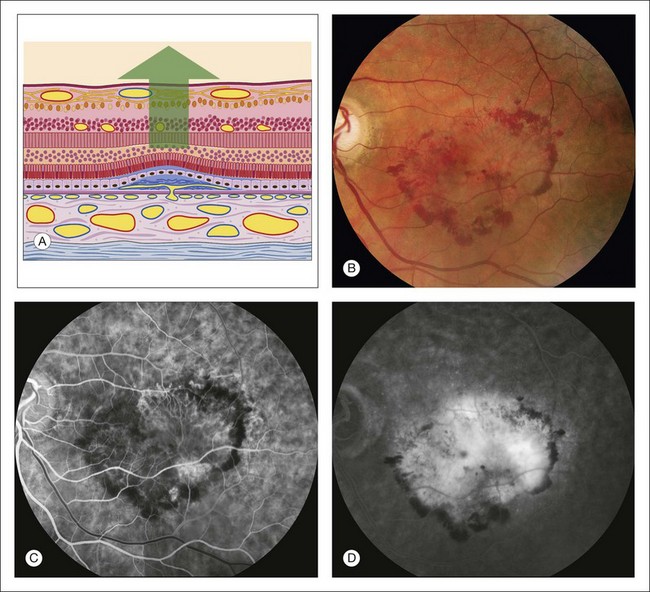
Fig. 1.45 Abnormal choroidal vessels: subretinal neovascularization. (A) Schematic drawing of retina shows vascular proliferation from the choriocapillaris dissecting under the pigment epithelium, with associated fibrous tissue. The pigment epithelium has become thinned and the sensory retina detached. The outer plexiform layer of the sensory retina shows cystic spaces. (B) Red-free photograph of left macula shows some hemorrhage and exudate. On the color photograph and slit-lamp biomicroscopy, a dirty-gray membrane was noted in the inferotemporal portion of the macula. This is seen as a slightly pale lesion in the inferotemporal macula. (C) Early arteriovenous phase of fluorescein angiogram shows a lacy, irregular, nodular area of hyperfluorescence in the inferotemporal macula. This is a flat patch of vessels that has proliferated from the choriocapillaris under the pigment epithelium. (D) Late phase of the fluorescein angiogram shows leakage from the patch of subretinal neovascularization. Most of the fluorescence is pooling of fluorescein under the sensory retinal detachment, although there is some cystic change in the fovea. Comment: This patient had a patch of subretinal neovascularization that was nearly 4 disc diameters in size. It fluoresced early with the vascular phase of the angiogram (typical for subretinal neovascularization) and leaked late. Actually, “subretinal neovascularization” is a misnomer because the new vessels are initially located in the subpigment epithelial space.
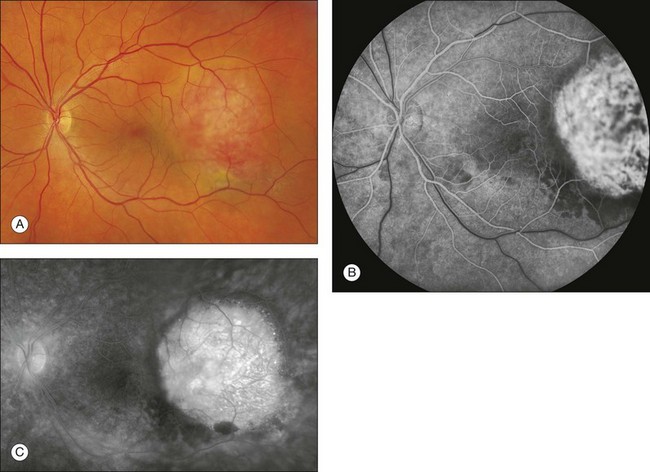
Fig. 1.46 Abnormal choroidal vessels in a patient with choroidal hemangioma. (A) Color photo of left macula and disc with elevated choroidal hemangioma. (B) Arteriovenous phase of the fluorescein angiogram shows prominent hyperfluorescence in this area demonstrating the tumor vessels. (C) Late phase of the fluorescein angiogram shows marked leakage in this area. Comment: This patient had a choroidal hemangioma, which is a very vascularized choroidal mass. The vascularity in this mass causes the marked hyperfluorescence and leakage.
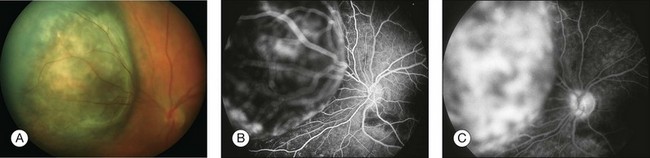
Fig. 1.47 Abnormal choroidal vascular fluorescence due to malignant melanoma. (A) Color photograph of left eye. Note the darkly pigmented mass nasal to the optic nerve. There is some orange lipofuscin pigment overlying the surface of this as well. (B) Arteriovenous phase of fluorescein angiogram of the mass shows hyperfluorescence over the surface of the tumor. This patient also had some macular drusen, which show some early hyperfluorescence in the macula. (C) Late phase of the fluorescein angiogram shows leakage from the mass. There are multiple “hot spots” overlying the tumor. Comment: This patient had a choroidal malignant melanoma. This was a medium-sized tumor that showed the typical early fluorescence that is seen in a medium-sized melanoma.
Leak: Fluorescence of the retinal and choroidal vessels begins to diminish about 40–60 seconds after injection. Fluorescein empties almost completely from the retinal and choroidal vasculature about 10–15 minutes after injection. Any fluorescence that remains in the fundus after the retinal and choroidal vessels have emptied of fluorescein is extravascular fluorescence and represents leakage.
Vitreous leak: Leakage of fluorescein into the vitreous creates a diffuse, white haze in the late phase of the fluorescein angiogram. In some instances the haze is generalized and evenly dispersed, and in other cases the white haze is localized.
Vitreous hyperfluorescence secondary to retinal neovascularization is usually localized and appears as a cotton-ball type of fluorescence surrounding the neovascularization (Fig. 1.41B). The vitreous fluorescence secondary to intraocular inflammation is often generalized, giving a diffuse, white haze to the vitreous because of generalized leakage of fluorescein from the iris and ciliary body. The vitreous fluorescence secondary to tumors is most often localized over the tumor.
Disc leak: The optic nerve head normally has some fluorescein leakage (late hyperfluorescence) as a result of staining of the lamina cribrosa and the surrounding margins of the disc (from the normally leaking peripapillary choriocapillaries). The difference between normal and abnormal leakage at the disc may be subtle.
Papilledema and optic disc edema: Papilledema is swelling of the optic nerve head as a result of increased intracranial pressure. Edema of the optic disc is defined as swelling of the optic nerve head secondary to local or systemic causes (Fig. 1.48). The angiogram is similar in each case, demonstrating leakage associated with swelling of the optic nerve head. In the early phases of the angiogram, dilation of the capillaries on the optic nerve head may be seen; in the late angiogram, the dilated vessels leak, resulting in a fuzzy fluorescence of the disc margin.
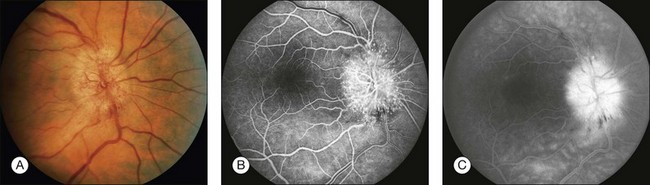
Fig. 1.48 Disc leakage. (A) Color photograph of right optic nerve. Note the dilation of the disc capillaries. (B) The arteriovenous-phase angiogram of the right disc and macula shows the hyperfluorescence due to these dilated disc capillaries. (C) The late phase of the angiogram shows significant leakage from these dilated optic disc capillaries. Comment: This patient had a papillopathy related to diabetes. This produced significant dilation of the disc capillaries. The leakage from this abnormal disc is quite obvious.
Retinal leak: In the late stages of the normal angiogram, the retinal vessels have emptied of fluorescein and the retina is dark. Any late retinal hyperfluorescence is abnormal and indicates leakage of retinal vessels. When the leakage is severe, the extracellular fluid may flow into cystic pockets, and the angiogram shows fluorescence of the cystic spaces. Fluorescein flows out of the patent retinal vessels to lie in pools in the cystoid spaces or stains the edematous (noncystic) retinal tissue. Cystoid retinal edema is apparent as the fluorescein pools in small loculated pockets. In the macula, cystoid edema takes on a stellate appearance (Fig. 1.49); elsewhere in the retina, it has a honeycombed appearance (Fig. 1.50). Fluorescent staining of noncystoid edema is diffuse, irregular, and not confined to well-demarcated spaces (Figs 1.51 and 1.52).
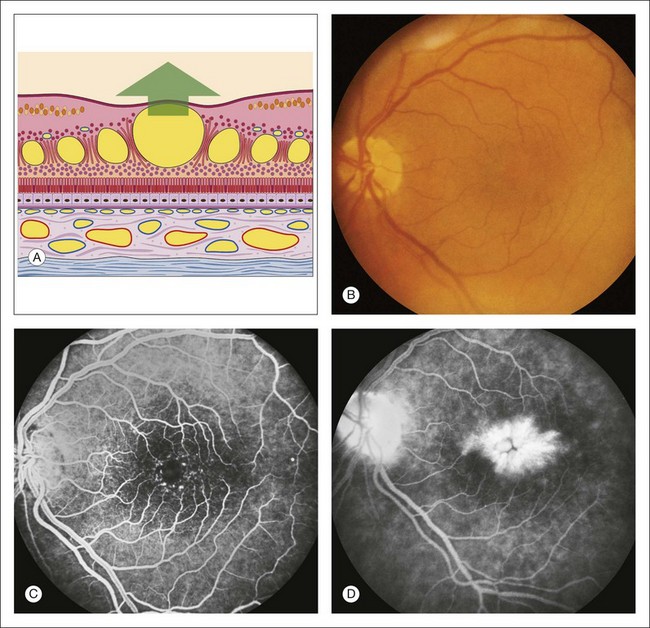
Fig. 1.49 Retinal leak: cystoid macular edema. (A) Schematic drawing of the macula shows large cystic spaces in the outer plexiform layer. There are some cystic spaces in the inner nuclear layer. (B) Color photograph of left macula. Careful inspection of the retina is often necessary on biomicroscopy to detect intraretinal cystoid. (C) Arteriovenous phase of fluorescein angiogram shows some dilation of the fine capillary network around the fovea. (D) Late phase of fluorescein angiogram shows hyperfluorescence from the accumulation of dye filling the cystic spaces. Note the stellate appearance of the cystoid macular edema. Comment: This patient had late hyperfluorescence (i.e., leakage) into the retina that was severe enough to create cystic spaces. This is a typical example of cystoid macular edema.
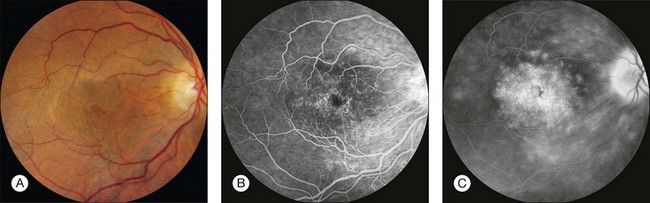
Fig. 1.50 Retinal leakage: cystoid retinal edema. (A) Color photograph of the right macula. Large central cystoid cavity is seen corresponding to fovea. (B) Arteriovenous phase of fluorescein angiogram shows well-defined telangiectatic retinal vessels. (C) Late phase of fluorescein angiogram shows leakage from these vessels. In the center of the macula, the leakage is in stellate cystic pockets, and just outside the macula, temporally, the leakage has taken a honeycomb form. Comment: This patient had leakage of telangiectatic vessels into the retina, and the leakage formed cystoid spaces. Cystoid edema in the center of the macula takes on a stellate form because of the oblique nature of the outer plexiform layer. The cystic spaces take on a honeycomb form in nonmacular areas of the retina because of the perpendicular nature of the fibers of the outer plexiform layer.
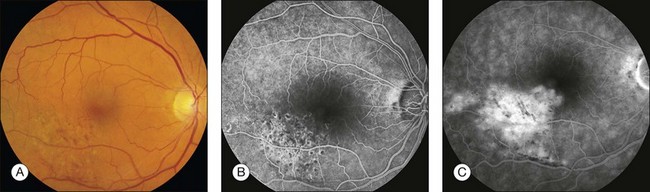
Fig. 1.51 Retinal leakage, severe noncystoid edema. Branch-vein occlusion. (A) Color photograph of right macula shows multiple retinal hemorrhages inferotemporally due to a retinal branch-vein occlusion. (B) Arteriovenous phase of fluorescein angiogram shows the vascular abnormalities associated with the branch-vein occlusion. Hypofluorescence corresponds to areas previously treated with grid pattern laser photocoagulation. (C) Late phase of fluorescein angiogram shows diffuse leakage of the fluorescein dye. Comment: This patient had generalized leakage of the retinal vascular bed in the distribution of the blocked branch vein. The leakage was not yet severe enough, however, to form clearly defined cystic spaces. Late hyperfluorescence indicates leakage, and this fluorescence is located in the retina; thus this was retinal edema.
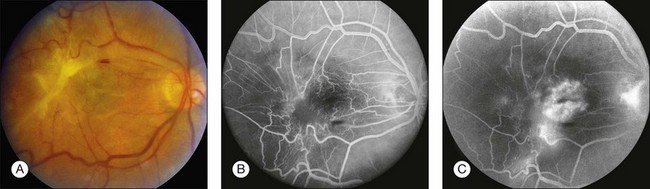
Fig. 1.52 Late hyperfluorescence, retinal leakage: severe epiretinal membrane contraction. (A) Color photograph of right macula showing thick epiretinal membrane overlying the macula and producing severe traction and contraction of the retina and vessels. (B) Arteriovenous phase of fluorescein angiogram shows that the retinal vasculature is tortuous and irregular. (C) Late arteriovenous phase of fluorescein angiogram shows leakage from the retinal vessels. Comment: The marked preretinal membrane caused sufficient traction on the retina, resulting in marked retinal vascular leakage.
The amount of fluorescein leakage depends on the dysfunction of the retinal vascular endothelium (Fig. 1.52). When leakage is not pronounced, the cystoid spaces fill slowly and become visible only late in angiography. When this occurs, the area of cystoid retinal edema may be somewhat hypofluorescent early in the angiogram because the fluid in these spaces acts as a barrier and blocks the underlying choroidal fluorescence. When there is heavy fluorescein leakage, the cystoid spaces fill rapidly, in some cases within a minute after injection. The large confluent cysts seen with severe cystoid macular edema may fill late in the angiogram. The large retinal vessels can also leak. This is called perivascular staining and is seen in three distinct situations: inflammation (indicating a perivasculitis), traction (severe pulling on a large retinal vessel, Fig. 1.52), and occlusion. When a large retinal vessel leak is partially occluded, or when it traverses an area of occlusion (and capillary nonperfusion), it will leak (Fig. 1.53).
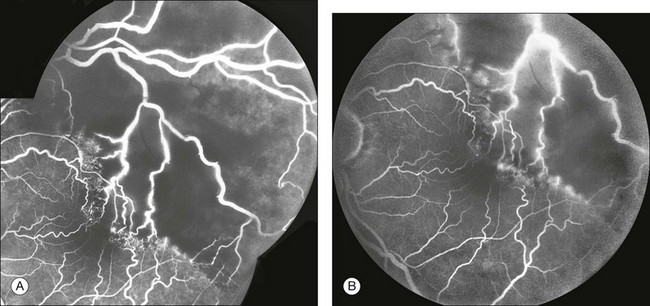
Fig. 1.53 Retinal leakage: perivascular staining. (A) In this late arteriovenous-phase fluorescein angiogram, note the beading of the large retinal veins. There is also associated leakage from these vessels. (B) Later phase of fluorescein angiogram shows perivascular staining (leakage) from the large retinal vessels that are traversing large zones of capillary nonperfusion. Comment: Typically, when a large retinal vessel (artery or vein) is perfused but traverses an area of capillary nonperfusion, ischemic retinal factors will act adversely on the endothelium of the large vessel and cause it to leak. This is called perivascular staining. Perivascular staining also occurs with traction or inflammation.
Choroidal leak: Late hyperfluorescence under the retina can be classified as either pooling or staining (Fig. 1.54). Pooling is defined as leakage of fluorescein into a distinct anatomic space; staining is leakage of fluorescein diffused into tissue.
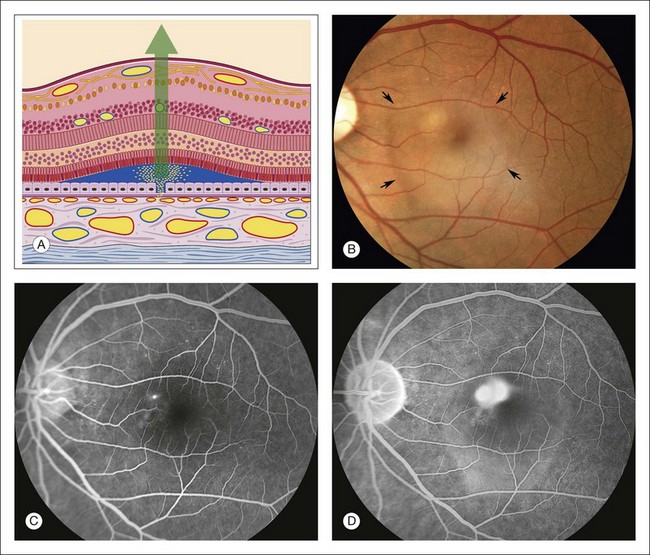
Fig. 1.54 Late hyperfluorescence, subretinal pooling: central serous chorioretinopathy. (A) Schematic drawing of retina shows a sensory retinal detachment. There is a break in the pigment epithelium. Fluorescein flows from the choriocapillaris through Bruch’s membrane, through the break in the pigment epithelium, and into the subretinal space, under the detached retina. (B) Color photograph of left macula shows a shallow sensory detachment (arrows). Just superonasal to the fovea is a small white area with a gray center. The fluorescein angiogram will reveal that this is the area of the leak. (C) Arteriovenous phase of fluorescein angiogram shows a hyperfluorescent spot that was seen on stereoangiography to be leakage of fluorescein coming from the pigment epithelium. (D) Late phase of fluorescein angiogram shows that the spot of pigment epithelial leakage has enlarged and become fuzzy. This is the release of fluorescein molecules into the fluid under the detached sensory retina. Comment: This patient had central serous chorioretinopathy. There was a break in the pigment epithelium that allowed leakage of fluorescein through it and into the subretinal space. Late hyperfluorescence means leakage, and in this case, there is pooling of fluorescein under the detached retina.
Depending on the specific disease, the late angiogram may or may not portray the full fluorescent filling of the subretinal fluid. For example, in central serous chorioretinopathy the leakage is gradual, and fluorescence of the subsensory retinal fluid will not be complete. In other conditions, such as subretinal neovascularization, fluorescein leakage is profuse, and the subsensory fluid often completely fluoresces (Fig. 1.55).
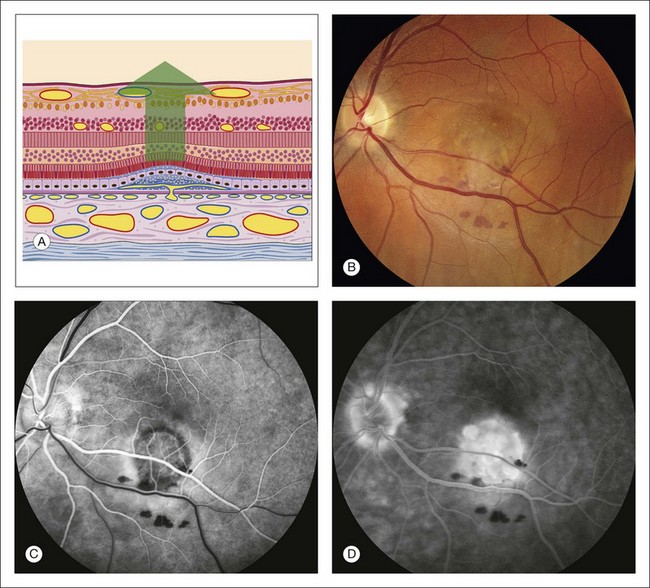
Fig. 1.55 Late hyperfluorescence, leakage, and pooling under the sensory retina caused by subretinal neovascularization, resulting in a sensory retinal detachment. (A) Schematic of the retina showing that it has detached (photoreceptors are separated from pigment epithelium). Vessels have proliferated from the choriocapillaris through Bruch’s membrane. There is a fibrovascular scar involving the pigment epithelium. The sensory retina is detached. (B) Color photograph of left macula shows a pale gray lesion in the inferior portion of the macula with some associated hemorrhage. (C) Arteriovenous phase of fluorescein angiogram shows a patch of subretinal neovascularization inferior to the fovea; this is evidenced by the lacy, irregular hyperfluorescence in this area. (D) Late phase of fluorescein angiogram shows fuzzy fluorescence. There is pooling of fluorescein under the detached retina and some staining of the fibrous tissue associated with the subretinal neovascularization. Comment: This patient had a patch of subretinal neovascularization with a great deal of leakage, causing a sensory detachment. The early-phase angiogram showed the vascular nature of the lesion, and the late-phase angiogram showed the leakage and pooling in the subretinal space.
In contrast to the attachment of the sensory retina, the basement membrane of the pigment epithelium adheres firmly to the collagenous fibers of Bruch’s membrane. The firm adhesion and wide angle of detachment make it easy to discern a pigment epithelial detachment ophthalmoscopically. Occasionally a light-orange ring appears around the periphery of a pigment epithelial detachment, further facilitating identification (Fig. 1.56).
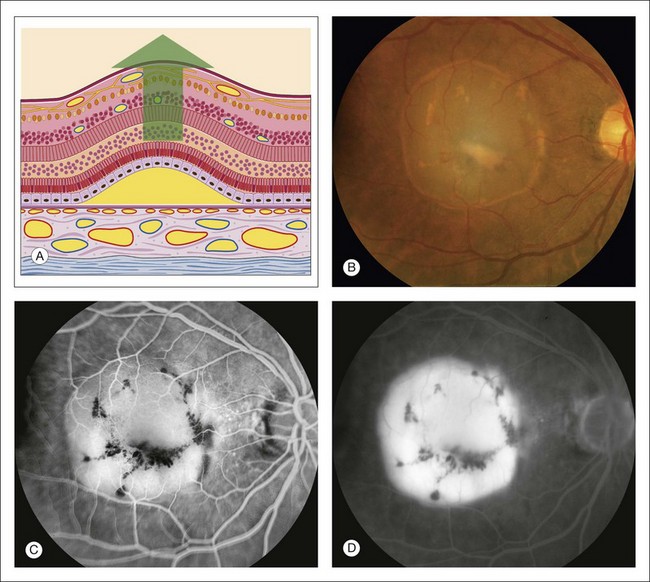
Fig. 1.56 Late hyperfluorescent pooling under the retinal pigment epithelium (pigment epithelial detachment). (A) Schematic diagram illustrating detachment and elevation of the pigment epithelium; the pigment epithelium is separated from Bruch’s membrane. Because the attachment of the pigment epithelium to Bruch’s membrane is quite firm, the angle of detachment is quite large. (B) Color photography of right macula shows a round detachment of the pigment epithelium. (C) Early arteriovenous phase of fluorescein angiogram shows early fluorescence from the area of detachment pigment epithelium. (D) Late-phase angiogram of right macula shows well-demarcated hyperfluorescent pooling of fluorescein under the detached pigment epithelium. Comment: Fluorescein flows freely through Bruch’s membrane and stops at the pigment epithelium. When the pigment epithelium is detached, the fluorescein flows right through Bruch’s membrane into the space made by the detached pigment epithelium. Therefore a pigment epithelial detachment fluoresces evenly and slowly (like a light bulb on a rheostat) and shows intense hyperfluorescent pooling that is well demarcated (indicating its well-defined angle of attachment) late in the angiogram.
Pooling of fluorescein under a sensory retinal detachment in central serous retinopathy takes place slowly, since the dye passes through one or more points of leakage in the defective pigment epithelium (Fig. 1.54). When leakage comes from subretinal neovascularization (Fig. 1.55) or a tumor (Fig. 1.47), it is more rapid and complete. When the pigment epithelium is detached from Bruch’s membrane, fluorescein passes freely and rapidly through Bruch’s membrane from the choriocapillaris into the subpigment epithelial space (Fig. 1.56).
In some cases of central serous chorioretinopathy, there is an associated pigment epithelial detachment, and pooling under each (sensory retinal detachment and the pigment epithelial detachment) is evident. Occasionally, the edge of a pigment epithelial detachment may tear, or rip, and allow fluorescein dye to pass freely into the subretinal space (Fig. 1.57). Drusen may also show late hyperfluorescence similar to that seen with a pigment epithelial detachment (Fig. 1.58). In some cases of pigment epithelial detachment, especially in older patients, subretinal neovascularization is also present. This combination of subretinal neovascularization and pigment epithelial detachment results in an interesting angiogram that can be challenging to interpret (Fig. 1.59).
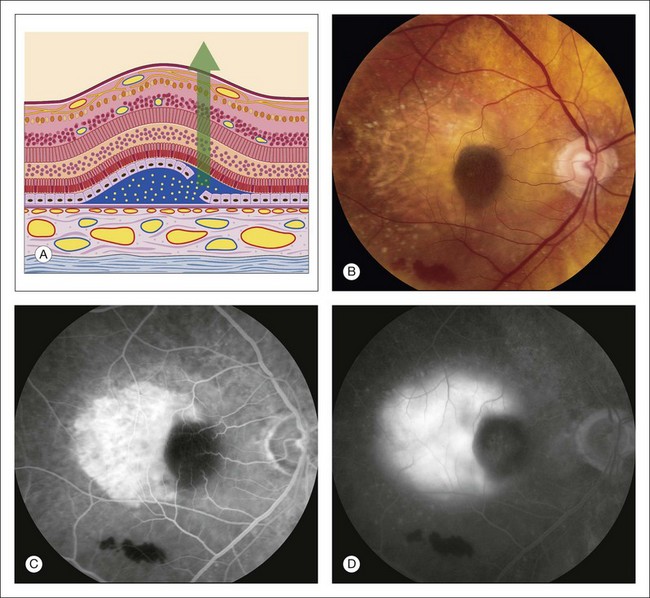
Fig. 1.57 Late hyperfluorescence under the retina – leakage from the choroid due to a retinal pigment epithelial (RPE) rip. (A) Schematic of a pigment epithelial detachment that has developed a tear along one edge. The barrier function of the pigment epithelium is lost and fluorescein dye can diffuse easily and rapidly in the subretinal space. (B) Color photography of right macula showing a round dark area under the fovea, and light (depigmented) area extending temporally. In the inferior portion of the macula, some subretinal hemorrhage is seen. (C) Early arteriovenous-phase fluorescein angiogram shows bright hyperfluorescence of the depigmented area temporally, and hypofluorescence under the fovea as well as inferiorly in the area of the subretinal blood. (D) Late-phase fluorescein angiogram shows pooling of fluorescein under the retina where the dye has been able to diffuse freely through Bruch’s membrane in the sensory retinal detachment. Comment: This patient developed a tear of the pigment epithelial detachment. The dark area under the fovea is where the pigment epithelium has rolled up after tearing away from the area temporally. The area temporal to the macula appears light due to absence of the RPE in this area. Since the RPE barrier is absent in this area, the dye diffuses readily and rapidly into overlying sensory retinal detachment, producing late pooling of fluorescein.
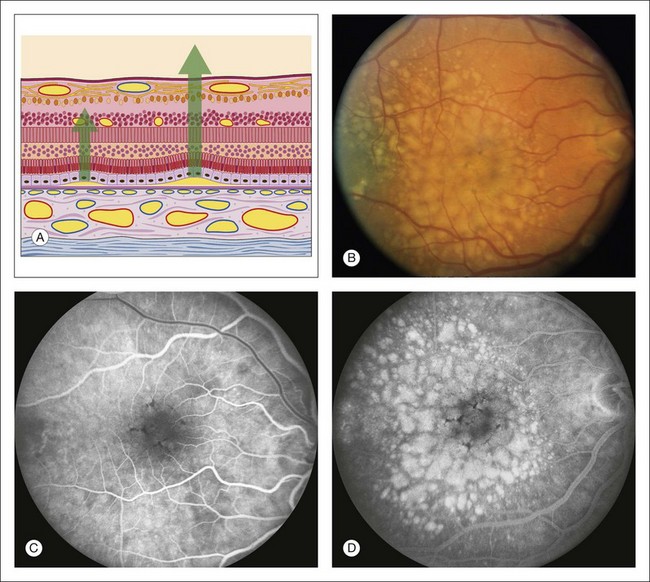
Fig. 1.58 Late hyperfluorescent pooling (or staining) of large drusen. (A) Schematic section of retina shows progressively larger detachments of pigment epithelium. Drusen deposit between the pigment epithelium and Bruch’s membrane and lift the pigment epithelium up, forming small or large pigment epithelial detachments, depending on the size of the drusen. (B) Color photograph of right macula shows multiple, pale, round, and variably sized drusen. (C) Arteriovenous phase of fluorescein angiogram shows some early hyperfluorescence of the areas of the drusen. (D) Late phase of fluorescein angiogram shows marked hyperfluorescence of the drusen. The larger drusen take longer for the hyperfluorescence to develop. Comment: The larger the drusen, the more similar they are to pigment epithelial detachments, and therefore the more likely it is that they will show pooling of fluorescein (or staining of the drusen material).
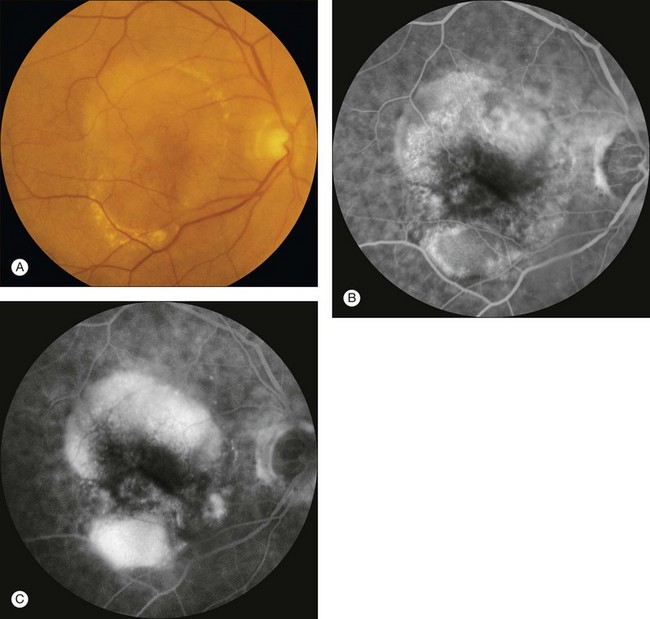
Fig. 1.59 Pigment epithelial detachment with associated (suspicious) subretinal neovascularization. (A) Color photograph of right macula. Note the pigment epithelial detachment temporally and sensory retinal detachment. (B) Arteriovenous-phase fluorescein angiogram shows early hyperfluorescence of the superotemporal pigment epithelial detachment. (C) Late-phase fluorescein angiogram of left macula shows that the fluorescence of the pigment epithelial detachment temporally has increased significantly. Comment: This patient had an irregularly shaped pigment epithelial detachment, which is a sign of possible choroidal neovascularization. The irregular, fuzzy hyperfluorescence is due to likely occult choroidal neovascularization.
Staining
Drusen: The most common form of staining occurs with drusen. Most drusen hyperfluoresce early in the angiogram because choroidal fluorescence is transmitted through defects in the pigment epithelium overlying the drusen (Fig. 1.34). Fluorescence from most small drusen diminishes as the dye leaves the choroidal circulation. However, some larger drusen display later hyperfluorescence or staining (Fig. 1.58). The larger the drusen, the more likely they will retain fluorescein and staining will occur. When drusen are large and have smooth edges, the late staining on the angiogram is similar in appearance to that of pooling of fluorescein under a pigment epithelial detachment. In many cases it is difficult, if not impossible, to differentiate large drusen from small pigment epithelial detachments: they have a similar ophthalmoscopic, fluorescein angiographic, and even microscopic appearance.
Scar: Scar tissue retains fluorescein and usually demonstrates well-demarcated hyperfluorescence because little, if any, fluid surrounds the scar. Later in the healing process, when only a few vessels remain, the early angiogram is hypofluorescent because of the paucity of vessels and blockage by the scar tissue. The most commonly seen scar tissue is the disciform scar, which is the endstage of subretinal neovascularization. Scarring is also seen following numerous other insults to the pigment epithelium and choroid, especially inflammation (Fig. 1.60).
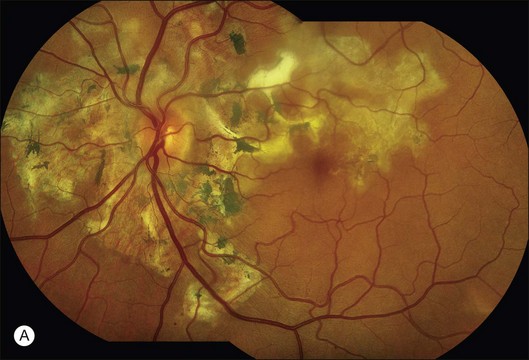
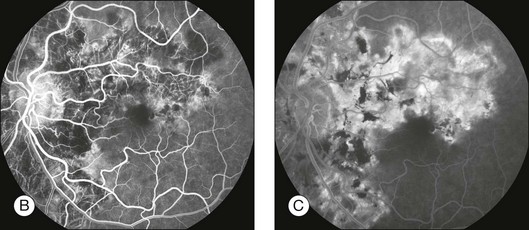
Fig. 1.60 Late hyperfluorescence and leakage – staining in geographic helicoid peripapillary choroidopathy (GHPC). (A) Color montage of left disc and macula shows large geographic areas of atrophy of pigment epithelium and choriocapillaris. There is some hyperplasia of the pigment epithelium noted as hyperpigmentation (especially in the macula and papillomacular bundle). Some fibrous scar tissue is present. (B) Arteriovenous-phase fluorescein angiogram shows that the geographic lesions are mostly hypofluorescent; they are caused by loss of pigment epithelium and choriocapillaris. Note that the large choroidal vessels can be seen within these lesions, indicating that the pigment epithelium and choriocapillaris are both gone. There is some hyperfluorescence along the edges of the geographic lesions. The pigment epithelial hyperplasia causes blocked fluorescence. (C) Late fluorescein angiogram of left macula shows hyperfluorescent staining along the edges of the geographic lesion. Comment: This patient had GHPC; inflammation of choroid and pigment epithelium resulted in a loss of the pigment epithelium and choriocapillaris and some of the choroid. The angiogram showed that only large choroidal vessels remained within these lesions. The choriocapillaris was intact, however, in the normal tissue adjacent to the geographic atrophic tissue. The normal choriocapillaris leaked into the atrophic area in a horizontal fashion, causing late hyperfluorescence of areas of scar tissue and some scleral staining.
Sclera: In several situations the sclera is visible ophthalmoscopically and exhibits late hyperfluorescent staining on fluorescein angiography. Scleral staining is best seen when the retinal pigment epithelium is very pale (as in a blonde patient) or when the choriocapillaris is fully intact. When the choriocapillaris is not intact, fluorescein staining of the sclera can occur from the edges of the atrophic area where fluorescein leaks from the intact choriocapillaris inward toward the atrophy (Fig. 1.60).
References
1. Novotny, HR, Alvis, DL. A method of photographing fluorescence in circulating blood in the human retina. Circulation. 1961;24:82–86.
2. Rabb, MF, Burton, TC, Schatz, H, et al. Fluorescein angiography of the fundus: a schematic approach to interpretation. Surv Ophthalmol. 1978;22:387–403.
3. Schatz, H. Letter: flow sheet for the interpretation of the fluorescein angiograms. Arch Ophthalmol. 1976;94:687.
4. Gass, JD, Sever, RJ, Sparks, D, et al. A combined technique of fluorescein funduscopy and angiography of the eye. Arch Ophthalmol. 1967;78:455–461.
5. Haining, WM, Lancaster, RC. Advanced techniques for fluorescein angiography. Arch Ophthalmol. 1968;79:10–15.
6. Novotny, HR, Alvis, D. A method of photographing fluorescence in circulating blood of the human eye. Tech Doc Rep SAMTDR USAF Sch Aerosp Med. 1960;60-82:1–4.
7. Gass, JD. Atlas of macular diseases: diagnosis and treatment. St Louis: Mosby; 1970.
8. Yannuzzi, LA, Ober, MD, Slakter, JS, et al. Ophthalmic fundus imaging: today and beyond. Am J Ophthalmol. 2004;137:511–524.
9. Friberg, TR, Gupta, A, Yu, J, et al. Ultrawide angle fluorescein angiographic imaging: a comparison to conventional digital acquisition systems. Ophthalmic Surg Lasers Imaging. 2008;39:304–311.
10. Manivannan, A, Plskova, J, Farrow, A, et al. Ultra-wide-field fluorescein angiography of the ocular fundus. Am J Ophthalmol. 2005;140:525–527.
11. Moosbrugger, KA, Sheidow, TG. Evaluation of the side-effects and image quality during fluorescein angiography comparing 2 mL and 5 mL sodium fluorescein. Can J Ophthalmol. 2008;43:571–575.
12. Pacurariu, RI. Low incidence of side-effects following intravenous fluorescein angiography. Ann Ophthalmol. 1982;14:32–36.
13. Lipson, BK, Yannuzzi, LA. Complications of intravenous fluorescein injections. Int Ophthalmol Clin. 1989;29:200–205.
14. Lu, VH, Ho, IV, Lee, V, et al. Complications from fluorescein angiography: a prospective study. Clin Exp Ophthalmol. 2009;37:826–827.
15. Zografos, L. [International survey on the incidence of severe or fatal complications which may occur during fluorescein angiography.]. J Fr Ophtalmol. 1983;6:495–506.
16. Chen, LJ, Yeh, SI. Computer-assisted image processing for a simulated stereo effect of ocular fundus and fluorescein angiography photographs. Ophthalmic Surg Lasers Imaging. 2010;41:293–300.
17. Watzke, RC, Klein, ML, Hiner, CJ, et al. A comparison of stereoscopic fluorescein angiography with indocyanine green videoangiography in age-related macular degeneration. Ophthalmology. 2000;107:1601–1606.
18. Patz, A, Finkelstein, D, Fine, SL, et al. The role of fluorescein angiography in national collaborative studies. Ophthalmology. 1986;93:1466–1470.
19. Arnold, AC, Hepler, RS. Fluorescein angiography in acute nonarteritic anterior ischemic optic neuropathy. Am J Ophthalmol. 1994;117:222–230.
20. Segato, T, Piermarocchi, S, Midena, E. The role of fluorescein angiography in the interpretation of optic nerve head diseases. Metab Pediatr Syst Ophthalmol. 1990;13:111–114.