17. Enteral Nutrition *
Marianne Sollosy Anderson, Linda Lee Wood, Jacqueline A. Keller and William W. Hay Jr.
Advances in perinatal care have decreased morbidity and mortality for many infants, 80 but the provision of adequate and optimal nutrition to support term and preterm infants in the neonatal intensive care unit continues to be a difficult, though important, challenge. Recent research in neonatal nutrition has provided some evidence-based guidance for clinicians, resulting in the adoption of earlier, more substantial parenteral and enteral strategies for nutrition of newborn infants, particularly those born very preterm. Other research has emphasized the importance of early enteral feeding for the best support of gastrointestinal development, somatic growth, metabolic homeostasis, prevention of infection, and future health. Together, such research has demonstrated that immediate parenteral support and early enteral feedings are fundamental and not optional in neonatal management.
This chapter provides an overview of the physiology of fetal and neonatal nutrition and growth, gastrointestinal anatomic and functional development, and the fundamentals of neonatal nutritional requirements. More specific detail about the assessment and monitoring of growth, feeding strategies and techniques, and the possible complications of enterally feeding at-risk infants is included. The ongoing nutritional needs of infants recovering from complications of preterm birth and other disorders also are presented, as well as the elements of providing for those needs after hospital discharge.
PHYSIOLOGY
Fetal Growth
Fetal growth is regulated by complex genetic, nutritional, endocrine, environmental, and epigenetic factors. 15,42,117 Genetic potential alone has a relatively minor impact. 64,65 Maternal factors such as prepregnancy weight and weight gain during pregnancy directly correlate with fetal size. 1,13,62,114 The quality of the maternal diet (protein, energy, vitamins, minerals) also directly affects fetal growth. 94 In general, however, a large maternal reserve of nutrients is available to the fetus, and in most circumstances, changes in maternal diet do not limit fetal growth.
The growth and function of the placenta strongly determine fetal growth by providing oxygen and essential nutrients. 21,57,58,97 Critical fetal anabolic hormones, such as the insulin-like growth factors (IGF)–I/II and insulin, are regulated by circulating concentrations of nutrients and are themselves regulators of fetal nutrient uptake and metabolism. Apancreatic infants, who have no circulating insulin, are among the most severely growth restricted of all newborns (Figure 17-1); infants of diabetic mothers, who respond to increased maternal-fetal glucose delivery with increased insulin secretion, are among the largest (Figure 17-2). Thyroid hormone also contributes to fetal growth by regulation of oxidative metabolism. Infants with other endocrine deficiencies, such as those resulting from anencephaly, panhypopituitarism, or hypothyroidism, are near normal in age-specific size at birth, indicating a complex interplay between the fundamentally required supply of nutrients to the fetus and the supporting roles of the fetal endocrine milieu that regulates intrauterine growth.
 |
| FIGURE 17-1
(From Hill D: Effect of insulin on fetal growth, Semin Perinatol 2:319, 1978.)
|
 |
| FIGURE 17-2
(Courtesy Newborn Service, University of Colorado Hospital, Denver, Colo [WW Hay, Jr].)
|
Gastrointestinal Development
Enteral feeding continues to support gastrointestinal development that begins in early fetal life. The fetal gut is anatomically complete by 20 to 22 weeks after conception; functional development of the gastrointestinal system begins in utero and continues into infancy (Table 17-1). In utero, the fetal intestine is exposed to nutrients and growth factors from the mother, placenta, amniotic fluid, and the fetal tissues. The fetal gut is in communication with the external amniotic fluid environment by 7 weeks post-conception, and early development and functional priming are supplied by growth factors, enzymes, immunoglobulins, and hormones present in that fluid. 87 Fetal swallowing can be observed as early as 11 weeks’ gestation. 29 The components of the amniotic fluid, including carbohydrates and amino acids, change during development, as does the volume of amniotic fluid ingested, varying from a few milliliters per day to more than 450 mL per day, or 20% of fetal weight, late in gestation. 10 Amniotic fluid contains growth factors that promote gut cell differentiation. Such growth factors and nutrients in the amniotic fluid stimulate production of enteric hormones that act locally to promote further gut development. The timing of the appearance of gastrointestinal hormones, polypeptides, neurotransmitters, and digestive enzymes in the fetus is variable, but most are present in the gastrointestinal tract by the end of the first trimester of pregnancy. Nutrient transport systems are in place by 14 weeks for amino acids, 18 weeks for glucose, and 24 weeks for fatty acids.
| Developmental Marker | Weeks of Gestation |
|---|---|
| Gastrulation | 3 |
| Gut tube formed, early differentiation of foregut, midgut, and hindgut | 4 |
| Gut lumen in continuity with amniotic cavity | 7 |
| Growth of intestines into umbilical cord | 7 |
| Intestinal villus formation | 9 |
| Intestines into abdominal cavity | 10 |
| Δ glucosidase, dipeptidase, lactase enzymes | 10 |
| Glucose transporters | 10 |
| Liver lobules, bile metabolism | 11 |
| Swallowing | 11 |
| Parietal cells, pancreatic islets, bile secretion | 12 |
| Stomach fundus, body, pylorus, greater and lesser curvature | 14 |
| Gastric glands | 14 |
| Intestinal crypts, elongation of intestinal villi | 14 |
| Intestinal lymph nodes | 14 |
| Differentiation of pancreatic endocrine and exocrine tissue | 14 |
| Active transport of amino acids | 14 |
| Sucking movements | 19 |
| Superficial esophageal glands | 20 |
| Gastric motility and secretion | 20 |
| Fatty acid absorption | 24 |
| Coordination of suck and swallow | 33-36 |
After birth, the gastrointestinal system must further adapt for enteral digestion, absorption, mucosal growth and differentiation, and peristalsis. Some gastrointestinal functions are “switched on” at birth (e.g., decrease in intestinal permeability, increase in mucosal lactase activity), regardless of the length of gestation. Others, however, are intrinsically “programmed” to occur at a certain post-conceptual age (e.g., the onset of peristalsis at 28 to 30 weeks and the coordination of suck, swallow, and breathing at 33 to 36 weeks). Environmental influences, including colonization of the gut by bacteria and the introduction of nutrients into the gut, also affect postnatal gastrointestinal and immunologic development. 2,18,77
Infants born before term have both anatomic and functional limits to the digestion and tolerance of enteral feedings. Neurologic maturation is important not only for coordination of sucking, swallowing, and breathing during feeding but also for gastrointestinal motility. Peristalsis in the esophagus is immature and bidirectional in the preterm infant, with forward movement of food to the stomach developing only near term. 56 Abnormal esophageal peristalsis and transient relaxations of the lower esophageal sphincter muscle likely contribute to the common problem of gastroesophageal reflux seen in preterm infants. Enteral feeding promotes the ongoing maturation and development of the gastrointestinal system in both the term and preterm infant. 17 Once enteral feedings are established, gastric emptying rate seems to be similar in term and preterm infants. 89,113
Intestinal motor activity in the preterm infant is immature and disorganized compared with that in term infants, with term infants having distinct fasting phases of gastrointestinal quiescence, nonmigrating motor activity, and migrating motor complexes. After feeding, term infants show a dramatic increase in the intensity of motor activity that is not observed in preterm infants. A measure of gastrointestinal motility is provided by the passage of stool within 24 hours of birth in more than 95% of full-term infants; however, the more preterm the infant, the greater the delay in passing the first stool. Coordinated, mature gastrointestinal motility and peristalsis with feeding develop in the preterm infant between 33 weeks and term.
Protein digestion and absorption are remarkably efficient in the preterm infant despite the fact that enterokinase, a rate-limiting enzyme in the activation of pancreatic proteases, has only 20% of activity found in the term newborn and 10% of adult activity. In the newborn, protein digestion is aided by the activity of brush border and cytosolic peptidases. Carbohydrate absorption is limited by a relative deficiency of lactase, which splits lactose into glucose and galactose. Lactase in the infant of less than 34 weeks’ gestation is present at only about 30% of the activity found in the normal term infant, although lactose intolerance is rare in these infants, particularly when they are fed human milk. Preterm infants malabsorb 10% to 30% of dietary fat because of a small bile acid pool size and relative lack of pancreatic lipase. 78 Some compensation is provided by lingual and gastric lipases, as well as the lipase present in human milk. Despite relative deficiencies in many enzymes important in nutrient processing, the preterm infant usually can digest and absorb complex nutrient mixtures such as human milk quite effectively.
Postnatal Growth of Preterm Infants
After birth, usual nutritional regimens, even when provided more aggressively, fail to produce growth rates in preterm infants that mimic normal rates of intrauterine growth, the accepted goal of nutrition for the preterm infant. 27,32,96 A variety of complications contribute to this growth failure, but the primary problem is that most preterm infants are fed less protein and calories immediately after birth than are needed to support normal fetal rates of protein accretion and body growth. In addition, the preterm infant is exposed to environmental factors that increase energy expenditure, including low relative humidity and radiant and convective heat losses, as well as energy-consuming demands of breathing, resistance to gravity, and the processes of digestion, absorption, and synthesis of nutrients into body structure. Stress-induced hormones that are catabolic in sick infants, particularly corticosteroids and catecholamines, limit the production and action of anabolic growth factors, particularly insulin and IGFs, further preventing normal rates of growth and weight gain at rates comparable to those of healthier infants of the same gestational age. Overall, however, even in sick or physiologically unstable infants, the principal factor causing postnatal growth failure is delayed and inadequate intake of protein and energy. 32
After birth, all infants lose excess extracellular salt and water. Term infants usually lose 5% to 8% of birth weight by the third day of life. In extremely-low-birth-weight (ELBW, <1000 g birth weight) preterm infants, normal diuresis and fluid management strategies to limit fluid overload over the first 10 to 14 days of life usually produce a net loss of body weight. Such infants may lose 8% to 15% of birth weight. Further weight loss and failure to gain weight are exacerbated by inadequate nutritional support, particularly of protein and energy. Deficits accumulated daily during early neonatal life may take weeks to months to replenish. Accurate measurement of body length can be helpful in the early newborn period. More recent methodologies to assess the neonate include (1) dual x-ray absorptiometry (DXA), and (2) air displacement plethysmography, which partitions new tissue accrual into water, fat, and lean body mass components, thus helping define needs for additional specific nutrients (protein, lipids, carbohydrates) for body growth (even during the early postnatal period of fluctuating water weight). Early provision of both adequate calories and protein to sustain optimal nutrition is difficult without the addition of parenteral nutrition for preterm infants and sick infants of all gestational ages (see Chapter 16).
Assessment of Growth and Nutritional Status
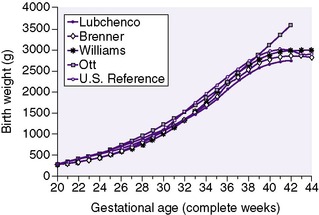
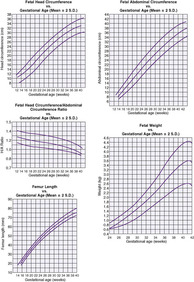
The generally accepted goal of postnatal nutrition for preterm infants is to achieve and maintain the normal rate of intrauterine growth (Figure 17-3). Unfortunately, there is no clear standard for normal fetal growth. Many growth curves have been developed from anthropometric measurements taken at birth in populations of infants born at different gestational ages. 3,32 Because preterm birth is not a normal outcome, cross-sectional anthropometric measurements obtained at birth do not accurately describe normal growth parameters for any given gestational age. Growth curves based on serial ultrasound measurements of fetuses who were born at term in healthy condition and with normal measurements provide continuous, rather than cross-sectional, data that correlate better with the expected fetal growth rate of a particular fetus or newborn (Figure 17-4). 16,36For the average, appropriately grown, preterm infant, expected weight gain is approximately 15 to 20 g/kg/day.
 |
| FIGURE 17-3 |
We lack good methods to assess nutritional adequacy over time in very small infants. Rates of change in anthropometric measurements provide some retrospective information, but they do not tell us what an infant needs to maintain a normal growth rate (Box 17-1; Figure 17-5). Too often, growth charts simply document the failure to provide adequate nutrition during the previous days to weeks. Indirect calorimetry offers some advantage, but instruments that are clinically practical and sufficiently accurate to quantify nutrient metabolism in tiny infants are not yet available. Similarly, application of stable isotope methodology to measure utilization and oxidation rates of individual nutrients remains confined to large medical centers with expensive and sophisticated mass spectrometry facilities. Evaluation of an individual infant’s immediate nutrient requirements and responses to the administration of different mixtures and amounts of nutrients remains an elusive but still necessary goal.
BOX 17-1
1. Weight is subject to large variations based on fluctuations in fluid balance (e.g., presence or absence of edema, congestive heart failure, renal failure) and attached equipment (e.g., intravenous lines and boards, endotracheal tubes). Infant weight should be measured daily as follows:
a. Use the same scale and weigh infant naked or using supportive weighing method as possible. Supportive weighing, or swaddled weights, help ensure an infant’s physiologic and behavioral stability during the weighing procedure. 61 Remove “attached” equipment if possible, or weigh similar items separately and subtract from total weight. Swaddled weights are equal to the naked weight after the weight of the diaper and blanket are subtracted. Unswaddled weights still can be used to improve accuracy for very small infants or if swaddling puts the infant at risk or interferes with the infant’s care needs. In-bed scales are useful for extremely-low-birth-weight infants or infants who become unstable with handling. An electronic scale that averages several measurements reduces movement artifact and may be useful for active infants.
b. Reference standards for the weights of nursery equipment (e.g., diapers, intravenous boards, tubing, endotracheal tubes) should be available for nursery use.
c. Weigh the infant at the same time daily, preferably before a feeding.
d. Record the infant’s weight, the time of weight measurement, and the scale used on the chart. Energy (calories) and fluid intake should be recorded on the same chart. This information combined with biochemical parameters (e.g., serum electrolytes, hemoglobin, albumin) and the physical examination provides the best overview of the infant’s nutritional status. Daily weight should be plotted on the appropriate preterm or term growth chart. Weekly review of the infant’s weight change provides useful information on trends in overall growth or weight loss that may be overlooked in the daily charting.
2. Crown-heel length and head circumference are measured and recorded on admission and at least weekly thereafter. Accurate length measurements are difficult to obtain without special equipment such as a length board, but accuracy can be improved by repeated measurements and use of the tonic-neck reflex to straighten the hip and knee. Increase in head circumference is used as an indicator of brain growth.
a. To measure the crown-heel length, place the infant supine on a firm surface with the knees extended and the ankles flexed 90 degrees. Measure the length from the top of the head (crown) to the bottom of the heel.
b. Head circumference is obtained using a paper or soft tape measure. Record the largest measurement obtained with the tape placed over the frontal, parietal, and occipital prominences.
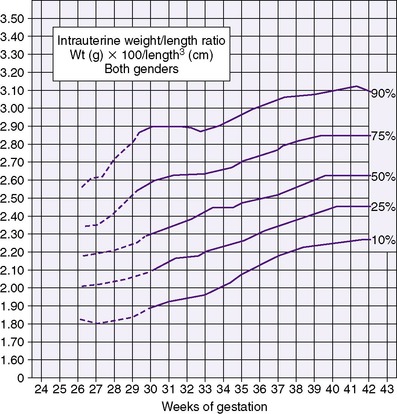
3. The ponderal index (or weight-length index; see Figure 17-5) is used to assess “quality” of growth. The index is calculated as the weight in grams multiplied by 100, divided by the cube of the length in centimeters. True organ growth and tissue accretion are accompanied by increases in both weight and length and can be evaluated partly using the ponderal index.
4. Biochemical monitoring of the growing infant may include periodic measurement of serum electrolytes, calcium, phosphorus, alkaline phosphatase, total protein, albumin, and hemoglobin. These data can be used to help prevent specific deficiencies in the diet, such as hyponatremia in preterm infants with excessive renal solute losses or hypophosphatemia with increased alkaline phosphatase as seen in rickets and osteopenia.
 |
| FIGURE 17-5
(From Lubchenco L, Hansman C, Boyd E: Intrauterine growth in length and head circumference as estimated from live birth at gestational ages from 26 to 42 weeks. Reproduced with permission from Pediatrics 37:403, 1966, copyright by the American Academy of Pediatrics.)
|
NUTRITIONAL REQUIREMENTS
Nutritional requirements should be considered in general categories: energy (or calories), protein, carbohydrate, fats, minerals and solutes, and vitamins. Water requirements and limits also must be considered when designing nutrition support strategies. The source, complexity, and constituents of these nutrients are important, as well as the route of administration. Box 17-2 on p. 405 lists commonly used nutritional conversion factors and formulas. See Chapter 16 for parenteral nutrition and Chapter 18 for breast feeding.
BOX 17-2
Energy
1 kcal = 4.184 kJ
Gross energy (kcal/g)
Protein = 5.65
Carbohydrate = 3.95
Fat = 9.25
Metabolizable energy (kcal/g)
Protein = 4
Carbohydrate = 4
Fat = 9
Protein
Total protein (g/dL) = total nitrogen (g/dL) × 6.25
Vitamins
1 International unit vitamin A = 0.3 retinol equivalent
= 0.3 mcg retinol
= 1.8 mcg beta-carotene
400 International units vitamin D = 10 mcg vitamin D
1 International unit vitamin E = 1 mg dl-α-tocopherol
Minerals
1 mEq Na = 1 mmol Na = 23 mg Na
1 mEq K = 1 mmol K = 39 mg K
1 mEq Cl = 1 mmol Cl = 35 mg Cl
2 mEq Ca = 1 mmol Ca = 40 mg Ca
1 mmol P = 31 mg P
Osmolarity (mOsm/L) = Osmolality (mOsm/kg H 2O) × kg H 2O/L solution
Renal solute load (mOsm/dL) = [Protein (g/dL)] × 4 + [Na + K + Cl (mEq/dL)]
Potential renal solute load (mOsm/dL) = [Protein (g/dL)] × 5.7 + [Na + K + Cl (mEq/dL)] + [P (mg/dL)/31]
Energy
Negative energy balance is frequent in preterm infants because they have limited energy stores, high energy expenditures, and low intake. Energy requirements are determined by an infant’s total energy expenditure, energy excretion, and energy stored in new tissue as growth. Total energy expenditure can be subdivided into contributions of basal metabolic rate, activity, thermoregulation, and the energy costs of digestion and metabolism. Energy excretion is composed of fecal and urinary losses, as well as heat lost by radiation and evaporation. Nursing infants in thermoneutral, humidified incubators, starting at admission to the NICU, can substantially decrease energy expenditure in preterm infants. Estimates of energy requirements for growing preterm infants are shown in Table 17-2 on p. 406. The large range of these estimates reflects the variability of infant activity and environmental conditions. Therefore it is essential to adjust nutrient delivery to individual requirements. For example, if an infant is particularly active and showing poor growth, nutrient delivery should be adjusted upward accordingly.
| European Society of Gastroenterology and Nutrition | |||
|---|---|---|---|
| Factor | American Academy of Pediatrics | Average | Range |
| Energy expenditure | |||
| Resting metabolic rate | 50 | 52.5 | 45-60 |
| Activity | 15 | 7.5 | 5-10 |
| Cold stress | 10 | 7.5 | 5-10 |
| Energy cost of digestion | 8 | 17.5 | 10-25 |
| Energy stored | 25 | 25 | 20-30 |
| Energy excreted | 12 | 20 | 10-30 |
| Total requirements | 120 | 130 | 95-165 |
Caloric requirements for the healthy term infant average 110 kcal/kg/day, much lower than the energy requirements of preterm infants. Increased energy requirements can be anticipated during sepsis, acute and chronic respiratory illness, and recovery from surgery (Figure 17-6). Daily caloric intake should be calculated for each infant growing or recovering from illness in the neonatal intensive care unit. A useful approach for calculating caloric intake is shown in Box 17-3 on p. 407.
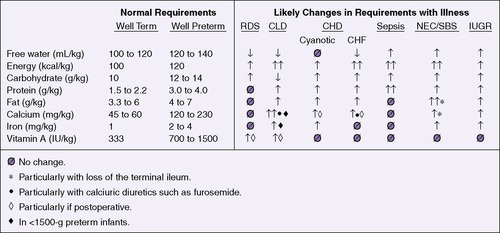 |
| FIGURE 17-6
(Modified from Thureen P, Hay WW Jr: Conditions requiring special nutritional management. In Tsang RC, Lucas A, Uauy R, et al, editors: Nutritional needs of the preterm infant, Baltimore, 1993, Williams & Wilkins.)
|
BOX 17-3
Conversion Factors
20 kcal/oz = 0.67 kcal/mL
24 kcal/oz = 0.80 kcal/mL
1 kcal = 1 calorie
1 oz = 30 mL
Calculation
1. Add total daily feeding intake (in mL)
2. Divide total intake (mL) by the infant’s weight (kg)
This equals enteral intake in mL/kg/day
3. Multiply mL/kg/day intake by kcal per ounce of feeding
4. Multiply by 1 oz/30 mL
This equals enteral intake in kcal/kg/day.
Protein
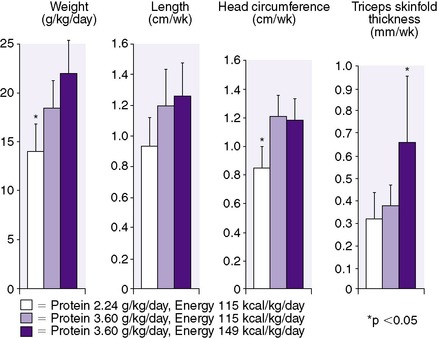
Protein accretion is critical for normal growth. The amount and type of protein necessary for optimal growth in preterm infants have been difficult to establish. Metabolic balance studies support a need for higher protein intakes in the growing preterm infant than in the term infant. Throughout the normal period of breast feeding, the concentration of protein in human milk decreases; however, the preterm infant’s need for protein continues to be much higher than the term infant. Mature human milk provides adequate protein to meet the recommended goals of 2 to 2.5 g/kg/day for term infants, but it is inadequate to meet the goals of 3.5 to 4 g/kg/day for preterm infants. 74 In one study, preterm infants receiving both protein and energy supplementation during enteral feedings (to as much as 3.6 g/kg/day protein and 149 kcal/kg/day energy) had increased gains only in length and head circumference in relation to increased protein intake. In the same study, extra energy increased primarily weight and triceps skinfold thickness, demonstrating the need for protein to grow bone, brain, and lean body mass, whereas excess energy leads primarily to increased fat deposition (Figure 17-7). 59,60 These benefits unique to protein and energy have since been supported by a Cochrane Review of the literature. 68
 |
| FIGURE 17-7
(From Kashyap S, Schulze KF, Forsyth M, et al: Growth nutrient retention and metabolic response in low-birth-weight infants fed varying intakes of protein and energy, J Pediatr 113:713, 1988; Kennaugh JM, Hay WW, Jr: Nutrition of the fetus and newborn, West J Med 147:435, 1987.)
|
Although infants with growth failure may be at higher neurodevelopmental risk, 40 it has been difficult to establish long-term benefits to developmental outcome with particular feeding strategies. Studies of preterm infants maintained on diets fortified with protein and energy have shown improved neurodevelopmental test scores in early life. Neurodevelopmental outcome appears to be even better when human milk is supplemented with protein and energy. 75,76 More recent studies have shown such benefits extended into adolescence when previously preterm infants had increased brain size, caudate nucleus volume, and intelligence quotient (IQ) in direct relation to their protein and energy intake during their postnatal period. 51,54
Human milk from an infant’s own mother is unique and the preferred source of protein for that newborn. Human milk contains whey-predominant protein (whey:casein ratio of 70-80: 30-20), whereas cow’s milk has a whey:casein ratio of 18:82. Whey protein is particularly rich in essential and conditionally essential amino acids. Milk expressed from mothers of preterm infants is somewhat higher in protein than milk from mothers of term infants. Nonetheless, fortification of preterm maternal milk with protein (as well as calcium, phosphorus, sodium, potassium, and lipid) usually is necessary to promote growth rates approximating those of normal human fetuses, particularly in the very-low-birth-weight (VLBW) preterm infant. 99 Given the multiple benefits of mother’s milk feeding for preterm infants, including provision of antimicrobial factors and improved feeding tolerance, mother’s milk feeding with protein and energy supplementation, (e.g., with Enfamil® Human Milk Fortifier produced by Mead Johnson Nutritionals or Similac® Human Milk Fortifier produced by Abbott Nutrition) is highly recommended (see Table 17-3 on p. 408). A human milk–based fortifier, ProlactPlus HMF™ (Prolacta Bioscience, Monrovia, Calif.), is also available.
| This table lists the major constituents; refer to product inserts for a complete listing of vitamins, minerals, and trace elements. | |||
| MCT, Medium-chain triglyceride. | |||
| *Data from Klein CJ, editor: Nutrient requirements for preterm infant formulas, J Nutr 132:1395S, 2002. |
|||
| †Mead Johnson Nutritionals, Evansville, Indiana. |
|||
| ‡Ross Products Division, Abbott Nutrition, Columbus, Ohio. |
|||
| Human Milk Fortifiers (per 4 Packets) | |||
|---|---|---|---|
| Mature Preterm Human Milk (28 Days, Approximate per 100 mL*) | Enfamil® Human Milk Fortifier† | Similac® Human Milk Fortifier‡ | |
| Energy (kcal) | 67-75 | 14 | 14 |
| PROTEIN | |||
| Amount (g) | 1.3-1.8 | 1.1 | 1 |
| Source | Human milk | Milk protein isolate and whey protein isolate hydrolysate | Nonfat milk and whey protein concentrate |
| Whey:casein ratio | 70-80:20-30 | 60:40 | 60:40 |
| FAT | |||
| Amount (g) | 3-3.9 | 1 | 0.36 |
| Source | Triglycerides | MCT oil (70%)Soy oil (30%) | MCT oil |
| CARBOHYDRATE | |||
| Amount (g) | 6-11 | <0.4 | 1.8 |
| Source | Lactose and glucose | Mineral salts and corn syrup solids | Corn syrup solids |
| MINERALS | |||
| Calcium (mg) | 25 | 90 | 117 |
| Phosphorus (mg) | 13 | 50 | 67 |
| Sodium (mEq)) | 0.9 ± 0.2 | 0.7 | 0.7 |
| Potassium (mEq) | 1.2 ± 0.3 | 0.7 | 1.6 |
| Chloride (mEq) | 1.5 ± 0.2 | 0.4 | 1.1 |
| Iron (mg) | 0.2 | 1.44 | 0.35 |
| Zinc (mg) | 0.3 | 0.72 | 1 |
| Magnesium (mg) | 3 | 1 | 7 |
| OTHER CHARACTERISTICS | |||
| Potential renal solute load (mOsm/100 mL) | 12.6 | 9.7 | 11.2 |
| Osmolality (mOsm/kg water) | 290 | +35 (above human milk when mixed) | +90 (above human milk when mixed) |
An average protein intake of 3.5 g/kg/day is recommended for most preterm infants born before 30 weeks’ gestation. Protein requirements are higher (4.0 g/kg/day) in ELBW infants (i.e., <27 weeks’ gestation and <1000 g). Growth should be monitored and supplementation provided expectantly. Term infants in general do not require protein or energy supplementation unless their dietary fluid is restricted because of illness (e.g., congestive heart failure).
The amino acid profile in the newborn diet is as important as the amount of protein provided. Growth rate of lean body mass is determined directly by the intake of the essential amino acids. Conditionally, or developmentally, essential amino acids (those that are uniquely required in larger amounts at certain developmental stages and cannot be synthesized at sufficient rates for requirements [e.g., cysteine, taurine, histidine, arginine, lysine]) also are important to the infant, especially if preterm. Normal growth, energy metabolism, and immune function depend on appropriate availability of these amino acids. Particularly in the rapidly growing infant, growth requirements may not be met by the relatively limited intake of essential amino acids common with most current nutritional regimens or by the limited biosynthesis of conditionally essential amino acids.
Fat
Human neonates are unique among neonatal mammals in having a relatively high white fat content of 16% to 18% of body weight at term. The term infant also has stores of brown fat, which is necessary for neonatal thermogenesis. In utero fat deposition occurs predominantly during the last 12 to 14 weeks of gestation. Thus infants born preterm are deficient in fat stores, both for use as energy and for thermogenesis. Dietary fats are important to sustain growth, provide essential fatty acids, and promote the absorption of fat-soluble vitamins. Newborn infants absorb fat less efficiently than older children. Preterm infants demonstrate even greater deficiencies in fat digestion and metabolism. Pancreatic lipase and bile acids are less available for fat digestion and absorption. Lingual and gastric lipases, present in newborn secretions, compensate for deficient pancreatic lipase, as does mammary gland lipase if the infant is receiving breast milk. Current recommendations for dietary fat consist of provision of 40% to 52% of total calories (4.4 to 5.7 g/100 kcal). Long-chain polyunsaturated fatty acids (LC-PUFAs) are essential for normal growth and development, particularly of the retina and brain. LC-PUFA supplementation, therefore, has been a topic of much discussion and research in recent years. Of particular interest are the n-3 and n-6 essential fatty acids, alpha-linolenic acid (ALA) and linoleic acid (LA), and their metabolites, docosahexaenoic acid (DHA) and arachidonic acid (ARA), respectively. 52 Both term and preterm human milk contain considerable quantities of linolenic acid. The preterm infant can synthesize DHA from its precursor linolenic acid, but whether the synthesized amount is sufficient remains uncertain. Human milk also contains preformed LC-PUFAs. In an effort to make formula more like the gold-standard human milk, manufacturers in the United States have added DHA and ARA to both term and preterm infant formulas.
LC-PUFA supplementation is thought to be safe for both term and preterm infants. 34,37,53,67 The evidence for long-term benefit, however, particularly for term infants, is mixed. 39,107 The inconsistent conclusions among studies have been recently reviewed. 48 For preterm infants, in whom PUFAs are particularly important for growth and brain and visual development and who have not had the opportunity for late gestation accumulation of fats, there may be benefit and little risk with supplementation. 39,66,102 Areas of ongoing research include (1) maternal supplementation of n-3 long-chain polyunsaturated fats to promote fetal growth and improve the length of gestation, (2) exploration of the effects of LC-PUFAs on preventing necrotizing enterocolitis, and (3) the relationship of neonatal fat composition to the development of atherosclerosis in later life.
Medium-chain triglycerides (MCTs) do not require bile salts for absorption and can be directly absorbed into the portal venous circulation. This offers theoretical advantages for the preterm infant, although there is little evidence that inclusion of MCTs improves growth of the healthy preterm infant. MCTs do improve fat absorption and energy intake in infants with hepatic dysfunction or short bowel syndromes.
Some fats (e.g., essential fatty acids) are essential for normal infant growth. All fatty acids provide a concentrated source of energy. The polyunsaturated n-3 fatty acids are important components of cell membranes, particularly significant for the developing nervous system. There is no place for “fat restriction” in the nutritional support of preterm or term infants within the guidelines just mentioned.
Carbohydrates
Carbohydrate reserves begin to accumulate as glycogen in the developing fetus as early as the start of the second trimester. Most of this glycogen (as much as 90% of total body glycogen in term infants) serves local cellular needs in different organs, whereas hepatic glycogen specifically provides glucose for other glucose-dependent tissues, primarily the brain. Immediately after birth, with cessation of glucose supply from the placenta, the neonate must use stored glycogen for energy. The newborn can exhaust the supply of stored glucose from the liver within 12 hours of birth under severely stressful conditions (e.g., hypoxia, hypotension, increased catecholamine and glucagon release) if food or IV glucose is not provided. The normal glucose utilization rate in the term newborn is 4 to 6 mg/kg/min. The brain accounts for most of the glucose use, especially in preterm and asymmetrically growth-restricted infants, who have a larger-than-normal brain:body-weight ratio.
The predominant carbohydrate in human milk is lactose, a disaccharide composed of glucose and galactose. Glucose has a central role in energy metabolism. Galactose provides 50% of the calories derived from lactose; its major metabolic role is in energy storage, because the newborn liver readily incorporates galactose from the portal circulation into hepatic glycogen.
Provision of 40% to 50% of total caloric intake as carbohydrate (12 to 14 g/kg/day) prevents accumulation of ketone bodies and other adverse metabolic effects (e.g., hypoglycemia) in the newborn. This amount of carbohydrate generally is supplied as lactose in human milk or commercial formulas. If there are signs of lactose intolerance, such as frequent loose stools, abdominal distention or apparent cramping, or positive stool reducing substances (Clinitest), then a portion of the carbohydrate may be given as sucrose or glucose polymers. Glucose polymers have the added advantage of keeping formula osmolality low. Lactose-free infant formulas are commercially available (Table 17-4). Use of such non-lactose products should be reserved for those rare infants with clinically proven lactose intolerance.
| This table lists the major constituents; refer to product inserts for a complete listing of vitamins, minerals, and trace elements. | |||||||
| ARA, Arachidonic acid; DHA, docosahexaenoic acid. | |||||||
| *Data from Klein CJ, editor: Nutrient requirements for preterm infant formulas, J Nutr 132:1395S, 2002; and Tsang RC, Uauy R, Koletzko B, et al, editors: Nutrition of the preterm infant: scientific basis and practical guidelines, ed 2, Cincinnati, 2005, Digital Educational Publishing. |
|||||||
| †Mead Johnson Nutritionals, Evansville, Ind. |
|||||||
| ‡Abbott Nutrition, Columbus, Ohio |
|||||||
| Cow’s Milk–Based | |||||||
|---|---|---|---|---|---|---|---|
| Lactose Free | Soy Protein–Based | ||||||
| Mature Human Milk (28 Days) * | Enfamil® Lipil® with Iron† | Similac® Advance® with Iron‡ | Enfamil® Lactofree® Lipil®† | Similac® Sensitive® with Iron‡ | Enfamil® ProSobee® Lipil®† | Similac® Isomil® Advance®‡ | |
| Nutrient density (kcal/oz) | 20 | 20 | 20 | 20 | 20 | 20 | 20 |
| Energy (kcal) | 98-110 | 100 | 100 | 100 | 100 | 100 | 100 |
| PROTEIN | |||||||
| Amount (g) | 1.8 | 2.1 | 2.07 | 2.1 | 2.14 | 2.5 | 2.45 |
| % Total calories | 7 | 8.5 | 8 | 8.5 | 9 | 10 | 10 |
| Source | Human milk | Reduced minerals; whey and nonfat milk | Nonfat milk and whey protein concentrate | Milk protein isolate | Milk protein isolate | Soy protein isolate | Soy protein isolate and l-Methionine |
| FAT | |||||||
| Amount (g) | 4.3-4.9 | 5.3 | 5.4 | 5.3 | 5.4 | 5.3 | 5.46 |
| % Total calories | 50 | 48 | 49 | 48 | 49 | 48 | 49 |
| Source | Triglycerides |
Palm olein
Soy oil
Coconut oil
High oleic vegetable oil
Single cell oil products (DHA and ARA)
|
High oleic safflower oil
Soy oil
Coconut oil
Single cell oil products (DHA and ARA)
|
Palm olein
Soy oil
Coconut oil
High oleic vegetable oil
Single cell oil products (DHA and ARA)
|
High oleic safflower oil
Soy oil
Coconut oil
|
Palm olein
Soy oil
Coconut oil
High oleic vegetable oil
Single cell oil products (DHA and ARA)
|
High oleic safflower oil
Soy oil
Coconut oil
Single cell oil products (DHA and ARA)
|
| Linoleic acid (mg) | 440-1500 | 860 | 1000 | 860 | 1000 | 860 | 1000 |
| CARBOHYDRATE | |||||||
| Amount (g) | 10-11 | 10.9 | 10.8 | 10.9 | 10.7 | 10.6 | 10.3 |
| % Total calories | 40-44 | 44 | 43 | 44 | 43 | 42 | 41 |
| Source | Lactose and glucose | Lactose | Lactose | Corn syrup solids | Corn maltodextrin and sucrose | Corn syrup solids | Corn syrup and sucrose |
| MINERALS | |||||||
| Calcium (mg) | 39-45 | 78 | 78 | 82 | 84 | 105 (5.2) | 105 (5.2) |
| Phosphorus (mg) | 18-24 | 43 | 42 | 46 | 56 | 69 | 75 |
| Ca:P ratio | 1.9-2.1 | 1.8 | 1.8 | 1.5 | 1.5 | 1.5 | 1.4 |
| Sodium (mg [mEq]) | 18-26 [0.8-1.1] | 27 [1.2] | 24 [1] | 30 [1.3] | 30 [1.3] | 36 [1.6] | 44 [1.9] |
| Potassium (mg [mEq]) | 60-80 [1.5-2] | 108 [2.8] | 105 [2.7] | 110 [2.8] | 107 [2.7] | 120 [3.1] | 108 [2.8] |
| Chloride (mg [mEq]) | 55-63 [1.6-1.8] | 63 [1.8] | 65 [1.8] | 67 [1.9] | 65 [1.8] | 80 [2.3] | 62 [1.8] |
| Iron (mg) | 0.05-0.75 | 1.8 | 1.8 | 1.8 | 1.8 | 1.8 | 1.8 |
| Zinc (mg) | 0.2-0.3 | 1 | 0.75 | 1 | 0.75 | 1.2 | 0.75 |
| Magnesium (mg) | 4.5-5 | 8 | 6 | 8 | 6 | 11 | 7.5 |
| VITAMINS | |||||||
| Vitamin A (international units) | 110-320 | 300 | 300 | 300 | 300 | 300 | 300 |
| Vitamin D (international units) | 3-3.2 | 60 | 60 | 60 | 60 | 60 | 60 |
| Vitamin E (international units) | 0.3-0.6 | 2 | 1.5 | 2 | 3 | 2 | 1.5 |
| Vitamin K (mcg) | 0.3 | 8 | 8 | 8 | 8 | 8 | 11 |
| Vitamin C—ascorbic acid (mg) | 5.6-6 | 12 | 9 | 12 | 9 | 12 | 9 |
| Vitamin B 1—thiamine (mcg) | 29-31 | 80 | 100 | 80 | 100 | 80 | 60 |
| Vitamin B 2—riboflavin (mcg) | 49-51 | 140 | 150 | 140 | 150 | 90 | 90 |
| Vitamin B 6 (mcg) | 10-46 | 60 | 60 | 60 | 60 | 60 | 60 |
| Folic acid (mcg) | 2.5-18 | 16 | 15 | 16 | 15 | 16 | 15 |
| OTHER CHARACTERISTICS | |||||||
| Potential renal solute load (mOsm) | 14 | 19.4 | 18.7 | 20 | 19.9 | 23.9 | 22.8 |
| Osmolality (mOsm/kg water) | 290-305 | 300 | 300 | 200 | 200 | 200 | 200 |
Vitamins
Vitamins are organic substances that are present in trace amounts in natural food sources and are essential to normal metabolism. Lack of vitamins in the diet produces well-recognized deficiency states in adults. The biologic roles of many vitamins are not completely understood in preterm infants, and recognition of clinical deficiency states often is difficult. 98 Certain vitamins have received close attention in neonatology, in particular vitamin C for its role in enhancing iron absorption from the gastrointestinal tract, vitamin K for prevention of hemorrhagic disease of the newborn, 4 vitamin D for the prevention of rickets, 103,116 and vitamins A and E as antioxidants. 49 Vitamin A supplementation has been shown in some studies to decrease chronic lung disease in ELBW infants. 112
Because vitamins have a central role in many metabolic processes, signs of vitamin deficiency can be nonspecific, such as lethargy, irritability, and poor growth. Table 17-5 is a summary of the recommended vitamin intake for enterally fed infants. For comparison, the average vitamin content of term human milk and commercial infant formulas is included in Table 17-4. 110 Routine supplementation of vitamins above the recommended doses is not advised because of possible toxicity and lack of clearly demonstrated benefits. For example, although supplementing vitamin D at 1000 international units/day has not been shown to result in full repletion, 25 there is no evidence that supplementation above the recommended dose prevents osteopenia in preterm infants.
| RE, Retinol equivalents. | ||
| Term (per 100 kcal) | Preterm (per 100 kcal) | |
|---|---|---|
| MINERALS | ||
| Calcium (mg) | 50-140 | 123-185 |
| Phosphorus (mg) | 20-70 | 82-109 |
| Ca:P ratio by weight | 1-2:1 | 1.7-2:1 |
| Sodium | ||
| mg | 25-50 | 39-63 |
| mEq | 1.1-2.2 | 1.7-2.7 |
| Potassium | ||
| mg | 60-160 | 60-160 |
| mEq | 1.5-4.1 | 1.5-4.1 |
| Chloride | ||
| mg | 50-160 | 60-160 |
| mEq | 1.4-4.6 | 1.7-4.6 |
| Iron (mg) | 0.2-1.65 | 1.7-3 |
| Zinc (mg) | 0.4-1 | 1.1-1.5 |
| Magnesium (mg) | 4-17 | 6.8-17 |
| VITAMINS | ||
| Vitamin A (mcg RE) | 61-152 | 204-380 |
| (international units) | 203-506 | 679-1265 |
| Vitamin D (international units) | 40-100 | 75-270 |
| Vitamin E (international units) | 0.5-? | 2-8 |
| Vitamin K (mcg RE) | 1-25 | 4-25 |
| Vitamin C—ascorbic acid (mg) | 6-15 | 8.3-37 |
| Vitamin B 1—thiamine (mg) | 30-200 | 30-250 |
| Vitamin B 2—riboflavin (mg) | 80-300 | 80-620 |
| Vitamin B 6—pyridoxine (mg) | 30-130 | 30-250 |
| Folate (mcg) | 11-40 | 30-45 |
Minerals and Trace Elements
The content of minerals in human milk is the gold standard for mineral requirements in term infants. Mineral requirements for the preterm infant have been estimated from in utero accretion rates. Preterm infants are relatively lacking in some important minerals (e.g., iron, calcium, zinc), because their accumulation occurs mostly in the third trimester. Published recommendations for selected daily intakes in healthy, enterally fed preterm infants are shown in Tables 17-5 and 17-6 and discussed in detail in Reference 63. Supplementation with calcium and phosphorus to achieve the recommended intakes (a Ca:P ratio of 1.7:1, by weight) has been shown to decrease the incidence of metabolic bone disease in preterm infants. Mineral supplementation of human milk or use of an enriched preterm formula (as shown in Table 17-7 on pp. 416–417) usually is necessary to achieve the recommended mineral requirements.
| DNA, Deoxyribonucleic acid; RNA, ribonucleic acid. | |||
| Mineral or Element | Biologic Role | Deficiency State | Recommended intake for Growing Preterm Infants |
|---|---|---|---|
| Sodium | Growth and tissue accretion, body fluid equilibrium, cellular energy, electrical charge balance | Poor growth, fluid imbalance, neurologic dysfunction, lethargy, seizures | 3-5 mEq/kg/day |
| Potassium | Growth and tissue accretion, acid-base balance, cellular energy, electrical charge balance | Myocardial damage, dysrhythmia, hypotonia, muscle weakness | 2-3 mEq/kg/day |
| Chloride | Growth and tissue accretion, cellular energy, electrical charge balance | Failure to thrive, muscle weakness, vomiting | 3-5 mEq/kg/day |
| Calcium | Bone and tooth formation, fat absorption, nerve conduction, muscle contraction | Bone demineralization, tetany, dysrhythmias, seizures | 200 mg/kg/day |
| Phosphorus | Bone and tooth formation, energy transfer compounds | Bone demineralization, weakness | 100-140 mg/kg/day |
| Magnesium | Metalloenzymes, cellular electrical charge balance | Neurologic dysfunction, anorexia, diarrhea, renal disease | 5-10 mg/kg/day |
| Iron | Hemoglobin formation, metalloenzymes | Anemia, apathy | 2 mg/kg/day after 1 month of age |
| Zinc | Metalloenzymes, DNA-RNA synthesis, wound healing, host defenses | Growth restriction, dermatitis, alopecia, diarrhea, delayed wound healing | 1.2-1.5 mg/kg/day |
| Copper | Metalloenzymes, protein metabolism | Neurologic dysfunction, anemia, neutropenia, bone demineralization | 100-200 mcg/kg/day |
| Manganese | Metalloenzymes, carbohydrate metabolism, antioxidants, hemostasis | Neurologic dysfunction, defects in lipid metabolism, reduced coagulants, growth restriction in animals | 10-20 mcg/kg/day |
| Chromium | Carbohydrates metabolism, component of nucleic acids | Impaired glucose tolerance, impaired growth | 2-4 mcg/kg/day |
| Selenium | Metalloenzymes, antioxidants | Cardiomyopathy | 1.5-3 mcg/kg/day |
| Iodine | Thyroid hormone synthesis | Hypothyroidism | 1 mcg/kg/day |
| Molybdenum | Metalloenzymes | Neurologic and visual dysfunction, growth restriction in animals | 2-3 mcg/kg/day |
| This table lists the major constituents; refer to product inserts for a complete listing of vitamins, minerals, and trace elements. | |||||
| ARA, Arachidonic acid; DHA, docosahexaenoic acid; MCT, medium-chain triglycerides. | |||||
| *Data from Klein CJ, editor: Nutrient requirements for preterm infant formulas, J Nutr 132:1395S, 2002; and Tsang RC, Uauy R, Koletzko B, et al, editors: Nutrition of the preterm infant: scientific basis and practical guidelines, ed 2, Cincinnati, 2005, Digital Educational Publishing. |
|||||
| †Mead Johnson Nutritionals, Evansville, Ind. |
|||||
| ‡Abbott Nutrition, Columbus, Ohio |
|||||
| Mature Preterm Human Milk (Unfortified) * | Premature Infant Formulas | Post-Discharge Formulas | |||
|---|---|---|---|---|---|
| Enfamil® Premature Lipil®† | Similac® Special Care® with Iron‡ | Enfacare® Lipil®† | Similac Neosure®‡ | ||
| NUTRIENT DENSITY (kcal/oz) | 19-21 | 20 or 24 | 20 or 24 | 22 | 22 |
| ENERGY (kcal) | 100 | 100 | 100 | 100 | 100 |
| PROTEIN | |||||
| Amount (g) | 2.2 ± 0.2 | 3 | 2.71 | 2.8 | 2.8 |
| % Total calories | 8 | 12 | 11 | 11 | 11 |
| Source | Human milk | Whey protein concentrate and nonfat milk | Nonfat milk and whey protein concentrate | Nonfat milk and whey protein concentrate | Nonfat milk and whey protein concentrate |
| FAT | |||||
| Amount (g) | 5.4 ± 0.9 | 5.1 | 5.43 | 5.3 | 5.5 |
| % Total calories | 44-52 | 46 | 49 | 47 | 50 |
| Source | Triglycerides |
MCT oil
Soy oil
High oleic vegetable oil
Single cell oil products (DHA and ARA)
|
MCT oil
Soy oil
Coconut oil
Single cell oil products (DHA and ARA)
|
High oleic oil
Soy oil
MCT oil
Coconut oil
Single cell oil products (DHA and ARA)
|
Soy oil
Coconut oil
MCT oil
Single cell oil products (DHA and ARA)
|
| Oil ratio (approximate) | 99 | 40:30:27:2:1 | 50:30:18.3:0.25:0.4 | 34:29:20:14:2.2:0.8 | 44.7:29:24.9:0.15:0.4 |
| Linoleic acid (mg) | 440-1500 | 810 | 700 | 950 | 750 |
| CARBOHYDRATE | |||||
| Amount (g) | 10 ± 0.6 | 11 | 10.3 | 10.4 | 10.1 |
| % Total calories | 40-44 | 44 | 41 | 42 | 40 |
| Source | Lactose and glucose | Corn syrup solids and lactose | Corn syrup solids and lactose | Lactose and corn syrup solids | Corn syrup solids and lactose |
| MINERALS | |||||
| Calcium (mg) | 37-44 | 165 | 180 | 120 | 105 |
| Phosphorus (mg) | 19-21 | 83 | 100 | 66 | 62 |
| Ca:P ratio | 1.9-2.2:1 | 2:1 | 1.8:1 | 1.8:1 | 1.7:1 |
| Sodium mg (mEq) | 30-37 (1.3-1.6) | 58 (2.5) | 43 (1.9) | 35 (1.5) | 33 (1.4) |
| Potassium mg (mEq) | 78-85 (2-2.2) | 98 (2.5) | 129 (3.3) | 105 (2.7) | 142 (3.6) |
| Chloride mg (mEq) | 63-82 (1.8-2.3) | 90 (2.5) | 81 (2.3) | 78 (2.2) | 75 (2.1) |
| Iron (mg) | 0.2 | 1.8 | 1.8 | 1.8 | 1.8 |
| Zinc (mg) | 0.5 | 1.5 | 1.5 | 1.25 | 1.2 |
| Magnesium (mg) | 4.4-4.9 | 9 | 12 | 8 | 9 |
| VITAMINS | |||||
| Vitamin A | |||||
| (mcg RE) | 104-125 | 375 | 375 | 135 | 138 |
| (international units) | (345-416) | (1250) | (1250) | (450) | (460) |
| Vitamin D (international units) | 3-3.2 | 240 | 150 | 80 | 70 |
| Vitamin E (international units) | 1.9 | 6.3 | 4 | 4 | 3.6 |
| Vitamin K (mcg) | 0.3 | 8 | 12 | 8 | 11 |
| Vitamin C—ascorbic acid (mg) | 5-6.25 | 20 | 37 | 16 | 15 |
| Vitamin B 1—thiamine (mcg) | 200 | 200 | 250 | 200 | 220 |
| Vitamin B 2—riboflavin (mcg) | 270-310 | 300 | 620 | 200 | 150 |
| Vitamin B 6 (mcg) | 18-20 | 150 | 250 | 100 | 100 |
| Folic acid (mcg) | 12 | 40 | 37 | 26 | 25 |
| OTHER CHARACTERISTICS | |||||
| Potential renal solute load (mOsm) | 18.7 | 27.4 | 27.8 | 24.5 | 25.2 |
| Osmolality (mOsm/kg water) | 290 | 240 | 235 | 250 | 250 |
COMPOSITION OF ENTERAL FEEDINGS
Human Milk
The ideal enteral diet for almost all term newborn infants is human milk, 5 providing sufficient energy, protein, fat, carbohydrate, micronutrients, and water for normal growth. Contraindications to the use of human milk are found in Box 17-4. The development of a beneficial gastrointestinal flora, characterized by a large prevalence of bifidobacteria and lactobacilli, is strongly supported by human milk feedings. 47,71,79,93 In addition, human milk, unlike formulas, provides a variety of antimicrobial factors that protect against infection, such as secretory immunoglobulins (IgA), leukocytes, complement, lactoferrin, and lysozyme. 88 Human milk also contains hormones and growth factors such as epidermal and nerve growth factors, insulin-like growth factors (IGF) I/II, erythropoietin, prolactin, calcitonin, steroids, thyrotropin-releasing hormone (TRH), and thyroxine. These milk hormones and trophic factors play active roles in organ maturation, growth, and health. Several essential and conditionally essential amino acids are present in high concentrations in human milk. The protein and fat components of human milk are readily digestible, and human milk contains large numbers of enzymes that aid in nutrient digestion and processing (e.g., lipase). Exclusive human milk feeding of infants at high risk may reduce the risk for developing atopic disease or milk protein allergy in infancy. 45,70 There also are obvious psychologic benefits to a mother who provides her own milk for her sick infant (see Chapter 18).
BOX 17-4
• Maternal miliary tuberculosis
• Galactosemia
• Maternal drug abuse
• Some maternal medications
• Maternal human immunodeficiency virus infection
Human milk is the recommended basis of nutrition for the preterm infant.5 The preterm infant will not grow at the normal rate of fetal growth on human milk alone, however, because of the special nutritional requirements addressed previously. Recommended daily requirements for energy, protein, calcium, sodium, phosphorus, magnesium, iron, zinc, and several vitamins necessary to meet the normal rate of in utero growth usually will not be achieved in the growing “healthy” preterm infant who is fed with unsupplemented human milk. The preterm infant with respiratory distress, infection, excessive heat losses, or increased activity has even greater nutritional needs. Nonetheless, milk from mothers of preterm infants has more protein and sodium than milk obtained at term and occasionally provides for adequate growth in larger and healthier preterm infants. The nutritional composition of term human milk is compared with commercial term infant formulas in Table 17-4. The nutrient content of “mature” preterm human milk is compared with fortified preterm human milk and preterm formulas in Table 17-7. Use of commercially available supplements to human milk that provide additional energy, protein, vitamins, and minerals is recommended. 98 Nutrient composition of these fortifiers is shown in Table 17-3.
Formulas
Cow’s milk–derived formulas have been designed to mimic human milk to provide biologically available protein mixtures with appropriate protein:energy ratios for normal growth. In general, formulas designed for term infants contain 20 kcal/oz and are adequate to meet the needs of term infants with an intact gastrointestinal tract and “normal” fluid requirements. A whey and casein mixture approximating that of human milk is preferred. Preterm formulas contain whey:casein ratios of 60:40 and have higher protein contents than those of term formulas. Preterm formulas also contain less lactose as a carbohydrate source and substitute corn syrup solids and lactose to provide approximately 42% to 44% of the calories derived from carbohydrate. Preterm formulas provide some of the fat in the form of medium-chain triglycerides because of the ease with which they are absorbed. Calcium and phosphorus content is increased, with a Ca:P ratio of 1.8 to 2:1, which provides for improved bone mineralization. Other minerals and vitamins also are present in higher concentrations in preterm formulas to reflect the special nutritional needs of the VLBW infant. Preterm formulas are available in 20 and 24 kcal/oz preparations, with similar osmolalities and renal solute loads.
Soy protein formulas should be reserved for term infants with galactosemia, severe lactose intolerance, hereditary lactase deficiency, vegan families, or those who have IgE-mediated cow’s milk protein allergy. Soy-derived formulas should not be used for preterm infants because of the poorer quality of protein, lower digestibility and bioavailability, and lower calcium and zinc accretion rates seen with these formulas.9 In addition, there are concerns for all infants about the concentrations of phytates, aluminum, and phytoestrogens that these formulas contain. 35,86,111 If necessary, a protein hydrolysate formula should be used for preterm infants with protein intolerance. For term infants, formulas derived from protein hydrolysates should be reserved for infants who are allergic to cow’s milk proteins and are not breast fed or do not tolerate soy-derived formulas. Soy formulas have no role in the prevention of atopic disease. In contrast, extensively hydrosylated formulas may delay or prevent atopic dermatitis in infants at high risk. 45 In general, families with a strong history of cow’s milk protein allergy should be encouraged to breast feed.
Elemental formulas are used in infants with malabsorption, abnormal gastrointestinal tracts, or severe protein allergy. The protein source in these formulas is derived from free amino acids, and 52% of the fat is from MCT oil. Use of elemental formulas generally is indicated in the infant with severe liver disease and fat malabsorption, with short bowel syndrome (e.g., after necrotizing enterocolitis [NEC] with surgical resection), or with dysmotility syndromes (e.g., in gastroschisis). Occasionally, elemental formulas are useful after a severe episode of infectious gastroenteritis with mucosal injury and resulting protein or lactose intolerance. A lactose-free formula also may be used in this setting. It is not necessary to use an elemental formula in the routine care of VLBW infants. A variety of other modified formulas are available for infants with special nutritional needs.
In some circumstances, infants require fluid restriction (e.g., because of pulmonary edema, congestive heart failure, or renal failure) while on full enteral feedings. Caloric delivery and nutritional support can be maintained by increasing the caloric density of feedings when feeding volumes cannot be tolerated or fluid intake must be limited. This can be done by adding human milk fortifiers, glucose polymers, vegetable oil, Microlipid (a lipid emulsion, Sherwood Medical), or MCT oil to the milk or formula as tolerated to achieve acceptable concentrations and intakes of these nutrients. Liquid formula concentrates also are used to increase the caloric density of infant feedings. Powdered infant formulas should not be used for feeding or fortification in hospitalized newborns in an intensive care unit, unless no alternative is available, because of information linking Enterobacter sakazakii infections in neonates to the use of powdered infant formulas (Food and Drug Administration [FDA] recommendation 4-11-02). Caloric densities of greater than 24 kcal/oz can be achieved with fortification, although infants tolerate these supplements in a highly individual fashion and should be monitored for signs of feeding intolerance (e.g., abdominal distention, increased stooling, presence of fat or sugar in the stool). Consider the distribution of calories to maintain a balance of protein, fat, and carbohydrate, about 10%, 45%, and 45%, respectively. Increasing caloric density of feedings also necessitates less water delivery to the infant and generally leads to an increase in formula osmolality as well. Therefore careful monitoring of feeding tolerance, electrolytes, and fluid balance (renal function) is necessary on a high–caloric density feeding regimen.
FEEDING TECHNIQUES
Gavage Feeding
Gavage feedings are indicated in infants requiring endotracheal intubation or those with an immature, weak, or absent suck, swallow, or gag reflex (Box 17-5). Most infants tolerate intermittent feedings delivered slowly over 30 to 60 minutes. Continuous feedings may be helpful for infants recovering from necrotizing enterocolitis (NEC) or infants with short bowel syndrome, congenital heart disease, or intolerance of bolus feedings. There is some evidence that these infants have better absorption of nutrients and therefore improved growth. The caregiver should monitor the number and consistency of stools or stoma output. Stools should be tested for occult blood or reducing substances (to detect undigested or partially digested carbohydrate [e.g., with Clinitest]) when feeding intolerance or malabsorption is suspected. If short bowel syndrome is present, transition from continuous to bolus feedings should proceed slowly and cautiously by infusing feedings over gradually shorter periods of time, with increasing intervals between feedings until bolus feedings every 3 to 4 hours are tolerated. Prolonged oral or nasal gastric tube feedings cause adverse oral stimulation and promote gastroesophageal reflux and problems of oral aversion. Some neonates require gastrostomy tube placement after certain surgical procedures (see Chapter 28).
BOX 17-5
Equipment
1. Breast milk/formula in syringe (4-hour amount, or unit protocol, maximum)
2. Tape, optional transparent dressing
3. Lubricant, optional
4. Stethoscope
5. For intermittent feeding: infant feeding set with syringe, medicine cup, 4-Fr to 8-Fr gavage tube
6. For indwelling feeding tubes: infant less than 1 kg, 4-Fr tube; greater than 1 kg, 5-Fr to 6-Fr tube (tube size may also depend on placement [i.e., oral versus nasal], amount of feeding, and rate of delivery of feeding). 61 Short-term feeding tube (generally made of polyvinyl chloride [PVC]) should be changed every 24 to 72 hours.
Long-term feeding tube (made of polyurethane) should be changed every 4 weeks.
Note: Always follow manufacturer’s recommendations.
7. Syringe pump and extension tubing as needed
Feeding Tube Insertion
1. Wash hands and assemble equipment in a clean area.
2. Measure for tube placement by placing tip of feeding tube at the tip of nose, draw to base of ear, then to halfway between the xiphoid process and the umbilicus.
3. Mark tube with indelible ink pen to indicate the distance from the tip of the tube to the corner of the mouth or edge of the naris.
4. Insert tube (swaddling the infant may help with tolerance of this procedure).
NEVER FORCE THE TUBE.
Oral placement (usually for infants less than 1 kg, those on nasal continuous positive airway pressure (NCPAP) or ventilator, those with high oxygen need, or those with excoriated nares): insert tip into the oropharynx, gently pushing tube in a downward arc into the esophagus until reaching the premeasured mark.
Nasal placement (generally preferred for infants greater than 1 kg with mature or strong gag reflex and infants who are breast feeding or nippling): moisten tip with water or lubricant. Insert tip gently into one nostril and advance slowly as above.
5. Gastric tube tip placement is verified by abdominal radiograph or pH measurement of the aspirate. The tube landmark should be checked with every caregiving procedure to determine that it is still visible and at the correct location.
6. Soft Silastic tubes are generally used for transpyloric feedings and require the use of a stylet for insertion. The tube must be inspected visually and by flushing with water before insertion to ensure that it has not been perforated by the stylet. The stylet is removed after insertion and is stored in package by the bedside. Tip placement usually is verified by radiographic imaging.
Securing Feeding Tube
1. Intermittent feeding tubes can be taped to the cheek.
2. Indwelling tubes must be taped securely to the face, leaving the landmark visible. For tubes placed nasally, a narrow piece of tape may be placed along the tubing on the upper lip, with a transparent dressing applied over the tube on the cheek.
Feeding
1. Aspirate entire stomach contents to assess quantity, as well as color and appearance.
2. To prevent loss of electrolytes, slowly return aspirate to the stomach. Exceptions to this include aspirates that are bloody or “coffee ground,” green or bright yellow, or fecal appearing or contain large amounts of mucus. Do not refeed, and discuss feeding plan with physician or practitioner. Also report aspirates of undigested formula if amount is more than one half of the feeding or occurs more than once or if there is a change in abdominal assessment. Reducing the feeding by the amount of the refed aspirate is recommended for one or two feedings.
3. Instill human milk or formula via intermittent gavage feeding:
Detach syringe from feeding tube and remove plunger; reattach syringe to feeding tube. Pour the predetermined amount of milk into the syringe. Flow may begin spontaneously or require a gentle nudge from the plunger. Allow feeding to run in slowly by gravity. Never push a feeding. The higher the syringe is held, the faster the feeding will flow (about 8 inches is ideal). For most infants, a feeding should run in over 30 minutes. Gavage sets may be rinsed carefully and used for up to 24 hours unless labeled “single use only” or manufacturer’s directions indicate otherwise.
4. Intermittent gavage feeding via indwelling feeding tube:
Check aspirate and feed as above. When feeding is complete, instill 1 to 2 mL sterile water to clear tubing of residual food and cap or close off the tube by attaching syringe with plunger.
5. Continuous drip feedings via indwelling feeding tube:
Check feeding tube placement and feeding residuals every 2 to 4 hours using stopcock, which is placed between the feeding tube and the extension tubing. Check ink landmark on feeding tube hourly to ensure proper placement of the tube. Prepare up to 4 hours of breast milk or formula (or amount according to institutional studies of bacterial growth). Fill syringe with predetermined feeding amount plus enough to prime the extension tubing. Place syringe into syringe pump and program to deliver feeding at desired rate. To help prevent loss of milk fat by settling, place syringe in an upward vertical position and use mini-bore tubing.
Care, Assessment, and Documentation
1. Assess infant’s tolerance of feeding tube placement. If gagging occurs, attempt to insert tube down one side of the oropharynx rather than down the middle. If the infant becomes apneic, bradycardic, or cyanotic during feeding tube placement, pause to allow recovery or remove the tube and allow infant to rest before trying again. If these symptoms occur during the feeding, stop the feeding by lowering the syringe or stopping the pump. If recovery occurs quickly, resume feeding slowly and observe. If distress continues or recurs, stop feeding and inform the physician or practitioner.
2. Change short-term (PVC) feeding tube every 24 to 72 hours (or manufacturer’s recommendations).
3. Change long-term nasal feeding tube (polyurethane) to opposite nostril weekly. Discard and replace tube after 4 weeks (or manufacturers’ recommendations).
4. Document all details of the feeding and the infant’s tolerance, proper placement of the indwelling feeding tube, and when feeding tube or equipment is to be changed.
For most infants, intragastric feedings are preferred to transpyloric feedings. Routine use of transpyloric feedings has increased mortality without proven benefits. 83,84 Even when indicated because of severe reflux and aspiration, transpyloric feedings have additional complications, including intestinal perforations requiring surgery. Use of transpyloric feeding should be restricted to short-term use in those infants who cannot tolerate gastric feedings because of excessive reflux with aspiration, pneumonia, and apnea.
PRECAUTIONS
Aspiration is a serious problem in an infant of any gestational age who does not have a neurologically mature swallow, gag, or cough reflex (<34 to 36 weeks). Tachypneic infants with labored respirations or with an endotracheal tube also are at increased risk for aspiration. Gavage tube position must be checked carefully using bedside testing of pH90or abdominal radiograph, if necessary; feedings should run in slowly; infants should not be overfed. Gavage feedings should never be pushed.
Oral Feeding
Development of appropriate neuromuscular coordination is necessary to successfully initiate oral feedings. Criteria for initiating oral feeding must be individualized. Coordination of suck, swallow, and breathing emerges at about 34 weeks’ gestation, regardless of postnatal age. Respiratory illness leads to energy depletion. Oral feeding usually is not possible unless the respiratory rate is less than 60 breaths/min. Neonates with craniofacial malformation (e.g., cleft lip or palate, choanal stenosis or atresia, mandibular hypoplasia) are at increased risk for aspiration. Use of different nipple shapes and sizes and sitting the infant in the upright position facilitate safe oral feeding. Gastrostomy tube placement may be necessary if oral feedings are not adequately established (see Chapter 28).
The ability to suck on a pacifier, fingers, or a gavage tube does not ensure the infant’s ability to perform nutritive sucking. A preterm infant without a gag reflex is at risk for aspiration with nipple feedings. An infant who is successful at oral feeding should exhibit an active suck, coordinated swallow, minimal fluid loss around the nipple, and completion of feeding within 15 to 30 minutes.105 The preterm infant hospitalized in the neonatal intensive care unit (NICU) usually has been exposed to many unpleasant oral sensations, such as endotracheal tubes, suction catheters, gavage tubes, and facial tape. These infants often become “disorganized feeders” and develop oral aversion.
The first few feedings in the preterm infant often last only a few minutes. Coordination of sucking with breathing is the first lesson for the preterm infant. Stress behaviors (e.g., increase or decrease in respiratory or heart rate, decreased oxygen saturation, color change, gagging, choking, emesis, fatigue, irritability, or a “panicked look”) should result in a rest period or cessation of the feeding. Provider “pacing” is important until the infant learns to self-pace feedings (see Chapter 13).
An infant receiving supplemental oxygen should be monitored by pulse oximetry to determine oxygen requirements during oral feedings. Softer nipples may be used for infants with weak suck and swallow capacity. Strategies to facilitate oral feedings include a relaxed caregiver, a quiet environment with subdued light, and a snugly wrapped infant (see Chapter 13).
Extremely preterm infants appear to benefit from a minimal enteral nutrition regimen (often called trophic feedings, since the purpose is to develop gut growth and development but not body growth). Such feedings should begin slowly at approximately 20 mL/kg/day, about every 4 hours, and then increase after 3 to 5 days as tolerated to once every 2 to 3 hours and finally to full enteral feeding volumes and full nipple (or breast) feedings. Even for the very preterm infant, scheduling oral feedings for parent visits enables them to actively participate in their infant’s care. Too rapid a change to oral feeding results in weight loss, primarily because the infant tires with feeding and is unable to take in a sufficient amount of food. Diligent attention is warranted, and nipple feedings often have to be limited and gavage feedings continued to prevent dehydration and malnutrition.
FEEDING INTOLERANCE AND COMPLICATIONS
Assessment for signs of feeding intolerance is imperative because, although some feeding complications are mild and respond to nursing interventions, others are more serious and require medical intervention. Feeding intolerance frequently is the first sign of illness (e.g., hypoxia, dyspnea, congestive heart failure, sepsis, NEC). At first, such signs often are subtle, so the caregiver should be constantly aware of any change in the infant’s overall condition and feeding tolerance.
Residuals
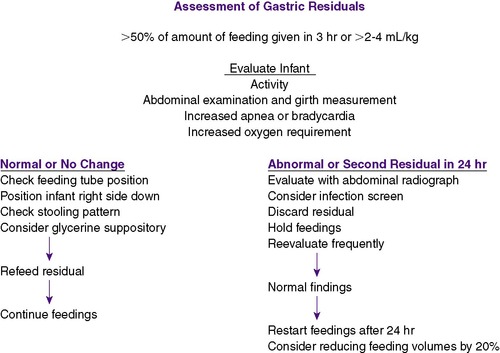
The feeding tube is aspirated every 2 to 4 hours before a feeding to determine whether gastric emptying is adequate. Incompletely digested aspirates of less than 50% of the previous feeding, 2 to 4 mL/kg, or a 1-hour volume if on continuous feedings may be normal and generally should be refed to the infant (Figure 17-8). Increasing residuals can indicate feeding intolerance, and the infant should be evaluated for intestinal obstruction or NEC. If such serious disorders are not discovered, feedings can be started again with decreased feeding volumes and/or slower rates of instillation, as well as slower rates of feeding advancement. Medications such as metoclopramide or erythromycin have been used to accelerate bowel motility and improve feeding tolerance, but few data from clinical trials are available to confirm these outcomes. 55The presence of bile or blood in the gastric aspirate warrants further investigation and possibility of NEC.
 |
| FIGURE 17-8 |
Emesis
Infants with emesis should always be evaluated for intestinal obstruction or diseases that produce ileus, such as NEC and sepsis. With persistent emesis of increasing amounts, feedings should be held and the infant evaluated for sepsis, NEC, obstruction (including Hirschsprung’s disease and, in infants of diabetic mothers, microcolon), metabolic disorders, or increased intracranial pressure. Emesis also results from an overdistended stomach, gastroesophageal reflux, poorly positioned feeding tube, gastric irritation from enterally administered medications, drug withdrawal, or overstimulation in a very small infant. Interventions include allowing the feeding to flow more slowly by use of a smaller gavage tube, instilling the feeding over a longer period, decreasing feeding volumes, prone positioning, giving medications at the end of the feeding, or modifying a stressful environment (see Chapter 13). Litmus testing or abdominal radiographs should be used to assess feeding tube position.
GASTROESOPHAGEAL REFLUX
Gastroesophageal reflux should be suspected in an infant with irritability, emesis, apnea and bradycardia, respiratory deterioration, refusal to eat, or otherwise unexplained blood in the stools. The use of histamine-2 (H-2) receptor blocker therapy for gastroesophageal reflux or feeding intolerance in infants is not supported by good evidence. H-2 blockers have been implicated in neonatal sepsis for being permissive to pathologic organisms by eliminating the barrier function of gastric acid. 43 Studies have reported decreased NEC with the acidification of feedings92 and the association of H-2 blocker therapy with an increased risk for necrotizing enterocolitis.46 Postoperative emesis and abdominal distention may indicate a stricture, partial obstruction, or inflammatory abscess.
Abdominal Distention
Abdominal distention with or without palpable or visible loops of bowel is a sign of poor gastric motility, ileus, constipation, or “gas.” Variations in abdominal circumference of up to 1.5 cm can occur and, without other clinical signs of illness, may be normal. If the abdomen remains soft and nontender, prone positioning may be comforting, allowing gas and stool to pass. Persistent abdominal distention, pain with palpation, and discoloration of the overlying skin are signs of pathology (e.g., anatomic obstruction or infection) and require investigation. An abdominal x-ray examination is indicated in these patients. Abdominal girth is measured every 4 to 8 hours to document increased distention. Place paper or cloth tape around the abdomen at a consistent point marked on the abdomen.
Diarrhea
Diarrhea, or frequent water-loss stools, signifies intolerance of the caloric density of feedings, transient lactase deficiency, highly osmotic medications, or other pathology, including, rarely, allergy. Stool culture for bacterial or viral pathogens and stool Clinitest should be performed if the infant also appears ill or if there is blood in the stool. In lactose malabsorption, short-term use of a non–lactose-containing formula or hydrolysate formula should result in return to normal stools.
Apnea and/or Bradycardia
Apnea and/or bradycardia frequently occurs during or after feeding. These signs are vagally mediated by the passage or presence of a feeding tube, gastric distention, or gastroesophageal reflux or occur with abdominal distention and compromise of lung volumes or airway obstruction. Interventions to decrease vagal stimulation include changing to an orogastric gavage tube, decreasing feeding volume, and feeding more slowly.
Poor Growth
Growth is an essential requirement for the preterm infant. When normal growth does not occur, all possible factors should be considered, but most commonly, the infant has not been fed sufficient amounts of food. If this is the case and the infant is not sick in some obvious way, he or she should be fed more food, primarily protein and energy. Factors that increase caloric expenditure, such as thermal instability or overstimulation, should be considered as causes of growth failure. Preterm infants always should be cared for in a thermoneutral environment, wearing a hat or other form of head covering (because large amounts of heat are lost from the surface of the head). Additional clothing, supportive positioning, and grouping of care and stimulation to conserve energy often help improve growth.
Danger Signs
Bile in the gastric aspirate is generally a sign of significant ileus or obstruction. The presence of blood in the stools or gastric aspirate, a tense or tender abdomen, and abdominal wall erythema are more ominous signs of feeding intolerance and may indicate frank NEC (see theCritical Findings box below.The presence of these signs and symptoms warrants a careful physical examination and usually further investigation including x-ray examinations. Feedings should be postponed while these signs and symptoms are being investigated. Other useful studies include a complete blood count with differential to evaluate extent of blood loss, presence of thrombocytopenia (a marker of necrotic bowel), and change in white blood cell count as evidence of infection. Although feeding of human milk may help protect against developing NEC and 5% to 10% of cases of NEC occur in infants who have never been fed enterally, NEC can occur in any infant. Abnormal abdominal distention or bilious or bloody gastric aspirates should be investigated carefully regardless of feeding status.
THE PRETERM INFANT
Much progress has made in providing nutritional support for ELBW (<1000 g) and VLBW (<1500 g) preterm infants. The nutritional requirements of these very small infants are marked, unique, incompletely understood, and frequently inadequately provided for, despite improvement in both the quality and quantity of nutrients in currently used intravenous (IV) and enteral nutrient regimens (Box 17-6). Also, many of these infants are growth restricted at birth. Thus their nutritional needs for normal rates of metabolism and growth are very likely to differ from those of normal-growth infants. 24Table 17-8shows enteral intake recommendations for stable, growing preterm infants. Whether additional nutritional supplementation should be provided for some or all of these infants to support “catch-up” growth and the best “recipe” for that supplementation are currently controversial. 38,69,101,108,109
BOX 17-6
1. Minimal energy reserves (both carbohydrates and fat)
2. Intrinsically higher metabolic rate (greater relative mass of more metabolically active organs: brain, heart, liver)
3. Higher protein turnover rate (especially when growing)
4. Higher glucose needs for energy and brain metabolism
5. Higher lipid needs to match the in utero rate of fat deposition
6. Excessive evaporative rates (immature skin)
7. Occasionally very high urinary water and solute losses (depending on intake and renal maturation)
8. Low rates of gastrointestinal peristalsis
9. Limited production of gut digestive enzymes and growth factors
10. Higher incidence of stressful events (hypoxemia, respiratory distress, sepsis)
11. Metabolic effects of medications used frequently (steroids, antibiotics, sedatives, catecholamines)
12. Abnormal neurologic outcome if not fed adequately
Modified from Thureen P, Hay WW Jr: Conditions requiring special nutritional management. In Tsang RC, Lucas A, Uauy R, et al, editors: Nutritional needs of the preterm infant, Baltimore, 1993, Williams & Wilkins.
| *120 kcal/kg/day was used where conversion was made from per kg recommendations. |
|||||
| †American Academy of Pediatrics, Committee on Nutrition. |
|||||
| ‡European Society of Paediatric Gastroenterology and Nutrition, Committee on Nutrition of the Preterm Infant. |
|||||
| §Aim = 400 international units/day. |
|||||
| Consensus Recommendations by the Authors of this Chapter | |||||
|---|---|---|---|---|---|
| Infant Weight <1000 g | Infant Weight >1000 g | Aapcon† | Espgan-Con‡ | ||
| Water | mL | 125-167 | 125-167 | — | 115-154 |
| Energy | kcal | 100 | 100 | 100 | 100 |
| Protein | g | 3-3.16 | 2.5-3 | 2.9-3.3 | 2.25-3.1 |
| Carbohydrate | g | 9-13 | 7-14 | ||
| Lactose | g | 3.16-9.5 | 3.16-9.8 | — | — |
| Oligomers | g | 0-7 | 0-7 | — | — |
| Fat | g | 4.5-6.0 | 3.6-7 | ||
| Linoleic acid | g | 0.44-1.7 | 0.44-1.7 | 0.4 | 0.5-1.4 |
| Linolenic acid | g | 0.11-0.44 | 0.11-0.44 | — | >0.055 |
| 18:2/C18:3 | >5 | >5 | — | 5-15 | |
| Vitamin A—lung disease | International units | 583-1250 1250-2333 |
583-1250 1250-2333 |
75-225 — |
270-450 — |
| Vitamin D | International units | 125-333§ | 125-333§ | 270 | 800-1600/day |
| Vitamin E | International units | 5-10 | 5-10 | >1.1 | 0.6-10 |
| Supplement (human milk) | 2.9 | 2.9 | — | — | |
| Vitamin K | mcg | 6.66-8.33 | 6.66-8.33 | 4 | 4-15 |
| Ascorbate | mg | 15-20 | 15-20 | 35 | 7-40 |
| Thiamine | mcg | 150-200 | 150-200 | >40 | 20-250 |
| Riboflavin | mcg | 200-300 | 200-300 | >60 | 60-600 |
| Pyridoxine | mcg | 125-175 | 125-175 | >35 | 35-250 |
| Niacin | mg | 3-4 | 3-4 | >0.25 | 0.8-5.0 |
| Pantothenate | mg | 1-1.5 | 1-1.5 | >0.30 | >0.3 |
| Biotin | mcg | 3-5 | 3-5 | >1.5 | >1.5 |
| Folate | mcg | 21-42 | 21-42 | 33 | >60 |
| Vitamin B 12 | mcg | 0.25 | 0.25 | >0.15 | >0.15 |
| Sodium | mg | 38-58 | 38-58 | 48-67 | 23-53 |
| Potassium | mg | 65-100 | 65-100 | 66-98 | 90-152 |
| Chloride | mg | 59-89 | 59-89 | — | 57-89 |
| Calcium | mg | 100-192 | 100-192 | 175 | 70-140 |
| Phosphorus | mg | 50-117 | 50-117 | 91.5 | 50-87 |
| Magnesium | mg | 6.6-12.5 | 6.6-12.5 | — | 6-12 |
| Iron | mg | 1.67 | 1.67 | 1.7-2.5 | 1.5 |
| Zinc | mcg | 833 | 833 | >500 | 550-1100 |
| Copper | mcg | 100-125 | 100-125 | 90 | 90-120 |
| Selenium | mcg | 1.08-2.5 | 1.08-2.5 | — | — |
| Chromium | mcg | 0.083-0.42 | 0.083-0.42 | — | — |
| Manganese | mcg | 6.3 | 6.3 | >5 | 1.5-7.5 |
| Molybdenum | mcg | 0.25 | 0.25 | — | — |
| Iodine | mcg | 25-50 | 25-50 | 5 | 10-45 |
| Taurine | mg | 3.75-7.5 | 3.75-7.5 | — | — |
| Carnitine | mg | Approximately 2.4 | Approximately 2.4 | — | >1.2 |
| Inositol | mg | 27-67.5 | 27-67.5 | — | — |
| Choline | mg | 12-23.4 | 12-23.4 | — | — |
Danger Signs Requiring Immediate Attention
1. Bile in the gastric aspirate
2. Presence of blood in the stools or gastric aspirate
3. Tense or tender abdomen
4. Abdominal wall erythema
5. Unexplained anemia, thrombocytopenia, and neutropenia
In spite of increasingly aggressive in-hospital nutritional management, the majority of prematurely born infants remain growth restricted and are small for post-conceptual age at the time of discharge. 32,33 In fact, the fraction of these infants who are small for gestational age at discharge is several-fold greater than the fraction at birth (Figure 17-9). 32There is increasingly strong evidence that early nutritional support of preterm and growth-restricted infants can have lasting consequences for neurodevelopmental outcome.11,30 Many previous studies in humans and animals have documented that prolonged postnatal undernutrition and malnutrition add far greater insult than does prenatal undernutrition alone. 73 Such observations have important implications. First, we cannot now think of “early” nutrition of these small infants simply in terms of providing immediate nutrient needs just for metabolic maintenance (e.g., glucose to prevent hypoglycemia); we also must consider that early nutrition has biologic effects that have lasting or lifelong significance. Second, we can no longer regard nutritional practices in preterm infants as simply a matter of personal choice. The major impact of sufficient early nutritional support on long-term outcome should be a stimulus to new research that defines consistent approaches to the nutrition of preterm infants to optimize their future health and development. 20,23
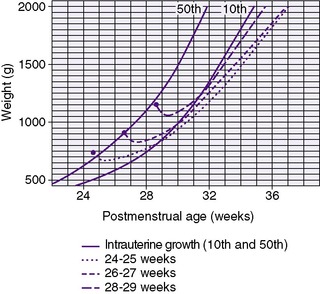 |
| FIGURE 17-9
Average body weight versus postmenstrual age in weeks for infants with gestational ages 24 to 25 weeks (dotted line), 26 to 27 weeks (short dashes), and 28 to 29 weeks (long dashes). The reference intrauterine growth curves were plotted using the smoothed 10 th and 50 th percentiles birth weight data reported by Alexander et al. 3
(From Ehrenkranz RA, Younes N, Lemons JA, et al: Longitudinal growth of hospitalized very low birth weight infants. Reproduced with permission from Pediatrics 104:287, 1999, © American Academy of Pediatrics.)
|
Concerns about the safety of enteral feeding of preterm infants have frequently delayed the initiation of feedings, but evidence is accumulating to suggest early initiation of low-volume enteral feedings (“minimal enteral nutrition”), especially with human milk, improves gastrointestinal development, motility, and function in the preterm infant and protects against NEC and systemic infection.7,31,81 Enteral feedings are associated with surges in gut hormone production that mediate trophic effects on gastrointestinal growth and mucosal maturation. Absorption of nutrients is improved with increased amount and length of villous absorptive surface. Provision of only small quantities of milk into the neonatal gastrointestinal tract promotes the production of locally acting gut hormones, such as gastrin, enteroglucagon, and motilin, which are thought to be very important for normal intestinal maturation. 85 Feeding tolerance is improved and full enteral feedings are achieved earlier in these infants. 82,85Minimal enteral feedings also have been shown to improve nutritional outcome (weight gain, bone mineralization) in preterm infants.100 The potential advantages of minimal enteral feeding are listed in Box 17-7. Failure to provide any enteral nutrition for prolonged periods to the newborn infant should be avoided unless small-volume feeding is specifically contraindicated.
BOX 17-7
• No increase in incidence of necrotizing enterocolitis
• Decreased sepsis82
• Decreased permeability of mucosa to foreign antigens
• Increased intestinal peptides and hormones85
• Increased mucosal thickness and villi
• Maturation of intestinal motor activity81
• Improved feeding tolerance82
• Improved bone mineralization118
• Earlier achievement of full enteral feedings82
• Improved weight gain82
• Shorter hospital stay82
• Reduced requirement for supplemental oxygen82
During the acute phase of a preterm infant’s illness, aggressive nutrition should be provided by the parenteral route (see Chapter 16), but studies have shown that minimal enteral feedings can safely be started by day of life 2 or 3, even in very small or ill infants. Feedings from 6 to 20 mL/kg/day divided into every 2- to 24-hour slow bolus feeds are given without advancement for several days. The transition to nutritive enteral feedings then can proceed slowly as described below, with continuous assessment of feeding tolerance to avoid complications such as NEC. Mother’s colostrum/milk is the preferred initial feeding choice, but, if necessary, donor human milk or full-strength formula may be used as an alternative for minimal enteral feeding. Although most infants benefit from early enteral feeding, those who are asphyxiated, hypotensive, severely hypoxemic, or symptomatic with patent ductus arteriosus or those with evidence of NEC should not be fed enterally. These infants should be managed with aggressive full parenteral nutrition.
Few controlled trials support any given feeding strategy, although rapid advances to large feeding volumes are poorly tolerated by most preterm infants. 8 There is some evidence of calorie loss from expressed human milk and increased bacterial contamination during continuous gavage feeding. 12,28Benefits of continuous feedings include decreased energy expenditure and improved growth in the preterm infant.44Similar growth usually is achieved whether infants are fed intermittently or continuously.95,104,106 However, infants fed by continuous tube feeding take longer to achieve full enteral feeds. 95 Studies indicate that an intermittent “slow” infusion (e.g., 3 hours of volume given over 1 hour out of three) improves gastric emptying and duodenal motility. 6,26 The following guidelines reflect just one approach to enteral feedings; caution and flexibility must be used in following any feeding schedule. In general, the smaller the infant, the greater attention must be paid to feeding tolerance, although large infants certainly can develop serious feeding intolerance and NEC.
After a period of gut priming, usually 5 to 7 days, with minimal enteral feedings, advancement to full nutritive enteral feedings for the infant who weighs less than 2000 g should proceed in increments not greater than 15 to 20 mL/kg/day. Full feedings of human milk or formula (approximately 160 mL/kg/day) are achieved over 7 to 10 days. In most cases, breast milk should be fed to the infant in the order in which it is collected, with the colostrum given first. An alternative for infants who cannot tolerate large volumes of feedings is hind milk (see Chapter 18), which has increased fat content and may be given preferentially to increase energy delivery. Once the infant is tolerating 100 mL/kg/day of enteral nutrition, breast milk can be fortified with the addition of human milk fortifiers (see Table 17-3). Thus progression to full enteral feedings of fortified human milk or 24 kcal/oz preterm infant formula occurs over a minimum of 2 weeks. During this time, parenteral nutritional support is tapered to maintain from birth at least 3.5 g/kg/day protein, 30% to 54% of total calories from fat, and 40% to 60% of total calories from carbohydrate. In general, infants weighing less than 1200 g are fed every 2 hours and those weighing more are fed every 3 hours if bolus feedings are tolerated without emesis or residuals. Firm experimental support for any feeding guidelines for preterm infants is sorely lacking, however. The suggested approach is both arbitrary and conservative. Individualization of feeding strategy is necessary for either more sick and physiologically unstable infants or more well and stable infants.
Late-Preterm Infant
The late-preterm infant, born at 34 to 37 weeks’ gestation, represents the fastest growing preterm population, now accounting for more than 70% of all preterm births. Although generally these babies are larger and healthier than less mature newborns, NICU admission is frequently for feeding issues. The infant has intact, functional digestive and absorptive functions, but motility and intestinal colonization may be delayed. Of particular clinical importance is the immaturity of oromotor tone, function, and neural integration. As mentioned, the suck-swallow-breathing reflex develops between 33 and 36 weeks’ gestation. Infants born during this period may initially seem to feed well but cannot maintain successful feeding the first week of life. Poor feeding is much more frequent in this group of babies, potentially contributing to problems of hypoglycemia and hyperbilirubinemia. The ideal food for these infants is not well studied, but it is reasonable to fortify mother’s milk or use preterm formulas and provide supplemental vitamins and minerals until the infant is taking full enteral feedings appropriate for a term infant.
THE INTRAUTERINE GROWTH–RESTRICTED INFANT
Nutritional support for the small-for-gestational-age infant requires separate consideration, because decreased size-for-dates occurs with various pathologic conditions or no pathology at all. Small size at birth is related to any number of diseases or abnormalities, both intrinsic and extrinsic to the fetus and newborn. Early events in gestation, including chromosomal and genetic abnormalities or early infection, lead to symmetric growth restriction. In contrast, asymmetric growth restriction occurs in response to late placental insufficiency or other insults that restrict nutrient supply to the fetus. Many completely healthy and normal infants are constitutionally small. Complicating these issues is the fact that preterm infants often are growth restricted at birth (i.e., whatever led to growth restriction also contributed to processes that caused or promoted preterm birth). Such infants require more individualized management, because they may not tolerate advancing enteral feedings and do not necessarily respond to increased nutrient intake with appropriate rates of growth.11,115 Furthermore, overfeeding a growth-restricted infant has been considered a cause of adult diseases such as obesity, insulin resistance, diabetes, and cardiovascular disease. 72
In general, growth-restricted infants are likely to have increased energy needs and low stores of energy, nutrients, and minerals.24,91 Hypoglycemia, 50 hyperglycemia, increased need for heat production, and increased risk for gastrointestinal ischemia and NEC are more likely in the early postnatal period in these infants than in their normally grown peers. These problems require anticipatory nutritional monitoring and management. Early parenteral glucose, protein, and energy supplementation is necessary while cautious enteral feedings are started.
CHANGES IN NUTRITIONAL REQUIREMENTS WITH ILLNESS
Studies in adult patients have shown dramatic changes in nutritional requirements depending on type of illness, degree of illness, surgery, and premorbid nutritional status. Although these changes are not well studied in neonates, preliminary data and clinical experience indicate similar changes should be expected in ill infants. In fact, these patients have even greater nutritional needs because of requirements for growth and development. The overriding observation from all studies, however, is that ELBW and VLBW preterm infants are underfed during the early postnatal period and that this undernutrition, combined with additional stresses from various diseases, increases the risk for long-term adverse neurologic sequelae. The value of achieving a specific body composition and growth rate is less certain. There remains a critical need for determining the right quality, as well as quantity, of nutrients for these infants. The effects of common disease states on the nutrient requirements in preterm and term infants are shown inFigure 17-6.
Acute and chronic respiratory diseases are the most common illnesses in neonates. Acute respiratory problems, such as respiratory distress syndrome, pneumonia, and aspiration, all increase the infant’s metabolic needs for energy and protein. Energy requirements are met by increasing carbohydrate and fat delivery. However, the metabolism of excessive carbohydrate feeding (>12.5 mg/kg/min) may be detrimental to pulmonary status by increasing oxygen consumption and carbon dioxide production, increasing respiratory work, and adding to respiratory failure. Lipid is a good alternative source of concentrated energy because its metabolism has a lower respiratory quotient and produces less carbon dioxide. Lipids provide dense calories for volume and prevent essential fatty acid deficiency. Protein wasting and catabolism with illness increase the infant’s requirement for exogenous support. Adequate provision of amino acids, especially branched-chain amino acids, prevents catabolism of body protein stores, including respiratory and diaphragmatic muscle protein, and may improve minute ventilation by decreasing carbon dioxide production.
Infants with chronic lung disease and bronchopulmonary dysplasia present difficult nutritional problems. Poor nutrition is associated with abnormal lung development, increased toxic effects of oxygen, decreased surfactant production, and increased risk for infection. Although energy and metabolic demands are increased in these patients, many routine management strategies make the disease process worse. Excessive fluid volumes increase pulmonary edema and contribute to lung injury. Increased work of breathing limits intake. Steroid therapy and chronic disease have negative effects on protein balance. Diuretic use can waste calcium and potassium. Decreasing the proportion of energy provided by carbohydrates has been shown in older infants with chronic respiratory disease to decrease lipogenesis and therefore carbon dioxide production. Vitamin supplementation should be provided at the estimated advisable intake.
Congenital heart disease, especially when accompanied by cyanosis or congestive heart failure, significantly impairs nutritional status and growth. These infants have increased basal metabolic needs and experience the additional catabolic stress of early surgery. Nutritional management also is complicated by underlying hypoxemia, diuretic therapy, respiratory distress, malabsorption, and delicate fluid balance. Mineral derangement is common postoperatively with diuretic therapy and suboptimal intake. Iron supplementation is necessary to provide for increased erythropoiesis with chronic hypoxemia.
Good nutritional status can decrease the risk for infection and sepsis, as well as improve recovery in neonates. Normal immune response depends on adequate protein energy, micronutrients, and trace elements. Although not well studied in this population, it appears that the metabolic requirements of septic infants, especially for energy and amino acids, are much greater than the requirements of otherwise similar, but uninfected, infants.
The infant with NEC or short bowel syndrome is at additional risk for malnutrition because of malabsorption and increased nutrient losses. During the acute illness, these patients must receive adequate parenteral nutrition. Recovery needs to be supported by gradual increases in enteral nutrition and slowly decreasing parenteral supplementation. Of particular concern are excessive water losses with electrolyte imbalance and malabsorption of fats and fat-soluble vitamins.
Any infant recovering from asphyxia or shock should probably not receive enteral feedings for 24 to 72 hours to allow recovery of the bowel from the ischemic injury and decrease the risk for NEC.
Neonates who have undergone surgery are at increased risk for nutritional deficiencies resulting from the stresses of illness and surgery and possible abnormal nutrient and water losses. In these infants, enteral feedings are preferred because they are safe and more economical, preserve the integrity of the intestinal mucosa, and promote continued development of the gastrointestinal tract. After an operative procedure, the infant is often nil per os (NPO) status for 3 to 14 days until the return of intestinal motility and function (e.g., stooling, lack of abdominal distention, decreased gastric aspirates, absence of bilious aspirates). The method of feeding chosen, rapidity of feeding advancement, formula composition, and type of feeding depend on the infant’s general medical condition, gastrointestinal function, and type of surgery. The choice of formula for the postsurgical neonate depends on bowel integrity. An infant recovering from mild NEC may be started on human milk or regular formula. With serious or surgically treated NEC, human milk is preferred but an elemental or hydrolysate formula may be used.
Oral feedings should be started postoperatively in the term infant if he or she is awake, hungry, and able to suck, swallow, and gag and has normal intestinal motility and no respiratory distress. Preterm infants usually need gavage feeding. Daily and weekly growth should be monitored and assessed relative to caloric intake. Inadequate growth may be treated with increased volumes, increased caloric density, or a less stressful method of feeding (e.g., a combination of nipple and gavage feedings).
DEVELOPMENTAL SUPPORT
The importance of developmentally supportive feeding cannot be overlooked when discussing infant nutrition. Prematurity resulting in delayed introduction of feeding skills, surgical interventions for congenital or genetic abnormalities sometimes necessitating alternative feeding methods such as gastrostomy tube feedings, and prolonged interruption of normal feeding patterns are all examples of the impact that hospitalization can have on patients and their families. 22
Being aware of the impact that prolonged hospitalization can have on feeding is the first step in being able to provide support and guidance to families of fragile infants. By using a team approach, the family can help support their infant in attaining and strengthening feeding skills in preparation for discharge and hopefully prevent or minimize long-term feeding difficulties that often are associated with an extended hospital stay, such as loss of feeding skills and feeding aversion issues. 14,61
A supportive feeding team should include the parents, physicians, nurse practitioners, lactation specialists, nutritionists, occupational and physical therapists, developmental specialists, and nursing staff educated in the developmental support of infants with specialized feeding needs. This support should start as soon as an infant is admitted and continue beyond discharge to promote the best possible outcome with regard to feeding ability.
FAMILY SUPPORT
Parents of the NICU patient may feel overwhelmed by their infant’s illness, appearance, and uncertain future. Loss of control of the infant’s care and unclear parental roles make bonding difficult and add to feelings of helplessness, frustration, and isolation. It is imperative that the health care team and especially the bedside nurse be supportive of the parents as caregivers. This support can begin with education about early feeding practices in the nursery and anticipated infant growth and development. Feeding is an excellent way to involve parents in their infant’s care. Parents should be involved in discussions of feeding practices and food choices. During gavage feedings, parents should be encouraged to hold their infant and support the pacifier to encourage nonnutritive sucking. Frequent communication about the ups and downs of feeding the sick newborn, as well as weekly progress updates on growth charts, is helpful.
A mother’s ability to provide breast milk remains the one aspect of care that she alone can do for her infant. Preterm birth and prolonged illness, as well as the inability to breast feed the infant directly, are major barriers to successful breast feeding. Lactation support in the NICU increases mothers’ success at maintaining lactation through discharge from the NICU. Guidelines for expression and collection of human breast milk, gavage feeding of human milk, and identification of oral feeding readiness all are essential elements of lactation support and success (see Chapter 18).
FEEDING THE PREMATURELY BORN INFANT AFTER HOSPITAL DISCHARGE
Many preterm infants are still preterm when they are discharged from the NICU, and most are small for their corrected gestational age (i.e., they are growth restricted) despite attempts to improve in-hospital nutrition. 32 These infants require continued attention to nutritional support after hospital discharge. Infants who are discharged on breast milk feedings can be supplemented with powder formula fortification of mother’s milk or a 24 kcal/oz formula if growth is suboptimal. Vitamins and minerals should be supplemented for all breast-feeding infants. Demand feeding should be initiated before discharge to document adequate growth on the chosen feeding regimen.
Efforts to wean formula-fed infants to 20 kcal/oz formula before discharge may be counterproductive. Transitional or post-discharge formulas have been used for such infants. These products are intermediate between preterm and term formulas in their energy, protein, calcium, phosphorus, vitamin, and mineral contents. Providing preterm infants with a formula containing higher protein and energy contents after discharge until a corrected age of 12 months has resulted in improved growth.19,41 See Table 17-7 for post-discharge formula nutritional composition.
Infants with significant chronic lung disease who require supplemental oxygen at home are particularly likely to need 24 kcal/oz formula after discharge to maintain adequate growth at home. Oxygen supplementation itself also improves growth in these infants when normal oxygen saturation is maintained. The ideal composition of feedings in “recovering” preterm infants has yet to be determined; however, efforts to continue feeding with a 22- or 24-kcal/oz infant formula with a higher protein and mineral content for several months after hospital discharge are supported by studies showing long-term improvement in growth and neurodevelopmental outcome, even for preterm infants who do not have significant chronic illnesses.
REFERENCES
1. Abrams, B.; Selvin, S., Maternal weight gain pattern and birth weight, Obstet Gynecol 86 (1995) 163.
2. al Tawil, Y.; Berseth, C.L., Gestational and postnatal maturation of duodenal motor responses to intragastric feeding, J Pediatr 129 (3) ( 1996) 374.
3. Alexander, G.; Himes, J.H.; Kaufman, R.B.; et al., A United States national reference for fetal growth, Obstet Gynecol 87 (1996) 2; 163.
4. American Academy of Pediatrics, Committee on Fetus and Newborn: Controversies concerning vitamin K and the newborn, Pediatrics 112 (2003) 191.
5. American Academy of Pediatrics, Section on Breastfeeding, Breastfeeding and the use of human milk, Pediatrics 115 (2005) 496.
6. Baker, J.H.; Berseth, C.L., Duodenal motor responses in preterm infants fed formula with varying concentrations and rates of infusion, Pediatr Res 42 (1997) 618.
7. Berseth, C.L., Minimal enteral feedings, Clin Perinatol 22 (1995) 195.
8. Berseth, C.L.; Bisquera, J.A.; Paje, V.U., Prolonging small feeding volumes early in life decreases the incidence of necrotizing enterocolitis in very low birth weight infants, Pediatrics 111 (2003) 529.
9. Bhatia, J.; Greer, F.; , and the Committee on Nutrition, Use of soy protein-based formulas in infant feeding, Pediatrics 121 (5) ( 2008) 1062.
10. Bloomfield, F.H.; Harding, J.E., Fetal nutrition, In: (Editors: Thureen, P.J.; Hay Jr, W.W.) Neonatal nutrition and metabolismed 2 ( 2006)Cambridge University Press, New York.
11. Brandt, I.; Sticker, E.J.; Lentze, M.J., Catch-up growth of head circumference of very low birth weight, small for gestational age preterm infants and mental development to adulthood, J Pediatr 142 (2003) 463.
12. Brennan-Behan, M.; Carlson, G.; Meier, P.; et al., Calorie loss from expressed mother’s milk during continuous gavage infusion, Neonatal Netw 13 (1994) 27.
13. Brown, J.M.; Murtaugh, M.A.; Jacobs Jr, D.R.; et al., Variation in newborn size according to prepregnancy weight change by trimester, Am J Clin Nutr 76 (2002) 205.
14. Browne, J.; Gabrielski, L.; Paul, D., Guidelines for oral feeding. ( 1998)Center for Family & Infant Interaction, Denver.
15. Burdge, G.C.; Hanson, M.A.; Slater-Jeffries, J.L.; et al., Epigenetic regulation of transcription: a mechanism for inducing variations in phenotype (fetal programming) by differences in nutrition during early life?Br J Nutr 97 (6) ( 2007) 1036.
16. Burkhardt, T.; Schaffer, L.; Zimmermann, R.; et al., Newborn weight charts underestimate the incidence of low birthweight in preterm infants, Am J Obstet Gynecol 199 (2) ( 2008) 139.e6.
17. Burrin, D.G.; Stoll, B., Key nutrients and growth factors for the neonatal gastrointestinal tract, Clin Perinatol 29 (2002) 65.
18. Caicedo, R.A.; Schanler, R.J.; Li, N.; et al., The developing ecosystem: implications for the neonate, Pediatr Res 58 (4) ( 2005) 625.
19. Carver, J.D.; Wu, P.Y.K.; Hall, R.T.; et al., Growth of preterm infants fed nutrient-enriched or term formula after hospital discharge, Pediatrics 107 (4) ( 2001) 683.
20. Clark, R.; Thomas, P.; Peabody, J., Extrauterine growth restriction remains a serious problem in prematurely born neonates, Pediatrics 111 (2003) 986.
21. Cleal, J.K.; Lewis, R.M., The mechanisms and regulation of placental amino acid transport to the human foetus, J Neuroendocrinology 20 (2008) 419.
22. Comrie, J.D.; Helm, J.M., Common feeding problems in the intensive care nursery: maturation, organization, evaluation and management strategies, Semin Speech Lang 18 (1997) 239.
23. Cooke, R.; Ainsworth, S.; Fenton, A., Postnatal growth retardation: a universal problem in preterm infants, Arch Dis Child Fetal Neonatal Ed 89 (2004) F428.
24. Davies, P.S.W.; Clough, H.; Bishop, N.J.; et al., Total energy expenditure in small for gestational age infants, Arch Dis Child Fetal Neonatal Ed 74 (1996) F208.
25. Delvin, E.E.; Salle, Bl; Claris, O.; et al., Oral vitamin A, E, and D supplementation of pre-term newborns either breast-fed or formula-fed: a 3-month longitudinal study, J Pediatr Gastroenterol Nutr 40 (1) ( 2005) 43.
26. De Ville, K.; Knapp, E.; Al-Tawil, Y.; et al., Slow infusion feedings enhance duodenal motor responses and gastric emptying in preterm infants, Am J Clin Nutr 68 (1998) 103.
27. Dinnerstein, A.; Nieto, R.M.; Solana, C.L.; et al., Early and aggressive nutrition strategy (parenteral and enteral) decreases postnatal growth failure in very low birth weight infants, J Perinatol 26 (2006) 436.
28. Dodd, V.; Freman, R., A field study of bacterial growth in continuous feedings in a NICU, Neonatal Netw 9 (1991) 17.
29. Dumont, R.C.; Rudolph, C.D., Development of gastrointestinal motility in the infant and child, Gastroenterol Clin North Am 23 (1994) 655.
30. Dusick, A.M.; Poindexter, B.B.; Ehrenkranz, R.A.; et al., Growth failure in the preterm infant: can we catch up?Semin Perinatol 27 (2003) 302.
31. Ehrenkranz, R.A., Early, aggressive nutritional management for very low birth weight infants: what is the evidence?Semin Perinatol 31 (2007) 48.
32. Ehrenkranz, R.A.; Younes, N.; Lemons, J.A.; et al., Longitudinal growth of hospitalized very low birth weight infants, Pediatrics 104 (1999) 280.
33. Embleton, N.E.; Pang, N.; Cooke, R.J., Postnatal malnutrition and growth retardation: an inevitable consequence of current recommendations in preterm infants?Pediatrics 107 (2001) 270.
34. Eritsland, J., Safety considerations of polyunsaturated fatty acids, Am J Clin Nutr 71 (2000) 197.
35. ESPGHAN Committee on Nutrition Agostino, C.; Axelsson, I.; Goulet, O.; et al., Soy protein infant formulae and follow-on formulae: a commentary by the ESPGHAN Committee on Nutrition, J Pediatr Gastroenterol Nutr 42 (2006) 352.
36. Fenton, T.R., A new growth chart for preterm babies: Babson and Benda’s chart updated with recent data and a new format, BMC Pediatrics 3 (2003) 13.
37. Fewtrell, M.S.; Abbott, R.A.; Kennedy, K.; et al., Randomised, double-blind trial of long-chain polyunsaturated fatty acid supplementation with fish oil and borage oil in preterm infants, J Pediatr 144 (2004) 471.
38. Fewtrell, M.S.; Morley, R.; Abbott, R.A.; et al., Catch-up growth in small-for-gestational-age term infants: a randomized trial, Am J Clin Nutr 74 (2001) 516.
39. Fewtrell, M.S.; Morley, R.; Abbott, R.A.; et al., Double-blind, randomized trial of long-chain polyunsaturated fatty acid supplementation in formula fed to preterm infants, Pediatrics 110 (2002) 73.
40. Franz, A.R.; Pohlandt, F.; Bode, H.; et al., Intrauterine, early neonatal, and postdischarge growth and neurodevelopmental outcome at 5.4 years in extremely preterm infants after intensive neonatal nutritional support, Pediatrics 123 (1) ( 2009) e101.
41. Gibson, A.T.; Carney, S.; Cavazzoni, E.; et al., Neonatal and post-natal growth, Horm Res 53 (Suppl 1) ( 2000) 42.
42. Gicquel, C.; El-Osta, A.; LeBouc, Y., Epigenetic regulation and fetal programming, Best Pract Res Clin Endocrinol Metab 22 (1) ( 2008) 1.
43. Graham III, P.L.; Begg, M.D.; Larson, E.; et al., Risk factors for late onset gram-negative sepsis in low birth weight infants hospitalized in the neonatal intensive care unit, Pediatr Infect Dis J 25 (2006) 113.
44. Grant, J.; Denne, S.C., Effect of intermittent versus continuous enteral feeding on energy expenditure in premature infants, J Pediatr 118 (1991) 928.
45. Greer, F.R.; Sicherer, S.H.; Burks, A.W.; et al., Effects of early nutritional interventions on the development of atopic disease in infants and children: the role of maternal dietary restriction, breastfeeding, timing of introduction of complementary foods, and hydrolyzed formulas, Pediatrics 121 (1) ( 2008) 183.
46. Guillet, R.; Stoll, B.J.; Cotton, C.M.; et al., Association of H2-blocker therapy and higher incidence of necrotizing enterocolitis in very low birth weight infants, Pediatrics 117 (2) ( 2006) e137.
47. Harmsen, H.J.; Wildeboer-Veloo, A.C.; Raangs, G.C.; et al., Analysis of intestinal flora development in breast-fed and formula-fed infants by using molecular identification and detection methods, J Pediatr Gastroenterol Nutr 30 (2000) 61.
48. Heird, W.C.; Lapillonne, A., The role of essential fatty acids in development, Annu Rev Nutr 25 (2005) 549.
49. Henriksen, C.; Helland, I.B.; Ronnestad, A.; et al., Fat-soluble vitamins in breast-fed preterm and term infants, Eur J Clin Nutr 60 (6) ( 2006) 756.
50. Holtrop, P.C., The frequency of hypoglycemia in full-term large and small for gestational age newborns, Am J Perinatol 10 (1993) 150.
51. Huppi, P.S., Nutrition for the brain, Pediatr Res 63 (3) ( 2008) 229.
52. Innis, S.M., Perinatal biochemistry and physiology of long-chain polyunsaturated fatty acids, J Pediatr 143 (2003) S1.
53. Innis, S.M.; Adamkin, D.H.; Hall, R.T.; et al., Docosahexaenoic acid and arachidonic acid enhance growth with no adverse effects in preterm infants fed formula, J Pediatrics 140 (2002) 547.
54. Isaacs, E.B.; Gadian, D.G.; Sabatini, S.; et al., The effects of early human diet on caudate volumes and IQ, Pediatr Res 63 (3) ( 2008) 308.
55. Jadcherla, S.R.; Berseth, C.L., Effect of erythromycin on gastroduodenal contractile activity in developing neonates, J Pediatr Gastroenterol Nutr 34 (1) ( 2002) 16.
56. Jadcherla, S.R.; Duong, H.G.; Hoffmann, R.G.; et al., Esophageal body and upper esophageal sphincter motor responses to esophageal provocation during maturation in preterm newborns, J Pediatr 143 (2003) 31.
57. Jansson, T.; Cetin, I.; Powell, T.L.; et al., Placental transport and metabolism in fetal overgrowth: a workshop report, Placenta 27 (1) ( 2006) 109.
58. Jansson, T.; Powell, T.L., IFPA 2005 Award in Placentology Lecture. Human placental transport in altered fetal growth: does the placenta function as a nutrient sensor?—a review, Placenta 27 (Suppl A) ( 2006) S91.
59. Kashyap, S.; Forsyth, M.; Zucker, C.; et al., Effects of varying protein and energy intakes on growth and metabolic response in low birth weight infants, J Pediatr 108 (1986) 995.
60. Kashyap, S.; Schulze, K.F.; Forsyth, M.; et al., Growth, nutrient retention, and metabolic response in low birth weight infants fed varying intakes of protein and energy, J Pediatr 113 (1988) 713.
61. Kenner, C.; Lott, J.W., Newborn and infant neurodevelopmental development, In: Comprehensive neonatal nursing: a physiological perspectiveed 3 ( 2003)Saunders, Philadelphia, p. 258.
62. Kirchengast, S.; Harlmann, B., Maternal prepregnancy weight status and pregnancy weight gain as major determinants for newborn weight and size, Annals of Human Biol 25 (1) ( 1998) 17.
63. Klein, C.J., Nutrient requirements for preterm infant formulas, J Nutr 132 (2002) 1395S.
64. Knight, B.; Shields, B.M.; Hill, A.; et al., The impact of maternal glycemia and obesity on early postnatal growth in a nondiabetic Caucasian population, Diabetes Care 30 (4) ( 2007) 777.
65. Knight, B.; Shields, B.M.; Turner, M.; et al., Evidence of genetic regulation of fetal longitudinal growth, Early Hum Dev 81 (10) ( 2005) 823.
66. Koletzko, B.; Agostoni, C.; Carlson, S.E.; et al., Long chain polyunsaturated fatty acids (LC-PUFA) and perinatal development, Acta Paediatr 90 (2001) 460.
67. Koletzko, B.; Sauerwald, U.; Keicher, U.; et al., Fatty acid profiles, antioxidant status, and growth of preterm infants fed diets without or with long-chain polyunsaturated fatty acids, Eur J Nutr 42 (5) ( 2003) 243.
68. Kuschel, C.A.; Harding, J.E., Protein supplementation of human milk for promoting growth in preterm infants (review), Cochrane Database Syst Rev 2 (2000); CD000433.
69. Latal-Hajnal, B.; Von Siebenthal, K.; Kovari, H.; et al., Postnatal growth in VLBW infants: significant association with neurodevelopment outcome, J Pediatr 143 (2003) 163.
70. Laubereau, B.; Brockow, I.; Zirngibl, A.; et al., Effect of breast-feeding on the development of atopic dermatitis during the first 3 years of life: results from the GINI-birth cohort study, J Pediatr 144 (2004) 602.
71. Liepke, C.; Adermann, K.; Raida, M.; et al., Human milk provides peptides highly stimulating to the growth of bifidobacter, Eur J Biochem 269 (2002) 712.
72. Lucas, A., Programming by early nutrition: an experimental approach, J Nutr 128 (Suppl 2) ( 1998) 410S.
73. Lucas, A.; Cole, T.J., Randomised trial of early diet in preterm babies and later intelligence quotient, BMJ 317 (1998) 1481.
74. Lucas, A.; Hudson, G., Preterm milk as a source of protein for low birth weight infants, Arch Dis Child 59 (1984) 831.
75. Lucas, A.; Morley, R.; Cole, T.J.; et al., Early diet in preterm babies and developmental status at 18 months, Lancet 335 (1990) 1477.
76. Lucas, A.; Morley, R.; Cole, T.J.; et al., Breast milk and subsequent intelligence quotient in children born preterm, Lancet 339 (1992) 261.
77. Mackie, R.I.; Sghir, A.; Gaskins, H.R., Developmental microbial ecology of the neonatal gastrointestinal tract, Am J Clin Nutr 69 (Suppl) ( 1999) 1035S.
78. Manson, W.G.; Weaver, L.T., Fat digestion in the neonate, Arch Dis Child Fetal Neonatal Ed 76 (1997) F206.
79. Martin, R.; Langa, S.; Reviriego, C.; et al., Human milk is the source of lactic acid bacteria for the infant gut, J Pediatr 143 (2003) 754.
80. Mathews, M.S.; MacDorman, M.F., Infant mortality statistics from the 2005 period linked birth/infant death data set, National Vital Statistics Reports 57 (2) ( 2008) 1.
81. McClure, R.J.; Newell, S.J., Randomised controlled trial of trophic feeding and gut motility, Arch Dis Child Fetal Neonatal Ed 80 (1999) F54.
82. McClure, R.J.; Newell, S.J., Randomised controlled study of clinical outcome following trophic feeding, Arch Dis Child Fetal Neonatal Ed 82 (2000) F29.
83. McGuire, W.; McEwan, P., Transpyloric versus gastric tube feeding for preterm infants, Cochrane Database Syst Rev 3 (2002); CD003487.
84. McGuire, W.; McEwan, P., Systematic review of transpyloric versus gastric feeding for preterm infants (review), Arch Dis Child Fetal Neonatal Ed 89 (2004) F245.
85. Meetze, W.H.; Valentine, C.; McGuigan, J.E.; et al., Gastrointestinal priming prior to full enteral nutrition in very low birth weight infants, J Pediatr Gastroenterol Nutr 15 (1992) 163.
86. Miniello, V.L.; Moro, G.E.; Tarantino, M.; et al., Soy-based formulas and phyto-oestrogens: a safety profile, Acta Pediatr Suppl 441 (2003) 93.
87. Montgomery, R.K.; Mulberg, A.E.; Grand, R.J., Development of the human gastrointestinal tract: twenty years of progress, Gastroenterology 116 (1999) 702.
88. Newburg, D.S.; Walker, W.A., Protection of the neonate by the innate immune system of developing gut and of human milk, Pediatr Res 61 (1) ( 2006) 2.
89. Newell, S.J.; Chapman, S.; Booth, I.W., Ultrasonic assessment of gastric emptying in the preterm infant, Arch Dis Child 60 (1 Spec No) ( 1993) 32.
90. Nyqvist, K.H.; Sorell, A.; Ewald, U., Litmus tests for verification of feeding tube location in infants: evaluation of their clinical use, J Clin Nurs 14 (2005) 486.
91. Olivares, M.; Llaguno, S.; Marin, V.; et al., Iron status in low-birth-weight infants, small and appropriate for gestational age: a follow up study, Acta Paediatr 81 (1992) 824.
92. Ortiz, J.E.; Sottile, F.D.; Siegel, P.; et al., Gastric colonization as a consequence of stress ulcer prophylaxis: a prospective, randomized trial, Pharmacotherapy 18 (1998) 486.
93. Penders, J.; Thijs, C.; Vink, C.; et al., Factors influencing the composition of the intestinal microbia in early infancy, Pediatriacs 118 (2) ( 2006) 511.
94. Phillips, C.; Johnson, N.E., The impact of quality of diet and other factors on birth weight of infants, Am J Clin Nutr 30 (1977) 215.
95. Premji, S.; Chessell, L., Continuous nasogastric milk feeding versus intermittent bolus milk feeding for premature infants less than 1500 grams, Cochrane Database Syst Rev 1 (2001); CD001819.
96. Radmacher, P.G.; Looney, S.W.; Rafail, S.T.; et al., Prediction of extrauterine growth retardation (EUGR) in VLBW infants, J Perinatol 23 (2003) 392.
97. Regnault, T.R.; Friedman, J.E.; Wilkening, R.B.; et al., Fetoplacental transport and utilization of amino acids in IUGR: a review, Placenta 26 (Suppl A) ( 2005) S52.
98. Reidel, B.D.; Greene, H.L., Vitamins, In: (Editor: Hay Jr., W.W.) Neonatal nutrition and metabolism ( 1991)Mosby, St Louis.
99. Reis, B.B.; Hall, R.T.; Schanler, R.J.; et al., Enhanced growth of preterm infants fed a new powdered human milk fortifier: a randomized, controlled trial, Pediatrics 106 (2000) 581.
100. Rigo, J.; Pieltain, C.; Salle, B.; et al., Enteral calcium, phosphate, and vitamin D requirements and bone mineralization in preterm infants, Acta Pediatr 96 (7) ( 2007) 969.
101. Robertson, C., Catch-up growth among very-low-birth-weight preterm infants: a historical perspective, J Pediatr 143 (2003) 145.
102. Rodriquez, A.; Raederstorff, D.; Sarda, P.; et al., Preterm infant formula supplementation with alpha linolenic acid and docosahexanoic acid, Eur J Clin Nutr 57 (2003) 727.
103. Salle, B.L.; Delvin, E.E.; Lapillonne, A.; et al., Perinatal metabolism of vitamin D, Am J Clin Nutr 71 (Suppl 5) ( 2000) 1317S.
104. Schanler, R.J.; Schulman, R.J.; Lau, C.; et al., Feeding strategies for premature infants: randomized trial of gastrointestinal priming and tube-feeding, Pediatrics 103 (1999) 434.
105. Shaker, C.S., Nipple feeding premature infants: a different perspective, Neonatal Netw 8 (1990) 9.
106. Silvestre, M.A.; Morbach, C.A.; Brans, Y.W.; et al., A prospective randomized trial comparing continuous versus intermittent feeding methods in very low birth weight neonates, J Pediatr 128 (1996) 748.
107. Simmer, K., Long chain polyunsaturated fatty acid supplementation in infants born at term, Cochrane Database Syst Rev 4 (2001); CD000376.
108. Singhai, A.; Cole, T.; Fewtrell, M.; et al., Is slower early growth beneficial for long-term cardiovascular health?Circulation 109 (2004) 1108.
109. Singhai, A.; Fewtrell, M.; Cole, T.; et al., Low nutrient intake and early growth for later insulin resistance in adolescents born preterm, Lancet 361 (2003) 1089.
110. In: (Editors: Tsang, R.C.; Uauy, R.; Koletzko, B.; et al.) Nutrition of the preterm infant: scientific basis and practical guidelinesed 2 ( 2005)Digital Educational Publishing, Cincinnati.
111. Turck, D., Soy protein for infant feeding: what do we know?Curr Opin Clin Nutr Metab Care 10 (2007) 360.
112. Tyson, J.E.; Wright, L.L.; Oh, W.; et al., Vitamin A supplementation for extremely-low-birth-weight infants, N Engl J Med 340 (1999) 1962.
113. Van Den Driessche, M.; Peeters, K.; Marien, P.; et al., Gastric emptying in formula-fed and breast-fed infants measured with the 13C-octanoic acid breath test, J Ped Gastroenterol Nutr 29 (1) ( 1999) 46.
114. Villar, J.; Cogswell, M.; Kestler, E.; et al., Effect of fat and fat-free mass deposition during pregnancy on birth weight, Am J Obstet Gynecol 167 (5) ( 1992) 1344.
115. Vohr, B.R.; McKinley, L.T., The challenge pays off: early enhanced nutritional intake for VLBW small-for-gestation neonates improves long-term outcome, J Pediatr 142 (2003) 459.
116. Wagner, C.L.; Greer, F.R.; , and the AAP Section on Nutrition Breastfeeding and the Committee on Nutrition, Prevention of rickets and vitamin D deficiency in the infant, child, and adolescent, Pediatrics 122 (5) ( 2008) 1142.
117. Waterland, R.A., Epigenetic mechanisms and gastrointestinal development, J Pediatr 149 (Suppl 5) ( 2006) S137.
118. Weiler, H.A.; Fitzpatrick-Wong, S.C.; Schellenberg, J.M., Minimal enteral feeding within 3 d of birth in prematurely born infants with birth weight < or = 1200g improves bone mass by term age, Am J Clin Nutr 83 (1) ( 2006) 155.