14. Fluid and Electrolyte Management*
James E. Jones, Ray D. Hayes, Alisa L. Starbuck and Peter J. Porcelli
Advances in the management of specific neonatal disorders have contributed to a remarkable decline in morbidity and mortality in newborns. Fluid and electrolyte therapy, thermal regulation, and maintenance of oxygenation remain central features of modern, supportive neonatal intensive care. Thus infants requiring tertiary care (and most infants requiring intermediate level II or secondary care) will initially receive parenteral fluid and electrolytes. Fluid and nutrition data have been accumulated for full-term infants, but some crucial information is still missing regarding very-low-birth-weight (VLBW) infants (infants with birth weights <1500 g). For example, it is clear that the restrictive fluid policies of the 1950s aimed at reducing the observed postnatal diuresis were misguided efforts that caused hyperosmolality, hyperbilirubinemia, and hypoglycemia. On the other hand, the degree to which initial fluid, electrolyte, and glucose administration should be “liberalized” remains uncertain, 1,3,4 largely because patent ductus arteriosus, necrotizing enterocolitis, bronchopulmonary dysplasia (BPD), intraventricular hemorrhage (IVH), and hyperglycemia in VLBW infants are associated with larger volumes of fluid, electrolyte, and glucose administration. 1 At best, clinicians make approximations for therapy in many clinical situations, which is why good measures of fluid and electrolyte requirements are needed. In addition, the fluid requirements of VLBW infants may be modified by prenatal steroid administration to mothers and the use of artificial surfactant in infants.
This chapter discusses implementation of the following fundamental principles: (1) rapidly assessing the infant’s initial condition; (2) developing a short-term, time-oriented management plan; (3) initiating therapy; and (4) monitoring the infant and modifying the plan based on clinical and biochemical data.
PHYSIOLOGY
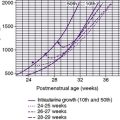
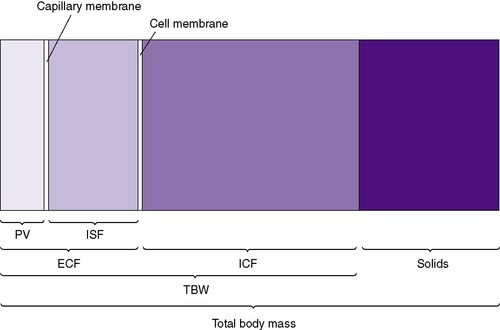
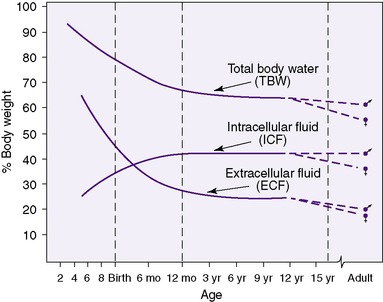
Neonates show significant physiologic differences when compared (on a per-kilogram basis) with older children and adults: (1) their basic metabolic rate is greater, even double; (2) their fluid requirements are four to five times higher; (3) their sodium excretion is only 10% of that in older children and adults; and (4) their glomerular filtration rate is 5 to 10 times less than that of adults. 3 The subdivisions of total body mass (TBM) are illustrated in Figure 14-1. Total body water (TBW) as a percentage of TBM demonstrates a curvilinear decline with increasing gestational age (Figure 14-2). During the early fetal period, the fetus’s TBW is 95% of total weight and decreases to 80% at 8 months gestation and then to 75% at term. 3 Intracellular fluid (ICF) and extracellular fluid (ECF) as percentages of TBM change in opposite directions as gestational age advances, whereas ECF decreases as ICF increases with growth. 2
 |
| FIGURE 14-1
(From Winters RW, editor: The body fluids in pediatrics, Boston, 1973, Little, Brown.)
|
 |
| FIGURE 14-2
(From Winters RW, editor: The body fluids in pediatrics, Boston, 1973, Little, Brown.)
|
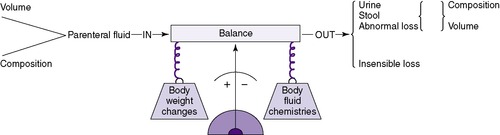
These physiologic and body composition phenomena result in a narrow margin of safety when calculating fluids and electrolytes for small infants, especially those less than 1250 g. Caregivers should independently calculate all requirements and compare calculations with standard guidelines. Intravenous (IV) fluid should be administered by a special infusion pump that can regulate fluid with precision of at least 0.1 mL/hr. Intake should be measured hourly and all output measured. The balance of intake versus output should be assessed at least every 8 to 12 hours using a standard form (Figure 14-3). Once clinical signs of fluid overload or deficit occur, it may be difficult to regain balance. Fluid balance should be managed prospectively with consistent procedures as a part of every initial care plan.
 |
 |
| FIGURE 14-3
(Courtesy Brenner Children’s Hospital, Winston-Salem, North Carolina.)
|
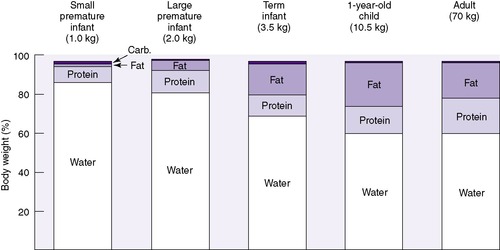
The effect of gestational age on body composition is striking (Figure 14-4). Because gestational age is a significant determinant of the percentage and distribution of TBW, accurate assessment is important. Changes in distribution and percent of body water will be influenced by intrauterine growth, maternal fluid balance, postnatal age, postnatal diet, daily water intake, and changing fluid and electrolyte absorption and excretion.
 |
| FIGURE 14-4
(From Heird WC, Driscoll JM Jr, Schullinger JN, et al: Intravenous alimentation in pediatric patients, J Pediatr 80:351, 1972.)
|
The initial (first 1 to 3 days) weight loss of both healthy term (up to 5% to 10% of TBM) and preterm (up to 10% to 15% of TBM) infants should be considered a normal physiologic loss of fluid from the interstitial fluid (ISF), rather than a pathophysiologic catabolism of body tissues. After birth, contraction of the ECF compartment occurs, followed by natriuresis, diuresis, and weight loss. 2,3 This weight loss is then regained over 7 to 10 days as muscle and fat. Preterm neonates often demonstrate relative oliguria during the first 24 to 48 hours. Neonates with respiratory distress syndrome (RDS) will have delayed postnatal contraction of the ECF compartment, further delaying diuresis. Onset of the diuresis after several days old usually coincides with the initial stages of recovery from RDS. 5
Despite the period of natriuresis after birth, infants usually require no additional sodium during the first 24 to 48 hours of life. This strategy can promote decreased oxygen requirement and possibly decreased incidence of chronic lung disease. 2 It is normal to have an initial negative sodium balance, but later it is necessary to retain sodium and often additional sodium supplementation is required for appropriate growth. 5
Reviewing the maternal history and the intrapartum course may be helpful to calculate the infant’s fluid and electrolyte requirements. For example, if the mother received large amounts of electrolyte-free fluids in the intrapartum period, the neonate may be hyponatremic and have an expanded ECF space at birth. Because small-for-gestational-age (SGA) infants have reduced amounts of fat, body water (as a percentage of TBM) increases. Conversely, large-for-gestational-age (LGA) infants with an increased amount of body fat have a lower percentage of TBW.
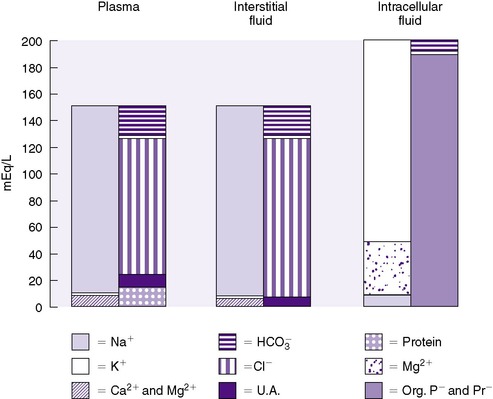
ECF comprises both intravascular fluid (plasma) and ISF. The electrolyte composition of ISF and plasma is similar, but it is strikingly different from ICF (Figure 14-5). Sodium is the major cation in ECF (both ISF and plasma) and is easily measured. Potassium, the major cation in ICF, on the other hand, cannot be measured readily because ICF is not easily accessible. Because 90% of the total body potassium is intracellular, low levels of plasma potassium are assumed to reflect low total body potassium.
 |
| FIGURE 14-5
(From Winters RW, editor: The body fluids in pediatrics. Boston, 1973, Little, Brown.)
|
Osmotic force or pressure is a property of solutions. Osmotic phenomena depend on the number (N) of particles in a solution regardless of size or charge and are measured in milliosmoles (mOsm) according to this equation:

where mOsm represents the osmolality or osmolarity of the solution, mM represents the concentration of the measured particles in moles per liter and N represents the number of particles in the solution for each molecule after the substance is dissolved. For example, each molecule of NaCl when dissolved in water dissociates into two ions, each of which is osmotically active. N for NaCl is therefore 2.
Table 14-1 shows three examples. Unfortunately, two physical chemistry terms are used interchangeably in clinical medicine: (1) osmolality (milliosmole per kilogram of water) and (2) osmolarity (milliosmole per liter of solution). In most laboratories, osmotic forces are determined by the technique of freezing point depression, so osmolality is the correct term (normally 280 to 300 mOsm/kg water). The difference in terms is usually unimportant, because the total solid content per liter of plasma is small.
| mM | N | mOsm | |
|---|---|---|---|
| NaCl | 1 | 2 | 2 |
| Glucose | 1 | 1 | 1 |
| CaCl2 | 1 | 3 | 3 |
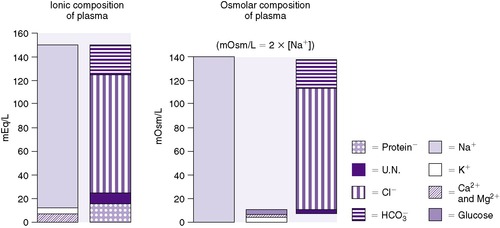
Osmolality can be satisfactorily estimated in many clinical settings by the following formula (Figure 14-6):
 |
| FIGURE 14-6
(From Winters RW, editor: The body fluids in pediatrics, Boston, 1973, Little, Brown.)
|

The coefficients 1/18 and 1/2.8 for the glucose and blood urea nitrogen (BUN) terms are present to convert milligrams per deciliter values to millimolar concentrations. For example, a patient with a serum sodium concentration of 135 mEq/L, a glucose of 72 mg/dL, and a BUN of 28 mg/dL has a calculated osmolality of:


Osmotic forces are responsible for apparently low plasma electrolyte concentrations in some common clinical settings. For example, in hyperglycemia, the plasma sodium concentration reported by the laboratory is usually low but the total effective osmolality may be normal, as seen in this example:


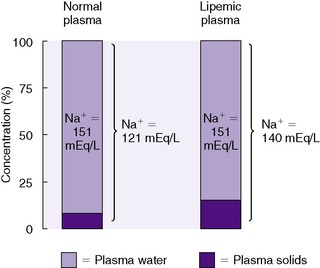
An analogous situation exists for the less frequent condition, hyperlipidemia, in which low laboratory plasma sodium values are reported with a normal osmolality (Figure 14-7). Low laboratory values for plasma sodium occur because the increase in plasma solids (lipids) causes a lower plasma water content because of water displacement and hence a lower sodium concentration per liter of whole plasma. In this case, the plasma water and sodium concentration may be normal.
 |
| FIGURE 14-7
(From Winters RW, editor: The body fluids in pediatrics, Boston, 1973, Little, Brown.)
|
Osmotic forces largely determine shifts in the internal redistribution of water in hydration disturbances. Four pure disturbances of hydration exist: (1) too much electrolyte; (2) too little electrolyte; (3) too much water; and (4) too little water. Combinations of these disturbances often occur. Another example of changes in osmolality occurs in preterm infants who undergo insensible water loss because of skin immaturity, decreased body fat, and a large surface-to-volume ratio leading to increased evaporation. This water loss from the interstitial space results in a hyperosmolar extracellular compartment exhibited by hypernatremia and occasionally hyperkalemia and hyperglycemia. 2,3
Neonatal renal “immaturity” affects fluid balance and electrolyte needs. Renal functions do not develop at the same rate. Neonatal glomerular filtration rate (GFR) is low in utero but increases rapidly within a few hours after delivery because renal blood flow increases as a result of the increasing mean arterial blood pressure and increasing glomerular permeability. 5 Glomerular filtration rate is a measure of renal function, which assesses how infants vary their fluid and electrolyte excretion and reabsorption according to their input and losses.
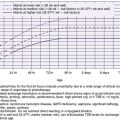
GFR is independent of gestational age. It rises rapidly during the first 6 weeks of life, gradually increasing more slowly during infancy, and reaches adult values by 12 months of age. A very-low-birth-weight (VLBW) infant in satisfactory condition at 6 weeks should have adequate GFR. These observations are based on the infant developing a full complement of nephrons (about 34 weeks’ gestation) and the continued increase in glomerular surface area (beyond 40 weeks’ gestation). 3,4 Glomerular filtration rate can be compromised in critically ill neonates by a patent ductus arteriosus and mechanical ventilation. Extubation can improve GFR by up to 15%. 5
Renal tubular function is responsible for mineral and electrolyte excretion and reabsorption. Renal tubular function is influenced by gestational age. 5 Therefore urine sodium losses are a function of gestational age and sodium intake. Preterm infants with immature tubular function have a limited ability to excrete sodium. Urine sodium excretion increases slowly during the first 2 years of life. When increased amounts of sodium are provided to more mature infants, there will be a renal response resulting in elevated urine sodium as the renal system attempts to normalize serum sodium.
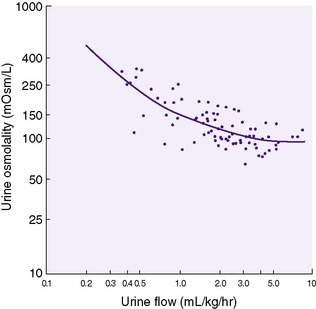
The capacity to change urine concentration in VLBW infants appears limited but can be influenced by gestational age and nutrient intake. Immature concentrating ability (maximum of approximately 600 mOsm/L) (Figure 14-8) coupled with an inability to excrete (rapidly) an acute water or sodium load results in a narrow margin of safety when prescribing fluid and electrolytes, especially in VLBW infants. 1,3,4
 |
| FIGURE 14-8
(From Jones MD, Gresham EL, Battaglia FC: Urinary flow rate and urea excretion rates in newborn infants, Biol Neonate 21:322, 1972.)
|
Urea is the major component of urine osmolality (and hence specific gravity), whereas electrolytes quantitatively contribute less. When total parenteral nutrition is provided, urine specific gravity may rise because of the low renal threshold for glucose and amino acids. When specific gravity rises, the cause should be identified before adjusting the fluid infusion rate. A diagnostic test (Multistix 10 SC or Chemstrip) can screen for glucose and protein but not for amino acids, which must be detected by amino acid chromatography when necessary.
Neonatal urinary acidification is limited, and the threshold for bicarbonate excretion is reduced. Both physiologic and pathologic factors can contribute to alkaline urine. VLBW infants have a limited capacity for hydrogen ion excretion, whereas other infants may have acute illnesses such as bicarbonate-losing tubular necrosis or urinary tract infection.
The roles of hormones including antidiuretic hormone, aldosterone, atrial natriuretic factor, and parathormone to regulate neonatal fluid and electrolyte balance are not well defined. Hormonal influences can be primary, such as in the syndrome of inappropriate secretion of antidiuretic hormone and in some cases of hypocalcemia. Secondary hormonal influences can be caused by certain drugs, such as the aldosterone antagonist spironolactone.
Insensible water loss (IWL) occurs via pulmonary and cutaneous routes and is influenced by the factors listed in Table 14-2. However, IWL varies greatly depending on gestational age and birth weight (Table 14-3). The neonate’s environment significantly affects fluid balance. Radiant warmer usage decreases the neonate’s radiant heat loss but can increase IWL by 50% to 200%, resulting in hypernatremic dehydration. 6 Incubators reduce radiant heat loss via their double-walled Plexiglas design.
| Decrease IWL | Increase IWL |
|---|---|
|
Heat shield or double-walled incubators
Plastic blankets
Clothes
High relative humidity (ambient ventilator gas)
Emollient use
|
Inversely related to gestational age and weight
Respiratory distress
Ambient temperature above thermoneutral
Fever
Radiant warmer
Phototherapy
Activity
|
| Increment for phototherapy: 20-30 mL/kg/day if patient is in open warmer and has radiant phototherapy. No adjustment if baby is in humidified environment and/or has fiberoptic phototherapy source. | |||||
| Increment for radiant warmer: 20-30 mL/kg/day. | |||||
| Maintenance solutes: Glucose: 7-12 g/kg/day (4-8 g/kg in VLBW infants) | |||||
| Na: 1-4 mEq/kg/day (2-8 mEq/kg/day in VLBW infants) K: 1-4 mEq/kg/day Cl: 1-4 mEq/kg/day Ca: 1 mEq/kg/day | |||||
| IWL, Insensible water loss; VLBW, very-low-birth-weight. | |||||
| *Adjustment based on a urine flow rate of 2 to 5 mL/kg/hr and a stable weight. |
|||||
| †May be reduced by 30% if the infant is on a ventilator. |
|||||
| Weight (g) | Ranges of Water Loss | Day 1* | Days 2-3* | Days 4-7* | |
|---|---|---|---|---|---|
| Less than 1250 |
40-170
50-100
5-10
|
||||
| TOTAL | 95-280 | 120 | 140 | 150-175 | |
| 1250-1750 |
20-50
50-100
5-10
|
||||
| TOTAL | 75-160 | 90 | 110 | 130-140 | |
| More than 1750 |
15-40
50-100
5-10
|
||||
| TOTAL | 70-150 | 80 | 90 | 100-200 | |
Modern incubators provide sterile humidity (up to 80%) and are very effective in decreasing IWL by reducing evaporative heat loss. Internal incubator humidification was discontinued in the 1970s when it was associated with Pseudomonas infections. 7 Presumably, the nature of Pseudomonas promoted its stability and growth in the water humidification reservoirs. However, present humidification designs provide for direct heating of water in an external reservoir to a temperature that kills most organisms. The water is transformed into vapor, rather than mist, and carried in a gaseous state by the incubator’s convective air flow, thus reducing the possibility of airborne bacterial transfer. 7
Because added environmental humidity reduces transcutaneous evaporative water loss, a preterm infant nursed in humidity needs less fluid than if nursed without humidity to achieve the same water balance. A relative humidity of 80% can reduce water loss to one tenth of the water loss of preterm infants receiving care in 50% humidity. 6 This reduction in evaporative water loss has a significant impact on fluid requirements and electrolyte balance in premature infants. For infants with birth weight less than 1000 grams, the use of humidity results in lower fluid intake as well as fewer episodes of hypernatremia, hyperkalemia, and azotemia in the first 96 hours of life. 6 Despite these improvements, the optimal level and duration of humidification have yet to be determined.
ETIOLOGY
The causes of common electrolyte problems and common clinical syndromes are discussed in the “Treatment” section.
PREVENTION
Prevention of fluid and electrolyte imbalance in neonates begins with knowing how to calculate fluid and electrolyte requirements correctly. The estimated metabolic rate forms the reference base for all calculations. The metabolic rate (and hence oxygen consumption) normally increases steadily over the first weeks of life, so changes in water and electrolyte requirements should be anticipated.
If the daily caloric requirement is approximately 100 cal/kg/day, the physiologic basis of metabolic rate may be used to calculate needs; however, most institutions determine an infant’s daily fluid need on a mL/kg basis, which is modified by factors that influence IWL and is usually adjusted depending on body weight, clinical composition, serum chemistry results, and urine volume and composition (Figure 14-9; see also Table 14-3).
Preterm infants usually have slightly lower metabolic rates than those of term infants. SGA infants may have higher metabolic rates than those of preterm infants of similar weight, 2 which may be because of their relatively large brain/body mass ratio. Both SGA and preterm infants, especially VLBW infants, should be expected to require more frequent assessment and modification of requirements.
Preterm infants, however, are subject to other problems that may diminish the influence of this metabolic rate when calculating fluid needs. SGA infants may require more water per kilogram than either preterm or term, appropriately grown infants (AGA infants). Input should be recorded every hour, and output should be recorded as produced. VLBW infants require frequent monitoring of fluid balance, so if output is unusually large, intake must be adjusted immediately. If fluid intake lags behind losses, critically ill infants may develop hypernatremia and may not tolerate “catching up.” Continuous monitoring is necessary to ensure that fluid is administered in appropriate amounts. Current infusion pumps can accurately infuse volumes of 0.1 mL/hr and must be used for the smallest, sickest infants.
Requirements for fluid and electrolytes are divided into maintenance and deficit needs. Maintenance indicates the infant remains in a zero balance state and can be subdivided into (1) normal loss, which consists of water and electrolyte loss through stool, urine, and insensible (lung and skin) routes and (2) abnormal or increased losses, such as gastrointestinal/diarrhea, ostomy, and chest tube drainage.
All diapers should be preweighed using a gram scale and marked with dry/tare weight. After each stool or void, the diaper is reweighed; the difference equals the amount of loss. For example, if the dry weight is 20 g and the wet weight is 26 g, the difference is 6 g, or 6 mL of stool or urine. All losses should be calculated to the nearest milliliter.
The term deficit refers to previously incurred losses. These should be uncommon in the newborn but can occur when there are unrecognized losses such as “third space” or interstitial losses with necrotizing enterocolitis (NEC) (see below). In older neonates, deficits may occur with disorders that have an insidious or delayed onset, such as renal tubular dysfunction or nonvirilizing congenital adrenal hyperplasia.
Deficits are best estimated by body weight comparisons. Weight loss greater than 10% to 15% in 1 week should be considered excessive. VLBW infants are particularly difficult to maintain within 10% to 15% of birth weight during the first week of life. 6 Growth charts assist with calculations of weight loss and/or gain, and help consider the normal physiologic weight loss that occurs during the first several days after birth when calculating an infant’s fluid needs.
The initial choice of parenteral solution depends on the weight and postnatal age of the infant (see Table 14-3). Also important is whether the infant is in an incubator with a heated humidified environment or under a radiant warmer without a plastic blanket or heat shield. Uncovered VLBW infants under radiant warmers demonstrate IWL of up to 170 mL/kg/day,5and thus use of radiant warmers should be avoided if possible. Maintenance of water and glucose needs in larger infants on the first day of life can usually be met by a 10% glucose solution infused at 80 mL/kg/day, which provides an acceptable glucose infusion of about 5.5 mg/kg/min. The infusion rate can be increased gradually to 100 to 120 mL/kg/day using principles of monitoring discussed below.
All sick infants require IV access for fluid administration.5 The IV equipment should include (1) a needle or catheter, (2) connecting tubing, and (3) an infusion pump.
Electrolytes such as sodium and potassium are usually omitted the first day and then added as the salt of acetate, chloride, or phosphate in amounts of 1 to 4 mEq/kg/day. Mildly acidotic and VLBW infants may be given their sodium requirements as sodium acetate, which is metabolized to bicarbonate. 3Potassium should never be added to IV fluid until urine flow and renal function have been assessed. The maintenance requirement for calcium is 0.5 to 1 mEq/kg/day (about 100 to 200 mg/kg/day) of calcium gluconate. This maintenance is most important in VLBW infants and those who are severely ill.
Factors that influence IWL must be identified early and maintenance needs adjusted appropriately to prevent problems with water and electrolyte balance. Management of VLBW infants presents special, complex problems, and further research is needed. The following observations may help:
• Total fluid requirements should start at 110 to 120 mL/kg/day at birth and often need to be increased by 20 to 40 mL/kg/day over days 2 to 4 of life, plateauing at 150 to 175 mL/kg/day.
• Sodium requirements (including medications) are 2 to 3 mEq/kg/day after 24 hours of age and may reach a maximum of 5 to 7 mEq/kg/day on days 5 and 6.
• Cumulative weight loss plateaus at 11% to 15% of birth weight (95% confidence limits) by postnatal day 3 to 4.
• Maintaining normal serum glucose concentrations (50 to 150 mg/dL) in VLBW infants requires relatively less glucose (4 to 8 g/kg/day) than in term infants. The glucose concentration of the fluids administered may need to be changed, sometimes frequently, to maintain an appropriate serum glucose concentration. With the larger initial fluid requirements of very tiny babies, lower glucose concentrations, sometimes down to D 5W (5 mg% or 5 mg/dL) in IV fluids are often prescribed as the initial fluid. As anticipated, infants weighing less than 1000 g are the most difficult to manage without inducing either excessive weight loss, hypernatremia, or hyperglycemia.
VLBW infants, especially those stabilized under radiant warmers, may have greatly increased IWL with fluid requirements in the range of 175 to 200 mL/kg/day. By the end of the first week of life, as the epithelium cornifies, their daily requirements decrease to 120 to 150 mL/kg/day. When oral caloric intake is low (<50 kcal/kg/day), neonates will require significant administration of IV fluids, which should be provided as parenteral nutrition6 containing glucose, amino acids, lipids, vitamins, and micronutrients (see Chapter 16).
DATA COLLECTION
Parenteral therapy should be based on the following principles: (1) assess the patient’s clinical status for maintenance needs, factors that modify IWL, and confounding medical or surgical disorders; (2) calculate short-term (12 to 24 hours) fluid and electrolyte needs; (3) initiate therapy at the proper site and infusion rate; and (4) monitor and adjust the fluid infusion rate and content based on clinical and biochemical data.
History
Factors influencing IWL (see Table 14-2) include gestational age, birth weight, and postnatal age. It is important to know the fluids that the mother received during labor, since, for example, large volumes of hypotonic fluids administered to the mother may dilute the infant’s serum electrolytes and expand the intravascular volume. When the patient’s condition changes, it is important to detail the change to evaluate the potential effect of the new condition on fluid and electrolyte balance and requirements. Thus NEC may be associated with an acute need for additional volume expansion–type fluids because of “third space losses,” whereas with acute renal failure, anuria should prompt clinical reassessment and usually indicates reducing daily fluid administration.
Signs and Symptoms
Weight, urine output (see the Data Collection box below), and serum sodium concentration (see the Data Collection box below) are the best overall clinical guides to assess whether therapy is adequate. Weight is the most sensitive index of IWL and must be accurately determined at least every 24 hours. Accurate daily weights in VLBW infants require special nursing efforts and often electronic bed scales.
Clinical Evaluation of Fluid and Electrolyte Status
• Serial weight (sometimes 2 to 3 times per day)
• Heart rate
• Blood pressure
• Skin perfusion
• Urine output
• Other drainage (ostomies, gastric, chest tubes)
Laboratory Evaluation of Fluid and Electrolyte Status
Essential values are included in this box. Other measurements are routinely made but are less valuable in the rapid determination of fluid status and complications of imbalances.
• Sodium (most sensitive indicator of water loss in excess of electrolytes, as is insensible water loss)
• Potassium (may rise with decreased kidney perfusion and acidosis)
• Hematocrit (will rise with extracellular fluid contraction)
• BUN (relatively insensitive indicator of dehydration in neonate)
• Creatinine (will rise slowly with renal failure)
• Total CO 2 (low level indicates acidosis, either because of bicarbonate loss or metabolic acidosis from poor tissue perfusion and anaerobic metabolism)
Urine output should be 2 to 5 mL/kg/hr with a specific gravity of 1.002 to 1.010 (60 to 300 mOsm). Blood pressure and peripheral perfusion may be used to reflect changes in vascular volume and cardiac output. Normal capillary refill is typically less than 3 seconds and is more reliable when tested on the forehead or sternum. However, its sensitivity and specificity have been questioned in older infants and should be interpreted with caution as a sign of adequate hydration. Blood pressure and heart rate should be evaluated in conjunction with capillary refill time.
Loss of skin turgor is a late and variable sign and usually is not helpful in assessing therapy, but vital signs (heart rate, respiratory rate, and temperature) provide useful signs about metabolic rate and stress. However, temperature may be affected by many external factors. Drainage volume and content from ostomies, chest tubes, nasogastric tubes, and other sites should be quantitated accurately. Fluid samples can be submitted for laboratory analysis to improve the accuracy of the replacement fluids. The amounts of drainage represent maintenance requirements that must be added to the calculation of baseline daily maintenance needs (abnormal + normal = total maintenance).
Laboratory Data
Tests for concentrations of electrolytes (Na+, K+, Cl−, Ca2+), red blood cells (hematocrit), glucose, BUN or creatinine, and acid-base status should be performed serially (see the Data Collection box on p. 344). Occasionally, serum osmolality and protein concentrations are helpful in assessing the neonate’s condition. The anion gap may be calculated from the difference of the positive and negative ions, sodium, chloride, and bicarbonate: (Na + − [Cl − +  ]). A relatively low anion gap associated with the metabolic acidosis generally reflects bicarbonate loss in the urine, which can be normal in VLBW or abnormal in renal tubular acidosis.
]). A relatively low anion gap associated with the metabolic acidosis generally reflects bicarbonate loss in the urine, which can be normal in VLBW or abnormal in renal tubular acidosis.Urine volume must be recorded with every void. Measuring urine osmolality and glucose and electrolyte concentrations helps clarify fluid and electrolyte balance when amounts of glucose, protein, or other solutes appear in the urine.
All drainage must be collected and measured, with the concentration of solutes determined (see the Data Collection box on p. 344). Accumulations over 4 to 6 hours are preferable to a single “spot” collection, which may be misleading. Occasionally, determining trace electrolyte elements, hematocrit, and protein content of urine or drainage can be crucial to management. However there are no “normal” values for urine electrolyte concentrations because they must be interpreted with respect to the infant’s clinical diagnosis and the serum electrolyte concentrations.
TREATMENT
Techniques of IV Therapy
In modern neonatal intensive care, percutaneously placed central venous catheters have become an invaluable tool. Placement permits long-term administration of IV fluids, avoiding multiple painful procedures for peripheral IV placement and the need for surgical placement of a long-term central catheter. This is particularly valuable for extremely-low-birth-weight (ELBW) infants for whom the time to establish full enteral feedings may be prolonged. This technique is also helpful for long-term parenteral nutrition. Complications of long-term indwelling central catheters include infection, thrombosis, phlebitis, perforation, and infiltration. The risk for infection is directly related to the duration of the line’s placement. Therefore these catheters should be discontinued as soon as enteral nutrition is adequately established. Thrombosis is more likely to occur when the flow rate of IV fluids is extremely low (<1 mL/hr). Infiltration usually occurs at the site of the catheter tip. This includes infiltration into the mediastinum, pleural space, or pericardium, depending on the location of the tip of the catheter (see Chapter 16).
Percutaneous insertion of Silastic catheters can be accomplished readily but requires clinical training and experience. Insertion sites include the saphenous, antecubital, axillary, basilic, cephalic, and external jugular veins. Advancing the catheter to a deep vein such as the superior or inferior vena cava is relatively simple but may be associated with thrombotic complications. The position of the catheter tip must be confirmed radiographically. Cannulation of the subclavian vein of VLBW infants requires insertion by a pediatric surgeon. Venesection or cutdown of peripheral or central vessels can be performed with appropriate training.
Peripheral venous access continues to be a valuable approach to IV therapy when short-term vascular access is needed. The advent of extremely small catheter and introducer sets (e.g., Quick Caths, Angiocaths) has permitted prolonged (5 to 7 days) use of a single peripheral infusion site. “Butterfly” infusion sets are rarely used for IV access.
A rubber band is an effective tourniquet for the extremity of a small infant. Attention must be paid to antiseptic technique when acquiring venous access. The skin should be cleaned with an antiseptic of 2% chlorhexidine and 70% isopropyl alcohol. Avoid shaving the head because parents may find this upsetting. Before puncturing the skin, prepare materials for placement. It is important to recognize the significant risk for infiltration and skin necrosis with a peripherally inserted IV line. The risk is greatest in the foot, less with the hand, and the least on the scalp. Calcium-containing solutions in parenteral nutrition present an additional risk, particularly for skin damage. Prevention of such extravasation injuries is paramount because few treatment options are available. Although the needle or catheter must be taped in place, the tape should allow for adequate visualization of the site. The fluid administered should be recorded at least every hour, and the site should be observed for signs of infiltration. Syringe infusion pumps are used to administer IV fluids so that volumes as small as 0.1 mL/hr can be infused accurately. The arm or leg can be positioned and stabilized on a padded board to prevent movement and minimize catheter displacement. The need for immobilization is less with catheters than with butterfly infusion sets. However, the board may need to be removed after several hours to visually ensure that no infiltration has occurred and to intermittently mobilize the limb. The most common complication of IV therapy is infiltration, with rates as high as 78%. 2If extravasation occurs, the infusion should be stopped immediately and the IV catheter removed. The affected extremity should then be elevated to limit swelling.6 Hyaluronidase is an enzyme that degrades hyaluronic acid, a constituent of the normal interstitial barrier, which increases the distribution and absorption of locally injected substances. 8 By facilitating more rapid absorption of potentially damaging fluid, tissue necrosis may be lessened. A plastic surgery consultation should be considered when tissues necrosis occurs.
Umbilical vessel catheterization should be limited to several days’ duration until a central catheter can be placed (see Chapter 7).
Common Problems
In neonatal intensive care units (NICUs), virtually all patients initially receive IV fluid therapy. Therefore conventional rules of pediatric fluid therapy that estimate losses and project deficit replacement may not be appropriate. Weight, urine output and concentration, and the concentration of various solutes in serum and other body fluids are usually known. The correct diagnosis usually rests on clinical and laboratory measurements (not estimates), which are supported by the clinical setting. For example, one can compute the amount of sodium required to correct a deficit using the following formula:

This calculation considers that the sodium will be given as a “dry salt.” The total amount and the rate given are a matter of clinical judgment. In practice, often the clinician prescribes 50% of the calculated sodium deficit, remeasures serum sodium, and then modifies the IV solution. Attempts should be made to identify the etiology of the deficit while these conditions are being corrected, or it may recur.
Common Electrolyte Disorders
HYPOCALCEMIA (INFANTS WITH SERUM CALCIUM LESS THAN 7 mg/dL)
Hypocalcemia is a common finding in critically ill babies. Clinical findings may correlate poorly with biochemical data (total or ionized calcium). Jitteriness, irritability, and twitching are common initial, but nonspecific, signs. Both serum calcium and glucose should be measured. Hypocalcemia is strongly associated with infants of diabetic mothers and in infants with asphyxia, prematurity, and delayed nutrition. Risk for “early” hypocalcemia within 72 hours of birth is minimized by supplementing IV fluids with 35 or more mg/kg/day of elemental calcium2 or initiating parenteral nutrition with 60 or more mg/kg/day for preterm infants. 2 Alternatively, early neonatal hypocalcemia may be prevented with oral calcium supplementation of 80 mg/kg/day of calcium gluconate. 2 (100 mg of calcium gluconate = 9.1 mg of elemental calcium.)
Attempts to rapidly correct hypocalcemia, using bolus infusions and slow infusions over 2 to 3 minutes, are not as successful and may induce dysrhythmias, compared with more gradual attempts to correct hypocalcemia. Either repeated slow infusions every 6 hours or a continuous infusion is best. Additional calcium should be given intravenously as 100 to 200 mg/kg/dose of calcium gluconate over 4 to 6 hours if seizures or biochemical abnormality persists. “Late” hypocalcemia, occurring at more than 7 days of age, usually has a specific cause such as malabsorption, hypomagnesemia, hypoparathyroidism, long-term diuretic therapy, or rickets and should be evaluated in detail.
Care should be taken when administering IV calcium: (1) the infant should receive cardiac monitoring to detect bradycardia; (2) calcium administration should be discontinued immediately if bradycardia occurs; and (3) the peripheral IV site should be checked for patency before and during administration because of the potential for skin necrosis, sloughing, and calcification caused by infiltrated calcium.
HYPERNATREMIA (INFANTS WITH SERUM SODIUM MORE THAN 150 mEq/L)
Clinical signs of hypernatremia are rare, except for late-occurring seizures. The most common causes of hypernatremia are (1) dehydration, usually caused by too little “free water” administration, (2) injudicious use of sodium-containing solution, such as sodium bicarbonate bolus infusion and sodium-containing medications, and (3) congenital or acquired reduction in antidiuretic hormone resulting in excess loss of “free water,” diabetes insipidus. Intracranial bleeding correlates strongly with hypernatremia. 6Management should be directed toward prevention, and infants with hypernatremia should have serum sodium reduced slowly to prevent seizures. Infants who experience hypernatremic dehydration often appear better hydrated than they are because hypernatremia shifts fluid into the intravascular space.
HYPONATREMIA (INFANTS WITH SERUM SODIUM LESS THAN 130 mEq/L)
Hyponatremia is usually asymptomatic because it develops chronically rather than as an acute imbalance; however, a late clinical sign is seizure. The most common causes include (1) excess hydration as a result of maternal or neonatal administration of electrolyte-free solutions, (2) renal loss of sodium in neonates receiving diuretic therapy, especially in VLBW infants, and (3) the syndrome of inappropriate antidiuretic hormone secretion (SIADH) that is suspected when decreased serum sodium and decreased urine output occur. This syndrome is associated with central nervous system (CNS) and lung pathologic conditions. Clinical criteria include (1) low serum sodium, (2) continued inappropriately high urine sodium loss, (3) urine osmolality greater than plasma, and (4) normal adrenal and renal function. Management is by water restriction until diuresis follows, and treatment is directed toward resolving the etiology.
HYPERKALEMIA (INFANTS WITH SERUM POTASSIUM MORE THAN 7 mEq/L)
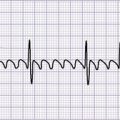
Causes of hyperkalemia include (1) acidosis with or without tissue destruction, (2) renal failure (water overload may limit management), (3) adrenal insufficiency (relatively uncommon), and (4) iatrogenic secondary to inappropriate potassium administration. Table 14-4 outlines clinical signs and electrocardiogram (ECG) changes. Management is directed toward resolving the causes and nonspecific treatment, depending on the severity of the hyperkalemia and the associated clinical signs:
| Clinical Signs | Electrocardiogram Changes |
|---|---|
|
Muscular weakness
Cardiac dysrhythmias
Ileus
|
Short QT interval
Widening QRS
Sine wave QRS/T
|
• Stop all potassium administration.
• Evaluate total and ionized calcium.
• If hypocalcemia is present, infuse 100 to 200 mg/kg of calcium gluconate to lower the cell membrane threshold. This is transient therapy but may be lifesaving.
• Infuse sodium bicarbonate 1 to 2 mEq/kg, slowly over 30 minutes or longer. This is also transient therapy designed to promote intracellular sodium and hydrogen exchange for potassium. It is particularly useful when the hyperkalemia is associated with acidosis. However, if hyperkalemia is associated with acute renal failure, the relatively large volume of fluid required to deliver the sodium bicarbonate may be concerning.
• Administer 1 g/kg cation exchange resin (sodium polystyrene sulfonate [Kayexalate]) as an oral or rectal solution. Little experience has been reported in neonates, and technical problems of retention can be substantial. Furthermore, this may not be an option if the infant is nil per os (NPO) status or has an injured gastrointestinal tract. When this resin is used, sodium in the resin is exchanged for serum potassium, which may result in hypernatremia. Therefore careful attention must be paid to serum electrolyte concentrations.
• An insulin infusion given simultaneously with a dextrose infusion can help shift potassium to the intracellular space. There are several challenges to this form of therapy. First, the actual dose of insulin administered to the patient varies unpredictably since the insulin adsorbs to plastic IV tubing. Second, significant hypoglycemia and seizures may occur. Serum glucose concentration must be monitored frequently and the glucose infusion adjusted accordingly.
• Perform peritoneal dialysis. With neonatal hyperkalemic peritoneal dialysis, sodium bicarbonate frequently must be added to dialysate to prevent acidosis. Peritoneal dialysis is a complicated procedure in neonates, involving catheter placement and dialysis monitoring. It may be technically impossible in VLBW babies and difficult or impossible when there is injured bowel, as with necrotizing enterocolitis.
HYPOKALEMIA (INFANTS WITH SERUM POTASSIUM LESS THAN 3.5 mEq/L)
About 90% of the body’s total potassium is intracellular. Management is directed toward the causes:
• Low serum potassium always implies significant intracellular depletion, most potassium is intracellular and can be low with normal serum potassium, and IV solutions usually should not exceed 40 mEq/L potassium.
• Diuretic-induced hypokalemia can be minimized by choosing a potassium-sparing diuretic such as spironolactone or providing supplemental potassium.
Clinical signs of hypokalemia are related to muscular weakness and cardiac dysrhythmias. Ileus may occur also. Electrocardiographic changes include decreased T waves and ST depression. The most common causes of hypokalemia are (1) increased gastrointestinal losses from an ostomy or nasogastric tube and (2) renal losses from diuretic therapy.
Common Clinical Syndromes
Acute renal failure is most often caused by (1) extrinsic factors such as perinatal asphyxia, shock, and heart failure, (2) intrinsic factors such as congenital or acquired lesions, and (3) obstructive uropathy, including urethral obstruction or extra-genitourinary mass. Oliguria or anuria usually occurs initially.
During initial oliguria, electrolyte-free glucose infusion should be limited to IWL and urine output. Frequently, this entails providing total fluids of 50 to 80 mL/kg/day. Recovery is usually associated with natriuresis (excessive urinary sodium loss) and osmotic diuresis. This may develop rapidly with sodium losses as high as 20 mEq/kg/day. Body weight and fluid losses must be carefully and frequently measured, at least every 12 hours.
Nonrenal losses, such as gastrointestinal drainage, must also be measured. Ideally, fluid and electrolyte therapy is directed toward maintaining the current weight or a weight loss of 1%/day until recovery is nearly complete. This may be accomplished initially by ordering replacement of IWL as a basal fluid order and replacing a percentage of additional fluid losses on a per-volume basis. The choice of fluid used for replacement depends on the electrolyte content of the fluid lost. Thus it may be helpful to measure urinary sodium and potassium loss concentrations and urine volume, recognizing that any “spot check” of these electrolytes will not fully reflect the loss over a 24-hour period.
Serial determination of serum electrolytes will help refine the fluid orders. As the patient recovers and renal function normalizes, transition to more standard fluids and electrolytes should occur. The renal ability of the patient to concentrate urine must be evaluated serially. If the patient remains in high-output renal failure and fluids are restricted, dehydration may occur. Dehydration will result in weight loss, increased serum electrolyte concentration, and hypernatremia with dilute urine. Weight change during renal failure demands careful reevaluation of the fluid plan.
Diuretics and Electrolytes
Diuretics represent one of the most common classes of drugs administered to sick neonates and infants. Electrolyte disturbances are the most common adverse effects of diuretic therapy and can lead to a variety of consequences. Clinical indications for the use of diuretics in neonates and infants include RDS, BPD, congenital heart disease, and renal failure. The classes of diuretics most commonly used in this age-group include loop diuretics, thiazides, and potassium-sparing diuretics. A discussion of the mechanism of action, diuretic efficacy, and common side effects follows.
LOOP DIURETICS
Loop diuretics bind to one of the chloride binding sites on the Na +/K +/2Cl − transporter, thus inhibiting reabsorption of sodium and chloride in the thick ascending limb of the loop of Henle. Water passively follows the movement of sodium and thus allows for diuresis.
Furosemide is the most widely studied diuretic in neonates and is consequently the prototype loop diuretic. It produces a 10-fold to 35-fold increase in sodium excretion and a 10-fold increase in urine flow. Therefore hyponatremia, hypochloremia, and hypovolemia are common with chronic use of furosemide. Hypokalemia is also of significant concern with chronic use of furosemide. The site of action of furosemide blocks tubular reabsorption of potassium. Potassium losses are also related to increased aldosterone production in the presence of sodium losses. 2
In addition to potassium losses, furosemide also promotes urine calcium and magnesium excretion. The reabsorption of these cations is decreased because of furosemide’s ability to eliminate the transepithelial potential difference. Chronic hypercalciuria leads to hypocalcemia and the possibility of renal calcifications and nephrocalcinosis. Compensatory mechanisms lead to increased parathyroid hormone secretion with associated bone resorption, bone demineralization, osteopenia, and possibly rickets.
Bumetanide is another loop diuretic commonly used in neonates and infants. It is 40 times more potent than furosemide. Side effects are the same as those seen with furosemide.
THIAZIDES
Hydrochlorothiazide and chlorothiazide are the most widely used thiazide diuretics in neonates and infants. Thiazides exert their effect by blocking the Na +-Cl − transporter at the distal convoluted tubule, collecting tubule, and early collecting duct. Because only a small portion of sodium reabsorption occurs in the distal tubule, thiazide diuretic efficacy is limited. However, chlorothiazide in combination with spironolactone has been shown to improve pulmonary mechanics in patients with BPD. 6
Chronic use of thiazide diuretics leads to electrolyte disturbances, although usually they are less severe than with loop diuretics. Hyponatremia and hypokalemia are the most common side effects. Hypokalemia is the result of greater sodium-potassium exchange that occurs secondary to a higher concentration of sodium found in the distal tubule.
Whereas loop diuretics promote calcium loss, thiazide diuretics can increase serum calcium concentrations by increasing renal calcium reabsorption both proximally and distally. 6 This decrease in urinary calcium can be used to reverse loop diuretic–induced renal calcifications.
POTASSIUM-SPARING DIURETICS
Whereas loop and thiazide diuretics directly alter sodium reabsorption via direct inhibition of sodium transporters, potassium-sparing diuretics such as spironolactone competitively antagonize the aldosterone receptor. The primary binding site is the principal cell of the cortical collecting tubule. Aldosterone enhances sodium reabsorption in the collecting tubule and promotes potassium secretion. Therefore antagonizing aldosterone results in diminished sodium reabsorption with a consequent increase in serum concentrations of potassium and hydrogen. However, spironolactone inhibits the reabsorption of less than 2% of filtered sodium and is thus not an effective primary diuretic. The major use is to prevent urinary potassium loss induced by other diuretics.
Hyperkalemia is the primary electrolyte disturbance to monitor with the use of spironolactone. This side effect is usually not of great concern since spironolactone is frequently used in conjunction with other potassium-wasting diuretics. Spironolactone should be avoided in renal failure.
Major Surgery
Surgical trauma is superimposed on the normal metabolic responses of the neonate. The clinical impact is determined by the type and extent of surgery and gestational and postnatal age of the infant. In healthy term infants, negative balance of water, electrolytes, nitrogen, and calories with associated weight loss occurs during the first 3 to 5 days followed by transition to positive balance and weight gain by 7 to 10 days. Parallel transition times for preterm infants vary enormously. Deficits may exist as a result of delayed diagnosis, with external loss or internal loss. “Third space” losses can be significant, with peritoneal losses a notorious source of deficit underestimation.
Predicting the metabolic response to surgery is difficult, reflecting wide variation among individual patients, even patients with similar lesions. Uncontrollable and unmeasurable variables prevent a standardized postoperative physiologic response for neonates, especially those weighing less than 2 kg. Thermoregulation is a particular challenge for operative procedures. The patient is draped and shielded from radiant heat sources. Measuring and managing the patient’s internal temperature with evaporative heat and water loss complicating the situation is difficult once the incision is made. Transport incubators, prewarmed operating rooms, radiant warmers, warming pads, and prewarmed solutions may help achieve thermoneutrality. Intraoperative fluid balance is rarely precise despite the clinicians’s best efforts. Blood loss on sponges, drapes, and other objects should be measured, but IWL from open body cavities is difficult to estimate.
The principles of postoperative management are as follows:
• Monitor clinical and chemical variables frequently, every 4 to 6 hours; evaluate fluid balance, and measure drainage.
• Recognize that insensible water losses may include “third space losses.” These include water lost into the lumen of the bowel or into the peritoneum secondary to peritonitis, resulting in the loss of both water and electrolytes from the intravascular compartment. At least a proportion of the fluids used to anticipate these losses should contain high sodium content similar to plasma, such as lactated Ringer’s solution. Clinical judgment is used to estimate the third space losses since they cannot be measured. Serial evaluations of blood pressure, heart rate, urine output, and skin perfusion together may help determine if the volume prescribed is sufficient.
• Provide 30 to 40 kcal/kg/day as glucose.
• Provide parenteral nutrition early if significant enteral feedings (<50 kcal/kg) cannot be achieved by 3 to 5 days postoperative. Gastrointestinal motility returns rapidly in term infants compared with adults. Almost all VLBW infants require parenteral nutrition after surgery.
COMPLICATIONS
Excessive fluid administration (>180 mL/kg/day) has been associated with chronic lung disease and patent ductus arteriosus (PDA). Inadequate fluid administration has been associated with dehydration, decreased urine output, hypernatremia, poor tissue perfusion, and, potentially, tissue damage.
PARENT TEACHING
The need for and presence of an IV line in a newborn may be frightening for the parents. Clear, medically and physiologically sound explanations (in nonmedical jargon) of the need for fluid and electrolyte support for their infant help allay parents’ fears (see the Parent Teaching box on p. 351). Scalp vein IVs are of particular concern (1) if the hair must be shaved and (2) because a common misconception is that the needle is positioned in the infant’s brain. Explain to parents that scalp vein IVs are in the large veins of the head and not the brain and that an IV in the head stays in longer, thus decreasing the need for multiple vein punctures and allows the infant mobility of all four extremities. In answer to the question “Does it hurt?” a truthful answer is “Yes, when it is put in, but not after it is in the vein.”
The concept of the use of central venous catheters should be presented to the parents early in the hospital course. The advantages are fewer painful procedures, increased mobility of the patient, and decreased risk for infiltrate. These should be clearly explained in lay language, as well as the potential complications such as infection, thrombosis, and the specific risk for the extravasation of fluid into body cavities, pleura, and pericardium. Well-illustrated parent education materials often are very helpful when explaining these situations to parents.
Parent Teaching about Fluid and Electrolyte Management
• Most babies cannot be feed immediately and will require intravenous (IV) fluids.
• Umbilical venous and arterial catheters must be removed in a few days.
• IV fluids will be given through percutaneous central venous catheters, peripheral IV lines, or surgically placed lines.
• Scalp IVs go only into subcutaneous veins, not into the brain.
• Placing the IV will hurt only during the procedure and will be painless afterward.
• Peripheral IVs are subject to infiltration, which may be serious if the fluid is hyperalimentation fluid or contains calcium.
• Central venous catheters (percutaneously or surgically placed) carry the risks of thrombosis, infection, or infiltration into body cavities such as the pleura or pericardium.
• IV fluids will be discontinued as soon as enteral nutrition is sufficiently advanced.
Potential infiltration of peripheral IV sites should be addressed prospectively with parents. Erythema and edema are expected. Sloughing of the skin occasionally occurs in VLBW infants and is more common on the feet and hands than on the scalp.
Including parents in the care of their sick neonate requires an explanation about the importance of measuring intake and output. Inadvertent disposal of diapers and giving fluids that are not recorded should be prevented, and the importance of saving diapers for the infant’s nurse should be emphasized. “A little spitting up” after feeding may seem insignificant if parents are not instructed in the importance of telling the nurse and saving it for evaluation.
REFERENCES
1. Aiken, C.G.; Sherwood, R.A.; Kenney, I.J.; et al., Mineral balance studies in sick preterm intravenously fed infants during the first week after birth: a guide to fluid therapy, Acta Pediatr Scand Suppl 355 (1989) 1.
2. Bhatia, J., Fluid and electrolyte management in the very low birth weight neonate, J Perinatol 26 (2006) S19.
3. Costarino Jr, A.T.; Gruskay, J.A.; Corcoran, L.; et al., Sodium restriction versus daily maintenance replacement in very low birth weight premature neonates: a randomized, blind, therapeutic trial, J Pediatr 120 (1992) 99.
4. El-Dahr, S.S.; Chevalier, R.L., Special needs of the newborn infant in fluid therapy, Pediatr Clin North Am 37 (1990) 323.
5. Hartnoll, G., Basic principles and practical steps in the management of fluid balance in the newborn, Semin Neonatol 8 (2003) 307.
6. Modi, N., Management of fluid balance in the very immature neonate, Arch Dis Child Fetal Neonatal Ed 89 (2004) F108.
7. Moffet, H.L.; Allan, D.; Williams, T., Survival and dissemination of bacteria in nebulizers and incubators, Am J Dis Child 114 (1967) 13.
8. Thigpen, J.L., Peripheral intravenous extravasation: nursing procedure for initial treatment, Neonatal Netw 26 (2007) 379.
SELECTED READINGS
Bauer, K.; Bovermann, G.; Roithmaier, A.; et al., Body composition, nutrition, and fluid balance during the first two weeks of life in preterm neonates weighing less than 1500 grams, J Pediatr 118 (1991) 615.
Bell, E.F.; Warburton, D.; Stonestreet, B.S.; et al., Effect of fluid administration on the development of symptomatic patent ductus arteriosus and congestive heart failure in premature infants, N Engl J Med 302 (1980) 598.
Chemtob, S.; Kaplan, B.S.; Sherbotie, J.R.; et al., Pharmacology of diuretics in the newborn, Pediatr Clin North Am 36 (1989) 1231.
Chessex, P.; Reichman, B.; Verellen, G.; et al., Metabolic consequences of intrauterine growth retardation in very low birthweight infants, Pediatr Res 18 (1984) 709.
Gaylord, M.S.; Wright, K.; Lorch, K.; et al., Improved fluid management utilizing humidified incubators in extremely low birth weight infants, J Perinatol 21 (2001) 438.
Greene, H.L.; Hambidge, K.M.; Schanler, R.; et al., Guidelines for the use of vitamins, trace elements, calcium, magnesium, and phosphorus in infants and children receiving total parenteral nutrition, Am J Clin Nutr 48 (1988) 1324.
Hammarlund, K.; Sedin, G.; Strömberg, B., Transepidermal water loss in newborn infants. VIII. Relation to gestational age and post-natal age in appropriate and small for gestational age infants, Acta Paediatr Scand 72 (1983) 721.
Hay Jr, W.W., Intravenous nutrition of the very preterm neonate, Acta Paediatr Suppl 94 (2005) 47.
Heimler, R.; Doumas, B.T.; Jendrzejczak, B.M.; et al., Relationship between nutrition, weight change, and fluid compartments in preterm infants during the first week of life, J Pediatr 122 (1993) 110.
Kelly, L.K.; Seri, I., Renal developmental physiology: relevance to clinical care, NeoReviews 9 (2008) e150.
Peters, O.; Ryan, S.; Matthew, L.; et al., Randomised controlled trial of acetate in preterm neonates receiving parenteral nutrition, Arch Dis Child Fetal Neonatal Ed 77 (1997) F12.
Salle, B.L.; David, L.; Chopard, J.P.; et al., Prevention of early neonatal hypocalcemia in low birth weight infants with continuous calcium infusion: effect on serum calcium, phosphorus, magnesium, and circulating immunoreactive parathyroid hormone and calcitonin, Pediatr Res 11 (1977) 1180.
Sann, L.; David, L.; Chayvialle, J.A.; et al., Effect of early oral calcium supplementation on serum calcium and immunoreactive calcitonin concentration in preterm infants, Arch Dis Child 55 (1980) 611.
Sherman, T.I.; Greenspan, J.S.; St Clair, N.; et al., Optimizing the neonatal thermal environment, Neonatal Netw 25 (2006) 251.