[level-membership-for-neurosurgery-category]
Chapter 206 Economics and Practice Management
Changing Economic Environment
In the 1980s, the inflation rate in health-care services was 10% to 12% per year, exceeding the growth in the general economy by more than 7% per year.1 The doubling time for medical costs at this rate is 5 to 7 years, eroding the funds available for other public or private purposes, such as capital investment, business growth, personal amenities, or savings. Employee health benefits as a percentage of corporate profit rose from 8% in 1960 to 29% in 1980 to more than 70% in 1990.2 Similarly, health-care spending as measured by percentage of gross domestic profit has increased from 7.1% in 1970 to 16% in 2005.3 The need to bring health-care costs under control was seen not as an option but rather as a business and government necessity.
Factors Leading to the Unrestrained Rise in Medical Costs
Technical Complexity Basis of Quality
Technical complexity is the sine qua non of surgery. Greater benefit is perceived to be associated with instruments and techniques of greater intricacy. Greater perceived benefit is equated with higher quality and thus greater value. From the payer’s perspective, however, greater technical complexity translates simply into greater expense but often without better value as measured by functional outcome.
Practice Organization
Any organization is a trade-off. What the member of a larger organization gains in collective power is lost in personal autonomy. For physicians who are accustomed to independent judgment, self-reliance, and personal professional accountability, the exchange may be difficult. What seems to be lost is individual control of practice conditions, professional decisions, and sometimes personal income. What is gained, however, is the security of business economies of scale, cross-fertilization of professional knowledge and experience, division of labor, sharing of administrative expenses, and collective bargaining power in negotiations.
Single-Specialty Group
The tendency toward subspecialty differentiation within specialty groups can be expected to grow. The 1995 Comprehensive Neurosurgical Practice Survey found that 23% of respondents had completed a fellowship, but only 11% listed the spine as the area of special training. Of the 16% who practiced only a subspecialty, over one third were spine surgeons.4 About two thirds of neurosurgical practice involves spine work, traditionally by neurosurgeons in a general neurosurgical practice.5 As the size of neurosurgical groups grows, an increase in subspecialization may be expected, with a larger number of neurosurgeons limiting practice exclusively to spine disorders.
Multispecialty Group
The most integrated medical practice organization is a multispecialty group practice. Its organizational features are similar to those of single-specialty groups except that many or all specialties are represented. Independence is traded for group financial and practice security. Individual autonomy is traded for group market power. Practice freedoms are traded for practice stability. The defining features of an integrated multispecialty group are a single corporate billing identity and shared financial business risk.
Reimbursement
Resource-Based Relative Value Scale
The trend in market pricing has been movement from modification 1 (UCR) to modification 4 (RBRVS). One of the goals of development of the Medicare RBRVS was to establish a fee schedule that could be adopted throughout the health-care system by both public and private payers in order to establish uniformity and rationality in the system’s reimbursement methodology.6 By paying on the basis of the resources (time, effort, practice expenses) used to provide a service, a rational basis for relating one service to another was introduced. By using a common basic RVS, the variability among different payers is reduced to a simple difference in conversion factor. Many, if not most, PPO and HMO fee schedules currently use the MFS as a benchmark for their own pricing, setting fees as a percentage of Medicare. Depending on the region, the private payer conversion factor may be higher or lower than Medicare’s annually adjusted conversion factor.
The other, less radical option is to continue to use current fees but determine the conversion factor for each fee that would equate it to the Medicare relative value. The result is a confusing array of different conversion factors for each individual CPT code that may range from $35 or less at the low end to over $75 at the high end. This calculation can be useful in equating current fees to a proposed conversion factor using the Medicare RVS and estimating the effect the offered or negotiated conversion factor would have on current fees for individual codes. To simplify the process, the 20 most commonly billed codes should be selected and analyzed to examine the bulk of revenue-producing services without getting lost in detail.
Capitation
The highest level of risk is full capitation. For a specialist, this means receiving a periodic payment, generally once a month, for all anticipated specialty services for a defined population of plan enrollees. The advantage of the plan is that financial risk for that service is fixed in advance, and the person with most control over the generation of expenses (the specialist physician) pays the financial consequence for overuse. The advantage to the specialist is the chance to profit by careful restriction of services or a more efficient use of services. The risk, of course, is a failure to do so, resulting in financial loss for the specialist. The ultimate risk is financial insolvency if miscalculation is profound.
Data in a practice should be collected in advance of the necessity for negotiating a capitated contract. The minimum necessary information from the practice is a frequency list of CPT codes billed in the practice over 1 year and the average treatment plan for the top 20 diagnoses (ICD-9-CM) or CPT codes. The treatment plan is the list of services by code that the practice provides, on average, for a particular problem, such as lumbar disc herniation. This list includes (1) preoperative visits, diagnostic services, operative procedure charges, in-hospital visits, and postdischarge visits; (2) average charge per CPT code (the practice’s listed charge to FFS payers); (3) average allowable per CPT code (the average amount received from all payers [note that the average practice discount equals average charge minus average allowable]); and (4) utilization rate for individual CPT codes in the practice (how often a given CPT code is used for all patient encounters and how often it is used for particular ICD-9-CM diagnoses).7 These data provide a window into the volume, composition, and revenue generation of billable practice activity under FFS.
The next information that is needed comes from the plan itself. Demographic data (e.g., age, gender, and possibly occupation) about the plan’s enrollees under FFS reimbursement for a minimum period of at least 1 year, preferably 2 or 3 years, reinforces the accuracy of the actuarially expected utilization by the insured population. The information must be specific for the services that are to be covered by the capitated contract and must include all those services for all plan members, including services by other providers, which may shift to the capitated specialist under a capitation contract. The most important demographic distinction is Medicare risk versus commercial risk, in which the capitation rate for Medicare may be several times greater than general commercial rates.8
Once a practice enters a capitation contract, it becomes more important than ever to continuously track cost and utilization data, particularly with regard to the capitated population. It must be remembered that the penalty for an error in calculation or loose utilization control can quickly become catastrophic. Under FFS, unit reimbursement may be increased to cover expenses for any excess utilization. Under capitation, reimbursement is fixed in advance, based on an estimate of expenses. If utilization is higher than calculated, the only side of the ledger that goes up is expense to the business, which diminishes the profit side. Accurate and frequent analysis of practice cost and utilization data allows the practice to learn quickly whether profitability is maintained and what adjustments in utilization are necessary.
Practice Costs, Management, Productivity, and Profitability
Practice Cost Categories
Insurance premiums include employee benefit insurance, general property and liability insurance, professional liability insurance, and perhaps key-person life or business continuation insurance. Professional liability insurance is very expensive. However, because the risks involved in spine surgery are relatively high, the surgeon should usually purchase the most complete coverage that is reasonably available. Only if a group rate is unavailable owing to previous litigation should one undertake asset protection strategies instead of appropriate insurance coverage. Also, if a surgery practice is incorporated, total liability coverage can sometimes be increased economically by purchasing separate coverage for the corporation in addition to coverage for the individual surgeons. The advisability of key-person life or business continuation insurance depends on the configuration of the practice organization and the number of practicing surgeons. This type of insurance is generally useful for covering a contractual buyout obligation between the physician and the corporation.
A common measure of practice expenses is the percentage contribution of each cost component to the total practice revenue. Average percentages for a neurosurgery spine practice, for example, are less than 2% for information services, about 5% for occupancy costs, 1% for administrative supplies and services, 4% for professional liability insurance, about 13% for nonprovider salaries, and approximately 4% for nonprovider benefit expenses. Total nonphysician expenses would average about 35%. Furthermore, the average neurosurgical practice would employ 3.6 nonprovider support personnel per surgeon.9
Practice Cost Behavior
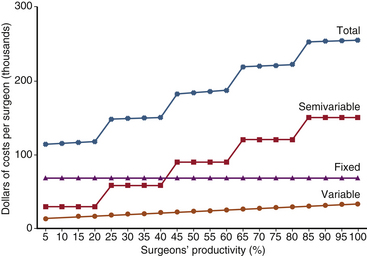
All of the significant components of the total operating costs of the typical private spine surgery practice are virtually fixed over a wide range of business activities. The expense components that vary with changes in the activity rate tend to do so in discrete increments rather than in a continuous proportional manner (Fig. 206-1). For example, personnel costs generally constitute by far the largest single component of total operating costs. Usually, a private spine surgery practice employs a large number of full-time support personnel. This configuration remains constant over a wide range of practice activities. If business increases or decreases beyond certain points, however, employment will increase or decrease in single full-time employee increments.
Cost Accounting
1. The total expenses of the practice (E) are calculated for a year. Excluded is any discretionary physician distribution made after necessary expenses are paid. Discretionary distributions are physician salaries, bonuses, fringe benefits, and retirement funding.
2. The total number of relative value units (total RVUs) billed during the year is calculated by finding the sum of all CPT codes billed multiplied by the number of times each code was billed multiplied by the RVUs for each code.
3. An assumption is made that each CPT code participates equally in the proportion of expenses (e.g., if the practice expense ratio is 40%, then 40% of each code RVUs equals practice expense).
4. The RVU is calculated by dividing E by the total RVUs. For instance, a practice expense of $20/RVU might be calculated. Therefore, at a negotiated conversion factor of $35, the profit would be $15/RVU or, expressed differently, an expense ratio of 20/35 = 57% and a profit ratio of 15/35 = 43%.
1. The practice’s conversion factor (CF) is calculated by dividing annual net revenue (NR) by total RVUs: CF = NR/total RVUs.
2. The practice’s conversion factor is compared with the managed care plan negotiated conversion factor to determine what the overhead ratio will be for that contract and whether the margin of profitability is sufficient to warrant agreement to the terms. For example, the practice CF is 50, with an expense factor of 20, for a 40% expense ratio. If a plan offers a CF of 40, the expense ratio for that business will be 20/40 = 50%.
Productivity
Surveys indicate that in 1 week, the average neurosurgeon spends 16 hours evaluating patients in the office, 9 hours making hospital rounds, 19 hours performing surgery, 6 hours on other patient care activities, and 5 hours on administration.4 Obviously, the time spent in surgery is by far the most financially productive. Therefore, increased operating costs can be offset many times by added revenue if those costs can increase the portion of the surgeon’s time spent in surgery.
Profitability
Finally, collecting as much payment as possible as soon as possible is critical to profitability. Conscientious, industrious, and resourceful billing and collection personnel can be one of the most important factors in maintaining profitability. For a mature spine surgery practice, gross accounts receivable should be less than 30% of annual gross billings, and average days in accounts receivable should be kept between 30 and 45 days. Bad debts should average no more than 6% to 7%. Collection-to-charges ratios formerly ranged between 70% and 80%. However, with deep managed care discounting, the collection-to-charge ratio may be as low as 40%, reflecting the widening difference between former standard charge levels and more recent contractual fee levels. If the charges are reduced arbitrarily to conform to typical managed care fees, the charges may be lower than other commercial payers allow, leaving “money on the table.” Therefore, to capture less common—but available—higher fees, it is better to maintain charges at prior levels and accept the large gap between collections and charges and the higher accounts receivable.
Data Needs
A database designed for a clinical spine practice is a need that has yet to be satisfactorily filled. The requirements are relatively simple: (1) demographic information, (2) coded diagnostic information, (3) coded procedural information, and (4) outcome information in coded format. Demographic information acquisition is the easiest yet the most pivotal to acquire. Diagnostic information parallels standard diagnostic codes, such as ICD-9-CM codes. Its simplicity can obscure relevant clinical subtleties that may affect treatment and outcome (e.g., with respect to disc herniation, the severity of sciatica versus the extent of low back pain, the presence or absence of reflexes, the degree of positivity of straight-leg raise testing, and the factor of time). Procedure coding is straightforward (i.e., the use of CPT codes). The problem in designing a database lies in outcome data acquisition. No standard data format is accepted industrywide, although a number of health status questionnaire databases are currently in use. Outcome assessment tools, such as the short-form health survey (SF-36) for general health assessment10 and the more detailed Health Status Questionnaire, with a condition-specific (back pain) module,11 are available for commercial use. It remains to be determined whether these functional outcome assessments are sufficiently sensitive and accurate to lead to meaningful decisions about the value of care, particularly spine surgery.
Marketing
1. Informal relationships are becoming formal contract relationships among physician, patient, and payer.
2. Demand is defined both by patient and payer health plan needs (which often conflict).
3. There is supply restriction of competition by licensing and institutional privileging requirements.
4. A distribution system is structured by payer plans in contracted provider panels.
5. Purchasing decisions and micromanagement authority are assumed by payers through contract agreement.
6. Pricing is shifted to market-competitive payer fee schedules or to prepayment within a fixed budget (capitation).
The Future
As tight reimbursement policies and rising operating costs have made it challenging to prosper solely on a spine surgeon’s professional services, some surgeons are beginning to supplement their income by competing for the facility and ancillary components of health-care spending. A growing number of spine surgeons have found profit opportunities by investing in diagnostic imaging, physical therapy, and even ambulatory surgery centers (ASCs). However, federal legislation commonly known as Stark Laws essentially prohibits referral of Medicare and Medicaid patients to diagnostic imaging and physical therapy facilities in which the physician has ownership interests.12 Restrictions arising from Stark Laws generally do not apply to a surgeon’s investment in an ASC. But since ASCs by definition do not allow for overnight stays, a spine surgeon’s ability to utilize ASCs is severely limited. Recently, some spine surgeons have begun investing in surgical hospitals and even hospitals that specialize in treating disorders of the spine. As with ASCs, surgeon ownership of hospitals is generally exempt from Stark Laws. The sheer magnitude of the investment that is required to develop a surgical hospital is daunting and necessitates the contribution of many surgeon and/or nonsurgeon partners. However, the profit potential is also significant. Finally, ownership of a hospital empowers the surgeon to ensure high-quality patient care and achieve greater professional productivity by establishing operational efficiency in the hospital.13 The physician-owned hospital will be able to respond favorably to payment bundling, which has already been initiated by Medicare in pilot programs. Under this model, all payments for a certain procedure are predetermined and divided by the hospital and the physicians who are caring for the patient. This type of payment plan gives physicians and hospitals incentives to make cost-based decisions. Opponents of payment bundling believe that such incentives may be harmful to patient care and may stifle medical innovation.14
Summary
• Training and experience remain a surgeon’s most valuable assets. Whatever the business arrangements, attend first to attaining and preserving unassailable professional competence.
• Compassion is a fundamental requirement. Never forget who the system is intended to benefit. With the patient’s interests foremost, success will follow.
• Flexibility is vital. Know the environment, and change with it. Avoid fixed ideas and responses.
• Be proactive in learning and changing. In a highly competitive environment that is in transition, security lies not only in perseverance but also in foresight, innovation, and action.
• Adopt changes incrementally, preferably in advance of absolute necessity. By this means, errors remain small learning experiences rather than practice-disrupting disasters.
Currently, the U.S. Congress is in the process of producing a health-care reform bill. One major source of contention surrounding the bill is whether or not to include a so-called public option. The public option would expand health-care coverage to some people who are currently uninsured. In addition, it would provide a governmental insurance plan that would compete against private insurers. Proponents of the public option cite decreased health-care costs through competition, whereas opponents believe that such a measure would eventually lead to a more global governmental takeover of health care.15
Cost survey. 2001 report based on 2000 data. Englewood, CO: Medical Group Management Association; 2001.
Eddy D. Health system reform: will controlling costs require rationing services? JAMA. 1994;272:324-328.
Heary R.F., Kaufman B.A., Harbaugh R.E., Warnick R.E. Annual procedural data of United States neurological surgeons: report of the 1999 AANS survey. Park Ridge, IL: American Association of Neurological Surgeons; 1999.
Pevehouse B.C. Gary Siegel Corporation: 1995 comprehensive neurosurgical practice survey. Park Ridge, IL: American Association of Neurological Surgeons; 1996.
1. Eddy D. Health system reform: will controlling costs require rationing services? JAMA. 1994;272:324-328.
2. Sokolov J.J., Richard C. Schneider lecture. San Diego, CA: American Association of Neurological Surgeons; 1994.
3. Mahar M. Money-driven medicine. New York: HarperCollins; 2006.
4. Pevehouse B.C. Gary Siegel Corporation: 1995 comprehensive neurosurgical practice survey. Park Ridge, IL: American Association of Neurological Surgeons; 1996.
5. Heary R.F., Kaufman B.A., Harbaugh R.E., Warnick R.E. Annual procedural data of United States neurological surgeons: report of the 1999 AANS survey. Park Ridge, IL: American Association of Neurological Surgeons; 1999.
6. Physician Payment Review Commission: Annual report to Congress, Washington, DC, 1993, pp 135–144.
7. Beard P.L. How to negotiate capitation without losing your head. Shawnee Mission, KA: ProStat Resource Group; 1994.
8. Physician network insider. Rockville, MD: United Communications Group; 1994.
9. Cost survey: 2001 report based on 2000 data. Englewood, CO: Medical Group Management Association; 2001.
10. SF-36 health status survey, East Greenwich, RI, Response Technologies.
11. Health status questionnaire (HSQ), Velocity Healthcare Informatics, Minnetonka, MN.
12. 42 U.S.C. § 1395 nn, et seq.
13. Tibbs RE Jr, Pelofsky S, Friedman ES, Blaylock KL: Physician ownership of specialty spine hospitals: neurosurgical focus, Charlottesville, VA, 2002.
14. Galewitz Phil. “Can ‘bundled’ payments help slash health costs?”. USA Today. Oct 2009;26:1A.
15. Adamy J., Yoest P., Hitt G. Reid’s push for public option creates new barriers for bill. The Wall Street Journal. 2009.
[/level-membership-for-neurosurgery-category][not-level-membership-for-neurosurgery-category]
Chapter 206 Economics and Practice Management
Changing Economic Environment
In the 1980s, the inflation rate in health-care services was 10% to 12% per year, exceeding the growth in the general economy by more than 7% per year.1 The doubling time for medical costs at this rate is 5 to 7 years, eroding the funds available for other public or private purposes, such as capital investment, business growth, personal amenities, or savings. Employee health benefits as a percentage of corporate profit rose from 8% in 1960 to 29% in 1980 to more than 70% in 1990.2 Similarly, health-care spending as measured by percentage of gross domestic profit has increased from 7.1% in 1970 to 16% in 2005.3 The need to bring health-care costs under control was seen not as an option but rather as a business and government necessity.
Factors Leading to the Unrestrained Rise in Medical Costs
Technical Complexity Basis of Quality
Technical complexity is the sine qua non of surgery. Greater benefit is perceived to be associated with instruments and techniques of greater intricacy. Greater perceived benefit is equated with higher quality and thus greater value. From the payer’s perspective, however, greater technical complexity translates simply into greater expense but often without better value as measured by functional outcome.
Practice Organization
Any organization is a trade-off. What the member of a larger organization gains in collective power is lost in personal autonomy. For physicians who are accustomed to independent judgment, self-reliance, and personal professional accountability, the exchange may be difficult. What seems to be lost is individual control of practice conditions, professional decisions, and sometimes personal income. What is gained, however, is the security of business economies of scale, cross-fertilization of professional knowledge and experience, division of labor, sharing of administrative expenses, and collective bargaining power in negotiations.
Single-Specialty Group
The tendency toward subspecialty differentiation within specialty groups can be expected to grow. The 1995 Comprehensive Neurosurgical Practice Survey found that 23% of respondents had completed a fellowship, but only 11% listed the spine as the area of special training. Of the 16% who practiced only a subspecialty, over one third were spine surgeons.4 About two thirds of neurosurgical practice involves spine work, traditionally by neurosurgeons in a general neurosurgical practice.5 As the size of neurosurgical groups grows, an increase in subspecialization may be expected, with a larger number of neurosurgeons limiting practice exclusively to spine disorders.
Multispecialty Group
The most integrated medical practice organization is a multispecialty group practice. Its organizational features are similar to those of single-specialty groups except that many or all specialties are represented. Independence is traded for group financial and practice security. Individual autonomy is traded for group market power. Practice freedoms are traded for practice stability. The defining features of an integrated multispecialty group are a single corporate billing identity and shared financial business risk.
Reimbursement
Resource-Based Relative Value Scale
The trend in market pricing has been movement from modification 1 (UCR) to modification 4 (RBRVS). One of the goals of development of the Medicare RBRVS was to establish a fee schedule that could be adopted throughout the health-care system by both public and private payers in order to establish uniformity and rationality in the system’s reimbursement methodology.6 By paying on the basis of the resources (time, effort, practice expenses) used to provide a service, a rational basis for relating one service to another was introduced. By using a common basic RVS, the variability among different payers is reduced to a simple difference in conversion factor. Many, if not most, PPO and HMO fee schedules currently use the MFS as a benchmark for their own pricing, setting fees as a percentage of Medicare. Depending on the region, the private payer conversion factor may be higher or lower than Medicare’s annually adjusted conversion factor.
The other, less radical option is to continue to use current fees but determine the conversion factor for each fee that would equate it to the Medicare relative value. The result is a confusing array of different conversion factors for each individual CPT code that may range from $35 or less at the low end to over $75 at the high end. This calculation can be useful in equating current fees to a proposed conversion factor using the Medicare RVS and estimating the effect the offered or negotiated conversion factor would have on current fees for individual codes. To simplify the process, the 20 most commonly billed codes should be selected and analyzed to examine the bulk of revenue-producing services without getting lost in detail.
