Chapter 2 Echocardiography
ECHOCARDIOGRAPHIC EXAMINATION
Two-Dimensional Transthoracic Examination
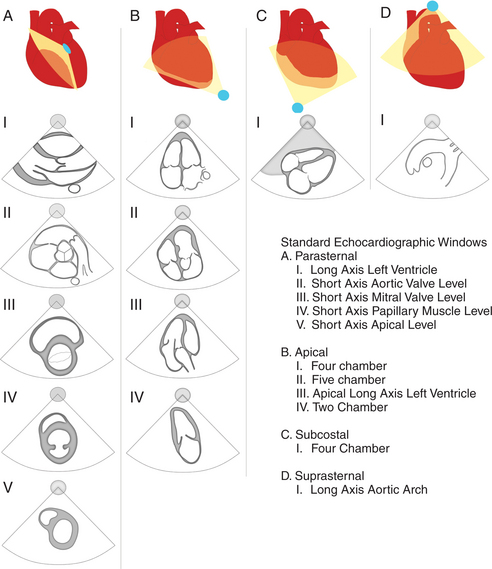
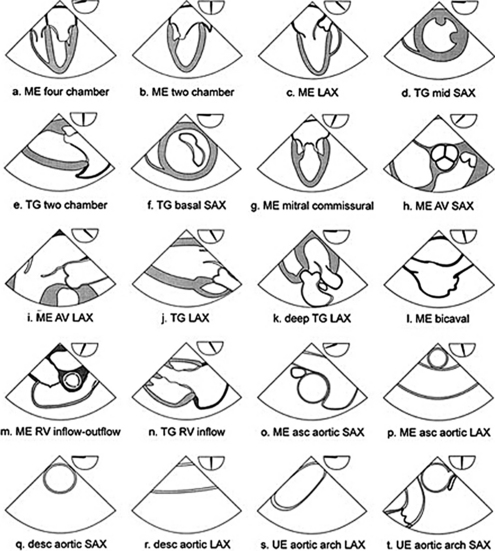
During the routine echocardiography examination, a fan-shaped beam of ultrasound is directed through a number of selected planes of the heart to record a set of standardized views of the cardiac structures for subsequent analysis. These views are designated by the position of the transducer, the orientation of the viewing plane relative to the primary axis of the heart, and the structures included in the image (Fig. 2-1).
Left Parasternal Imaging Planes
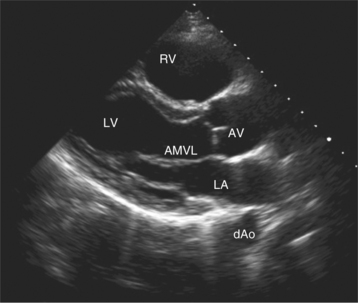
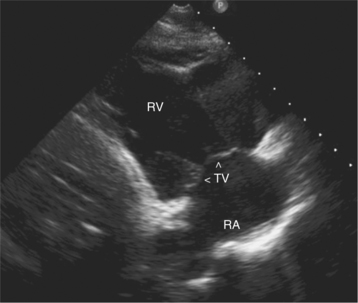
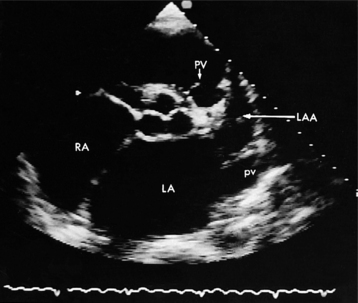
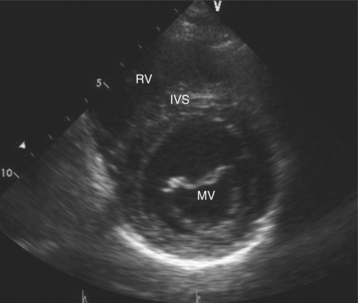
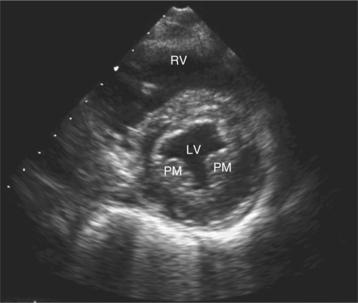
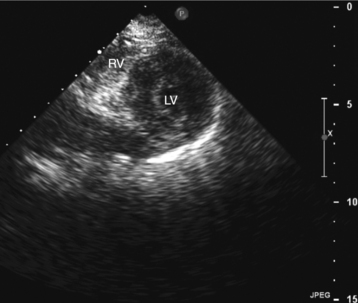
Parasternal views of the heart are obtained by positioning the transducer along the left parasternal intercostal spaces. From this position, long- and short-axis images of the heart can be obtained. In the long-axis view, the structures which can be assessed are mitral leaflets and chordal apparatus, right ventricular outflow tract, aortic valve, left atrium, long axis of the left ventricle, and aorta (Fig. 2-2). Rightward angulation allows more complete imaging of the right ventricle. The right ventricular inflow view allows assessment of the right atrium, the proximal portion of the inferior vena cava, and the entry of the coronary sinus, the tricuspid valve, and the base of the right ventricle (Fig. 2-3). The parasternal short-axis images of the heart are obtained as the transducer is rotated 90 degrees from the long-axis plane and swept from a cranial to a caudal position. The most cranial view allows visualization of the aortic valve, atria, right ventricular outflow tract, and proximal pulmonary arteries. The three normal coronary cusps of the aortic valve can be viewed with possible imaging of the proximal right coronary artery arising from the right coronary cusp at the 10 o’clock position, and the left main coronary artery originating from the left coronary cusp at the 3 o’clock position (Fig. 2-4). A series of cross-sectional images of the left and right ventricles are created by moving the transducer caudally. The right ventricle appears as a crescentic structure along the right anterior surface of the left ventricle. At the basal level, the fish-mouthed appearance of the mitral valve is apparent (Fig. 2-5). At the midventricular level, the anterolateral and posteromedial papillary muscles are seen (Fig. 2-6). The most caudal angulation allows visualization of the left ventricular apex (Fig. 2-7).
Apical Imaging Planes
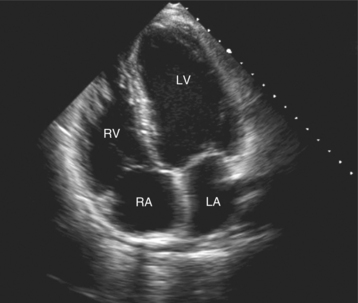
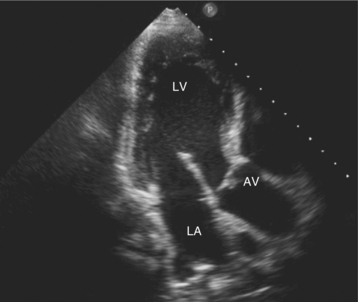
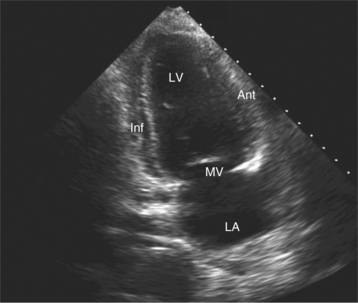
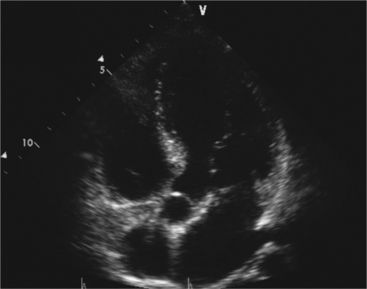
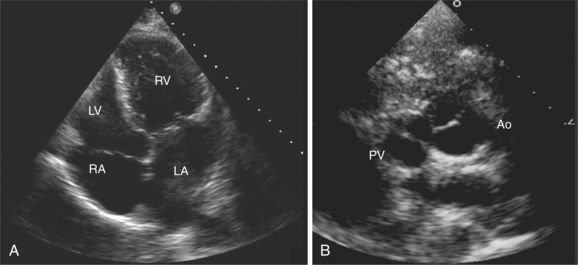
By placing the transducer at the cardiac apex and orienting the imaging sector toward the base of the heart, it is possible to obtain the apical views of the heart. This allows visualization of all chambers of the heart and the tricuspid and mitral valves. With the transducer oriented in a mediolateral plane at 0 degrees, an apical four-chamber view of the heart is obtained (Fig. 2-8). As the transducer is rotated 45 degrees clockwise to this plane, the apical long-axis view of the heart is obtained (Fig. 2-9), and further clockwise rotation of the transducer to a full 90 degrees produces the apical two-chamber view (Fig. 2-10). The apical two-chamber view is important because it allows direct visualization of the true inferior and anterior wall of the ventricle. Superficial angulation of the scanning plane from the apical four-chamber view brings the left ventricular outflow tract and aortic valve into view, producing the five-chamber view (Fig. 2-11).
Subcostal Imaging Planes
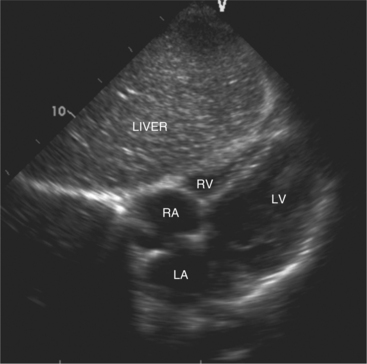
The subcostal window allows ultrasound access to the heart through the solid tissue of the liver, which readily transmits sound waves. The alignment of the heart relative to this approach permits better visualization of the atrial and ventricular septae because the sound beam strikes these structures in a perpendicular direction. A series of long- and short-axis images are usually obtained from this window. The inferior vena cava and hepatic veins, the liver, and the abdominal aorta can also be evaluated subcostally (Fig. 2-12). Facility with subcostal imaging is important because in some instances, as in the intensive care unit setting, it may be the only viewpoint from which to image the heart in the patient with chest wall injury, hyperinflated lungs, or pneumothorax. In infants and small children the subcostal window provides excellent images of all cardiac structures.
Suprasternal Imaging Planes
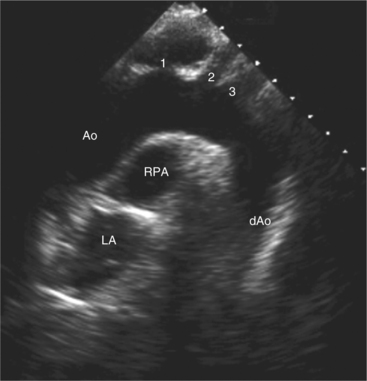
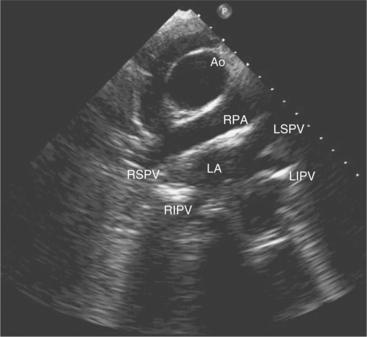
Suprasternal views are obtained by placing the transducer in the suprasternal notch. Both longitudinal and transverse planes of the great vessels can be imaged. The longitudinal plane orients through the long axis of the aorta and includes the origins of the innominate, left common carotid, and left subclavian arteries (Fig. 2-13). The transverse plane includes a cross section through the ascending aorta, with the right pulmonary artery crossing behind. Portions of the innominate vein and superior vena cava are visible anterior to the aorta. The left atrium and pulmonary veins are posterior to the right pulmonary artery (Fig. 2-14).
Transesophageal Imaging
Transesophageal imaging is a valuable technique to visualize the heart and great vessels in patients with suboptimal transthoracic imaging windows. This may occur as a result of body habitus, lung disease, or operative room or intensive care environment where access to the chest wall and optimal positioning is prohibitive. Transesophageal imaging uses a specially designed ultrasound probe incorporated within a standard gastroscope. This semi-invasive procedure requires blind esophageal intubation. Because of the close proximity of the heart to the imaging transducer, high-frequency transducers (5.0 to 7.5 MHz) are routinely used, which allows better definition of small structures than the lower frequencies used transthoracically (2.5 to 3.5 MHz). Therefore, transesophageal imaging is particularly valuable in the routine clinical setting for the detection of atrial thrombi, small vegetations, diseases of the aorta, atrial septal defects, patent foramen ovale, and the assessment of prosthetic valve function. It is used in the operating or catheter suites to monitor and assess the repair of cardiac structures.
Current instrumentation allows imaging of multiple planes through the heart with multiplane transesophageal probes in which the ultrasound plane is electronically steered through an arc of 180 degrees. The anteroposterior orientation of images from the esophagus is the reverse of images from the transthoracic window because the ultrasound beam first encounters the more posterior structures closest to the esophagus (Fig. 2-15).
The Normal Doppler Examination
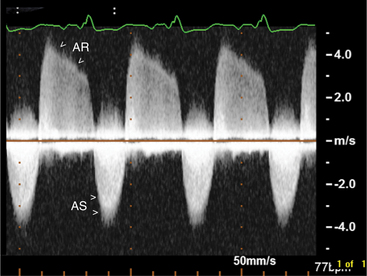
By applying the Doppler principle to ultrasound, the frequency shift of ultrasound waves reflected from moving red blood cells can be used to determine the velocity and direction of blood flow. This can be done with either pulsed Doppler or continuous wave Doppler. Pulsed Doppler allows analysis of the velocity and direction of blood flow at a specific site. Continuous wave Doppler allows resolution and analysis of high-velocity flow along the entire length of the Doppler beam. The data can be displayed graphically (Fig. 2-16). By convention, flow toward the interrogating transducer is represented as a deflection above, and flow away from the transducer appears as a deflection below the baseline. The x-axis represents time and the y-axis represents velocity.
Parasternal Long-Axis View
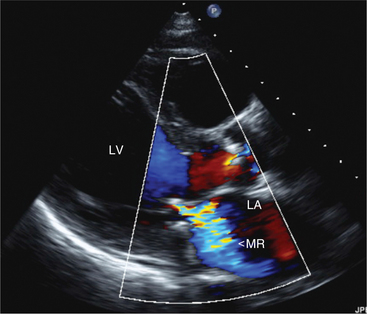
In this view, mitral regurgitation is seen as a discrete blue jet in the left atrium during systole (Fig. 2-17). Small jets can be seen with normal valves.
Apical Views
The flows detected in this view are:
Myocardial Doppler Tissue Imaging
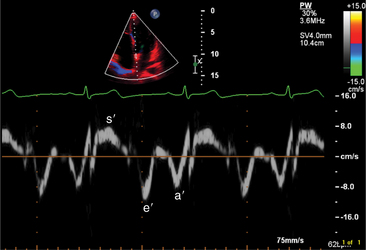
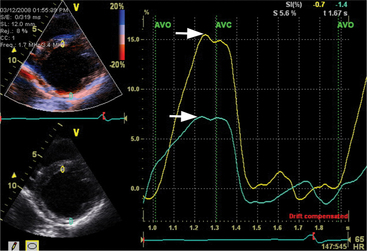
The transducer properties can be manipulated so that myocardium (low velocity) is the target of ultrasound reflection rather than blood cells (high velocity). Similar Doppler principles can be applied with color saturation of the tissue to indicate direction and velocity of the myocardium. A sample volume (similar to pulsed Doppler) is placed within the myocardium or valvular annulus to obtain a quantitative spectral profile of myocardial motion (Fig. 2-20). From the fundamental parameter of velocity, strain or strain rate imaging that measures tissue deformation can be derived (Fig. 2-21). Dopplerderived tissue velocity, strain and strain rate have been demonstrated to improve evaluation of myocardial mechanics when compared to previous measures such as wall thickening or motion.
Novel Echocardiographic Tools
Contrast Echocardiography
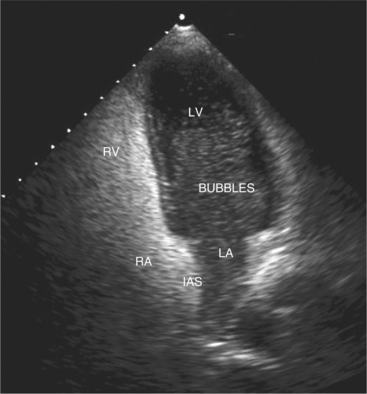
Contrast agents form small microbubbles, which at low ultrasound power, output disperse ultrasound at the gas and liquid interface, thus increasing the signal detected by the transducer. Right heart contrast is performed with injection of agitated saline and enables detection of right to left intracardiac shunts (Fig. 2-22). Left heart contrast agents consist of air or fluorocarbon gas encapsulated with stabilizing substances such as denatured albumin or monosaccharides. The microbubbles that are formed are small enough to pass through the pulmonary capillary bed, thus allowing opacification of the left heart following intravenous injection. The opacification of left ventricular cavity enhances endocardial border and cardiac mass identification particularly in cases of suboptimal acoustic windows (Fig. 2-23). Contrast echocardiography improves analysis of regional wall abnormalities. Real-time myocardial contrast echocardiography is being investigated as a tool for quantitative analysis of myocardial perfusion.
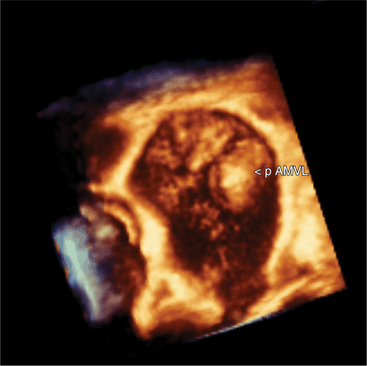
Three-Dimensional Echocardiography
Volumetric imaging using a complex multi-array transducer to acquire three-dimensional pyramidal volume data is used to obtain images of the cardiac structures in three spatial dimensions. The structures may be viewed as a three-dimensional image or displayed simultaneously in multiple two-dimensional tomographic image planes. Postacquisition processing involves cropping that allows different views of the interior structures of the heart to be displayed. The structure studied can be manipulated so that it is viewed from multiple angles such as the surgical enface view of the mitral valve from the left atrium (Fig. 2-24). Quantitative volumetric data obtained by tracing the endocardial borders increases the accuracy of left ventricular volume assessment and allows for assessment of the right ventricular shape and volume (Fig. 2-25). Real-time three-dimensional transesophageal echocardiography (TEE) is currently being used to assist with device implantation in the catheter laboratory (Fig. 2-26). The current limitations of this technique, which is continually improving, include image quality, ultrasound artifact, and temporal resolution.
Two-Dimensional (Speckled) Strain Echocardiography
A new measure of myocardial strain analyzes motion by tracking speckles in the ultrasound image of the myocardium in two dimensions. The geometric shift of each speckle represents focal myocardial deformation. Software is available to process the temporal and spatial information and thus by tracking the speckles, two-dimensional tissue velocity, strain, and strain rate can be calculated. This technique, unlike Doppler measurement of strain, is not angle dependent (Fig. 2-27).
Evaluation of Cardiac Chambers
Normal Linear Dimensions
By convention, most laboratories report the size of the left atrium, aortic root, and left ventricle from the measurement of the linear dimensions of each structure in the parasternal long-axis view of the heart (Table 2-1). All linear dimensions have been shown to bear a direct linear relation to body height. Normal chamber dimensions have also been determined for each of the standard two-dimensional views to allow quantitative assessment of each chamber or great vessel from any view.
| Aortic root—end diastole | 24-39 mm |
| Left atrium—end systole | 25-38 mm |
| Left ventricle—end diastole | 37-53 mm |
| Interventricular septal thickness—end diastole | 7-11 mm |
| Left ventricular posterior wall thickness—end diastole | 7-11 mm |
Left Ventricular Volume
There are a number of methods for calculating left ventricular volume from two-dimensional echocardiographic images that require the assumption of a geometric shape of the left ventricle (Fig. 2-28).

Three-dimensional volume measurement makes no geometric assumptions and thus can determine the volume of both normal and distorted ventricles (see Figure 2-25).
Left Ventricular Systolic Function from Two-dimensional Images
where LVIDD = the internal diameter of the base of the ventricle in diastole, and LVISD = the internal diameter of the ventricle in systole. Because this formula fails to account for apical function, 10% is empirically added if function at the apex is normal, 5% is added if the apex is hypokinetic, and 5% to 10% is subtracted if the apex is dyskinetic. The development of automated endocardial border detection now makes it possible to obtain an online estimate of ejection fraction based on changes in cavity area.
Left Ventricular Systolic Function from Doppler Echocardiography
Doppler echocardiography makes it possible to estimate stroke volume and cardiac output by measuring volumetric flow through the heart. Stroke volume is calculated by measuring the cross-sectional area of a vessel or valve and then integrating the flow velocities across that specific region in the vessel or valve throughout the period of flow. The product of stroke volume and heart rate then gives an estimate of cardiac output (Fig. 2-29).
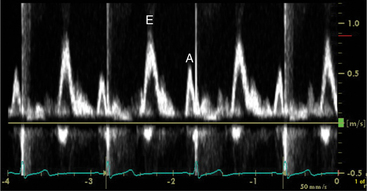
Left Ventricular Diastolic Function
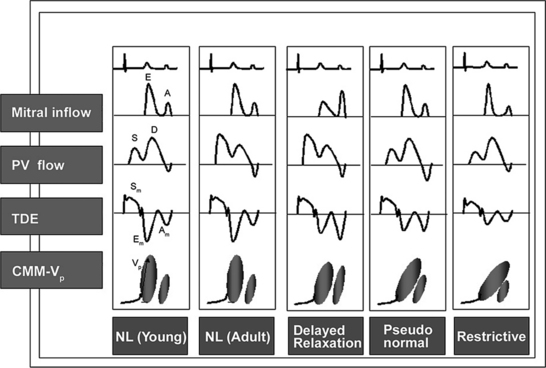
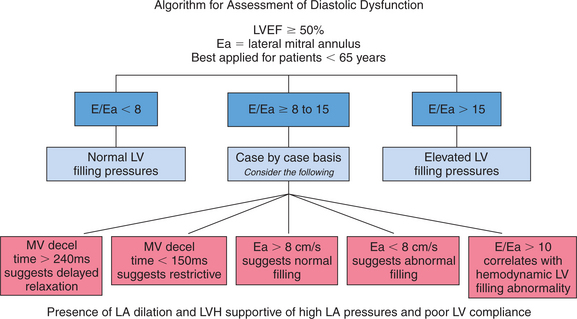
Echocardiographic Doppler assessment of left ventricular filling properties includes transmitral velocity and pulmonary vein flow characterization. Measurements of peak early (E) and late (A) diastolic flow velocities, isovolumic relaxation time, and deceleration time of early diastolic filling are all useful measures of diastolic function, but are limited by reduced accuracy for detection of high left atrial pressure in patients with normal ejection fraction or left ventricular hypertrophy, and poor ability to separate the effects of preload from relaxation. Flow propagation velocity by color M-mode and diastolic myocardial velocity by tissue Doppler (Ea) are measurements of diastolic function/impaired relaxation that are independent of the effects of preload. Flow propagation velocity relates inversely with the time constant of left ventricular relaxation. However, it can be difficult to measure and thus is less reproducible and may give erroneous results in patients with concentric left ventricular hypertrophy, small left ventricular cavity, and high filling pressures. Annular velocity is an index of myocardial relaxation and multiple studies have shown the ratio of transmitral E velocity to annular velocity Ea relates well with mean pulmonary capillary wedge pressure. However, it is a regional index and thus can vary between sampling sites and in patients with abnormal regional wall motion. The typical patterns observed with each of these methods in various forms of diastolic dysfunction are depicted in Fig. 2-30. A simplified algorithm for the use of E/Ea ratio in the clinical assessment of diastolic function is shown in Fig. 2-31. In addition, all diastology quantification measurements are not applicable for patients not in sinus rhythm or for those who have inflow obstruction (mitral stenosis, prosthetic valves).
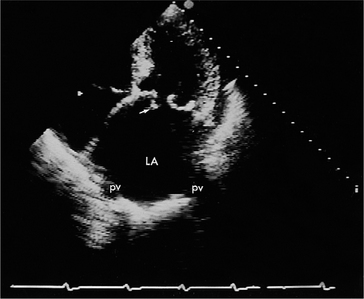
Left Atrium
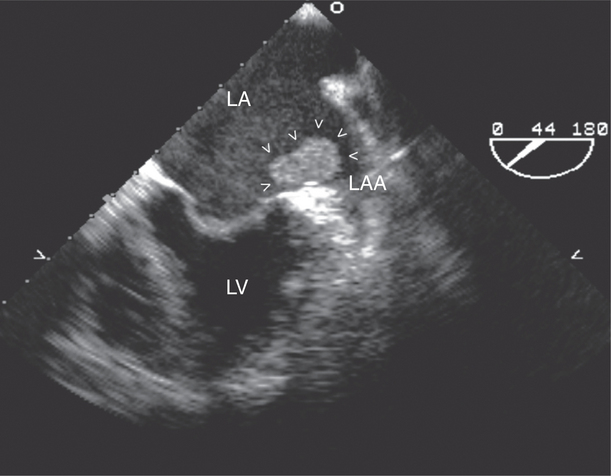
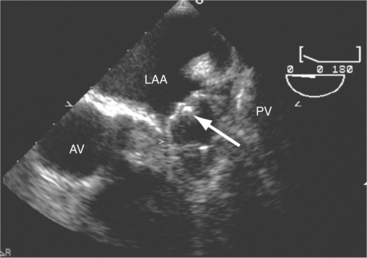
The left atrial appendage is a “dog ear”-shaped extension of the atrium situated along the lateral aspect of the chamber near the mitral annulus. Although usually inconspicuous, it is easily visible in the parasternal short-axis and apical two-chamber views of the atria when there is a dilated left atrium. Definitive imaging of the atrial appendage is usually performed with transesophageal imaging for the most accurate visualization of thrombus. It is important to realize that the appendage is a trabeculated structure. These trabeculae may be confused with thrombus, which may form within the appendage (Fig. 2-32).
Right Ventricle
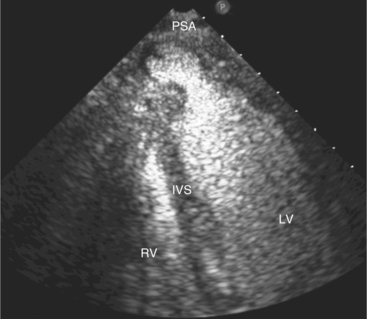
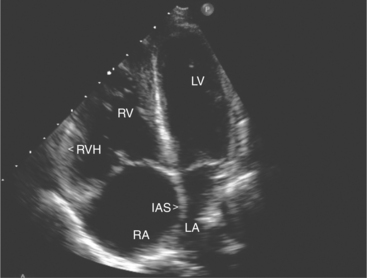
Pressure loading of the right ventricle results in progressive hypertrophy (Fig. 2-33). This may be difficult to discern with confidence because of the degree of trabeculation of the chamber. A free wall thickness of greater than 5 mm is a quantitative criterion for right ventricular hypertrophy. Marked pressure overloading typically produces systolic flattening of the interventricular septum.
Right Atrium
Assessment of right atrial size is usually made qualitatively by comparing it to the left atrium in the apical four-chamber view and quantitatively by measuring the maximal mediolateral and supero-inferior dimensions in this view. There are several normal structures within the right atrium. These include the Eustachian valve, which crosses from the inferior vena cava to the region of the foramen ovale, and the crista terminalis. In the apical four-chamber view, the crista can be seen as a ridge of tissue that separates the smooth-walled portion of the right atrium from its trabeculated anterior portion, often noted as a small mass of echoes located adjacent to the superior border of the right atrium. The right atrial appendage is a broad-based triangular structure that lies anterior to the atrial chamber near the ascending aorta. It is most visible in the parasternal views of the right atrium and readily visualized by TEE.
EVALUATION OF VALVULAR HEART DISEASE
Mitral Valve Disease
Mitral Stenosis
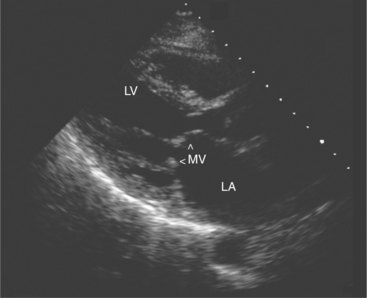
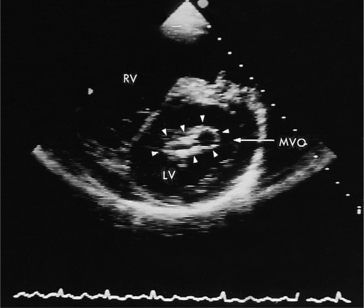
Acquired mitral stenosis is almost invariably caused by scarring and inflammation of the valve and chordal apparatus from past rheumatic fever. As a consequence of the disease, the mitral leaflets and chordal apparatus become diffusely thickened. Subsequently the valvular apparatus may shorten, fuse together at the commissural margins, and finally calcify. This results in a reduction in leaflet excursion so that the mitral leaflets appear to dome during diastole (Fig. 2-34). As the degree of valvular obstruction increases, flow through the valve decreases, left atrial pressure begins to rise, left atrial size increases (in the apical views, the interatrial septum is seen to bow to the right), and the potential for atrial thrombus formation is increased. Typically, the left ventricular size is normal or even small. If there is severe mitral stenosis, there may be paradoxical motion of the interventricular septum as a consequence of slow ventricular filling. Further, if there is pulmonary hypertension, the right heart and the pulmonary arteries may dilate and there may be severe tricuspid regurgitation. Almost all of these morphologic features are evident from the parasternal long-axis view of the heart; however, parasternal short-axis images are essential for planimetry of the mitral valve orifice (Fig. 2-35).
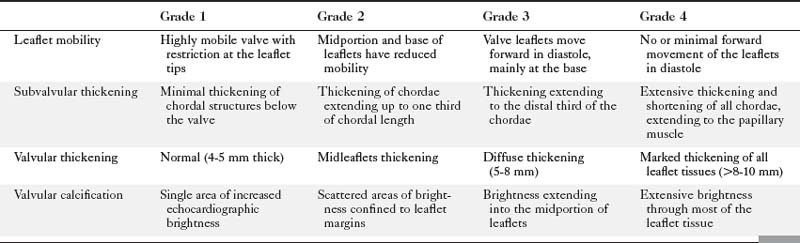
Echocardiographic grading of the severity of mitral stenosis is possible by assessing the degree of leaflet thickening, calcification, mobility, and the degree of chordal thickening and shortening (Table 2-2). When systematically graded, a low value of 1 to a high value of 4 is given for each of these characteristics. It is then possible to derive a numeric “score” that describes the extent of the mitral valve disease. This system is helpful in predicting the likelihood of successful balloon dilatation of the valve, with scores greater than 8 predicting a poor outcome following percutaneous dilatation.
Direct planimetry of the valve orifice in the short-axis plane can provide an accurate measurement of the mitral valve area. Three-dimensional echocardiography can improve the accuracy of detecting the smallest mitral orifice by providing simultaneous, perpendicular on axis views of the valve orifice.
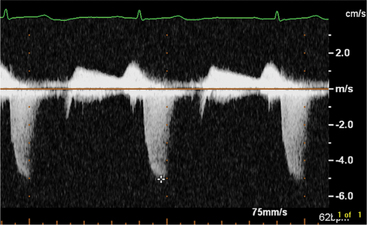
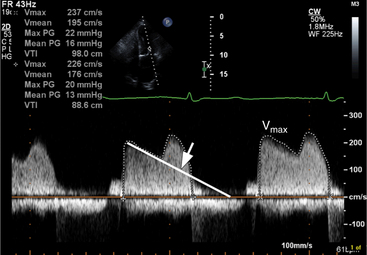
Continuous wave Doppler can help assess the severity of mitral stenosis because it enables calculations of the peak and mean transmitral gradients and the mitral valve area. For this purpose, the apical four-chamber view is preferable so that the Doppler beam can be directed through the mitral valve plane, parallel to the direction of left ventricular inflow. In contrast to the Doppler profile through a normal mitral valve, the continuous wave Doppler signal in patients with mitral stenosis demonstrates an increased velocity of flow in early diastole, with a prolonged descent of the early filling wave (deceleration time) that may merge into the late filling wave (Fig. 2-36). In patients with atrial fibrillation, the A wave, which reflects atrial contraction, is absent. The degree of prolongation of the phase of early filling relates directly to mitral valve area and to the severity of mitral stenosis.
Myxomatous Mitral Valve Prolapse
Mitral valve prolapse is a degenerative disorder that primarily affects the collagen of the mitral leaflets and chordae; however, it may also affect the aortic and tricuspid valve. Although often diagnosed clinically by the presence of a murmur or click, echocardiography is frequently used to confirm the diagnosis.
Echocardiographically, mitral valve prolapse is suggested by the superior displacement of one or both of the mitral valve leaflets into the atrium during systole (Fig. 2-37). Because of the complex saddle shape of the mitral annulus, minor degrees of superior displacement of the anterior leaflet may normally be recorded from the apical four-chamber view. Therefore, the diagnosis of mitral valve prolapse should only be made when the long-axis views (parasternal or apical long axis) show leaflet displacement. Color Doppler usually shows an eccentric jet of regurgitation that is in the opposite direction to the leaflet which is prolapsed (see Figure 2-37B). In patients with more advanced disease, there is also evidence of leaflet thickening, which relates to the presence of myxomatous infiltration of the valve. There may also be redundant or ruptured chordae.
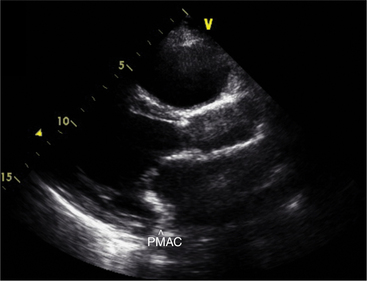
Mitral Annular Calcification
Calcification of the mitral annulus is common in the elderly. It begins as a focal process, affecting the posterior portion of the annular ring, then extends laterally and finally anteriorly (Fig. 2-38). As the process evolves, the base of the mitral leaflets and chordal apparatus thicken and calcify. This impairs the normal mechanism of coaptation leading to mitral regurgitation. It may also result in restriction of mitral inflow with the development of a small transmitral gradient. Although annular calcification is visible in almost any view, the parasternal short-axis image at the base of the heart is the most useful view for defining the circumferential extent of the disease.
Flail Mitral Leaflet
Complete or partial disruption of the support of one or both of the mitral leaflets usually presents suddenly with the development of a new murmur or acute pulmonary edema. In either setting, the echocardiogram in association with the clinical picture may provide direct insight into the nature of the underlying disease process. Specifically, the echocardiogram can demonstrate systolic prolapse of the entire leaflet into the left atrium (Fig. 2-39) and significant mitral regurgitation by color Doppler. A flail leaflet is caused by infective endocarditis, underlying myxomatous mitral valve disease (mitral valve prolapse), or papillary muscle rupture in association with acute myocardial infarction.
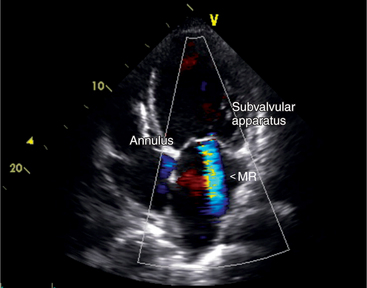
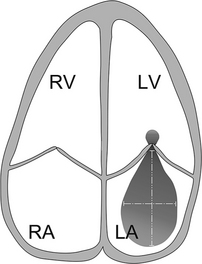
Functional Mitral Regurgitation
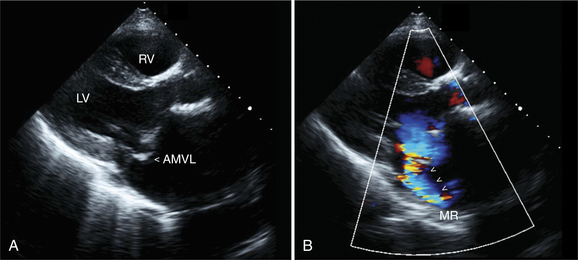
In some patients the mitral valve may appear morphologically normal but is clearly incompetent, as evidenced by clinical or echocardiographic signs of moderate to severe mitral regurgitation (Fig. 2-40). In these patients the mitral regurgitation is caused by abnormal (incomplete) coaptation of the mitral leaflets caused by either annular dilatation or papillary muscle dysfunction. In both instances, the pattern of leaflet closure appears abnormal in the parasternal and apical views; the mitral leaflets appear to coapt only at their tips, rather than along the distal third of the leaflet. The appearance may range from leaflet and chordal tethering to complete failure of coaptation. There is often associated ventricular dilatation and global or regional wall motion abnormality.
Assessment of Mitral Regurgitation
Following assessment of valve morphology and the pattern of coaptation, the color Doppler signals yield further insight into the degree of regurgitation. Color flow Doppler provides a color map of the net instantaneous velocity of blood flow within the atria at varying time points during systole. From this map it is possible to describe the size (area, length, width at the orifice) and direction (central or eccentric) of the regurgitant jet. Descriptors of jet size, particularly the size of the proximal jet at the vena contracta relate to the angiographic degree of regurgitation (Fig. 2-41). Unfortunately, many factors affect the accurate assessment of the degree of regurgitation. For example, changing either the gain or the pulse repetition frequency of the Doppler system may alter the relationship between jet size and the degree of regurgitation, resulting in either an artificial increase or decrease in jet size (particularly jet area and length). Further, detection of the regurgitant jet may not be possible in all instances, such as in patients with prosthetic valves that block out or reflect the interrogating Doppler signal and prohibit its passage into the atrium. Finally, the relationship between jet size and severity of regurgitation may be underestimated if the jet is directed eccentrically along the atrial wall, as often occurs with more severe regurgitation.
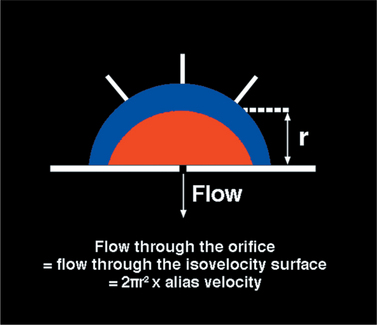
In an effort to overcome some of the limitations related to analysis of the distal jet, investigators have analyzed the size of the converging flow stream proximal to the valve (i.e., on the ventricular side of the valve) (Fig. 2-42). Analysis of the size of this proximal isovelocity surface area (PISA) provides accurate assessment of the regurgitant flow rate but requires careful technical manipulation and high quality imaging to record a PISA that can be accurately measured.
Tricuspid Valve Disease
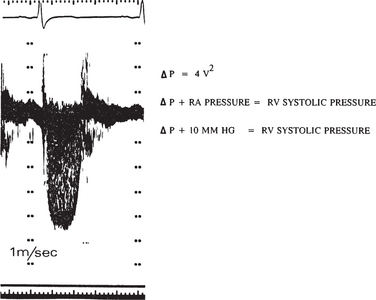
Assessment of the degree of tricuspid regurgitation is similar to that for mitral regurgitation. However, the peak velocity of regurgitant flow across the tricuspid valve is usually 2.5 m/sec, reflecting a peak systolic gradient of 25 mm Hg between the right ventricle and right atrium. In patients without evidence of pulmonary outflow obstruction, accurate assessment of pulmonary artery systolic pressure is possible by adding the estimated right atrial pressure to the estimated systolic atrioventricular gradient. For example, with an atrioventricular gradient of 20 mm Hg, and an estimated right atrial pressure of 10 mm Hg, the estimated pulmonary artery pressure is 30 mm Hg (Fig. 2-43).
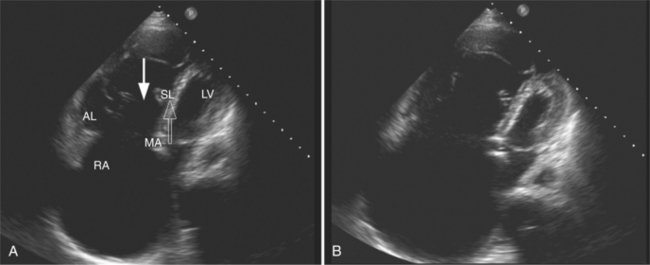
Ebstein anomaly is a congenital defect characterized by elongation of the anterior leaflet and tethering of the tricuspid valve to the right ventricular endocardium. The septal and posterior leaflet origins are displaced apically, reducing the functional right ventricular size while the basal portion of the ventricle is atrialized. Ebstein anomaly can be diagnosed from the apical four-chamber view (Fig. 2-44). Normally the mitral and tricuspid valves align with slight apical insertion of the tricuspid valve, but in patients with Ebstein anomaly the septal leaflet of the tricuspid valve is more than 1 cm apical to the mitral valve. In most patients tricuspid regurgitation is moderate to severe as assessed by Doppler. Further, color Doppler may detect some degree of right-to-left interatrial shunt flow across either a patent foramen ovale or an atrial septal defect.
Aortic Valve Disease
Aortic Stenosis
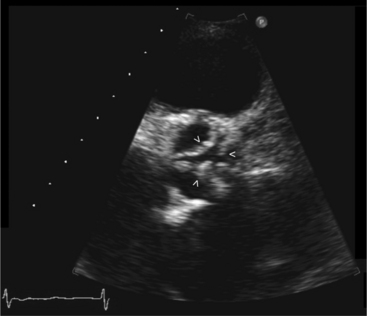
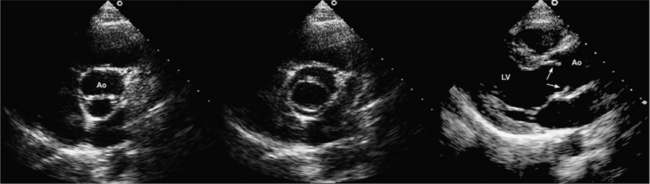
Aortic stenosis is any abnormality of the aortic valve in which the leaflets restrict the lumen of the outflow tract. The three cardinal features of aortic stenosis are (1) leaflet thickening, deformity, and calcification; (2) decreased mobility or doming of the leaflets, or both; and (3) an absolute decrease in size of the valve orifice resulting from reduced cusp separation (Fig. 2-45).
Aortic stenosis may be acquired or congenital. In congenital aortic stenosis, the aortic valve may be unicuspid, bicuspid, or rarely, quadricuspid (Fig. 2-46). Typically, the leaflets are thin but appear to dome. This is evident in the parasternal long-axis views in midsystole. Specific characterization is possible by imaging the valve in the short-axis plane to determine the number of cusps and commissures. Although bicuspid valves are by nature stenotic, they may also predispose to significant aortic regurgitation. Identification of a bicuspid valve may be difficult in older patients if the valve has begun to calcify.
Once you obtain optimal Doppler profiles, you can use the simplified Bernoulli equation to estimate the instantaneous aortic gradient (Fig. 2-47). This may produce a different gradient from the peak-to-peak gradient obtained in the catheterization lab that is derived by comparing peak aortic and left ventricular systolic pressure irrespective of time.
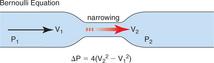
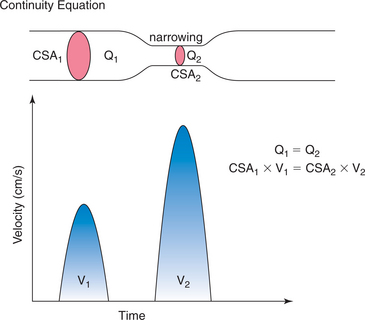
Doppler techniques can also be used to estimate aortic valve area using the continuity equation. The continuity theorem states that the volume of flow entering a cylinder equals the volume of flow passing through an obstruction within the cylinder, which in turn equals the volume of flow exiting from the cylinder (see Figure 2-29). Because the rate of flow (ml/min) in the cylinder relates to both the velocity (V1) of flow and to the area of the lumen of the cylinder (CSA1), it should be possible to estimate the area of the stenosis (CSA2) if you know the velocity of flow through the stenotic region (V2):
This concept allows calculation of the area of a stenotic valve (CSA2):
Aortic Regurgitation
Aortic valve abnormalities associated with aortic regurgitation include bicuspid valve, heavily calcified leaflets, leaflet prolapse, and mobile echodensities suggestive of endocarditis vegetations. Aortic pathology associated with aortic regurgitation includes dilatation of the aortic sinuses or aortic root (Marfan syndrome), ascending aortic aneurysm, and aortic root dissection (Fig. 2-48). Impingement of an aortic regurgitant jet directly into the mitral leaflets may create a high frequency diastolic fluttering of one or both of the mitral leaflets. If regurgitation is severe, early diastolic closure of the mitral valve may occur.
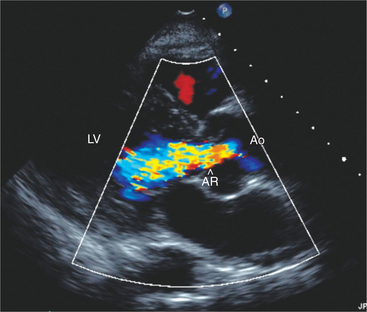
In the parasternal long-axis views, aortic regurgitation appears by color Doppler as a diastolic red or blue jet emanating from the region of the aortic valve and directed into the left ventricular cavity. Sometimes the jet tracks along the anterior leaflet of the mitral valve. Parasternal short-axis, the apical five-chamber, and apical long-axis views may also allow detection of regurgitation, which appears as a red jet because it is directed toward the transducer. Despite the ready detection of aortic regurgitation by color Doppler, assessing the severity of regurgitation is more difficult and at best only semiquantitative. It is preferable to assess regurgitant jet size by evaluating proximal jet width rather than jet length, which may be misleading as even small jets may coalesce with mitral inflow and appear large. An alternative is to consider the cross-sectional area of the jet in the short-axis plane. More severe regurgitation tends to fill a greater portion of the outflow tract in early diastole.
Pulsed Doppler can assess the severity of aortic regurgitation by detecting the presence of late diastolic flow reversal in the descending aorta, which invariably occurs with severe regurgitation. Finally, measurement of the regurgitant pressure half-time derived from the continuous wave Doppler profile reflects the instantaneous pressure gradient between the aorta and the left ventricle. Therefore, more rapid pressure half-times reflect rapid increases in diastolic pressure within the left ventricle and reflect more severe regurgitation. In general, a pressure half-time below 200 ms is indicative of severe aortic insufficiency; however, the use of this method is limited by the effects of other factors which may raise left ventricular diastolic pressure unrelated to the degree of aortic regurgitation (Fig. 2-49).
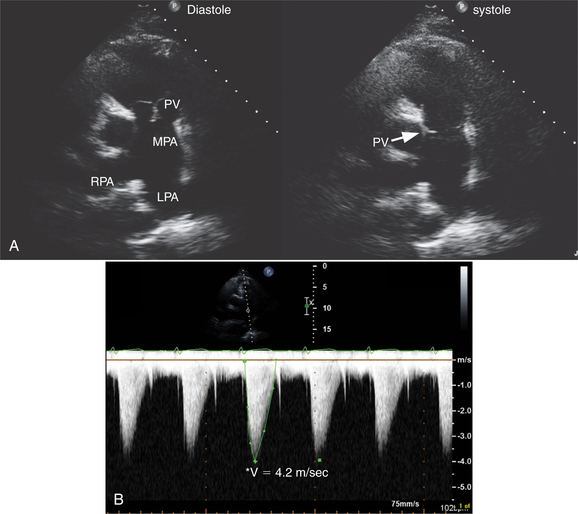
Pulmonary Valve Disease
The pulmonary valve is best visualized in the parasternal short-axis plane, although subcostal views are also useful in children. Patients with rheumatic heart disease may have thickening of the pulmonary valve; however, significant pulmonary stenosis is rare. By far the most common cause of pulmonary stenosis is congenital deformity of the valve (Fig. 2-50). This may occur in isolation or in association with other defects (such as tetralogy of Fallot). Typically the valve appears mobile, but the leaflets dome during systole. In routine practice, continuous wave Doppler is used to assess the peak velocity across the valve because this allows peak and mean transvalvular gradient calculation by the modified Bernoulli equation. There is often associated poststenotic dilatation of the proximal portion of the main pulmonary artery. Further, the right ventricle appears hypertrophied and the interventricular septum flattens during systole as a consequence of the increased pressure load. Color Doppler commonly shows some degree of pulmonary regurgitation as a small red jet directed into the right ventricle toward the transducer. Small jets of regurgitation are physiologic. More marked degrees of regurgitation occur with pulmonary hypertension, primary valve disease, congenital absence of the pulmonary valve, or after pulmonary valvotomy. For clinical purposes, the degree of regurgitation is graded semiquantitatively based on the width and length of the regurgitant jet.
Prosthetic Heart Valves
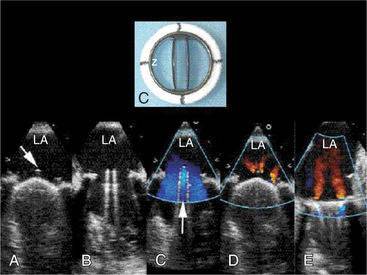
Prosthetic heart valves may be either bioprosthetic or mechanical. Bioprosthetic valves may be heterografts from pig or bovine valves or pericardium, or homografts derived from human aorta or pulmonary artery. Some are supported by three struts that connect to a valve ring, whereas others are strutless using the native valve leaflets and annulus. Mechanical valve design is more diverse. Some older devices have a ball-in-cage design, whereas others have either a single or double tilting disk. Because of the variable nature of these prostheses, it is usually possible to determine the specific type of prosthesis by echocardiography, especially since mechanical devices tend to be more reflective. For example, Starr-Edwards valves have a characteristic protrusion of the cage into the left ventricle or aorta and a unique pattern of ball motion and forward flow around the valve. In contrast, disk valves have a much lower profile, and disk motion may be clearly evident (Fig. 2-51). Finally, bioprosthetic valves are usually recognizable by the supporting strut and by the presence of leaflet motion within the prosthesis.
To assess the significance of the degree of regurgitation across a prosthetic valve, it is important to consider the type and position of the prosthesis. The type of prosthesis is important because bioprosthetic and Starr-Edwards valves do not normally leak. In contrast, the single disk (Medtronic Hall) valve design allows a small central leak, and the double disk St. Jude valve has small leaks around the disk margins. Therefore, detection of a small central jet of regurgitation is expected in patients with disk valves, is suggestive of valve degeneration in a patient with a bioprosthetic valve, and may indicate either vegetation or pannus ingrowth around the valve ring in a patient with a Starr-Edwards valve. Regardless of valve type, a paravalvular leak would indicate disruption of the valve ring as a result of either infection or wear of the valve sutures.
Infective Endocarditis
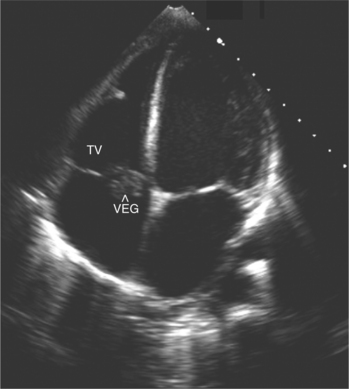
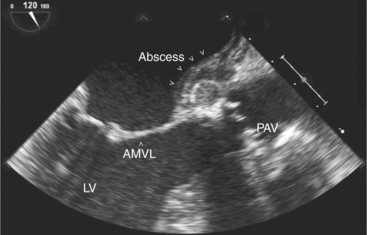
Two-dimensional echocardiography is invaluable in the assessment of patients with a clinical picture of infective endocarditis. Detection of an abnormal mass of echoes on a valve leaflet strongly suggests vegetations (Fig. 2-52). Mitral and tricuspid vegetations are generally on the atrial side of the valve, whereas aortic and pulmonary vegetation tend to form on the ventricular surface. Echocardiography also allows accurate assessment of vegetation morphology (size, mobility, and density), detection of extravalvular extension of the infective process, and determination of the degree of valvular dysfunction (Fig. 2-53).
Despite the clear value of echocardiography in the assessment of patients suspected of endocarditis, the technique cannot exclude the diagnosis of infective endocarditis with certainty. There are a number of reasons for this. First, the vegetation may be too small to be resolved, or only be present as focal, nonspecific valvular thickening. Second, the differential diagnosis of a discrete mass of mobile echoes attached to a leaflet includes thrombus, tumor, fibrin, flail portion of the valve or chordae, old healed vegetation, or aneurysm formation secondary to the infective process. Therefore, it is essential to correlate the echocardiographic findings with the clinical picture.
ASSESSMENT OF ACQUIRED HEART DISEASE
Ischemic Heart Disease
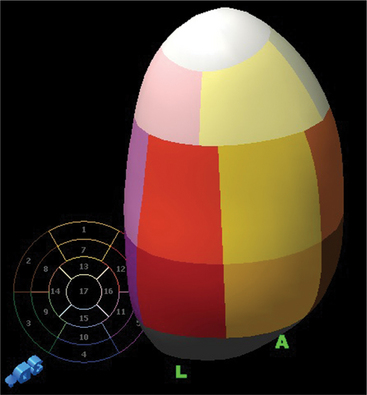
Assessing Left Ventricular Regional Wall Motion
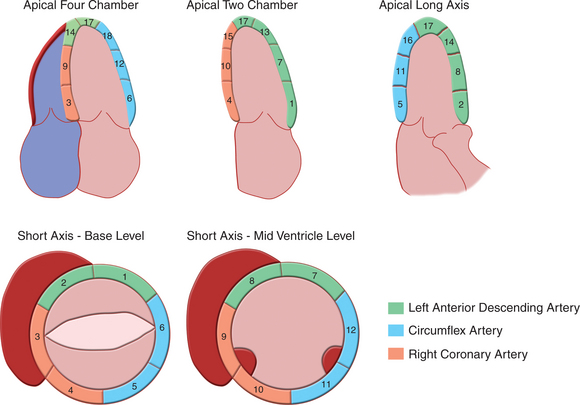
Regional wall motion is most frequently described qualitatively as being normal, hypokinetic (moving in the proper direction but at a slower rate and to a smaller extent than normal), akinetic (not moving), or dyskinetic (moving outward in systole). The Cardiac Imaging Committee of the American Heart Association has recommended a system with 17 segments to standardize echocardiographic segmental assessment with that of other cardiac imaging techniques (Fig. 2-54). If one assigns a functional “score” to each segment based on qualitative visual assessment (normal = 0, hypokinesis = 1, akinesis = 2, dyskinesis = 3), an estimate of the extent of segmental dysfunction can be made.
Acute Complications of Myocardial Infarction
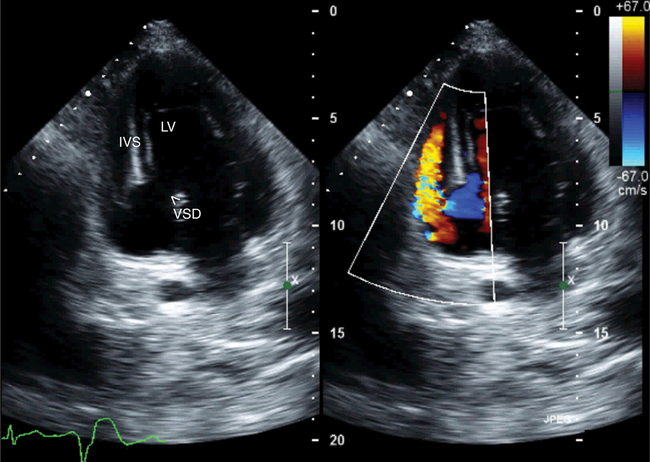
In patients with papillary muscle rupture, one or the other mitral leaflet becomes flail and the head of the ruptured papillary muscle prolapses in and out of the left atrium with each cardiac cycle. Further, as a consequence of the acute onset of regurgitation, the noninfarcted myocardium is hyperdynamic and color Doppler confirms a large, usually eccentric jet of mitral regurgitation into a slightly dilated atrium. In contrast, in patients with acute septal rupture, the mitral apparatus is intact and color Doppler can help accurately locate the septal defect (Fig. 2-55). Continuous wave Doppler can determine the peak velocity of interventricular shunt flow, and thus predict the gradient between the left and right ventricles (by using the simplified Bernoulli equation). From this information the pulmonary artery pressure can be estimated.
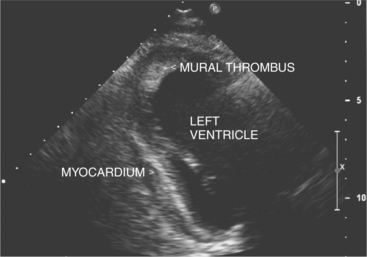
Rupture of the free wall of the ventricle, which may occur even after small infarctions, is most often rapidly fatal as a result of acute pericardial tamponade. In some instances, however, pericardial adhesions can limit the extent of pericardial bleeding (either from past pericarditis or prior coronary surgery) and result in a localized pseudoaneurysm. In contrast, true aneurysms usually form after large infarctions affecting either the anterior septal wall, or less commonly, the inferior base of the heart. Aneurysms are characteristically thinned, dyskinetic, and predispose to thrombus formation. Apical thrombus is usually evident as a collection of echogenic material in the region of abnormal wall motion (Fig. 2-56). Thrombus may either embolize acutely or become organized, layering along the wall or calcifying with time. The left ventricular remodeling can occur after myocardial infarction, resulting in ventricular size and shape change that may have adverse effect on cardiac function.
Cardiomyopathies
Dilated Cardiomyopathy
Despite the large number of recognized causes of dilated cardiomyopathy, there is rarely a specific etiologic factor and most cases are assumed to be a consequence of viral infection. Typically, all chambers of the heart are dilated and both the right and left ventricles appear diffusely hypokinetic. The feature that most distinguishes idiopathic dilated cardiomyopathy (IDCM) from ischemic cardiomyopathy is the presence of global, rather than regional, dysfunction (Fig. 2-57). In some patients, however, regional dysfunction may be evident because of preservation of systolic function at the base of the left ventricle or because of the presence of left bundle branch block, which causes paradoxical septal motion. Nonetheless, whereas right ventricular function is often preserved in patients with ischemic cardiomyopathy, this is not typical of other causes.
Hypertrophic Cardiomyopathy
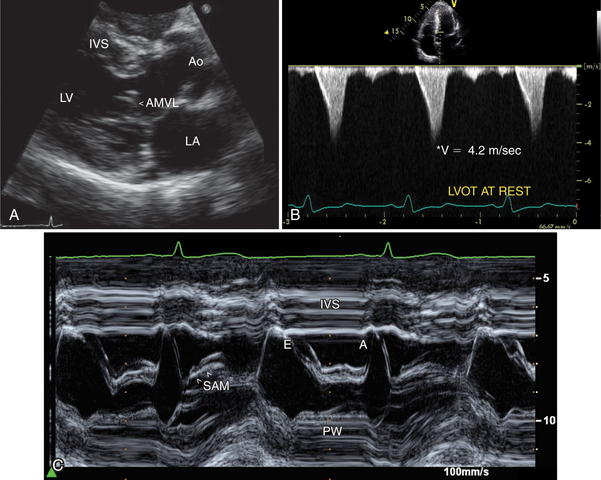
A hallmark of asymmetric hypertrophic cardiomyopathy with outflow tract obstruction is systolic anterior motion (SAM) of the anterior leaflet of the mitral valve (Fig. 2-58). The interposition of this leaflet tissue causes obstruction to left ventricular emptying in mid-to-late systole. This is reflected in aortic valve motion, with a closure pattern in midsystole. Doppler sampling of the left ventricular outflow tract demonstrates increased velocity at the site of leaflet-septal contact, and the continuous wave Doppler profile typically has a late-peaking systolic pattern (see Figure 2-57B). The peak velocity of this outflow signal can be used to predict the outflow tract gradient.
Restrictive Cardiomyopathy
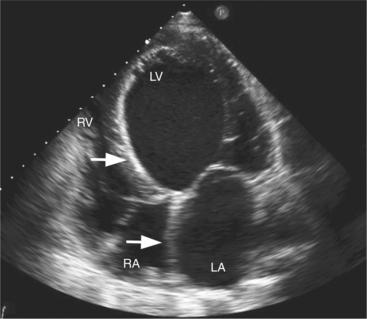
The characteristic morphologic features of restrictive cardiomyopathy are marked ventricular hypertrophy, a small ventricular cavity, and biatrial enlargement. Typically, systolic function is normal or even hyperkinetic. Valvular leaflets may be thickened and there is usually significant mitral and tricuspid regurgitation. The pericardium also appears normal. The most prominent physiologic derangement is impaired diastolic relaxation reflected in the alteration of the pattern of left ventricular filling on the Doppler profile of mitral inflow. Typically, the initial filling wave is large with rapid deceleration consequent to increased early filling, and the late filling wave is either small or absent owing to a reduced late diastolic filling capacity (see Figure 2-30). Although a specific cause is rarely determined, consideration should be given to the possibility of an infiltrative process such as amyloidosis and hemochromatosis.
Noncompaction Cardiomyopathy
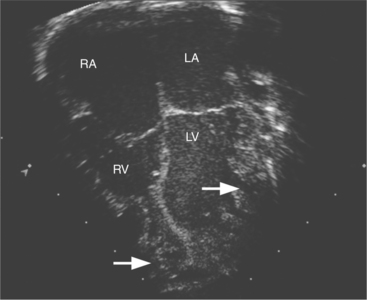
The echocardiographic diagnosis is made by detection of thickened left ventricular walls with two distinct layers of noncompacted and compacted myocardium with deep intertrabecular recesses. The prominent trabecular meshwork typically involves the apex or midventricular segments of the inferior and lateral wall with hypokinesis of the affected and adjoining segments. A ratio of noncompacted-to-compacted myocardial thickness of greater than 2:1 measured at end systole is characteristic of left ventricular noncompaction. This form of cardiomyopathy is caused by intrauterine arrest of compaction of the myocardial fibers and meshwork. Clinically, the patients are at increased risk of heart failure, arrhythmias, and embolic events (Fig. 2-59).
Arrhythmogenic Right Ventricular Dysplasia
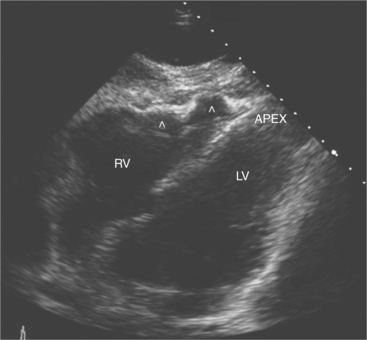
Patients with arrhythmogenic right ventricular dysplasia (ARVD) are predisposed to ventricular arrhythmias and sudden cardiac deaths. The right ventricular myocardium is replaced by adipose tissue and collagen. This leads to the characteristic echocardiographic features of focal right ventricular motion defects and aneurysm formation, right ventricular dilatation and hypokinesis, and the presence of brightly echogenic areas in the right ventricular myocardium indicative of fatty/fibrous tissue replacement (Fig. 2-60).
Pericardial Disease
Pericardial Effusions and Pericardial Tamponade
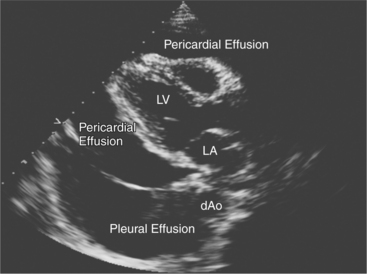
Echocardiography is a sensitive technique for the detection and localization of pericardial effusions. Serous pericardial fluid does not reflect ultrasound and therefore appears as an echolucent area within the boundaries of the pericardial sac (Fig. 2-61). The size of the pericardial effusion is usually described semiquantitatively as being small, moderate, or large. When large, the heart swings freely in the pericardial space. The distinction between large fluid collections in the pleural space and pericardial fluid can be made on the parasternal long-axis view. Pericardial fluid extends between the descending thoracic aorta and left atrium. In contrast, the aorta remains closely apposed to the atrioventricular groove in the presence of pleural fluid.
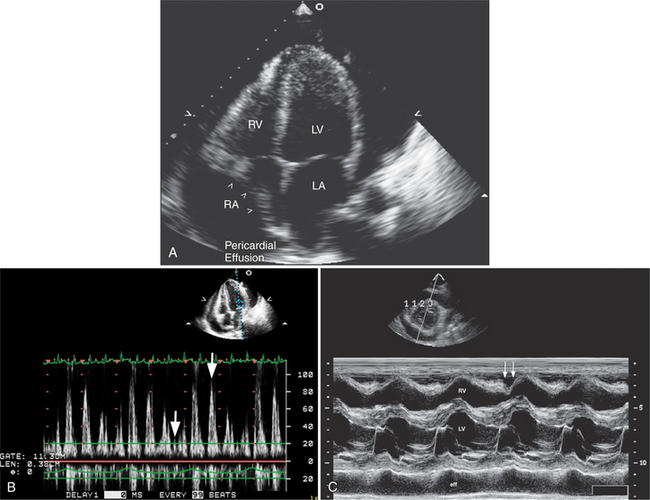
Echocardiography is also useful in determining the hemodynamic significance of pericardial fluid collections. An increase in intrapericardial pressure relative to atrial and ventricular pressure causes inversion of the right atrial free wall at the end of atrial systole (early ventricular diastole), and inversion of the right ventricular free wall in early diastole (Fig. 2-62A). Right ventricular inversion is both sensitive and specific for clinically apparent cardiac tamponade. In contrast, right atrial inversion is a more sensitive but less specific marker of tamponade. Doppler ultrasound is useful in the assessment of the hemodynamic significance of pericardial effusions. In particular, it is possible to detect exaggerated respiratory phase variation in right and left ventricular inflow and aortic and pulmonary outflow, consequent to the inability of the heart to both fill normally and eject a normal stroke volume in the presence of a tense fluid-filled pericardium (see Figure 2-62B).
Pericardial Constriction
Other two-dimensional echocardiographic features that may be visible include the lack of respiratory variation in the size of the inferior vena cava and a specific pattern of motion of the interventricular septum. This “septal bounce” pattern is an initial diastolic leftward movement of the septum, which is a consequence of the increased right ventricular inflow during peak inspiration followed by a rapid rightward shift as left ventricular filling begins.
Intracardiac Masses
Intracardiac Tumors
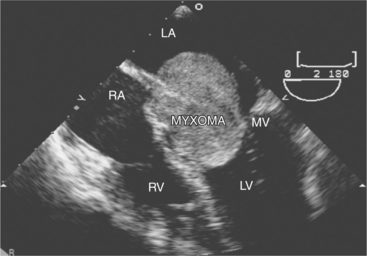
Primary tumors of the heart are distinctly rare and most often benign. These include fibromas, fibroelastomas, rhabdomyomas, and myxomas. The most common tumor is the atrial myxoma. These frequently arise from the left side of the fossa ovalis, but they may arise anywhere in the atria and occasionally involve the mitral or tricuspid leaflets. They can be either sessile or pedunculated, single or multiple. Myxomas have been associated with other noncardiac conditions including lentiginosis and pituitary tumors (usually familial). Echocardiographically, myxomas are discrete, multilobulated masses. Although usually homogeneous in appearance, they may contain focal areas of lucency as a result of areas of hemorrhage that occur when the tumor outgrows its blood supply. When large and pedunculated, atrial myxomas may prolapse across the mitral or tricuspid valve in diastole and impair ventricular filling (Fig. 2-63).
Intracardiac Thrombus
Ventricular thrombi appear as focal echo producing masses adjacent to the normal endocardial contour and may be laminar, sessile, or independently mobile. They can have a speckled appearance and when organized may contain areas that are brighter than the surrounding myocardium (see Figure 2-56). Thrombi should be differentiated from false tendons, apical scar, and chest wall artifacts. This is usually possible because thrombi are typically seen in at least two views, do not appear as distinct linear midventricular structures, and tend to form in regions of abnormal wall motion. The risk of systemic embolism following myocardial infarction is greater in patients with echocardiographic evidence of thrombus, and in these patients the risk relates to the size and mobility of the thrombus.
Atrial thrombi have morphologic characteristics similar to those of ventricular thrombi. They most frequently arise in the atrial appendage. Transesophageal imaging is often required to confirm or exclude the presence of thrombus with certainty. It is important to differentiate thrombus from the normal trabeculae of the appendage and from the ridge between the appendage and the lower left pulmonary vein (see Figure 2-32).
Aortic Disease
Proximal Aortic Disease
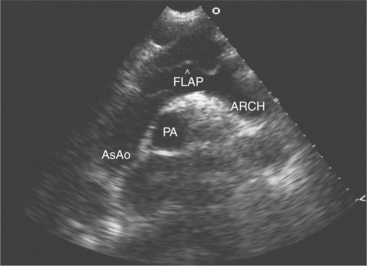
Aortic dissection is suggested by aortic root dilatation and a discrete dissection flap, which partitions the aortic lumen (Fig. 2-64). Typically the true lumen is smaller than the false lumen, increases in size during systole, and has high velocity flow within it. Once aortic dissection is confirmed, it is important to determine the involvement of the ostia of either the coronary or head and neck vessels, aortic valve (resulting in aortic regurgitation), and pericardial space (resulting in effusion and tamponade). Transesophageal imaging allows the diagnosis of aortic dissection with much higher sensitivity and almost complete specificity. Finally, a rare but echocardiographically distinct condition of the proximal aorta is the development of an aneurysm of the sinus of Valsalva. This may be clinically silent, but detectable during routine echocardiography as a discrete membranous structure prolapsing into either the right atria (if the aneurysm arises from the noncoronary sinus) or right ventricle (if the aneurysm arises from the right coronary sinus). Rupture of the aneurysm may occur spontaneously or as a consequence of infection and presents clinically with the development of a continuous murmur. Color Doppler reveals evidence of abnormal aortoatrial or aortoventricular continuous shunt flow. Occasionally, the degree of left-to-right shunt flow may be significant and require surgical correction.
Disease of the Thoracic and Abdominal Aorta
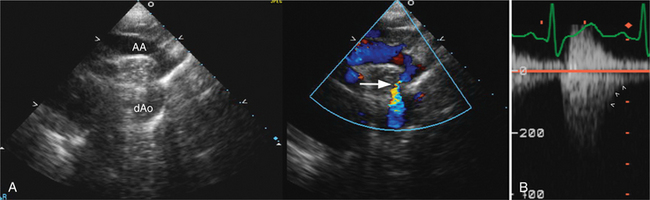
The Doppler profile seen in the abdominal aorta may suggest a coarctation; with a significant coarctation, there is continuous systolic and diastolic flow in the aorta. Further, continuous wave Doppler directed through the descending thoracic aorta can determine the gradient across the coarctation, and the suprasternal window may allow accurate visualization and location of the coarctation itself, especially in the pediatric patient (Fig. 2-65).
CONGENITAL HEART DISEASE
Atrial Septal Defects
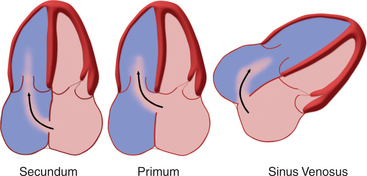
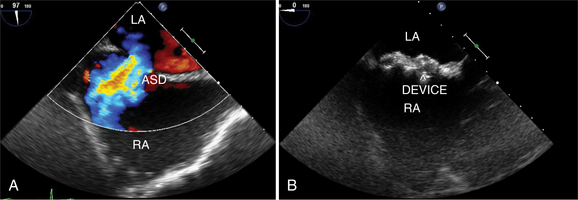
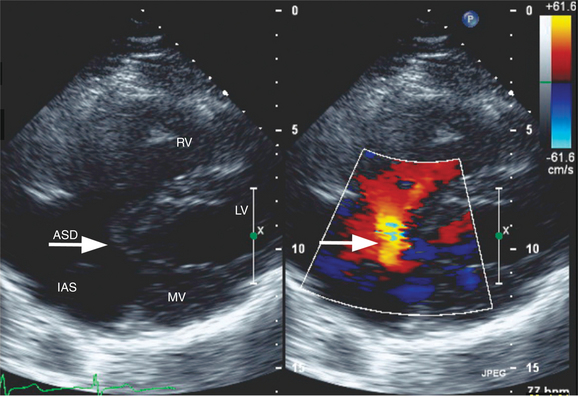
Atrial septal defects (ASDs) are among the most common congenital heart lesions. Defects in the interatrial septum are categorized by their location within the septal wall (Fig. 2-66). They include the ostium secundum ASD located in the midportion of the atrial septum in the region of the fossa ovalis; the ostium primum ASD positioned inferiorly near the atrioventricular valves; the sinus venosus ASD located near the entry of the superior or inferior vena cava; and the coronary sinus septal defect at the mouth of the coronary sinus. Two-dimensional echocardiography can visualize the entire atrial septum and detect an ASD as a discrete absence of echoes in the appropriate area of the septal wall (Fig. 2-67). False-positive dropout of the atrial septum occurs if the ultrasound beam does not strike the atrial septum nearly perpendicularly. However, the acoustic interface between septum and blood at the margin of a true defect creates a particularly dense reflection which helps define the edges of the ASD and distinguishes it from false-positive dropout. Doppler color flow mapping complements two-dimensional imaging by demonstrating flow across the defect as a localized jet from left to right during late systole and diastole. Atrial defects with low right-sided pressures and predominantly left-to-right shunting are most easily detected. When pulmonary artery hypertension develops, shunt flow is low in velocity and often bidirectional. Thus, it may be more difficult to distinguish atrial shunt flow from the other low-velocity flows within the atrium. Pulsed Doppler may confirm the direction and timing of flow across the ASD to supplement the information derived from color flow mapping.
Another noninvasive method for detecting atrial shunts is contrast echocardiography. By rapid intravenous injection of a small volume of agitated saline, the resulting turbulence and dissolved air creates multiple small ultrasound scatterers. This produces a “contrast effect” when compared with the unopacified blood pool and allows detection of right-to-left shunting by the passage of contrast from the right atrium to the left atrium and ventricle (see Figure 2-22). Left-to-right shunting is visible as a “negative contrast effect” when unopacified left atrial blood enters the contrast-filled right atrium. When there is an ASD, common associated lesions should be sought. With sinus venosus defects, and less commonly with secundum ASDs, the right pulmonary veins may drain either functionally or anatomically to the right atrium. Two-dimensional imaging and color flow mapping can often demonstrate the entry of all four pulmonary veins. The diagnosis of partial anomalous pulmonary venous return requires careful attention to the superior vena cava and right upper pulmonary vein. Primum atrial septal defects are frequently a part of the spectrum of endocardial cushion defects, which include a deficiency in the atrioventricular septum and anomalies of the atrioventricular valves. Thus, an associated cleft in the anterior mitral valve leaflet and the presence of a VSD should be investigated when a primum ASD is diagnosed (Fig. 2-68).
Estimation of the size of the atrial shunt and its effect on the pulmonary circulation are also important. The atrial defect size can be measured directly from the two-dimensional echocardiogram with high-quality images. However, this may not correlate directly with shunt size because the pulmonary vascular resistance, right ventricular compliance, and intravascular volume all influence the volume of shunt flow. Evidence of right atrial and right ventricular chamber enlargement and paradoxical motion of the interventricular septum are indicative of right ventricular volume overload and generally indicate a pulmonary-to-systemic shunt ratio of greater than 1.5:1. Doppler estimates of volumetric flow across the pulmonic and aortic valves provide a noninvasive method of measuring the shunt ratio. The echo-derived shunt ratio (Qp:Qs) correlates well with that obtained at cardiac catheterization, but it is subject to measurement errors and therefore is used clinically only as a semiquantitative index of shunt size. There are several methods for quantifying shunt flow by color Doppler, including measurements of the area of shunt flow within the right atrium and of the jet width as it crosses the defect. Although the latter method correlates more closely with actual shunt size, both methods are still only semiquantitative for clinical purposes.
The advent of percutaneous closure of ASD using a variety of devices has made definitive imaging of septal defect size, location, and number a clinical imperative. Because of its proximity to the atrial septum from within the esophagus, TEE is frequently used for a clearer image of ASDs and to measure the size of the defect and its surrounding rims. Placement of the ASD closure devices in those defects that are amenable to percutaneous closure is accomplished in the cardiac catheterization laboratory under TEE guidance (see Figure 2-67).
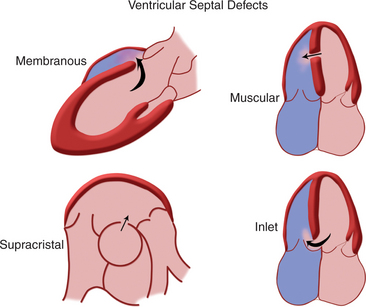
Ventricular Septal Defects
The interventricular septum is a complex structure composed of muscular and fibrous tissue. Defects in the septum are extremely common and can occur at a single or multiple locations (Fig. 2-69). Echocardiographic detection of a VSD depends on echo dropout from the interventricular septum and is further strengthened by the use of pulsed or color flow Doppler to detect turbulent shunt flow across the defect (Fig. 2-70). Muscular VSDs occur frequently in young children and the majority of these close spontaneously within the first 2 years of life. Muscular defects near the cardiac apex can be of considerable size and yet be overlooked unless the sonographer closely inspects the apical aspect of the interventricular septum.
Patent Ductus Arteriosus
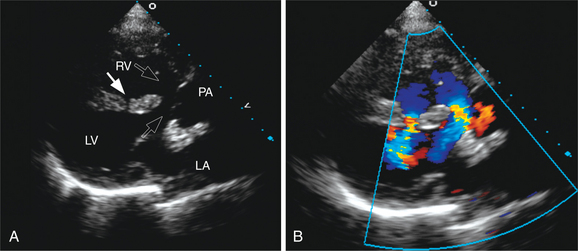
In fetal life, the ductus arteriosus connects the pulmonary artery and aorta to allow passage of blood from the right heart to the systemic circulation without passing through the high resistance pulmonary circuit. Persistence of this channel beyond the first few days or weeks of life is abnormal and is usually an indication for noninvasive or surgical closure. Two-dimensional echocardiography can image the ductus arteriosus in the left parasternal and suprasternal views, which display the pulmonary artery bifurcation and the descending thoracic aorta (Fig. 2-71). In infants and small children, it is often possible to image this channel throughout its length and measure its lumen size. Color flow mapping demonstrates the flow within the ductus and main pulmonary artery as a high-velocity jet entering the pulmonary artery. Although shunt flow is usually continuous from the higher-pressure aorta to the lower-pressure pulmonary vessel, the normal systolic forward flow in the pulmonary artery often obscures the systolic shunt flow, and the diastolic flow is the more readily detectable flow signal. With a significant volume of shunt flow, the pulmonary artery will be enlarged, as will the left atrium and left ventricle. There may be retrograde flow in the descending thoracic aorta by pulsed or color flow Doppler, indicating significant runoff from the aorta into the ductus arteriosus.
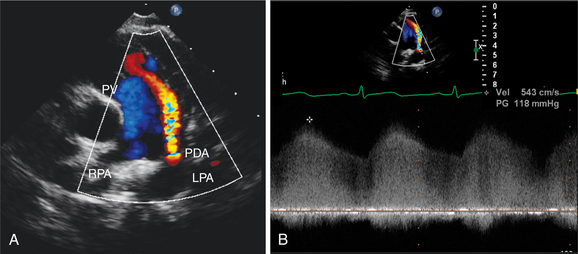
Tetralogy of Fallot
Tetralogy of Fallot is a well-recognized cyanotic heart defect that results from malalignment and anterior deviation of the conal septum. This creates obstruction to pulmonary outflow and a large subaortic VSD. The pulmonary artery is often underdeveloped and the right ventricle develops hypertrophy in response to the outflow obstruction. Echocardiographically, the deviation of the conal septum is clearly visible as a muscular protrusion into the right ventricular outflow tract. The VSD is usually large and readily imaged beneath the large overriding aortic root (Fig. 2-72). Pulsed and color flow Doppler demonstrate low-velocity flow from the right ventricle passing across the VSD and out the aorta and high-velocity, turbulent flow in the right ventricular outflow tract. Right ventricular outflow obstruction is usually at multiple sites: the subvalvular muscular ridge, the valvular and annular pulmonary level, and occasionally at the branch pulmonary arteries. Continuous wave Doppler sampling of flow in the right ventricular outflow tract predicts the peak gradient from right ventricle to pulmonary artery.
Complete Transposition of the Great Arteries
Another cyanotic congenital heart defect is complete transposition of the great arteries. In this entity, the aorta arises from the right ventricle and the pulmonary artery has its origin from the left ventricle. Echocardiographically, the great arteries arise in parallel from the base of the heart instead of wrapping around one another. The semilunar valves are visible at roughly the same level relative to the long axis of the heart and therefore can be imaged simultaneously in the same plane (Fig. 2-73). Following the course of the great arteries, the anterior vessel arches and gives off brachiocephalic vessels, whereas the posterior artery bifurcates into right and left pulmonary branches. Because the right ventricle supplies the systemic circulation, it is characteristically enlarged and more globular in shape. Complete transposition creates two circulations in parallel, with systemic venous return to the right atrium and ventricle being redirected to the systemic circulation and pulmonary venous flow to the left atrium and left ventricle returning to the lungs. Therefore, some means of mixing of these two circulations is essential. This most often occurs at the atrial level via a patent foramen ovale, but VSDs and a patent ductus arteriosus are also means of intermixing and should be sought during echocardiographic Doppler evaluation. Coronary artery anatomy should also be determined because surgical correction requires translocation of the coronaries from the anterior aorta to the posterior semilunar root. A single coronary artery or an intramural course of a coronary vessel makes translocation more difficult.
Truncus Arteriosus
Persistent truncus arteriosus is a rare malformation in which a single arterial trunk arising from the heart supplies the coronary, pulmonary, and systemic circulations. A large VSD is invariably present allowing both ventricles to eject blood into the single arterial vessel. Several patterns of truncus arteriosus are commonly recognized (Fig. 2-74). The most frequent patterns are those in which the pulmonary arteries arise from the ascending portion of the truncus, either as a main pulmonary artery, which then branches, or as separate branches from the posterior or lateral walls of the single arterial vessel. Echocardiographic diagnosis is based on demonstrating a large, single great vessel that overrides the interventricular septum above a large VSD, absence of a right ventricular outflow tract and pulmonary valve, and branching of the main pulmonary artery or its independent branches from the large common arterial trunk (Fig. 2-75). The truncal valve is often thickened, stenotic, or regurgitant and may have more than three cusps. Pulsed and color flow Doppler can detect truncal regurgitation and estimate the degree of truncal valve stenosis.


Double Outlet Right Ventricle
As its name implies, double outlet right ventricle is an anomaly in which both great arteries arise entirely or to a major extent from the right ventricle. Left ventricular ejection must perforce pass through a VSD to the right-sided outflow vessels. There is wide variability in the orientation of the great vessels relative to the position of the VSD. The clinical signs and symptoms may be simply those of a large VSD or may resemble the physiology of complete transposition. The presence of pulmonary stenosis may create a physiology akin to tetralogy of Fallot or transposition with pulmonary outflow obstruction. The echocardiographic appearance in double outlet right ventricle is of a large outlet VSD and overriding of a great vessel. One key diagnostic feature is the lack of fibrous continuity between the anterior mitral leaflet and the semilunar valve, which is closest to the mitral valve. The presence of subarterial conal tissue elevates and displaces the more posterior vessel toward the right ventricle, and it is this conal tissue that is visible as muscle or fibrous tissue separating the mitral valve from its adjacent semilunar valve (see Figure 2-70). Because pulmonary stenosis is frequent, echocardiographic study should determine its presence and severity. The size and location of the VSD in relation to the great arteries is another factor to be assessed by echocardiography.
Univentricular Heart
Univentricular heart or single ventricle heart occurs when both atrial chambers connect to a single ventricular chamber. Communication between atria and ventricle can be through two atrioventricular valves, a common valve, or a single atrioventricular valve with absence or atresia of the other orifice. The ventricular chamber may be of the right or left ventricular type. When the main chamber is of left ventricular morphology, there is a small anterior outflow chamber that represents the remnant of the right ventricle. In univentricular heart of the right ventricular type, there is a small blind posterior pouch constituting the residual left ventricle. Echocardiographic features of the univentricular heart, then, demonstrate a large single ventricular chamber with no interventricular septum (Fig. 2-76). The small outflow chamber, imaged anteriorly either to the patient’s right or left, gives rise to one of the great vessels. If a blind posterior pouch is present, it appears as a small chamber appended to the posterior aspect of the main ventricular chamber, either to the right or left. In the majority of patients with univentricular heart, the great vessels are transposed, with the aorta arising from the outlet chamber and the pulmonary artery arising from the large ventricular chamber. Most patients with univentricular heart will be managed surgically with a Fontan procedure, which diverts systemic venous return directly to the pulmonary arteries via a baffle within or external to the right atrium and an anastomosis of the superior vena cava directly to the pulmonary artery.

ECHOCARDIOGRAPHY AND DEVICE THERAPY
There is a growing role for echocardiography to assist with the management of device implantation.
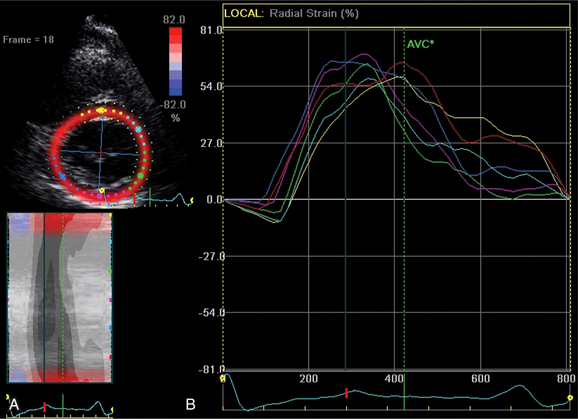
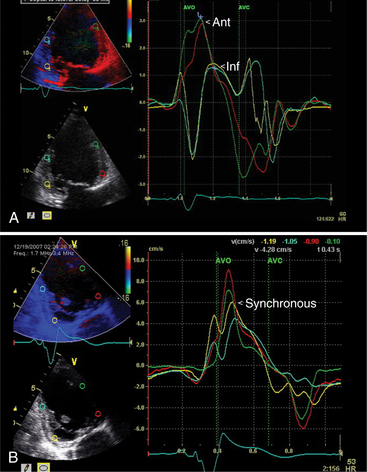
Cardiac Resynchronization Therapy
Patients who respond to this therapy demonstrate improved left ventricular ejection fraction, ventricular remodeling with reduced chamber size, and reduction in mitral regurgitation resulting in symptomatic and mortality benefits. The current criteria for treatment are based on electrical dyssynchrony and QRS duration. However, echocardiography can play a role in identifying patients with significant mechanical dyssynchrony and thus improve the current method of patient selection for expensive device therapy. The methods that have been used to date to assess the magnitude of dyssynchrony include measuring the delay between regional contraction using M mode, Doppler tissue imaging, and speckle tracking during twodimensional and three-dimensional image acquisition. Myocardial contraction can be assessed in terms of myocardial thickening, myocardial velocity, and myocardial strain and strain rate. There is ongoing research to identify the most useful technique in identifying the subgroup of patients who would benefit most from cardiac resynchronization therapy (Fig. 2-77).
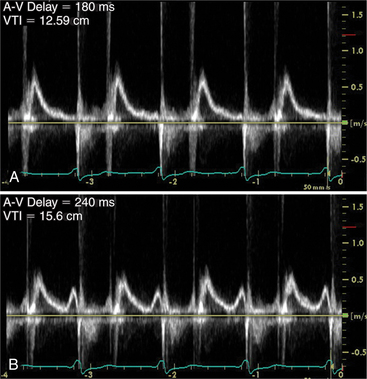
Furthermore, Doppler cardiac flow profiles which measure cardiac output and left ventricular performance can be used to assist with setting atrioventricular and interventricular timing intervals to provide optimal device function (Fig. 2-78).
Ventricular Assist Devices
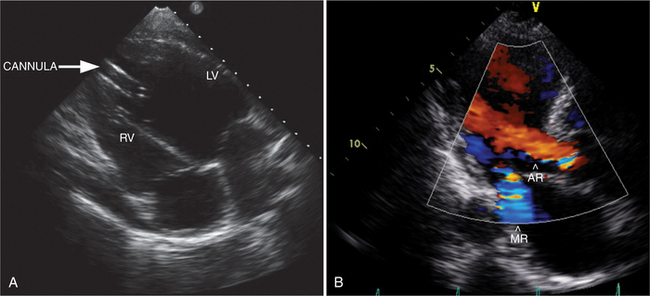
Mechanical devices can be used to treat patients with end-stage heart failure that has been refractory to medical therapy. Echocardiography plays an essential role in diagnosing those patients with heart failure with poor systolic function who would benefit from therapy and identifying structural factors, which would prohibit the use of these devices such as interatrial shunts, interventricular shunts, or significant aortic regurgitation. Ongoing monitoring of correct device function requires echocardiography to assess cardiac chamber size and function, valvular function, and device cannula flow profile (Fig. 2-79). Finally, the detection of myocardial recovery with improved systolic function can lead to determining suitability for device explantation.
Cardiac Interventional Procedures
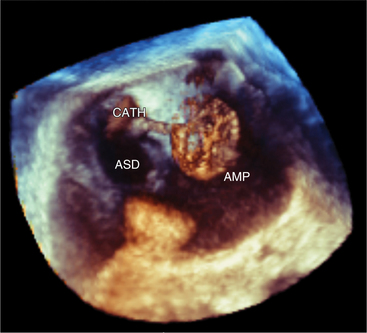
TEE is frequently used to assist with interventional cardiac procedures including balloon mitral valvoplasty, percutaneous ASD and patent foramen ovale closure, atrial appendage occluder device implantation for atrial fibrillation, percutaneous mitral valve repair, and percutaneous aortic valve replacement. TEE assists with determining the feasibility of procedures. For example, sufficient tissue rim surrounding an ASD is required for successful device closure. It is critical for identifying pathology that may be a contraindication to the procedures such as left atrial thrombus. During the intervention, TEE is used to monitor appropriate placement of the transseptal needles, guidewires, and devices (Fig. 2-80). Finally it can be used to assess the success of the procedure by identifying residual shunt, valvular regurgitation, and complications of the procedure such as pericardial effusion and device impingement. New technological advances have allowed the placement of ultrasound crystals on the tip of intracardiac catheters. These catheters can be positioned by the operator within the right atrium with the ultrasound image directed toward the atrial septum. Some centers now prefer to place ASD devices with guidance by intracardiac ultrasound instead of transesophageal imaging.
Aboulhosn J, Child JS. Left ventricular outflow obstruction: subaortic stenosis, bicuspid aortic valve, supravalvar aortic stenosis, and coarctation of the aorta. Circulation. 2006;114(22):2412-2422.
Abraham TP, Dimaano VL, Liang HY. Role of tissue Doppler and strain echocardiography in current clinical practice. Circulation. 2007;116(22):2597-2609.
Acquatella H. Echocardiography in Chagas heart disease. Circulation. 2007;115(9):1124-1131.
American College of Cardiology/American Heart Association Task Force on Practice Guidelines. ACC/AHA 2006 guidelines for the management of patients with valvular heart disease: a report of the American College of Cardiology/American Heart Association Task Force on Practice Guidelines (writing committee to revise the 1998 Guidelines for the Management of Patients With Valvular Heart Disease): developed in collaboration with the Society of Cardiovascular Anesthesiologists: endorsed by the Society for Cardiovascular Angiography and Interventions and the Society of Thoracic Surgeons. Circulation. 2006;114(5):e84-e231. et al.
Bayer AS, Bolger AF, Taubert KA, et al. Diagnosis and management of infective endocarditis and its complications. Circulation. 1998;98(25):2936-2948.
Bhatia VK, Senior R. Contrast echocardiography: evidence for clinical use. J Am Soc Echocardiogr. 2008;21(5):409-416.
Borer JS, Bonow RO. Contemporary approach to aortic and mitral regurgitation. Circulation. 2003;108(20):2432-2438.
Carabello BA. Modern management of mitral stenosis. Circulation. 2005;112(3):432-437.
Douglas PS, Khandheria B, Stainback RF, et al. ACCF/ASE/ACEP/AHA/ASNC/SCAI/SCCT/SCMR 2008 appropriateness criteria for stress echocardiography: a report of the American College of Cardiology Foundation Appropriateness Criteria Task Force, American Society of Echocardiography, American College of Emergency Physicians, American Heart Association, American Society of Nuclear Cardiology, Society for Cardiovascular Angiography and Interventions, Society of Cardiovascular Computed Tomography, and Society for Cardiovascular Magnetic Resonance endorsed by the Heart Rhythm Society and the Society of Critical Care Medicine. J Am Coll Cardiol. 2008;51(11):1127-1147.
Douglas PS, Khandheria B, Stainback RF, et al. ACCF/ASE/ACEP/ASNC/SCAI/SCCT/SCMR 2007 appropriateness criteria for transthoracic and transesophageal echocardiography: a report of the American College of Cardiology Foundation Quality Strategic Directions Committee Appropriateness Criteria Working Group, American Society of Echocardiography, American College of Emergency Physicians, American Society of Nuclear Cardiology, Society for Cardiovascular Angiography and Interventions, Society of Cardiovascular Computed Tomography, and the Society for Cardiovascular Magnetic Resonance endorsed by the American College of Chest Physicians and the Society of Critical Care Medicine. J Am Coll Cardiol. 2007;50(2):187-204.
Elliott P, Andersson B, Arbustini E, et al. Classification of the cardiomyopathies: a position statement from the European Society of Cardiology Working Group on Myocardial and Pericardial Diseases. Eur Heart J. 2008;29(2):270-276.
Feigenbaum H. Echocardiography, ed 6. Indianapolis: Lippincott Williams & Wilkins, 2004.
Freeman RV, Otto CM. Spectrum of calcific aortic valve disease: pathogenesis, disease progression, and treatment strategies. Circulation. 2005;111(24):3316-3326.
Gardin JM, Adams DB, Douglas PS, et al. Recommendations for a standardized report for adult transthoracic echocardiography: a report from the American Society of Echocardiography’s Nomenclature and Standards Committee and Task Force for a Standardized Echocardiography Report. J Am Soc Echocardiogr. 2002;15(3):275-290.
Gorcsan J3rd, Abraham T, Agler DA, et al. Echocardiography for cardiac resynchronization therapy: recommendations for performance and reporting—a report from the American Society of Echocardiography Dyssynchrony Writing Group endorsed by the Heart Rhythm Society. J Am Soc Echocardiogr. 2008;21(3):191-213.
Ho CY, Seidman CE. A contemporary approach to hypertrophic cardiomyopathy. Circulation. 2006;113(24):e858-e862.
Hulot JS, Jouven X, Empana JP, et al. Natural history and risk stratification of arrhythmogenic right ventricular dysplasia/cardiomyopathy. Circulation. 2004;110(14):1879-1884.
Hung J, Lang R, Flachskampf F, et al. 3D echocardiography: a review of the current status and future directions. J Am Soc Echocardiogr. 2007;20(3):213-233.
Isselbacher EM. Thoracic and abdominal aortic aneurysms. Circulation. 2005;111(6):816-828.
Lai WW, Geva T, Shirali GS, et al. Guidelines and standards for performance of a pediatric echocardiogram: a report from the Task Force of the Pediatric Council of the American Society of Echocardiography. J Am Soc Echocardiogr. 2006;19(12):1413-1430.
Landzberg MJ, Ungerleider R. Pediatric cardiology and adult congenital heart disease. J Am Coll Cardiol. 2006;47(11 Suppl):D33-D36.
Lang RM, Bierig M, Devereux RB, et al. Recommendations for chamber quantification: a report from the American Society of Echocardiography’s Guidelines and Standards Committee and the Chamber Quantification Writing Group, developed in conjunction with the European Association of Echocardiography, a branch of the European Society of Cardiology. J Am Soc Echocardiogr. 2005;18(12):1440-1463.
Levine RA, Schwammenthal E. Ischemic mitral regurgitation on the threshold of a solution: from paradoxes to unifying concepts. Circulation. 2005;112(5):745-758.
Little WC, Freeman GL. Pericardial disease. Circulation. 2006;113(12):1622-1632.
Marwick TH. Measurement of strain and strain rate by echocardiography: ready for prime time? J Am Coll Cardiol. 2006;47(7):1313-1327.
Matsuzaki M, Toma Y, Kusukawa R. Clinical applications of transesophageal echocardiography. Circulation. 1990;82(3):709-722.
Milewicz DM, Dietz HC, Miller DC. Treatment of aortic disease in patients with Marfan syndrome. Circulation. 2005;111(11):e150-e157.
Nishimura RA, Holmes DRJr. Clinical practice. Hypertrophic obstructive cardiomyopathy. N Engl J Med. 2004;350(13):1320-1327.
Otto CM. Clinical practice. Evaluation and management of chronic mitral regurgitation. N Engl J Med. 2001;345(10):740-746.
Otto CM. Practice of clinical echocardiography, ed 3. Seattle: Saunders, 2007.
Otto CM. Textbook of clinical echocardiography, ed 3. Seattle: Saunders, 2004.
Perk G, Tunick PA, Kronzon I. Non-Doppler two-dimensional strain imaging by echocardiography—from technical considerations to clinical applications. J Am Soc Echocardiogr. 2007;20(3):234-243.
Quiñones MA, Otto CM, Stoddard M, et al. Recommendations for quantification of Doppler echocardiography: a report from the Doppler Quantification Task Force of the Nomenclature and Standards Committee of the American Society of Echocardiography. J Am Soc Echocardiogr. 2002;15(2):167-184.
Rakowski H, Appleton C, Chan KL, et al. Canadian consensus recommendations for the measurement and reporting of diastolic dysfunction by echocardiography. J Am Soc Echocardiogr. 1996;9:736-760.
Roberts R, Sigwart U. Current concepts of the pathogenesis and treatment of hypertrophic cardiomyopathy. Circulation. 2005;112(2):293-296.
Tsai TT, Nienaber CA, Eagle KA. Acute aortic syndromes. Circulation. 2005;112(24):3802-3813.
Valdes-Cruz LM, Cayre RO. Echocardiographic diagnosis of congenital heart disease: An embryologic and anatomic approach. Philadelphia: Lippincott-Raven, 1999.
Warnes CA. Transposition of the great arteries. Circulation. 2006;114(24):2699-2709.
Weiford BC, Subbarao VD, Mulhern KM. Noncompaction of the ventricular myocardium. Circulation. 2004;109(24):2965-2971.
Weyman AE. Principles and practice of echocardiography. Philadelphia: Lea & Febiger, 1994.
Yoerger DM, Marcus F, Sherrill D, et al. Echocardiographic findings in patients meeting task force criteria for arrhythmogenic right ventricular dysplasia: new insights from the multidisciplinary study of right ventricular dysplasia. J Am Coll Cardiol. 2005;45(6):860-865.
Zile MR, Brutsaert DL. New concepts in diastolic dysfunction and diastolic heart failure: Part 1: Diagnosis. Prognosis, and measurements of diastolic function. Circulation. 2002;105:1387-1393.
Zoghbi WA, Enriquez-Sarano M, Foster E, et al. Recommendations for evaluation of the severity of native valvular regurgitation with two-dimensional and Doppler echocardiography. J Am Soc Echocardiogr. 2003;16(7):777-802.