Chapter 7 Echocardiography
Echocardiography, particularly transesophageal echocardiography (TEE), is an important diagnostic tool in the cardiothoracic intensive care unit (ICU), and it has a broad range of indications (Table 7-1).1 Echocardiography is essential in the assessment of complex hemodynamic instability,2 in the evaluation of suspected endocarditis,3 and to guide cardioversion in patients with atrial fibrillation of more than 2 days’ duration.4 In hemodynamically unstable cardiac surgery patients, TEE reliably identifies the cause of the hypotension, often revealing problems that are unsuspected on the basis of the hemodynamic parameters.5
Table 7-1 Indications for Echocardiography in the ICU
| Assessment of hemodynamic instability |
| Assessment of unexplained respiratory failure |
| Suspected endocarditis |
| Suspected pulmonary embolus |
| Suspected aortic dissection |
| Investigation of a source of embolus |
| Positioning of an intraaortic balloon pump (IABP) or cannulas for mechanical cardiac support |
| Prior to cardioversion in patients with atrial fibrillation of more than 2 days’ duration (TEE only) |
The echocardiographic findings for specific conditions are dealt with in the appropriate sections of the book. In this chapter, the principles, imaging modes, and methods of assessment of cardiac function are reviewed. (Much of the information provided in this chapter is drawn from the short textbook Practical Perioperative Transesophageal Echocardiography.6)
ULTRASOUND MODALITIES
M-mode Imaging
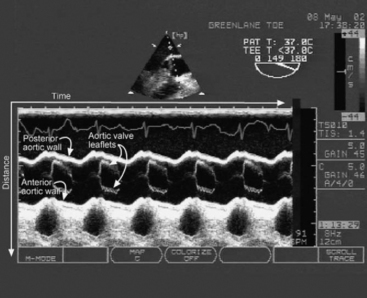
M-mode imaging displays reflected ultrasound waves along a single scan line over time (Fig. 7-1). M-mode imaging has very high depth resolution and is therefore ideal for measuring distances along the scan line (e.g., ventricular wall thickness) and for observing rapidly moving structures (e.g., the motion of the aortic valve).
Doppler Imaging
Spectral Doppler
PW (Fig. 7-2) and CW Doppler (Fig. 7-3) display the velocity of blood along a single scan line over time so are therefore analogous to M-mode imaging. PW Doppler displays the velocity at a specific depth along the scan line (at the level of the operator-adjusted sample volume), whereas CW Doppler records velocities at all depths along the scan line. With appropriate machine settings, CW Doppler can record very high velocities (in excess of 5 m/sec), such as those that occur with mitral regurgitation, without aliasing. In contrast, with PW Doppler the Nyquist limit is typically less than 1.5 m/sec. However, PW Doppler has the advantage of being able to define the velocity at a particular depth. Velocity data obtained from CW and PW Doppler imaging can be used for quantitative measurements of flow and pressure. Tissue Doppler imaging is a modification of PW Doppler in which the velocity of solid tissue is displayed. Motion of the mitral annulus obtained with tissue Doppler imaging can be used to assess diastolic left ventricular function (see later material).
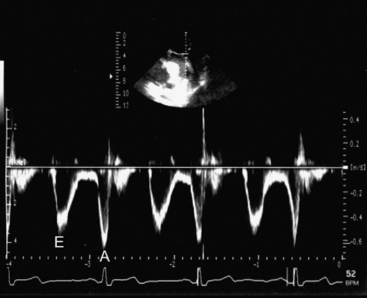
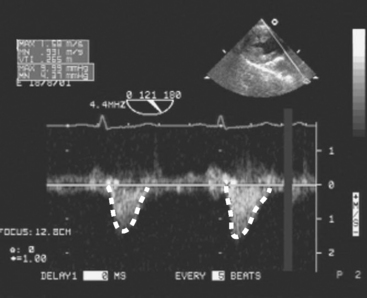
Figure 7.3 CW Doppler imaging. Time is displayed on the horizontal axis and velocity on the vertical axis. In this example, the PW Doppler beam has been directed through the LVOT and shows the velocities all along the scan line throughout the cardiac cycle. Thus, with CW Doppler the velocity profile has a “filled-in” appearance, compared with the “thin line” obtained with PW Doppler (compare this figure with Fig. 7-2). No flow is seen in diastole, indicating the absence of aortic regurgitation. Flow in systole represents left ventricular stroke volume. The outline of the velocity waveform has been traced to provide the VTI. In this example the VTILVOT is 26.5 cm which, assuming an LVOT area of 3.5 cm2, indicates a stroke volume of about 90 ml (see Equation 7-1 and text for details).
(Modified, with permission, from Sidebotham D, Merry A, Legget M: Practical Perioperative Transoesophageal Echocardiography. Fig. 4.27, p. 64. Philadelphia, Butterworth Heinemann, 2003.)
When using spectral Doppler to measure velocity, it is important that the direction of the Doppler beam and the blood flow (or tissue motion) be similar; failure to achieve this similarity results in an underestimation of the blood velocity. As a rule of thumb, if the blood and the Doppler beam are within 20 degrees of each other, the underestimation of velocity is negligible (<6%).
Estimating Flow From Velocity

where VTI is the velocity time integral, the area bounded by the Doppler velocity time curve over one cardiac cycle (see Fig. 7-3). This equation can also be used to estimate valve area, as described later.

STANDARD VIEWS
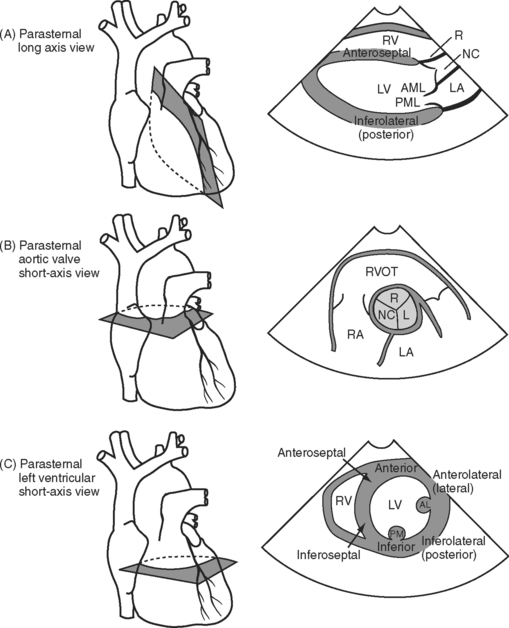
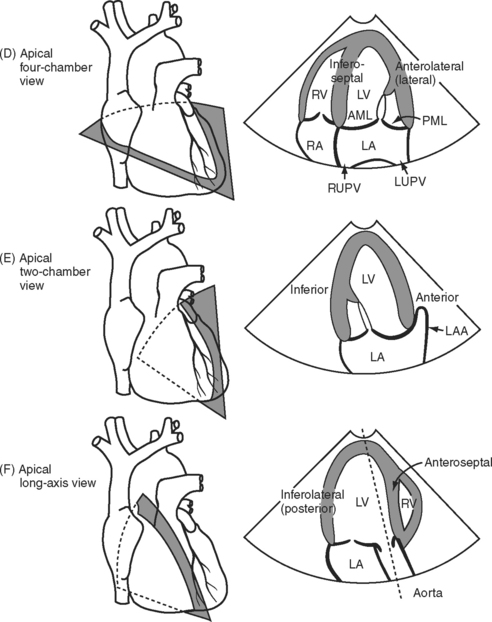
With TTE, imaging is limited by the ribs and sternum and by the proximity of the heart to the surface of the chest wall. With TEE, imaging is limited by the relationship of the esophagus and stomach to the heart and by the interposition of the airways between the esophagus and the great vessels. Thus, for each modality there are limited ranges of scanning planes from which a broad range of standard views can be obtained. For each standard transthoracic view there is usually an analogous transesophageal view.
Three important TTE scanning planes are the parasternal, apical, and subcostal windows (Fig. 7-4). For parasternal imaging, the patient should be in the left lateral decubitus position and the transducer placed in the third, fourth, or fifth intercostal space, just to the left of the sternum, depending on which view is sought. For apical imaging, the patient should also be in the left lateral decubitus position and the transducer should be placed over the apical impulse (usually the fifth intercostal space, midaxillary line). For subcostal imaging, the patient should be supine, with the transducer positioned to the left of the xiphoid process. Bending the patient’s knees may relax the abdominal muscles and improve imaging. Subcostal imaging may provide superior views to parasternal and apical imaging in ventilated patients, and it has the advantage of not requiring the respositioning of the patient. In all scanning planes, changing the position, angulation, or rotation of the transducer alters the image plane.
With TEE, two important scanning planes are the midesophageal window (tip of transducer 30 to 40 cm from the lips) and the transgastric window (tip of transducer 40 to 50 cm from the lips) (Fig. 7-5). The image is adjusted by manipulating the tip of the TEE transducer. These manipulations involve flexing and retroflexing the tip of the probe, advancing and withdrawing the probe, and rotating the orientation of the sector scan between the horizontal (0 degrees), vertical (90 degrees), and reverse horizontal (180 degrees) imaging planes.
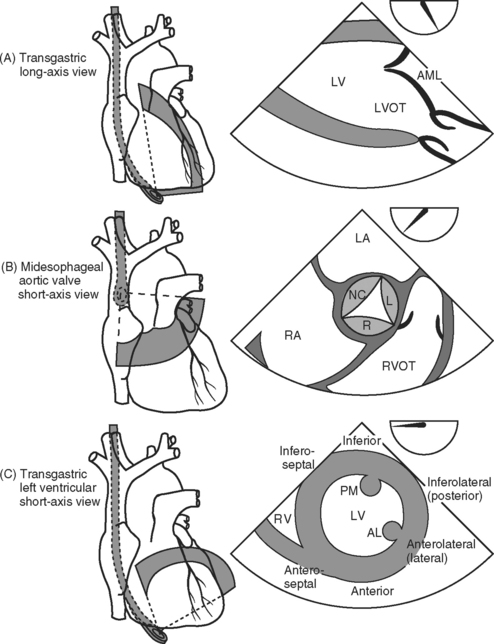
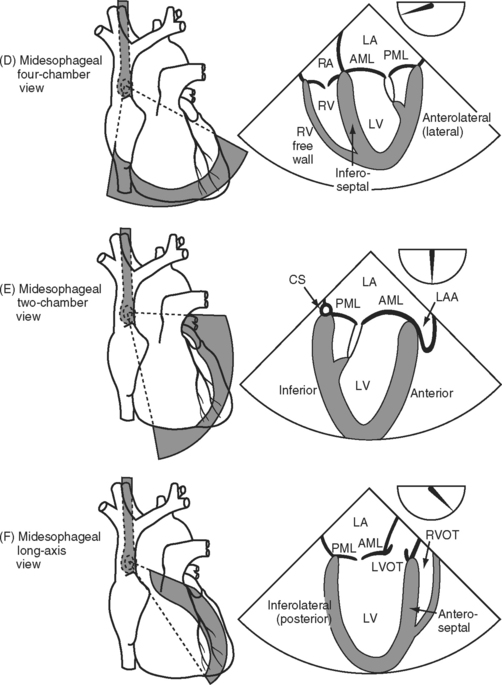
Figure 7.5 A-F, Selected transesophageal views. The views shown are analogous to the transthoracic views shown in Fig. 7-4A-F. The rotation of the sector scan between 0 degrees and 180 degrees is shown in the top right of each image. AL, anterolateral papillary muscle; AML, anterior mitral leaflet; CS, coronary sinus; L, left coronary cusp; LA, left atrium; LAA, left atrial appendage; LV, left ventricle; LVOT, left ventricular outflow tract; PM, posteromedial; RVOT, right ventricular outflow tract.
ASSESSMENT OF SYSTOLIC LEFT VENTRICULAR FUNCTION
Echocardiographic evaluation of left ventricular function should include assessment of ventricular dimensions, wall thickness, volume status, and systolic and regional function.
Ventricular Dimensions and Preload
Left ventricular chamber size depends on systolic function, diastolic function, and preload. Left ventricular diameter may be evaluated rapidly in a short-axis view (see Figs. 7-4C and 7-5C) with 2D or M-mode imaging. In patients with chronic volume overload, end-systolic and end-diastolic diameters can be used to guide the timing of surgery for patients with mitral and aortic regurgitation.
End-diastolic area (EDA) obtained from a left ventricular short-axis view (see Figs. 7-4C and 7-5C) is a surrogate for end-diastolic volume (EDV) and can therefore be used as a guide to preload. However, because EDA and EDV are dependent on ventricular function, changes in these parameters are more useful than absolute values. There is no threshold value for EDA that predicts fluid responsiveness.7 In patients with normal ventricular function who are euvolemic, EDA is normally 8 to 12 cm2 (excluding the papillary muscles from the trace). However, in patients with chronic left ventricular dilatation, a much higher EDA may be required to optimize preload. In contrast, a patient with severe diastolic dysfunction may develop pulmonary edema at a much lower EDA. The echocardiographic findings in hypovolemia are discussed in Chapter 20.
Increased left ventricular wall thickness may occur secondary to chronic pressure or volume overload. The upper limit for left ventricular wall thickness, with M-mode imaging through the posterior left ventricular wall at end-diastole, is 1.2 cm for males and 1.1 cm for females. Localized hypertrophy of the anterior septum is sometimes seen (e.g., in hypertensive elderly females) and is a risk factor for dynamic LVOT obstruction (see later material).
Global Systolic Performance
Systolic function may be quantitatively assessed by calculation of the left ventricular ejection fraction (see Chapter 1, Equation 2). The normal range is 55% to 75%. The calculation is performed from end-systolic and end-diastolic frames obtained from the two- and four-chamber views. With TEE, calculation of ejection fraction may be unreliable because of ventricular foreshortening. Ejection fraction is relatively independent of preload but is sensitive to alterations in afterload.
As an alternative to ejection fraction, the fractional area change (FAC) may be calculated; it is the proportional change in the area of the left ventricle in short axis (see Figs. 7-4C and 7-5C):

Conditions such as vasodilation, inotropic stimulation, mitral regurgitation, and hypovolemia tend to flatter ejection fraction and fractional area change and must be considered when evaluating systolic function. Inotropic stimulation, in particular, is common in the ICU; it imparts a “jerky” or “snappy” quality to systolic contraction. Left ventricular systolic function is also influenced by conditions such as right ventricular dysfunction and pericardial tamponade (see Chapter 20).
Regional Left Ventricular Function
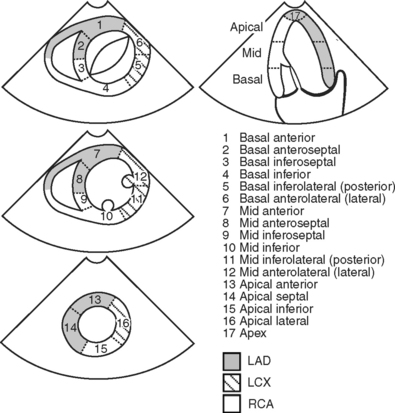
Based on the anatomy of the blood supply to the heart and the standard image planes, the left ventricle can be divided into segments (Fig. 7-6). Within each segment, wall motion is graded as normal, hypokinetic, akinetic, or dyskinetic on the basis of endocardial movement and thickening. Abnormal wall motion is termed a segmental wall motion abnormality (SWMA). SWMAs are caused by a variety of factors, including:
If an SWMA is discovered during an echocardiogram, it is important to try to determine the cause. In particular, it is important to distinguish SWMAs due to acute ischemia from those due to other causes. This may be difficult. Comparison with the previous echocardiograms (preoperative, intraoperative) is invaluable. The following characteristics are useful clues:
Collectively, ischemic, hibernating, and stunned myocardium is termed viable myocardium (see Chapter 1). The three conditions may be distinguished by means of a myocardial viability study (see Chapter 5).
Measurement of Cardiac Output
Stroke volume can be estimated by using Equation 7-1 and using a combination of 2D and Doppler imaging. A common site for measurement of stroke volume is the LVOT. The LVOT area is calculated from the LVOT diameter (area = π (d/2)2), which can be obtained from an appropriate 2D image (e.g., Fig. 7-4A). The VTI can be obtained by PW Doppler from an appropriate view (e.g., Fig. 7-4F). Although stroke volume may be estimated with TTE and TEE, in practice, consistent views for the estimation of the VTILVOT are difficult to obtain with TEE. Also, in critically unwell patients, echocardiography is poorly suited for on-going measurements of cardiac output. The relationship between cardiac output and ejection fraction is discussed in Chapter 1.
Diastolic Function
Two-Dimensional Imaging
2D imaging may demonstrate a specific diagnosis that is associated with diastolic dysfunction, such as aortic stenosis or hypertrophic obstructive cardiomyopathy. Nonspecific signs such as left ventricular hypertrophy and distended left atrium may also be present. As a simple rule of thumb, a left atrial area (end-diastole, apical four-chamber view) in square centimeters that is greater than 10 times the patient’s body surface area in square meters (e.g., left atrial area of 20 cm2 in a patient with a body surface area of 1.6 m2) indicates enlargement. Left atrial hypertension is also associated with a “tense” left atrium and abnormal bowing of the interatrial septum. Normally the interatrial septum bulges from left to right, with a brief reversal in midsystole; with high left-atrial pressure, the septum bulges from left to right throughout the cardiac cycle.
Doppler Imaging
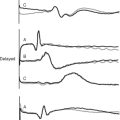
Information on left ventricular diastolic function may be obtained by examining various spectral Doppler waveforms. Two that are widely used are the transmitral and pulmonary venous PW Doppler profiles (Fig. 7-7). Three abnormalities are recognized: (1) impaired relaxation; (2) pseudonormal filling; (3) restrictive filling (see Fig. 7-7). Mild forms of diastolic dysfunction typically demonstrate impaired relaxation. As diastolic dysfunction becomes more advanced, a pseudonormal pattern develops, then a restrictive pattern. However, many other factors affect these waveforms, including age, preload, heart rate, mitral regurgitation, and the position of the sample volume. Tissue Doppler imaging of mitral annular motion is also used to assess diastolic function and appears to be less influenced by these factors. Also, mitral annular tissue Doppler imaging does not show a biphasic response with progressive disease (see Fig. 7-7). However, all Doppler indexes of diastolic function are difficult to interpret and have not been well validated in critically ill patients.
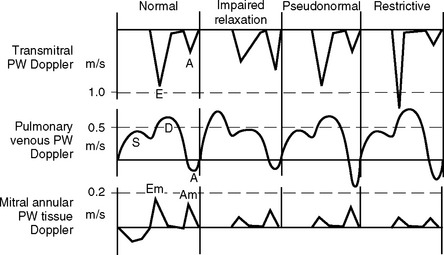
Figure 7.7 Doppler waveforms and diastolic dysfunction. The transmitral, pulmonary venous, and mitral annular tissue PW Doppler waveforms that occur normally and with diastolic dysfunction are shown. The directions of flow are those obtained with TEE imaging. Three patterns of abnormal diastolic function are recognized: impaired relaxation, pseudonormal, and restrictive filling (see text for details). The normal transmitral waveform is described in Figure 7-2. With pulmonary venous PW Doppler imaging, the sample volume is placed 0.5 to 1 cm inside a pulmonary vein. Flow is toward the transducer during systole (S) and diastole (D) and therefore is displayed above the baseline. There is brief reversal of flow (away from the transducer) in late diastole due to atrial (A) systole. With mitral annular tissue Doppler imaging, the sample volume is positioned within the mitral annulus. During diastole the annulus moves toward the probe and therefore the waveform is displayed above the baseline. Two diastolic waveforms, Em and Am, occur that are analogous to the transmitral E and A waves but are of lower velocity and move in the opposite direction.
(Modified, with permission, from Sidebotham D, Merry A, Legget M: Practical Perioperative Transoesophageal Echocardiography. Fig. 8.2, p. 123. Philadelphia, Butterworth Heinemann, 2003.)
A number of Doppler indexes of increased left atrial pressure are in use but many are difficult to obtain reliably and interpret with confidence. One indicator that has gained widespread acceptance involves comparing the height of the transmitral E wave (PW Doppler) to the mitral annular Em wave (tissue Doppler). An E/Em ratio greater than 15 indicates raised left atrial pressure (<15 mmHg), whereas an E/Em ratio less than 8 indicates normal left atrial pressure.8 In clinical ICU practice, left atrial pressure is more easily inferred from a pulmonary artery catheter.
MITRAL VALVE
The mitral annulus is a saddle-shaped structure that has a high short axis and a low long axis (Fig. 7-8). There are two leaflets: a broad anterior leaflet and a thin posterior leaflet. Each leaflet is divided into segments and is supported by the two papillary muscles (Fig. 7-9). With TTE, the mitral valve is evaluated in the parasternal long-axis view, the apical four-chamber view, the apical two-chamber view, and the apical long-axis view (see Fig. 7-4A, D, E, and F). With TEE, the mitral valve is evaluated in the midesophageal view, the four-chamber view, the two-chamber view, and the long-axis view (see Fig. 7-5D, E, and F). The two common reasons for mitral valve examination in the ICU are to grade the severity of mitral regurgitation and to assess suspected endocarditis.
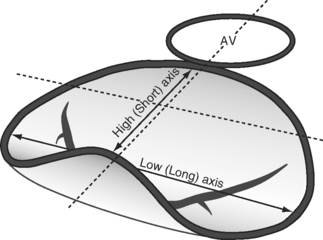
Figure 7.8 The shape of the mitral annulus. The annulus is saddle-shaped; the high (short) axis is imaged in the midesophageal long axis view (see Fig. 7-4F and Fig. 7-5F), and these views should be used to evaluate the presence of mitral valve prolapse.
(Reproduced, with permission, from Sidebotham D, Merry A, Legget M: Practical Perioperative Transoesophageal Echocardiography, 2003. Fig. 9.2, p. 132. Philadelphia, Butterworth Heinemann, 2003.)
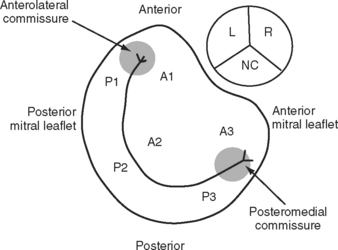
(Adapted, with permission, from Sidebotham D, Merry A, Legget M: Practical Perioperative Transoesophageal Echocardiography. Figs. 9.3 and 9.4, p. 133. Philadelphia, Butterworth Heinemann, 2003.)
Mitral Regurgitation
The causes of mitral regurgitation include:
Ventricular Dysfunction
With ventricular dysfunction, leaflet morphology is usually normal, but leaflet motion is restricted due to tethering of the leaflets and papillary muscles secondary to dilatation of the underlying myocardium. The regurgitant jet is often central but if it is eccentric, it is directed toward the most affected side (Fig. 7-10). The short axis of the mitral annulus is typically dilated (>3.6 cm at end-diastole in a midesophageal long-axis view; see Figs. 7-4A and 7-5F). Left ventricular function is impaired. Mitral regurgitation that occurs in the acute period following a myocardial infarction may resolve spontaneously as stunned myocardium recovers. The abrupt onset of torrential mitral regurgitation within the first week after a myocardial infarction suggests papillary muscle rupture. Chronic progressive mitral regurgitation can occur due to ventricular remodeling following a myocardial infarction.
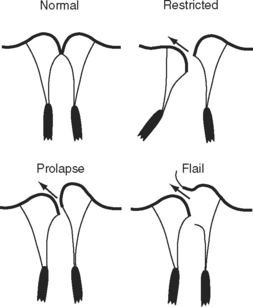
Leaflet Prolapse and Flail
Excessive leaflet motion may occur in the form of prolapse or flail (see Fig. 7-10). In prolapse, the body of the leaflet lies above the annular plane but the leaflet tip “points” to the ventricle. In flail, the tip of the leaflet lies above the annular plane and “points” to the atrium. In both conditions, the jet is directed away from the affected side. Prolapse should be assessed by imaging across the high mitral annular plane (see Fig. 7-8), that is, in a midesophageal long-axis view.
Leaflet prolapse of severity sufficient to cause important mitral regurgitation typically occurs in the context of myxomatous mitral valve disease (see Fig. 10-6). Mitral regurgitation is usually slowly progressive. The mitral leaflets and chordae are thickened and elongated. A leaflet flail is usually due to a torn chorda, which can occur with myxomatous disease and endocarditis and, occasionally, in an otherwise normal valve. The development of a flail segment is usually associated with abrupt worsening of mitral regurgitation. Torn chordae may be seen flicking within the left atrium.
Mitral Valve Infective Endocarditis
Endocarditis is associated with the thickening, deformity, and destruction of the mitral valve leaflets and with vegetations (Fig. 7-11; see Chapter 35). Vegetations typically develop on the upstream (atrial) surface of the valve. Significant mitral regurgitation is common and indicates the need for surgery.
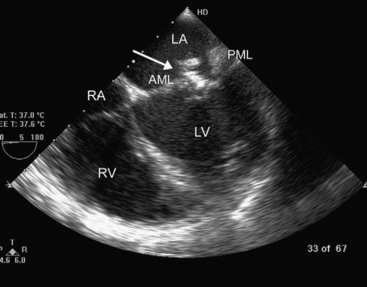
Figure 7.11 Mitral valve endocarditis. In this midesophageal four-chamber view (see Fig. 7-5D), a large, heterogeneous, highly echogenic mass (arrow) can be seen. With real-time imaging, this mass was identified as being attached to the atrial surface of the AML. The PML is also thickened. These appearances can be confused with myxomatous mitral valve disease (see Fig. 10.6). AML, anterior mitral leaflet; LA, left atrium; LV, left ventricle; PML, posterior mitral leaflet; RA, right ventricle; RV, right atrium.
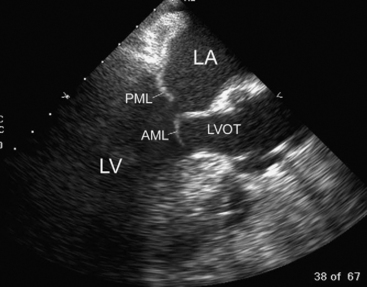
Systolic Anterior Motion
Systolic anterior motion (see Chapter 20), also known as dynamic LVOT obstruction, refers to displacement of the anterior mitral leaflet into the LVOT during systole (Fig. 7-12). Systolic anterior motion typically occurs following mitral valve repair and in patients with marked hypertrophy of the basal anterior septum. The condition is exacerbated by hypovolemia, vasodilatation, and inotropic stimulation. The echocardiographic features depend on the cause but include:
Prosthetic Mitral Valve Dysfunction
Degeneration of a stented tissue (bioprosthetic) mitral valve (see Chapter 10) usually involves calcification and destruction of the valve leaflets, leading to transvalvular regurgitation (inside the sewing ring). Rarely, paravalvular (outside the sewing ring) regurgitation may occur due to partial dehiscence of the prosthesis. Severe dehiscence results in a rocking motion of the valve. In contrast, regurgitation of a mechanical valve virtually always involves paravalvular regurgitation. Stenosis of prosthetic valves also occurs, usually related to calcification of bioprosthetic valves or secondary to infection, thrombus, or fibrous overgrowth (pannus) on the valve.
Grading Mitral Regurgitation
A number of grading systems are used to assess the severity of mitral regurgitation. Two useful methods are estimation of the width of the vena contracta (the narrowest part of the jet, just distal to the orifice) using color-flow Doppler and evaluation of the maximal jet area (Table 7-2). The dimension of the regurgitant jet is reduced with hypovolemia, mechanical ventilation, left ventricular dysfunction, and a reduction in afterload (such as occurs with deep sedation). These factors must be considered when grading the severity of mitral regurgitation.
Table 7-2 Grading of Mitral Regurgitation Using Color-flow Doppler Based on TEE Assessment in the Midesophageal Long-axis View
| Severity | Width of Vena Contracta (mm) | Maximal Jet Area as a Percentage of Left Atrial Area |
|---|---|---|
| Mild | 2-4 | < 20 |
| Moderate | 4-6 | 20-40 |
| Usually severe | >6 | > 40 |
| Always severe | ≥ 10 |
TEE, transesophageal echocardiography
(From Sidebotham D, Merry A, Legget M: Practical Perioperative Transoesophageal Echocardiography, p. Philadelphia, Butterworth Heinemann, 2003.)
THE AORTIC VALVE AND AORTA
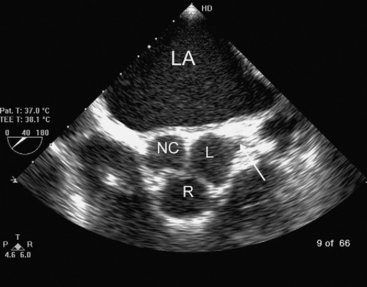
The aortic valve is normally trileaflet, consisting of left, right, and noncoronary cusps (Fig. 7-13). Behind each leaflet is the respective sinus of Valsalva, with the coronary arteries arising from the left and right sinuses. The normal diameter of the aortic annulus and LVOT is less than 2.6 cm; the normal diameter of the ascending aorta is less than 3.4 cm. The aortic valve may be imaged in short- and long-axis views (see Fig. 7-4A and B, and Fig. 7-5B and F). Good Doppler alignment through the aortic valve and LVOT is usually possible with TTE from the apical long-axis view; alignment is unreliable with TEE.
Aortic Stenosis
Peak and mean aortic valve gradients (using Equation 7-2) may be estimated from CW Doppler imaging through the aortic valve. Aortic valve area (AVA) area may be calculated by using a Doppler technique known as the continuity equation: VTIs are obtained across the aortic valve (VTIAV) and from a second site, usually the LVOT (VTILVOT). The CSA at the second site (CSALVOT) is measured with 2D imaging. Flow at the two sites is equal, so from Equation 7-1:


Based on the transvalvular pressure gradient and the calculated aortic valve area, aortic stenosis is graded as mild moderate, severe, or critical (see Table 10-2). Although transvalvular pressure gradients are dependent on cardiac output (a low cardiac output reduces the gradient across the valve), valve areas calculated from the continuity equation are largely independent of cardiac output.
Aortic Regurgitation
The causes of aortic regurgitation are described in Chapter 10. Acute aortic regurgitation is commonly due to:
The echocardiographic features of aortic endocarditis include leaflet thickening and destruction, transvalvular regurgitation, vegetations, and abscess formation (Fig. 7-14). Vegetations typically attach to the downstream (LVOT) aspect of the valve and may oscillate back and forth through the valve orifice in time with the cardiac cycle. Regurgitation through bioprosthetic (tissue) aortic valve is usually due to endocarditis or chronic degeneration and is typically transvalvular. Occasionally, dehiscence of the sewing ring occurs, which results in paravalvular regurgitation. Mechanical aortic valves rarely malfunction but can occasionally dehisce and cause paravalvular regurgitation.
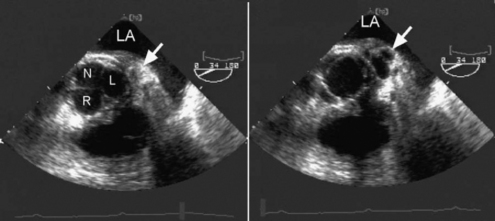
(Reproduced, with permission, from Sidebotham D, Merry A, Legget M: Practical Perioperative Transoesophageal Echocardiography. Fig. 10.8 a and b, p. 169. Philadelphia, Butterworth Heinemann, 2003.)
The severity of aortic regurgitation may be graded on the basis of the dimensions of the jet as seen on color-flow Doppler and the velocity profile in the descending thoracic aorta as seen on PW Doppler. Some of the indexes of severe aortic regurgitation are listed in Table 7-3.
Table 7-3 Echocardiographic Signs of Severe Aortic Regurgitation
| Color-flow Doppler |
| Area of regurgitant jet >60% of LVOT area in the aortic valve, short-axis view |
| Jet width >40% of LVOT diameter in the aortic valve, long-axis view |
| Jet length extending beyond the insertion of the papillary muscles in the aortic valve, long-axis view |
| Spectral Doppler |
| Holodiastolic flow reversal in the descending thoracic aorta |
LVOT, left ventricular outflow tract.
(From Sidebotham D, Merry A, Legget M: Practical Perioperative Transoesophageal Echocardiography, p. Philadelphia, Butterworth Heinemann, 2003.)
RIGHT VENTRICLE
Assessment of the right ventricle includes an evaluation of right ventricular size, its contractility, the shape and motion of the atrial and ventricular septa, and the degree of tricuspid regurgitation. The right ventricle is a highly compliant, thin-walled structure that undergoes major changes in size in response to volume status and as a consequence of chronic dysfunction (pressure overload, volume overload, reduced contractility). In a four-chamber view (see Fig. 7-4D and Fig. 7-5D), the apex of the right ventricle normally extends two-thirds of the way to the apex of the heart. Extension of the right ventricle to the apex indicates moderate dilatation; extension beyond the apex indicates severe dilatation.
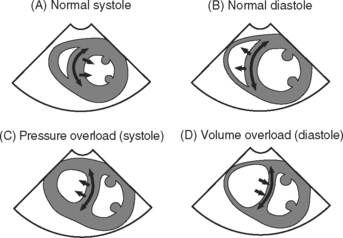
The interventricular septum is normally curved toward the right ventricle in both systole and diastole and moves toward the left ventricle in systole and the right ventricle in diastole (Fig. 7-15). With right ventricular volume and pressure overload, characteristic abnormalities of the shape and motion of the interventricular septum are recognized. With right ventricular dysfunction, right atrial pressure is typically elevated, which results in abnormal leftward bowing of the interatrial septum.
Velocity of the Tricuspid Regurgitant Jet: Pulmonary Artery Pressure
The velocity of the tricuspid regurgitant jet is dependent on the pressure gradient between the right atrium and right ventricle. Assuming no pulmonary valve stenosis is present (i.e., systolic right ventricular pressure equals pulmonary artery systolic pressure), the velocity of the tricuspid regurgitant jet can be used to calculate pulmonary artery systolic pressure using an application of the simplified Bernoulli equation (see Equation 7-2):

AORTIC, PLEURAL, AND PERICARDIAL SPACES
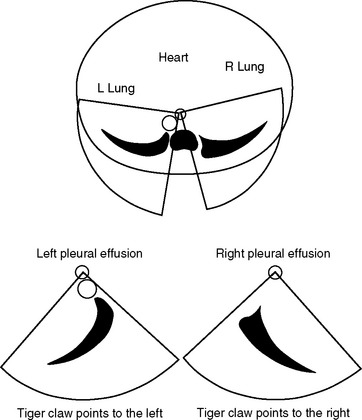
Large pleural effusions are easily seen with TEE. A left-sided effusion is seen as a crescent-shaped, echo-free space below the descending aorta that points to the left. A right-sided effusion is seen as a crescent-shaped, echo-free space to the right of the right atrium and ventricle that points to the right (Fig. 7-16). The echocardiographic appearances of pericardial fluid are described in Chapter 20.
1 Heidenreich PA. Transesophageal echocardiography (TEE) in the critical care patient. Cardiol Clin. 2000;18:789-805.
2 Heidenreich PA, Stainback RF, Redberg RF, et al. Transesophageal echocardiography predicts mortality in critically ill patients with unexplained hypotension. J Am Coll Cardiol. 1995;26:152-158.
3 Fowler VGJr, Li J, Corey GR, et al. Role of echocardiography in evaluation of patients with Staphylococcus aureus bacteremia: experience in 103 patients. J Am Coll Cardiol. 1997;30:1072-1708.
4 Klein AL, Grimm RA, Murray RD, et al. Use of transesophageal echocardiography to guide cardioversion in patients with atrial fibrillation. N Engl J Med. 2001;344:1411-1420.
5 Reichert CL, Visser CA, Koolen JJ, et al. Transesophageal echocardiography in hypotensive patients after cardiac operations: comparison with hemodynamic parameters. J Thorac Cardiovasc Surg. 1992;104:321-326.
6 Sidebotham D, Merry A, Legget M. Practical Perioperative Transoesophageal. In: Echocardiography. Philadelphia: Butterworth Heinemann; 2003.
7 Tousignant CP, Walsh F, Mazer CD. The use of transesophageal echocardiography for preload assessment in critically ill patients. Anesth Analges. 2000;90:351-355.
8 Ommen SR, Nishimura RA, Appleton CP, et al. Clinical utility of Doppler echocardiography and tissue Doppler imaging in the estimation of left ventricular filling pressures: a comparative simultaneous Doppler-catheterization study. Circulation. 2000;102:1788-1794.