Chapter 77 Disorders of Intracranial Pressure
Introduction
The most robust evidence for the contribution of intracranial hypertension to neurologic injury in children is provided by studies of outcomes following severe traumatic brain injury (TBI). Numerous studies involving pediatric patients have demonstrated an association between intracranial hypertension and neurologic morbidity or survival [Shapiro and Marmarou, 1982; Taylor et al., 2001; Jagannathan et al., 2008, 2007].
Acute increases in intracranial pressure (ICP) may represent a medical emergency, but there is a dearth of data in children on the thresholds for treatment, evidence that continuous monitoring of ICP improves outcome, or consensus on the best means to calculate a “dose” of pathologic ICP. Current treatment recommendations for children with intracranial hypertension [Adelson et al., 2003a] recommend intervention for ICP ≥20 mmHg, but there are insufficient data to recommend a treatment guideline. Additional challenges for the recognition and management of increased ICP in children include both the heterogeneous causes (Box 77-1) and age-dependent changes in ICP, which are not well understood. This chapter will review basic pathophysiological principles, recent trends in developing new tools to interpret ICP [Chambers et al., 2006], the relation of ICP to autoregulation [Brady et al., 2009; Udomphorn et al., 2008], and management of intracranial hypertension [Orliaguet et al., 2008; Guerguerian et al., 2009; Adelson et al., 2005].


Normal Intracranial Pressure
The normal value for ICP in newborns is approximately 82 mm H2O, or 6 mmHg [Welch, 1980]. It rises gradually from 82–176 mm H2O in 1- to 7-year-olds to 136–204 mm H2O in adolescents. In contrast, a recent prospective study of cerebrospinal fluid (CSF) opening pressure in 472 children undergoing diagnostic lumbar puncture showed no association of opening pressure with age [Avery et al., 2010]. These data suggest that the commonly accepted upper limit of “normal” opening pressure of 200 mm of water should be increased to 280 mm, and that this value increases with depth of sedation, and with greater body mass index. Notably, the threshold for abnormally low opening pressure (subjects in the 10th percentile) was 115 mm of water.
Minor fluctuations in the physiologic ICP occur with heartbeats, breathing, the Valsalva maneuver, and rapid eye movement sleep. Brief, sharp increases of up to 1000 mm H2O may occur transiently during sneezing and coughing. The normal brain is capable of adapting to these transient changes. In the first 3 years of life, subacute or chronically elevated ICP leads to the separation of cranial sutures, followed by excessive cranial enlargement. Serial measurements of head circumference that are plotted on an appropriate growth chart are a useful index against which to measure subacute or chronically elevated ICP in infancy and early childhood. The normal rate of growth of head circumference in infants born at full term is 2 cm per month for the first 3 months, 1 cm per month for the next 3 months, and 0.5 cm per month for the subsequent 3 months [Bray et al., 1969].
Pathophysiology of Raised Intracranial Pressure
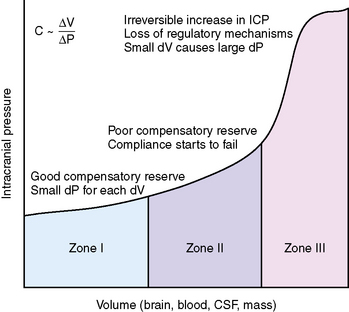
The skull is a rigid cavity and its contents are relatively noncompressible, consisting of the brain parenchyma, intravascular blood, and CSF. Expansion in the volume of one component can be offset by a decrease in the volume of the others (Monroe–Kellie doctrine) [Monroe, 1783; Kellie, 1824]. For example, an increase in the volume of the brain parenchyma because of a neoplasm is compensated for by the expression of CSF out of the brain compartment into the spinal subarachnoid space and a decrease in blood volume because of compression of the dural venous sinuses. When the reserve of each compartment to accommodate increases in volume is exhausted, the slope of the pressure–volume relationship becomes hyperbolic, and small increases in volumes cause large increases in ICP (Figure 77-1).
Compliance Changes with Age
The pressure–volume relationships in the brain are expressed by the equation C ~ dV/dp, where C represents compliance and dV represents the change in volume that accompanies a change in pressure (dp) [Ryder et al., 1933]. Compliance is the ability of the brain to accommodate increases in intracranial volume without changes in ICP. As ICP rises, compliance decreases. In the healthy brain, compliance is along the horizontal segment of the curve, whereas in a damaged, swollen brain, compliance is located along the vertical segment of the curve.
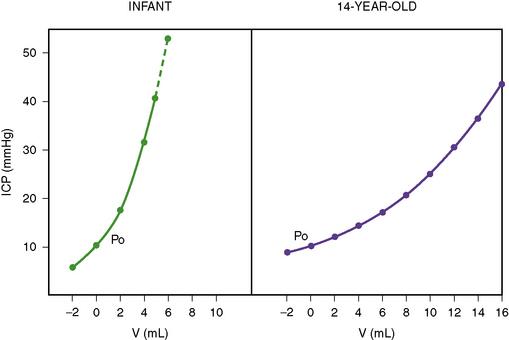
The Monroe–Kellie doctrine is not as consistently applicable to infants as it is to adults [Wiegand and Richards, 2007]. In the developing brain, space-occupying lesions can expand locally in the relatively pliable, unmyelinated brain, exerting localized pressures that are not uniformly transmitted to the entire brain. The cranial cavity is not a rigid container in infants, as it can continue to enlarge by separation of the cranial sutures. The overall slope of the pressure–volume curve is steeper in infancy than in older children (Figure 77-2). An increase in intracranial volume by 10 mL is not likely to cause as much of an increase in ICP in an adolescent as in an infant [Beaumont et al., 2001]. This steeper volume–pressure curve persists in infancy until the point of separation of the cranial sutures. Thereafter, the infant’s cranial cavity is able to accommodate relatively more volume than is the adult skull.
Effects of Intracranial Hypertension on Cerebral Perfusion
The first study without sedation of normal cerebral blood flow (CBF) in childhood was published in 1957 [Kennedy and Sokoloff, 1957] and used femoral artery and jugular vein cannulation with nitrous oxide inhalation and serial arterial blood gas sampling to derive CBF. The mean CBF (106.4 ± 3.3 mL/100 g/min) in the 9 subjects (ages 3–11 years) was significantly higher (p <0.001) than that measured in a group of 12 adults (60.1 ± 2.6) under the same conditions. Ethical considerations have limited subsequent studies in healthy children using such invasive procedures. Noninvasive ways of measuring cerebral blood flow volume (CBFV, measured in ml/min) to estimate CBF (i.e., adjusting CBFV data for the mean brain weight of each age range) also suggest decreasing rates of CBF from ages 3 (approximately 60), to 18 (approximately 50 mL/100 g/min) years following a transient increase at age 6 approximately 70 [Schöning and Hartig, 1996]. After a peak at approximately 6 years of age, values decrease before reaching adult values by age 19 [Chiron et al., 1992]. Increased ICP reduces CBF. This relation between ICP and blood flow is a function of changes in systolic (S) and diastolic (D) arterial pressure (AP) expressed as: CPP = MAP – ICP, or CPP = [(SAP + 2DAP)/3] – ICP (CPP, cerebral perfusion pressure; MAP, mean arterial pressure) [White and Venkatesh, 2008].
Cerebral Autoregulation
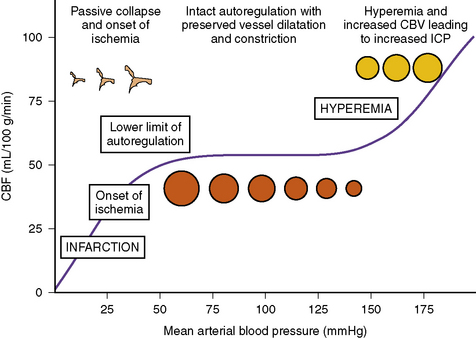
CPP reflects the vascular pressure gradient across the cerebral beds, and is determined by both the CPP and cerebrovascular resistance (CVR), according to the formula CBF = CPP/CVR [Harper, 1965]. Under normal conditions, CBF can be maintained as a constant of approximately 50 mL/100 g/minute over a wide range (60–150 mmHg in the healthy brain) of CPP [Steiner and Andrews, 2006; Cunningham et al., 2005] (Figure 77-3). When autoregulation is preserved, increasing blood pressure leads to a progressive compensatory decrease in the caliber of cerebral resistance, thereby maintaining a constant CBF by increasing CVR [Fog, 1938]. As CVR increases, cerebral blood volume decreases and ICP falls, if autoregulation is intact [Ursino and Di Giammarco, 1991]. When CPP falls below the lower limit of autoregulation (LLA) (40–50 mmHg), CBF decreases as the autoregulatory reserve is exhausted [Lassen, 1959], and the system becomes pressure-passive. The severity of the resulting ischemic injury will depend on the degree and duration of decreased CBF, with ischemic injury beginning at approximately 18–20 mL/100 g/min [Astrup et al., 1981; Zauner et al., 2002]. Conversely, when compliance is impaired and shifted to the steep segment of the pressure-volume curve, autoregulation is also impaired, and even minor increases in CBF – for example, because of hypercarbia, use of pressors, or fluid boluses – can lead to hyperemia and significant rises in ICP.
Effects of Intracranial Hypertension on Autoregulation
Autoregulation of CBF in healthy adults is constant, between a CPP of 50 and 150 mmHg or a MAP of 60 and 160 mmHg [Paulson et al., 1990]. Under these conditions, changes in CPP or MAP have little effect on CBF. Autoregulation is compromised following TBI, and maintaining adequate CPP to overcome the effects of increased ICP is a cornerstone of medical management in the algorithms for treatment of TBI in adults [Brain Trauma Foundation, 2007]. In adults, the incidence of impaired cerebral autoregulation increased with the severity of injury, reaching 67 percent after severe TBI [Sahuquillo et al., 1998]. A similar relation is seen following pediatric TBI, ranging from 17 percent after mild injuries, up to 42 percent after severe injuries [Zauner et al., 2002; Paulson et al., 1990; Brain Trauma Foundation, 2007; Sahuquillo et al., 1998; Vavilala et al., 2004, 2007]. Following TBI, autoregulation may be compromised either unilaterally or bilaterally [Vavilala et al., 2008], and minimally or completely, and may occur without radiographic evidence of injury [Udomphorn et al., 2008]. Following severe TBI, dysfunction of autoregulation may worsen over 9 days following the insult [Tontisirin et al., 2007].
The LLA of CBF is the CPP at which vascular reactivity fails and CBF cannot be maintained despite arterial hypotension (see Figure 77-3). As CPP decreases below the LLA, the relation of CBF to CPP is passive and CBF falls linearly with CPP. The relationship of ICP to changes in the LLA is not well understood. In an atraumatic piglet model of increased ICP, increases in ICP up to 40 mmHg resulted in an increase of LLA from 29.8 mmHg in the naive animals up to 51.4 mmHg in the severe ICP group [Brady et al., 2009]. If this relation is shown to occur in children with intracranial hypertension, this implies, first, that monitoring autoregulation should be included in the management of these patients, and second, that treating acute increases in ICP with an equal increase in arterial blood pressure may be insufficient to maintain CBF as the LLA increases with increased ICP.
Loss of Autoregulation Leading to Brain Tamponade
CBF is thought to be mostly regulated at the level of precapillary cerebral resistance by a combination of glial, neurogenic, myogenic, and metabolic mechanisms [Iadecola and Nedergaard, 2007]. In 1938, Fog first reported changes in pial arteries in anesthetized cats in response to changes in blood pressure [Fog, 1938], describing a contraction of the pial vessels produced by a rise in systemic pressure, and a dilatation produced by a fall in pressure. Fog proposed that the mechanism responsible for such autoregulation was the properties inherent to the smooth muscle of the arterial wall. The relative contributions of the components of the arterial, venous, myogenic, neuronal, and glial components of the autoregulatory process are not fully understood.
As proposed by Rosner, the vasodilatory cascade theory postulates that the increase in ICP leads to a vasodilatory response [Rosner, 1986]. The resulting increase in cerebral blood volume produces an increase in vascular compliance. That is, during each cardiac cycle there is increased accommodation for blood volume within the cerebral vasculature. In parallel, intracranial compliance is decreased. In this way cerebral autoregulation is sustained by a combination of increased cerebrovascular, and decreased intracranial, compliance. When the increase in cerebral blood volume is greater than intracranial compliance can accommodate, autoregulation fails. At this point, during each cardiac cycle there is no reserve capacity in the cerebral vascular bed to accommodate variations in arterial blood volume during the cardiac cycle. As a result, CBF decreases and intracranial circulation fails, resulting in a condition of “brain tamponade.” This is the endpoint at which ICP values increase close to those of the arterial blood pressure, resulting in the absence of net flow.
Intracranial Pressure Monitoring
History
ICP measurements were first reported in patients with a variety of intracranial lesions by Guillaume and Janny in 1951, using an electromagnetic transducer to measure ventricular fluid pressure signals [Guillaume and Janny, 1951]. Subsequently, Lundberg laid the foundation for modern ICP monitoring [Lundberg, 1960] by providing a method for ventricular cannulation that had a low risk of infection and leakage, enabled continuous recording of ICP, and was minimally traumatic. Lundberg described the following three basic patterns of physiologic changes in ICP:
 Plateau or A waves: increases of ICP in the range of 540–650 mm H2O (40–50 mmHg) that are sustained for 2–10 minutes, followed by a return to a higher baseline than before. They are indicative of a significant decrease in brain compliance. The A wave is of particular importance since these elevations in ICP may be sustained for long periods if left untreated.

Indications for Intracranial Pressure Monitoring
Following TBI, the decision to monitor ICP may be based on established criteria or expert opinion [Adelson et al., 2003a], and this is the best-established condition for acute monitoring in children. In other conditions in which ICP may be increased in children (e.g., meningitis, metabolic disorders, acute liver failure, stroke, brain tumors, cardiac arrest, hypoxic-ischemic encephalopathy, near-drowning), data are lacking both on any effects on outcome, and on the optimum range of ICP in these conditions. In these cases, the indications for ICP monitoring are subject to the judgment of the medical team.
Methods of Intracranial Pressure Monitoring
The clinical neurologic examination is the first, and essential, tool used to detect increases in ICP. In patients at high risk for increased ICP with conditions for which there are limited or no clinical guidelines (meningitis, acute liver failure, metabolic disorders, diabetic ketoacidosis), the decision whether or not to monitor ICP invasively will often need to be based on evidence for a decline in the patient’s neurologic examination. In contrast, the criteria for ICP monitoring in severe pediatric TBI have been published [Adelson et al., 2003a].
ICP monitors are classified both anatomically (ventricular, parenchymal, subdural, or extradural) and by mechanism (fluid-coupled or non-fluid-coupled) [Luerssen, 1997]. The external ventricular drain (EVD) remains the gold standard for reliable and accurate ICP monitoring [Figureaji, 2010; Padayachy et al., 2010]. This is a fluid-coupled system that provides real-time measurement of ICP, allows CSF drainage to control ICP, and can be recalibrated in situ. The device is zeroed at the level of the foramen of Monro and must be re-zeroed if the level of the bed is changed.
Other devices are used as alternatives for monitoring ICP, depending on the technical challenges of inserting an EVD into small ventricles. Placement of an intraventricular catheter can be technically difficult when severe brain swelling leads to compression of the ventricles or, in some instances, to ventricular displacement. Under these conditions, an intraparenchymal fiberoptic or electronic strain gauge system may be used. Subdural and extradural monitors cannot be calibrated in situ and are less reliable than intraparenchymal monitors [Gelabert-Gonzalez et al., 2006]. The most commonly used of these devices are the Codman (Codman, Raynham, MA, USA) microsensor [Koskinen and Olivecrona, 2005], the Camino (Integra Neurosciences, Plainsboro, NJ, USA) [Gelabert-Gonzalez et al., 2006], the Spiegelberg ICP sensor (Spiegelberg KG, Hamburg, Germany) [Lang et al., 2003], and more recently the Raumedic (Raumedic AG, Germany) ICP sensor [Citerio et al., 2008]. The risks associated with the use of ventricular catheters include hemorrhage and infection [Lozier et al., 2002]. The overall risk of ventriculitis is 1–5 percent [Lyke et al., 2001], and is associated with placement for more than 5 days or fluid leak around the catheter.
Given the potential risks associated with invasive ICP monitoring and the uncertain benefit for many pediatric disorders, the prospect of noninvasive monitoring is attractive. Several such methods have been proposed, including transcranial Doppler (TCD), changes in optic nerve sheath diameter, estimated middle-ear endolymph pressure, and visual-evoked potentials. None of these approaches is in routine clinical use [Wiegand and Richards, 2007]. The design of the TCD instrument is based on the Doppler effect to detect changes in frequency of a wave when the transmitter and receiver are in motion relative to one another. The TCD probe functions as the transmitter and receiver, and the wave is reflected back to the probe by moving blood. This was first reported in 1982 as being used to assess the vessels of the circle of Willis [Aaslid and Nornes, 1982]. TCDs can be used in children to estimate ICP, CBF, and CPP [Figureaji et al., 2009; Udomphorn et al., 2008], and to measure autoregulation [Tontisirin et al., 2007; Vavilala et al., 2005], but are not routinely used for estimation of ICP in clinical practice.
Thresholds and Doses of Raised Intracranial Pressure
Duration of Physiologic Derangement and Outcome
Using age-specific values, Jones and colleagues examined the relation between the “dose” of abnormal CPP (duration of exposure to abnormal pressure) and favorable or unfavorable outcome [Jones et al., 2003]. The authors first constructed a “table of derangement” of core physiological values, based on their review of published literature, and organized these data by “bins” of single-year increments. They excluded children younger than 1 year and used a maximum age of 15 years. For example, this resulted in raised ICP being defined as ≥6 mmHg for ages 1–4 years, ≥8 mmHg for ages 7–8, and above the patient’s age for years 10–15. The lower limit for deranged ICP ranged from ≥6 mmHg for ages 1–4 years to ≥15 mmHg at age 15. For CPP, the thresholds ranged from ≤45 mmHg at age 1 to ≤58 mmHg at age 15. These values were then used in a prospective study of children with head injury admitted to a single center. Invasive monitoring was used as clinically indicated. Using these thresholds, the investigators calculated the percentage of time of “deranged physiology” of the total monitoring duration. The percentage duration of low CPP, but not raised ICP, was significantly associated both with mortality and with likelihood of poor (nonindependent) outcome.
Application of Receiver Operating Characteristic Curves to Determining Thresholds
As part of a larger prospective study of CPP and ICP thresholds affecting outcome following severe TBI, Chambers and colleagues recorded ICP and CPP, noting duration from 6.3 to 173 hours in 84 children (age 3 months to 16 years) every 2 minutes, and assessed outcome at 6 months using the Glasgow Outcome Scale score [Chambers et al., 2001]. Over each 1-hour interval, they calculated the maximum ICP and minimum CPP as a summary measure. They calculated Receiver Operating Characteristic (ROC) curves for ICPmax and CPPmin, and dichotomized outcome to independent (good recovery or moderate disability) and dependent (severely disabled, vegetative, or dead). These results suggested that the ICPmax threshold for independent outcome was 35 mmHg, and for CPPmin 43–45 mmHg.
In a later multicenter study of 235 children of ages 2–16 years with head injury requiring ICP monitoring, this group examined the association of mean ICP and CPP in the first 6 hours of monitoring with outcome [Chambers et al., 2005]. The cohort was divided into three groups – ages 2–6, 7–10, and 11–16 years. Three types of ICP monitoring devices were used among the five centers, and the mean values for ICP and CPP over the first 6 hours of monitoring were used for analysis. For each age group, there were significant differences in outcome (dichotomized as independent or poor outcome using the Glasgow Outcome Scale score at 12 weeks’ recovery). In each age group, the mean ICP was above 20 mmHg in patients with a poor outcome. The ICP value for differentiating poor and good outcome was different among the three age groups. For the youngest group, sensitivity was 100 percent at 37 mmHg, in contrast to 24 mmHg for ages 7–10 years and 29 mmHg in the 11–16-year group. For all three groups, a mean CPP of 50 mmHg or lower was 100 percent sensitive for predicting good or poor outcome.
Area Under the Curve Analyses of Intracranial Pressure and Cerebral Perfusion Pressure Insults
A number of methods have been proposed to calculate the “dose” of ICP and the effect of this dose on outcome. In an early report, Marmarou and colleagues calculated the proportion of hourly ICP readings above 20 mmHg [Marmarou et al., 1991]. In this study of 428 patients in the Traumatic Coma Data Bank with ICP monitoring, the age range was 1–85 years, with 33 percent of cases between 20 and 30 years, but the pediatric cases are not analyzed separately. Others have used number of events, cumulative duration of events, and area under the curve (AUC) [Hemphill et al., 2005]. In a single-center study of 81 TBI patients aged 16–79 years, Elf and colleagues counted the number of insults above a specific ICP level (goal ≤20 mmHg; standard insult >25 mmHg; severe insult >35 mmHg) [Elf et al., 2005]. In this study, the investigators calculated the amount of a secondary insult as the time spent within the threshold level divided by the “good” (i.e., reliable) monitoring time for that patient. Although mortality was 11 percent in this study and only 7.5 percent had a good recovery at 6 months, less than 5 percent of time was spent with ICP above 25 mmHg, and this calculated variable was not associated with outcome. In contrast, Resnick and colleagues followed 38 patients with severe TBI for a year after the insult [Resnick et al., 1997]. They evaluated peak ICP, mean ICP, and the percentage of time spent with an elevated ICP, and found no association with outcome.
The validity of AUC as a management and predictive tool for relating ICP or CPP to outcome has been evaluated in a number of studies, some including children. A retrospective study by Vik and colleagues, of patients with severe TBI or Glasgow Coma Scale score above 8 with dilated pupils, included pediatric patients (age range 1–82 years), who were not analyzed separately [Vik et al., 2008]. The investigators sought to determine whether the “dose” of ICP above the treatment goal of 20 mmHg was associated with outcome or with the Marshall CT score. ICP “doses” were classified in four groups, calculated from the threshold of 20 mmHg: no dose (0 mm × hr), low dose (>0–75), moderate (>75–200), and high dose (>200), with a median monitoring time of 10 days. For example, a value of 200 could represent either 25 mmHg for 40 hours or 30 mmHg for 20 hours. Data were abstracted manually and the highest value for each hour was recorded. Mortality in this study was 13 percent, and 65 percent had ICP values above 20 mmHg. After adjusting for other predictors of outcome (Glasgow Coma Scale score, age, Injury Severity Scare score, pupil abnormalities), the ICP AUC was significantly associated with risk of death or poor outcome at 6 months, but not with longer-term (>3 years) outcome. ICP AUC was also significantly higher in patients with worse Marshall CT scores.
Combining High-Frequency Data Collection with Calculation of ICP and CPP Dose
The availability of technology to collect high-resolution real-time data has outstripped the development of the analytic tools to process these data. Technical hurdles have limited progress in this “plug and play” approach to real-time data collection and analysis in the intensive care unit. Kahraman and colleagues [Kahraman et al., 2010] sought to determine whether high-volume, high-frequency (every 6 seconds) collection of physiologic data, including ICP and CPP in patients with severe TBI, was feasible. To determine whether the calculated measure of “pressure times time dose” (PTD) of each endpoint was associated with outcome, they calculated whether the degree and duration of ICP and CPP above and below treatment thresholds (ICP, 20 mmHg; CPP 60 mmHg) were associated with outcome. This study included 30 patients with the lower age limit of 14 years, although the percentage of pediatric cases was not specified. From 3332 hours of recording, including 2.6 days of ICP monitoring, a total of 1,990,000 data points were recorded. While Bland–Altman plots showed poor correlation between automated and manual PTD, the automated PTD was significantly higher in patients with poor outcome (GOS-Glasgow outcome score ≤4) compared to those with good outcome (GOS >4). Taken together, these findings suggest that automatic collection of ICP and CPP is accurate and feasible, and that the duration and amplitude of deviation from the “normal” value are better predictors of outcome than the total duration of such episodes.
The use of the combination of duration and amplitude of an insult to determine outcome following TBI in a pediatric population was examined in a prospective, observational study by Chambers and colleagues of 81 head-injured children [Chambers et al., 2006]. ICP and CPP treatment thresholds were as reported for another UK group [Jones et al., 2003]. Data were automatically recorded every minute, the groups stratified by age (2–6, 7–10, and 11–15 years), and derangements defined as values that persisted for more than 5 minutes. For each interval, the difference between the age-specific threshold for ICP or CPP was calculated, and then summed to generate the pressure–time index (PTI), according to the formula: PTIICP × ∑(ICPvalue – ICPthreshold) = tsample interval/60. A PTIICP of 40 mmHg hours could therefore represent either 4 hours’ duration at 10 mmHg above the age-specific threshold, or 2 hours with a 20-mmHg deviation. The critical CPP threshold values for determining outcome were 48, 54, and 58 mmHg for children ages 2–6, 7–10, and 11–15 years, respectively. Using these thresholds, the PTICPP values were significantly different (p <0.001 by Kruskal Wallis) for good recovery (4.2 mmHg hours), moderate disability (16.5 mmHg hours), severe disability (73.6 mmHg hours), and death (769.1 mmHg hours). For a favorable outcome, the PTICPP with 80 percent sensitivity was 73.1 mmHg. For ICP, this index had an ROC of 0.871 for mortality and 0.818 for outcome (favorable vs. unfavorable). Thresholds of 6.4, 8.7, and 13 mmHg were used for ages 2–6, 7–10, and 11–15 years, respectively. The PTIICP values for the same recovery groups were 232.8, 134.1, 776.3, and 1763.6 mmHg hours, raising the question of why those with moderate disability had a lower index score (134.1) than those with good outcome (232.8).
While the finding that a lower “dose” of increased ICP is associated with better outcome in the moderate disability group is counterintuitive, the use of calculated indices in this study shows that quantifying total brain insult due to deranged pressures is possible in pediatric neurotrauma using automated, high-frequency data collection. Despite the small numbers in this series, these data suggest that the cumulative dose of CPP has a greater effect on outcome than ICP. In a trial of moderate hypothermia for severe TBI [Adelson et al., 2005], there was no improvement in outcome with hypothermia. In contrast to the findings of the PTI study, this group found that the percentage of time for which ICP was lower than 20 mmHg differed significantly between those with good (90.8 ± 35.0) and poor (68.6 ± 35.0, p <0.01) outcomes.
Similar Thresholds Affect Outcome in Other Forms of Severe Brain Injury
In a prospective study of children with severe acute brain injury (Glasgow Coma Scale score <8, or judged to have severe acute brain injury by the medical staff), the utility of ICP and CPP as measures for prediction of outcome was examined in a single-center study between 1991 and 1993 [Carter et al., 2008]. The 35 patients in this study (25 TBI, 10 non-TBI; ages 4.2–6.6 years) were managed by a protocol to maintain ICP ≤20 mmHg and CPP >30–60 mmHg, depending on age, with outcome (GOS) recorded up to 5 years. This group used the highest stable ICP and lowest stable CPP recorded during the admission as the primary determinant of outcome. Among the 25 TBI cases, 9 either died or were severely disabled, and 6 of these cases had ICP values ≤24 mmHg. Among the 16 with favorable outcome, none had an ICP greater than 29 mmHg. All the cases with good outcome had CPP values recorded above 50 mmHg, although CPP values in 4 of the 9 with poor outcomes were above 50 mmHg. A similar pattern was present in the 10 non-TBI cases, in which ICP values in those with poor outcome (n = 4) ranged from 10 to 124 mmHg, and CPP from 0 to 30 mmHg. The interpretation of these results is limited by the lack of definition of a “stable” value for ICP and CPP, and lack of detail on the effects of other medical interventions on outcome and physiology. Nevertheless, ROC analyses of these data showed 100 percent specificity for bad (severe disability, vegetative state, or death) outcome following TBI for ICP ≥40 mmHg and CPP ≤49 mmHg. When the data for TBI and non-TBI cases were combined, the sensitivity and specificity pairs for predicting poor outcome were 46.2/100 percent for ICP (threshold ≥40 mmHg) and 66.7/100 percent for CPP (threshold ≤49 mmHg).
Lessons and Limitations of these Studies
Collectively, these data show that elevated ICP and low CPP are associated with poor outcome. Treatment should aim to maintain ICP below 20 mmHg and CPP above 40 mmHg. There appear to be age-dependent thresholds of ICP [Chambers et al., 2001, 2005, 2006], although these require validation in larger, prospective studies. In general, ICP above 40 mmHg and CPP below 49 mmHg are associated with unfavorable outcomes [Chambers et al., 2006; Carter et al., 2008], and CPP may be a superior predictor of outcome [Jones et al., 2003]. Nevertheless, a retrospective study [Cremer et al., 2005] showed that ICP/CPP-targeted therapies after severe TBI in adults did not improve outcome, and called into question the value of monitoring ICP and CPP. Overall, the interpretation of these pediatric studies is limited by their mostly retrospective design, relatively short durations of recovery, variable outcome measures, small sample sizes, varying indications for ICP monitoring, and limited data on medical management and therapies to treat intracranial hypertension. While the use of a mean value of ICP or CPP derived from a prolonged intensive care unit stay is clearly not the correct approach, the interval of data to select for analysis and the optimal mode of analysis (PTI, AUC) remain to be determined.
Intracranial Hypertension Related to Compromise of Autoregulation
Studies that seek to determine the “optimal” ICP and CPP to improve outcome have focused on the maximum ICP or minimum CPP, but it is clear that elevations in CPP with resulting hyperemia may also increase mortality following TBI [Robertson et al., 1999]. Ideally, therapy would be individualized to select the optimal CPP and ICP for each patient. As the previous sections summarize, a number of studies have sought to determine the age-dependent thresholds for outcomes associated with abnormal ICP and CPP following TBI, and to calculate the “dose” of physiologic derangement predictive of outcome.
Calculation of Cerebrovascular Reactivity
Other pressures can also be derived from measurement of ICP and CPP. These include the correlation coefficient between slow waves of the ICP and arterial blood pressure, defined as pressure reactivity index (PRx) [Czosnyka et al., 2007]. This index reflects the changes in the vasoreactivity of the cerebral vasculature associated with the perturbation of physiologic vascular responses to changes in arterial blood pressure, and is expressed as the correlation coefficient of the linear regression of arterial blood pressure and ICP signals. Under normal conditions, when autoregulation is preserved, a fall in MAP leads to cerebral vasodilatation, and an increase in cerebral blood volume. As MAP falls and cerebral blood volume increases, subject to cerebral compliance, this will lead to an increase in ICP. Conversely, as MAP increases, cerebral vessels vasoconstrict, leading to a decrease in cerebral blood volume and ICP. Thus, when the cerebral vascular bed is reactive and autoregulation is preserved, slow waves of arterial blood pressure and ICP values are inversely related and PRx is negative. When pressure reactivity is compromised, slow waves of arterial blood pressure and the ICP change in concert and PRx is positive. In adults, PRx values of >0.3 are associated with increased mortality following TBI [Balestreri et al., 2004].
While maintenance of adequate CPP is the cornerstone of management following TBI in adults, the optimal level of CPP is debated. This approach, using a common CPP goal, has been called into question [Andrews, 2005]. If CPP is below the critical threshold for a given patient, this may result in secondary ischemic injury. If CPP is allowed to rise above the individual’s optimal threshold, this relative hyperemia may exacerbate cerebral edema. The Cambridge group has reported a method to titrate the CPP according to the specific pathophysiologic requirements of individual patients [Steiner et al., 2002]. In an observational, retrospective analysis of 114 adults with head injury, optimal CPP values based on PRx monitoring were estimated for 60 percent of patients, and the differences between average and optimal CPP values were strongly associated with poor outcomes.
In a study of 38 adults (mean age 40.1 years) with mild, moderate, and severe TBI, Jaeger and colleagues sought to evaluate whether an optimal CPP (CPPOPT) for each patient could be determined based on measurement of PRx. PRx was calculated as a moving correlation coefficient between the ICP and the spontaneous fluctuations of MAP [Jaeger et al., 2010]. The investigators defined CPPOPT as the CPP at which the PRx average was lowest. To measure CPPOPT for patient management, they measured brain-tissue oxygen (PbrO2) and defined the optimal CPP as the threshold above which increases in CPP did not produce further increase in the partial pressure of brain-tissue oxygenation. Importantly, this threshold correlated (r = 0.79; p <0.01) with that predicted by the PRx index. The hypothesis that PbrO2 can serve as a surrogate as a measure of CBF has been suggested by previous studies [Valadka et al., 2002], and was supported by this study. These investigators found that the range of CPPOPT was broad, extending from 60 to 100 mmHg, above which there was no improvement in brain oxygenation.
The concept of individualized management of a cerebral perfusion threshold, based on ICP, MAP, and changes in autoregulation, is attractive. Previous studies also showed a correlation between CBF and regional PbrO2 [Czosnyka et al., 1997]. The populations who stand to benefit from this individualized approach to treatment have yet to be determined. For focal injuries, it is not clear whether determining optimal CPP is appropriate for the whole brain. Importantly, data are needed to show that the management of patients guided by these data leads to improved functional outcomes.
Autoregulation-Directed Therapy in Pediatric Neurotrauma
In the first study to monitor PRx in pediatric patients with TBI, Brady and colleagues prospectively studied 21 children with severe TBI to test the hypothesis that intact pressure reactivity would be associated with survival. The average ICP (mean ± SD) in the survivors (11 ± 4 mmHg) was significantly lower than in nonsurvivors (73 ± 17 mmHg, p = 0.0005) [Brady et al., 2009]. A similar difference was present for CPP in survivors (73 ± 7) and nonsurvivors (20 ± 16). There was a significant association of PRx with survival. In the survivors (n = 15), the mean PRx (0.08 ± 0.19) was significantly lower than in nonsurvivors (0.69 ± 0.21, p = 0.0009). Notably, PRx was dependent on CPP with greater reactivity at higher CPP values, particularly, above 40 mmHg. These data suggest that measurement of pressure reactivity using PRx can be used in pediatric TBI to identify optimal and harmful CPP ranges. Whether autoregulation-directed therapy for intracranial hypertension following pediatric TBI will improve functional outcome will require further study.
Effects of Gender on Increased Intracranial Pressure
Preclinical data suggest gender-specific differences in the response to CNS injury [Du et al., 2009]. Gender differences have also been reported in adult TBI studies, including gender differences in neuroprotection, such as greater lipid peroxidation in males [Bayir et al., 2004]. In a mouse model of diffuse (weight-drop) TBI, a gender difference favoring females has been reported, with a delayed, decreased peak in the extent of neurodegeneration. This disparity between genders was not found in a focal model of TBI, using controlled cortical impact [Hall et al., 2005]. Results from clinical studies investigating gender-related differences in adults have also been ambiguous [Coimbra et al., 2003; Farin et al., 2003]. These studies have not shown conclusive evidence that there are gender-specific outcomes following TBI, despite the preclinical data indicating a greater capacity for neuroprotection in females compared to males [Du et al., 2009]. More recently, a retrospective review of 325 patients of ages 16–45 years with blunt TBI requiring inpatient rehabilitation was performed using the TBI Model Systems of Care National Database [Ratcliff et al., 2007]. The effect of gender on neuropsychological performance at 1-year follow-up was examined. Females performed significantly better than males on tests of attention, working memory, and language, while males performed better in tests of visual analysis.
These results leave open the question of the contribution of ICP to differences in recovery following TBI. Again, there are limited data specific to children. In a retrospective study of 612 adult patients with TBI managed with ICP, arterial blood pressure, and CPP monitoring, the Cambridge group identified 98 females and 371 males available for follow-up at 6 months [Czosnyka et al., 2008]. With respect to ICP, arterial blood pressure, and CPP, there were no differences between males and females above and below 50 years of age. Interestingly, cerebrovascular reactivity (PRx) was increased (worse) in females (0.11 ± 0.047) compared to males (0.044 ± 0.031; p <0.05) among the patients younger than 50 years. In this younger age group, among patients with abnormal reactivity (PRx >0.3) intracranial hypertension (mean ICP >25 mmHg) was significantly more common among females (60 percent) than males (20 percent). The mortality rate at 6 months was also significantly higher among females younger than 50 (29 percent; n = 21/71) compared to males (17 percent; p = 0.026). The study is limited by a heterogeneous population (not all were “severe” TBI), and by an arbitrary organization of groups by age rather than menopausal status. A study of autoregulation in healthy children aged 10–16 years showed higher flow velocities in girls in both the middle cerebral artery and basilar artery [Vavilala et al., 2005]. Autoregulation was greater in the basilar artery in girls, and in the middle cerebral artery in boys.
Clinical Manifestations of Raised Intracranial Pressure
Physical Examination Findings
The clinical signs of increased ICP range from subtle changes in higher cognitive function, to stupor and focal neurologic findings (Table 77-1). Importantly, brain imaging may be normal in the early stages of increased ICP. In children at risk for intracranial hypertension, careful attention to subtle changes in the neurologic examination and a high index of suspicion for early signs of increased ICP are essential. If therapies to treat ICP are to be effective in the heterogeneous disorders causing intracranial hypertension in children, then early recognition and intervention are essential to increase the likelihood of a good outcome.
Table 77-1 Clinical Manifestations of Increased Intracranial Pressure
| Signs and Symptoms | Mechanism | Clinical Findings |
|---|---|---|
| Headache | Traction on dura with pain mediated by trigeminal nerve | Exacerbated by coughing, bending, sneezing Worse when recumbent |
| Diplopia | Traction on abducens nerve | Uni- or bilateral paresis. Binocular diplopia, worse in direction of gaze of paretic muscle. False localizing sign since not due to intrinsic lesion in pons |
| Decreased sensorium or change in personality | Compression of edematous hemisphere by other hemisphere, or compression of reticular activating system | Symptoms begin in adults when ICP reaches 15–40 mmHg. No comparable pediatric data. May be subtle, ranging from irritability or poor attention to stupor |
| Impaired upgaze | Pressure over pretectal region of midbrain | Mild retraction of eyelids due to sympathetic overactivity. Prominent eyes with downgaze in infants (sunset sign) |
| Increased head size | Chronic or acute mass effect | Tense anterior fontanel, bulging scalp veins, splitting of sutures, acceleration of head growth |
| Papilledema | Edema in nerve fiber layer of retina due to impaired retinal venous return | Early: loss of venous pulsations Later: elevation of disk margins, tortuous retinal veins. Visual acuity is normal until late stages |
| Cushing response | Compression of brainstem | Slowing of respiratory rate, bradycardia and increased blood pressure. Triad is variable, with tachycardia also seen with increased ICP. Triad present only in up to one-third of cases in intracranial hypertension |
Among these findings, the most reliable sign of increased ICP is papilledema. Most patients do not complain of visual symptoms, but in the late stages of papilledema, there might be “transient visual obscurations,” which are fleeting episodes of vision loss lasting seconds. Late findings include elevation and blurring of the optic disc margins, tortuosity of the retinal veins, hemorrhages, and exudates. In contrast to papillitis, visual acuity remains normal in papilledema until the late stages. Although papilledema reliably indicates increased ICP, its absence does not exclude its possibility. Papilledema is generally not seen in infants because of compensation for raised ICP by splitting of the sutures and cranial enlargement. A false impression of papilledema can be created by “drusen,” alternatively termed colloid or hyaline bodies. They are located over the optic nerve head, dominantly inherited [Fenichel, 2001], more common in Caucasians, and generally seen after age 11 years [Glaser, 1978].
Herniation Syndromes
As ICP increases, this creates pressure gradients in the cranial cavity, resulting in herniation of brain tissue, which may be transtentorial (central and uncal), tonsillar (foramen magnum), or subfalcine. Each has a specific clinical correlate (Table 77-2). See Chapter 73 for further discussion of herniation syndromes.
| Type | Mechanism | Clinical Findings |
|---|---|---|
| Transtentorial | Medial and caudal displacement of uncal portion of temporal lobe with entrapment in the tentorial notch. Compression of the ipsilateral third cranial nerve, midbrain, cerebral peduncle, and posterior cerebral artery | Ipsilateral dilated pupil (compression of pupilloconstrictor fibers); progressive decline in consciousness; loss of oculocephalic reflexes; decorticate posturing; ipsilateral hemiparesis (pressure on contralateral cerebral peduncle) |
| Central | Swelling of both hemispheres, leading to compression of diencephalon and midbrain | Early: decline in consciousness, constricted pupils (sympathetic dysfunction), Cheyne–Stokes respiration Late: loss of oculocephalic reflexes, central neurogenic hyperventilation, decerebrate posturing |
| Tonsillar | Cerebellar tonsils impacted in the foramen magnum, leading to compression of medulla and upper cervical spinal cord. Most common with posterior fossa mass lesions | Abrupt loss of consciousness, opisthotonic posturing, stiff neck, irregular respiration, apnea |
| Cingulate | Displacement of edematous cingulate gyrus under the free edge of the falx cerebri. Compression of ipsilateral or bilateral anterior cerebral arteries and internal cerebral vein | Variable symptoms. Often a precursor to other herniation syndromes, commonly associated with uncal herniation |
| Late stages | Later stages of uncal, central and tonsillar herniation manifest as coma, flaccid limbs, midsize unresponsive pupils, loss of corneal and oculocephalic reflexes, and irreversible apnea | |
Lumbar Puncture in Patients with Raised Intracranial Pressure
Lumbar puncture is contraindicated in patients with raised ICP because of the risk of precipitating brain herniation. The ocular fundi should be carefully assessed for papilledema in every patient before a lumbar puncture is initiated. If the fundi cannot be visualized and symptoms are suspect for increased ICP, pertinent diagnostic information may be obtained by computed tomography (CT) or magnetic resonance imaging (MRI), and neurosurgical consultation may be needed. Patients with elevated ICP (e.g., patients with idiopathic intracranial hypertension [IIH]) may feel better after lumbar puncture. However, patients must be monitored for signs of neurologic deterioration if the ICP is increased. If headaches persist after an LP is performed, a low-pressure headache (Table 77-3) due to a CSF leak should be considered [Schievink, 2006]. Abnormal high and low values for opening pressure should be interpreted in the context of the patient’s body mass index and the depth of sedation required for the procedure [Avery et al., 2010].
Table 77-3 Clinical Features of, Diagnostic Criteria, for, and Conditions Associated with Intracranial Hypotension
| Clinical Features | Diagnostic Criteria for Headache Due to Spontaneous CSF Leak and Intracranial Hypotension | Differential Diagnosis for Low-Pressure Headache Symptoms |
|---|---|---|
| Orthostatic headache |
Chronic daily headache
Spontaneous intracranial hypotension
Carotid or vertebral dissection
Benign intracranial hypertension
Post-traumatic headache
Management of Acutely Elevated Intracranial Pressure
A guideline for the treatment of intracranial hypertension in the management of severe TBI has been published [Adelson et al., 2003b]. Other excellent summaries of management algorithms are also available [Orliaguet et al., 2008; Guerguerian et al., 2009], including summaries of the treatment protocols incorporating therapeutic hypothermia in two major studies of pediatric TBI [Adelson et al., 2005; Hutchinson et al., 2008]. An algorithm for the evaluation and management of a child with suspected increased ICP is shown in Figure 77-4.
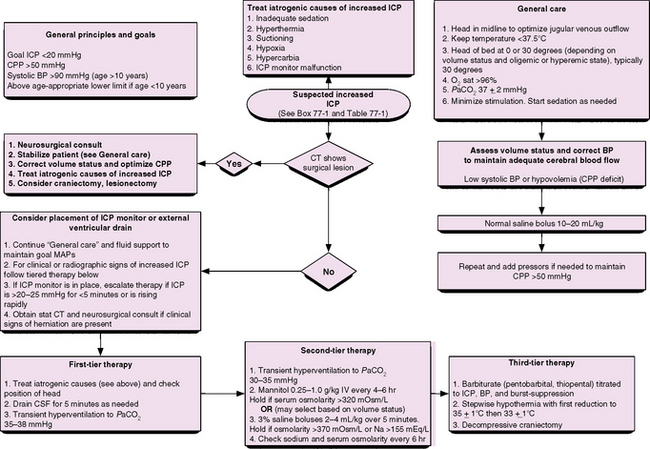
BP, blood pressure; CPP, cerebral perfusion pressure; CSF, cerebrospinal fluid; CT, computed tomography; ICP, intracranial pressure; MAP, mean arterial pressure. For reviews and examples of these approaches see Adelson et al. [2003a], [2003b], [2005], Orliaguet et al. [2008], Guerguerian et al. [2009], Hutchinson et al. [2008].
Initial Assessment, Imaging and Surgical Intervention
The first key steps in management are to establish a baseline neurologic exam and to identify and, if possible, reverse the primary cause of increased ICP. A careful history is important to identify the mechanism of injury. This is particularly relevant for children who have experienced a motor vehicle accident or fall, and have a reassuring neurologic exam but “talk and die” [Humphreys et al., 1990]. The medical management proceeds in a tiered approach, but if the initial imaging study shows a surgically operable lesion, unilateral edema with mass effect, or hydrocephalus caused by obstructed CSF outflow, the first intervention is neurosurgical.
When medical management of ICP is ineffective or the patient presents with severe edema, the first step in therapy may be decompressive craniotomy. A Cochrane review [Sahuquillo and Arikan, 2006] suggests that this may be a promising therapy for children if used early, before irreversible neurologic injury [Taylor et al., 2001; Jagannathan et al., 2007; Tomofeev et al., 2008; Kan et al., 2006]. The effects on long-term outcome and specific criteria for patient selection remain to be determined.
General Principles of Medical Management
Intracranial Pressure-Directed Therapy
The third tier of interventions for refractory increased ICP includes decompressive craniectomy (see above) or moderate hypothermia (32–34°C). Importantly, the decision for decompression should be made before irreversible neurologic injury occurs, although this is clearly a challenging assessment in the intubated, sedated patient. Hypothermia is effective in reducing ICP [Polderman and Herold, 2009]. Importantly, two major clinical trials of therapeutic hypothermia in pediatric TBI have failed to show improvement in outcome [Adelson et al., 2005], or have shown increased mortality in the hypothermia group [Hutchinson et al., 2008]. The reasons for this are not clear. This intervention should only be undertaken in centers with expertise in its use, particularly with experience in the controlled rewarming after hypothermic therapy.
Spontaneous Intracranial Hypotension
Spontaneous intracranial hypotension is rare, compared to the occurrence of elevated intracranial pressure following trauma [Schievink, 2006]. However, the clinical manifestations of low pressure, including persistent daily headaches in young adults, may be easily overlooked and result in a delay in diagnosis (Box 77-2). Estimates of the prevalence for this condition range from 1 in 50,000 in a community-based study to 5 per 100,000 in an emergency room-based study [Diaz, 2001]. Although the peak incidence occurs around age 40 years, with a female–male ratio of approximately 2:1, children are also affected [Rosser et al., 2005]. Spontaneous intracranial hypotension is believed to result from development of a spontaneous CSF leak following minor trauma, alone or in association with generalized connective tissue disorders, including Marfan’s syndrome, Ehlers–Danlos type II syndrome, and autosomal-dominant polycystic kidney disease [Schievink et al., 2004]. Low-pressure headaches may be misdiagnosed as migraine, meningitis, malingering, or subarachnoid hemorrhage. Postural headache is the distinctive symptom, but other headache patterns (nonpositional, exertional) occur, as well. Other associated symptoms may include neck stiffness, vomiting, vague auditory symptoms, and even coma [Schievink et al., 2007], likely caused by deformation of the diencephalon. In approximately 20 percent of cases, subdural hematomas are also present, but rarely require evacuation.


Diagnosis and Management
Lumbar puncture may be “dry” or have a low (<60 mm H2O) opening pressure, but it is not needed to establish the diagnosis. CSF may show an elevated protein count and lymphocytic pleocytosis. The diagnostic study of choice is now MRI, with characteristic findings of enhancement of the pachymeninges, subdural fluid collections, engorgement of venous structures, pituitary hyperemia, and downward displacement of the brain [Schievink, 2006]. Management is first conservative with bed rest, hydration, analgesics, glucocorticoids, and caffeine [Diaz, 2001]. If this is not effective, more aggressive interventions include placement of cervical, thoracic, or lumbar autologous epidural blood patches, using 10–15 mL of autologous blood. If the symptoms do not respond to patching, the site of the leak needs to be identified using CT myelography. Rarely, surgical repair or injection of fibrin glue may be needed [Schievink et al., 2007].
Chronic Intracranial Hypertension
Idiopathic Intracranial Hypertension
Primary idiopathic intracranial hypertension (IIH; previously termed pseudotumor cerebri) may develop at almost any age. IIH has an annual incidence of 0.9/100,000 persons and 3.5/100,000 in women of ages 15–44 years. To some extent, it is a diagnosis of exclusion, dependent on excluding identifiable causes of raised ICP [Friedman and Jacobson, 2002]. IIH presents subacutely, with daily headache that is made worse by maneuvers that raise ICP, such as coughing and bending. Infants may manifest irritability, the sunset sign, and a bulging anterior fontanel. Cranial nerve VI paresis from traction on the nerve caused by raised ICP may lead to diplopia that worsens with lateral gaze. Other manifestations of IIH include pulsatile tinnitus, transient visual obscuration, photopsia, retrobulbar pain, vertigo, and decreased visual acuity [Wall, 2010]. Patients remain alert and fully oriented. Adolescents with IIH may be obese; among adolescents, IIH is slightly more common in girls than in boys, but there is no specific gender predilection during infancy and early childhood.
The major morbidity associated with IIH is vision loss, and management is directed at preventing this complication. The retinal examination discloses papilledema. Bedside and formal visual field testing may demonstrate enlargement of the blind spot but, in general, only in advanced stages. Snellen acuity and visual-evoked potential testing are insensitive measures to follow vision loss in patients with IIH [Corbett and Thompson, 1989]. These patients should be followed with perimetry. MRI, MR venographic, and CT studies usually yield normal results. Infrequently, the ventricles may appear slitlike. Lumbar puncture is needed to establish a definitive diagnosis. It reveals significantly raised opening and closing pressures and normal white blood cell count, protein, and glucose. Disorders associated with secondary intracranial hypertension are listed in Box 77-2.
Treatment of Idiopathic Intracranial Hypertension
Serial lumbar punctures, carried out every 5–7 days, with drainage of 20–25 mL of CSF on each tap, are also helpful in lowering the closing pressure below 200 mmHg. While common, this approach is controversial since CSF pressure returns to pre-lumbar puncture levels within 82 minutes [Johnston and Paterson, 1974]. Pain at the lumbar puncture site and post-lumbar puncture headache are potential complications. Simple analgesics, such as acetaminophen and ibuprofen, combined with bed rest, are used to treat these complications.
A careful examination of the visual acuity and formal visual fields should be performed every 1–3 months. Patients who demonstrate compromise of visual function, despite medical therapy, may need optic nerve sheath fenestration, a surgical procedure that reduces pressure around the nerve. A number of series have reported good outcome with this procedure [Chandrasekaran et al., 2006].
Conclusions
Increased ICP is a major determinant of neurologic morbidity following TBI and other neurologic insults common to children, including CNS infections, metabolic disorders, acute liver failure, stroke, cardiac arrest, and diabetic ketoacidosis. There has been substantial progress in defining the thresholds for ICP in TBI and understanding the mechanisms by which compromised ICP alters autoregulation. Despite this progress, data are lacking on the age-dependent goals for ICP in the management of these disorders, particularly in children below 2 years of age. There is great potential for the automated, high-frequency collection of these data, and integration with other physiologic measures, including CPP and MAP, but the technical hurdles required for this to enter clinical practice have yet to be overcome [Hemphill et al., 2005; Cohen et al., 2010; Sorani et al., 2007]. Similarly, the wealth of these data has outstripped the tools to analyze ICP in the context of other multimodality monitoring, and calculated scales using measured ICP have yet to enter clinical practice in pediatric neurotrauma. Future studies will need to address these issues and demonstrate further that ICP-, CPP-, and autoregulation-directed therapy improves long-term functional neurologic outcome in pediatric neurocritical care.
References
 The complete list of references for this chapter is available online at www.expertconsult.com.
Aaslid R., T T.M., Nornes H. Noninvasive transcranial Doppler ultrasound recording of flow velocity in basal cerebral arteries. J Neurosurg. 1982;57:769-774.
Adelson P., et al. Phase II clinical trial of moderate hypothermia after severe traumatic brain injury in children. Neurosurgery. 2005;56:740-754.
Adelson P., et alAmerican Association for Surgery of Trauma, Child Neurology Society, International Society for Pediatric Neurosurgery, International Trauma Anesthesia and Critical Care Society, Society of Critical Care Medicine, World Federation of Pediatric Intensive and Critical Care Societies. Guidelines for the acute medical management of severe traumatic brain injury in infants, children, and adolescents. Chapter 6. Threshold for treatment of intracranial hypertension. Pediatr Crit Care Med. 2003;4(Suppl 3):S25-S27.
Adelson P., et alAmerican Association for Surgery of Trauma, Child Neurology Society, International Society for Pediatric Neurosurgery, International Trauma Anesthesia and Critical Care Society, Society of Critical Care Medicine, World Federation of Pediatric Intensive and Critical Care Societies. Guidelines for the acute medical management of severe traumatic brain injury in infants, children, and adolescents. Chapter 17. Critical pathway for the treatment of established intracranial hypertension in pediatric traumatic brain injury. Pediatr Crit Care Med. 2003;4(Suppl 3):S65-S67.
Andrews P. Cerebral perfusion pressure and brain ischemia: Can one size fit all? Crit Care. 2005;9:638-639.
Astrup J., Siesjo B., Symon L. Thresholds in cerebral ischemia – the ischemic penumbra. Stroke. 1981;12:723-725.
Avery R., et al. Reference range for cerebrospinal fluid opening pressure in children. N Engl J Med. 2010;363:891-893.
Balestreri M., et al. Intracranial hypertension: what additional information can be derived from ICP waveform after head injury? Acta Neurochir (Wien). 2004;146:131-141.
Bayir H., et al. Marked gender effect on lipid peroxidation after severe traumatic brain injury in adult patients. J Neurotrauma. 2004;21:1-8.
Beaumont A., Marmarou A., Ward J. Intracranial hypertension: Mechanisms and management. In: McClone D., editor. Pediatric Neurosurgery: Surgery of the developing nervous system. ed 4. Philadelphia: WB Saunders; 2001:619-633.
Brady K., et al. Continuous monitoring of cerebrovascular pressure reactivity after traumatic brain injury in children. Pediatrics. 2009;124:1205-1212.
Brady K., et al. The lower limit of cerebral blood flow autoregulation is increased with elevated intracranial pressure. Anesth Analg. 2009;108:1278-1283.
Brain Trauma Foundation. X. Brain oxygen monitoring and thresholds. J Neurotrauma. 2007;24:S65-S70.
Bray P., et al. Occipito-frontal head cirumference – an accurate measurement of intracranial volume. J Pediatr. 1969;75:303-305.
Carter B., Butt W., Taylor A. ICP and CPP: excellent predictors of long term outcome in severely brain injured children. Childs Nerv Syst. 2008;24:245-251.
Chambers I., et al. Age-related differences in intracranial pressure and cerebral perfusion pressure in the first 6 hours of monitoring after children’s head injury: association with outcome. Childs Nerv Syst. 2005;21:195-199.
Chambers I., et al. Critical thresholds of intracranial pressure and cerebral perfusion pressure related to age in paediatric head injury. J Neurol Neurosurg Psychiatry. 2006;77:234-240.
Chambers I., Treadwell L., Mendelow A. Determination of threshold levels of cerebral perfusion pressure and intracranial pressure in severe head injuy by using ROC curves: an observational study in 291 patients. J Neurosurg. 2001;94:412-416.
Chandrasekaran S., et al. Visual outcomes for optic nerve fenestration in pseudotumor cerebri and related conditions. Experiment Opthalmol. 2006;34:661-665.
Chiron C., et al. Changes in regional cerebral blood flow during brain maturation in children and adolescents. J Nucl Med. 1992;33:696-703.
Citerio G., et al. Multicenter clinical assessment of the raumedic neurovent-P intracranial pressure sensor: a report by the BrainIT group. Neurosurgery. 2008;63:1152-1158.
Cohen M., et al. Identification of complex metabolic states in critically injured patients using bioinformatic cluster analysis. Crit Care. 2010;14:R10.
Coimbra R., et al. Does sexual dimorphism influence outcome of traumatic brain injury patients? The answer is no!. J Trauma. 2003;54:689-700.
Corbett J., Thompson H. The rational management of idiopathic intracranial hypertension. Arch Neurol. 1989;46:1049-1051.
Cremer O., et al. Effect of intracranial pressure monitoring and targeted intensive care on functional outcome after severe brain injury. Crit Care Med. 2005;33:2207-2213.
Cunningham A., et al. Physiologic thresholds for irreversible tissue damage in contusional regions following traumatic brain injury. Brain. 2005;128:1931-1942.
Czosnyka M., et al. A synopsis of brain pressures: which? when? are they all useful? Neurol Res. 2007;29:672-679.
Czosnyka M., et al. Continuous assessment of the cerebral vasomotor reactivity in head injury. Neurosurgery. 1997;41:11-17.
Czosnyka M., et al. Gender-related differences in intracranial hypertension and outcome after traumatic brain injury. Acta Neurochir Suppl. 2008;102:25-28.
Diaz J. Epidemiology and outcome of postural headache management in spontaneous intracranial hypotension. Reg Anesth Pain Med. 2001;26:582-587.
Du L., et al. Starving neurons show sex difference in autophagy. J Biol Chem. 2009;284:2383-2396.
Elf L., et al. Cerebral perfusion pressure between 50 and 60 mmHg may be beneficial in head-injured patients: a computerized secondary insult monitoring study. Neurosurgery. 2005;56:962-971.
Farin A., et al. Sex-related differences in patients with severe head injury: greater susceptibility to brain swelling in female patients 50 years of age and younger. J Neurosurg. 2003;98:32-36.
Fenichel G. Increased intracranial pressure. In: Fenichel G.B., editor. Clinical pediatric neurology. A signs and symptoms approach. ed 4. Philadelphia: WB Saunders; 2001:91.
Figureaji A. Practical aspects of bedside cerebral hemodynamics monitoring in pediatric TBI. Childs Nerv Syst. 2010;26:431-439.
Figureaji A., et al. Transcranial Doppler pulsatility index is not a reliable indicator of intracranial pressure in children with severe traumatic brain injury. Surg Neurol. 2009;72:389-394.
Fog M. The relationship between the blood pressure and the tonic regulation of the pial arteries. J Neurol Psychiatry. 1938;1:187-197.
Friedman D., Jacobson D. Diagnostic criteria for idiopathic intracranial hypertension. Neurology. 2002;59:1492-1495.
Gelabert-Gonzalez M., et al. The camino intracranial pressure device in clinical practice. Assessment in a 1000 cases. Acta Neurochir (Wien). 2006;148:435-441.
Glaser J.S. Topical diagnosis: Prechiasmal visual pathways. In: Glaser J.S., editor. Neuro ophthalmology. Hagerstown, MD: Harper & Row; 1978:61.
Guerguerian A., Lo T., Hutchison J. Clinical management and functional neuromonitoring in traumatic brain injury in children. Curr Opin Pediatr. 2009;21:737-744.
Guillaume J., Janny P. Continuous intracranial manometry; importance of the method and first results. Rev Neurol (Paris). 1951;84:131-142.
Hall E., Gibson T., Pavel K. Lack of a gender difference in post-traumatic neurodegeneration in the mouse controlled cortical impact injury model. J Neurotrauma. 2005;22:669-679.
Harper A. Physiology of cerebral blood flow. Br J Anaesth. 1965;37:225-235.
Hemphill J., et al. Influence of data resolution and interpolation method on assessment of secondary brain insults in neurocritical care. Physiol Meas. 2005;26:373-386.
Humphreys R., Hendrick E., Hoffman H. The head-injured child who “talks and dies”. Childs Nerv Syst. 1990;6:139-142.
Hutchinson J., et al. Hypothermia therapy after traumatic brain injury in children (for the Hypothermia Pediatric Head Injury Trial Investigators and then Canadian Critical Care Trials Group). N Engl J Med. 2008;358:2447-2456.
Iadecola C., Nedergaard M. Glial regulation of the cerebral microvasculature. Nat Neurosci. 2007;10:1369-1376.
Jaeger M., et al. Effects of cerebrovascular pressure reactivity-guided optimization of cerebral perfusion pressure on brain tissue oxygenation after traumatic brain injury. Crit Care Med. 2010;38:1343-1347.
Jagannathan J., et al. Long-term outcomes and prognostic factors in pediatric patients with severe traumatic brain injury and elevated intracranial pressure. J Neurosurg Pediatr. 2008;2:240-249.
Jagannathan J., et al. Outcome following decompressive craniectomy in children with severe traumatic brain injury: a 10-year single-center experience with long-term follow up. J Neurosurg. 2007;106:268-275.
Johnston I., Paterson A. Benign intracranial hypertension. II. CSD pressure and circulation. Brain. 1974;97:301-312.
Jones P., et al. Traumatic brain injury in childhood: Intensive Care time series data and outcome. Br J Neurosurg. 2003;17:29-39.
Kahraman S., et al. Automated measurement of “pressure times time dose” of intracranial hypertension best predicts outcome after severe traumatic brain injury. J Trauma. 2010;69:110-118.
Kan P., et al. Outcomes after decompressive craniectomy for severe traumatic brain injury in children. J Neurosurg. 2006;105:337-342.
Kellie G. The account of the appearances observed in the dissection of two of the three individuals presumed to have perished in the storm of the 3rd, and whose bodies were discovered in the vicinity of Leith on the morning of 4th November, 1821, with some reflections on the pathology of the brain. Trans Med Chir Sci Edinburgh. 1824;1:84.
Kennedy C., Sokoloff L. An adaptation of nitrous oxide method to the study of the cerebral circulation in children; normal values for cerebral blood flow and cerebral metabolic rate in childhood. J Clin Invest. 1957;36:1130-1137.
Koskinen L., Olivecrona M. Clinical experience with the intraparenchymal intracranial pressure monitoring Codman MicroSensor system. Neurosurgery. 2005;56:693-698.
Lang J., et al. Clinical evaluation of intraparenchymal Spiegelberg pressure sensor. Neurosurgery. 2003;52:1455-1459.
Lassen N. Cerebral blood flow and oxygen consumption in man. Physiol Rev. 1959;39:183-238.
Lozier A., et al. Ventriculostomy-related infections: A critical review of the literature. Neurosurgery. 2002;51:170-182.
Luerssen T. Intracranial pressure: current status in monitoring and management. Semin Pediatr Neurol. 1997;4:146-155.
Lundberg N. Continuous recording and control of ventricular fluid pressure in neurosurgical practice. Acta Psychiatr Scand Suppl. 1960;36:1-193.
Lyke K., et al. Ventriculitis complicating use of intraventricular catheters in adult neurosurgical patients. Clin Infect Dis. 2001;33:2028-2033.
Marmarou A., et al. Impact of ICP instability and hypotension on outcome in patients with severe head trauma. J Neurosurg. 1991;75:S59-S66.
Monroe A. Observations on the structure and function of the nervous system. Edinburgh: Creech and Johnston; 1783.
Orliaguet G., Meyer P., Baugnon T. Management of critically ill children with traumatic brain injury. Paediatr Anaesth. 2008;18:455-461.
Padayachy L., Figureaji A., Bullock M. Intracranial pressure monitoring for traumatic brain injury in the modern era. Childs Nerv Syst. 2010;26:441-452.
Paulson O., Strandgaard S., Edvinsson L. Cerebral autoregulation. Cerebrovasc Brain Metab Rev. 1990;2:161-192.
Polderman K., Herold I. Therapeutic hypothermia and controlled normothermia in the intensive care unit: Practical considerations, side effects, and cooling methods. Crit Care Med. 2009;37:1101-1120.
Ratcliff J., et al. Gender and traumatic brain injury: do the sexes fare differently? Brain Inj. 2007;21:1023-1030.
Resnick D., Marion D., Carlier P. Outcome analysis of patients with severe head injuries and prolonged intracranial hypertension. J Trauma. 1997;42:1108-1111.
Robertson C., et al. Prevention of secondary ischemic insults after severe head injury. Crit Care Med. 1999;27:2086-2095.
Rosner M. The vasodilatory cascade and intracranial pressure. In: Miller J., et al, editors. Intracranial pressure. Berlin: Springer; 1986:137-141.
Rosser T., Finkel J., Vezina G., et al. Postural headache in a child with Marfan syndrome: case report and review of the literature. J Child Neurol. 2005;20:153-155.
Ryder H., Espey F., Kimble F. The mechanism of the change in CSF pressure following induced change in the volume of the fluid space. J Lab Clin Med. 1933;41:428-438.
Sahuquillo J., Arikan F. Decompressive craniectomy for the treatment of refractory high intracranial pressure in traumatic brain injury. Cochrane Database Syst Rev. 1, 2006. CD003983
Sahuquillo J., et al. Evaluation of cerebrovascular CO2 reactivity and autoregulation in patients with post-traumatic diffuse brain swelling (diffuse injury III). Acta Neurochir Suppl. 1998;71:233-236.
Schievink W. Spontaneous spinal cerebrospinal fluid leaks and intracranial hypotension. JAMA. 2006;295:2286-2296.
Schievink W., Gordon O., Tourje J. Connective tissue disorders associated with spontaneous intracranial hypotension: a prospective study. Neurosurgery. 2004;54:65-70.
Schievink W., Moser F., Pikul B. Reversal of coma with an injection of glue. Lancet. 2007;369:1402.
Schöning M., Hartig B. Age dependence of total cerebral blood flow volume from childhood to adulthood. J Cereb Blood Flow Metab. 1996;16:827-833.
Shapiro K., Marmarou A. Clinical applications of the pressure-volume index in treatment of pediatric head injuries. J Neurosurg. 1982;56:819-825.
Sorani M., et al. New approaches to physiological informatics in neurocritical care. Neurocrit Care. 2007;6:1-8.
Steiner L., Andrews P. Monitoring the injured brain: ICP and CBF. Br J Anaesth. 2006;97:26-38.
Steiner L., et al. Continuous monitoring of cerebrovascular pressure reactivity allows determination of optimal cerebral perfusion pressure in patients with traumatic brain injury. Crit Care Med. 2002;30:733-738.
Taylor A., et al. A randomized trial of very early decompressive craniectomy in children with traumatic brain injury and sustained intracranial hypertension. Childs Nerv Syst. 2001;17:154-162.
Tomofeev I., et al. Effect of decompressive craniectomy on intracranial pressure and cerebrospinal compensation following traumatic brain injury. J Neurosurg. 2008;108:66-73.
Tontisirin N., et al. Change in cerebral autoregulation as a function of time in children after severe traumatic brain injury: a case series. Childs Nerv Syst. 2007;23(10):1163-1169.
Udomphorn Y., Armstead W.M., Vavilala M.S. Cerebral blood flow and autoregulation after pediatric traumatic brain injury. Pediatr Neurol. 2008;38(4):225-234.
Ursino M., Di Giammarco P. A mathematical model of the relationship between cerebral blood volume and intracranial pressure changes: the generation of plateau waves. Ann Biomed Eng. 1991;19:15-42.
Valadka A., et al. Brain tissue PO2: correlation with cerebral blood flow. Acta Neurochir Suppl. 2002;81:299-301.
Vavilala M., et al. Cerebral autoregulation in pediatric traumatic brain injury. Pediatr Crit Care Med. 2004;5:257-263.
Vavilala M., et al. Gender differences in cerebral blood flow velocity and autoregulation between the anterior and posterior circulations in healthy children. Pediatr Res. 2005;58:574-578.
Vavilala M., et al. Neurointensive care; impaired cerebral autoregulation in infants and young children after inflicted traumatic brain injury: a preliminary report. J Neurotrauma. 2007;24:87-96.
Vavilala M.S., et al. Hemispheric differences in cerebral autoregulation in children with moderate and severe traumatic brain injury. Neurocrit Care. 2008;9(1):45-54.
Vik A., et al. Relationship of “dose” of intracranial hypertension to outcome in severe traumatic brain injury. J Neurosurg. 2008;109:678-684.
Wall M. Idiopathic intracranial hypertension. Neurol Clin. 2010;28:593-617.
Welch K. The intracranial pressure in infants. J Neurosurg. 1980;52:693-699.
White H., Venkatesh B. Cerebral perfusion pressure in neurotrauma: a review. Anesth Analg. 2008;107:979-988.
Wiegand C., Richards P. Measurement of intracranial pressure in children: a critical review of current methods. Dev Med Child Neurol. 2007;49:935-941.
Zauner A., et al. Brain oxygenation and energy metabolism: part I-biological function and pathophysiology. Neurosurgery. 2002;51(2):289-301. discussion 302