Diagnostic Ophthalmic Ultrasound
Ultrasound – past and present
In 1880, the Curie brothers first demonstrated that a difference in electric potential could be created by mechanically pressing opposing surfaces of a tourmaline crystal.1–7 This phenomenon is called the piezoelectric effect. This effect is the basis for ultrasound technology and was first applied in underwater sonar systems during World War II.8 During that same era, the medical community also adopted the use of ultrasound technology. Scientists realized the diagnostic potential of this technology when they were able to use acoustic wavelengths to study the consistency of a material without damaging the material itself.
In 1949, Ludwig used ultrasound to detect gallstones in patients. The first publication on the use of ophthalmologic ultrasound appeared in the medical literature in 1956.9 By the mid-1970s, ophthalmologists were using ultrasound to determine axial length in a clinical setting. These measurements facilitated calculations of intraocular lens power which led to a revolution in cataract surgery.10 Further innovations came when Baum and Greenwood introduced their two-dimensional B-mode image to ophthalmology.11 Soon afterwards, Bronson et al.12 developed a hand-held contact transducer for this type of image acquisition which led to the rapid dissemination of ultrasound devices within ophthalmology clinics. The B-mode images could be used to delineate accurately retinal detachments, vitreous membranes, and choroidal tumors. In the early 1990s, new technology made it possible to image the anterior segment of the eye with devices that captured images at higher frequencies of 35–50 MHz. This improved image resolution four- to fivefold and is still the gold standard for analysis of certain anterior-segment diseases such as ciliary body effusions, infiltrates, and tumors.
Examination techniques
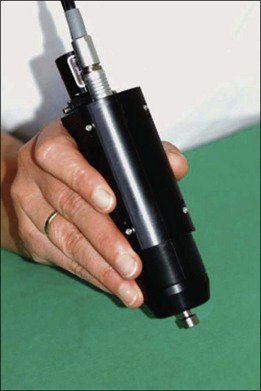
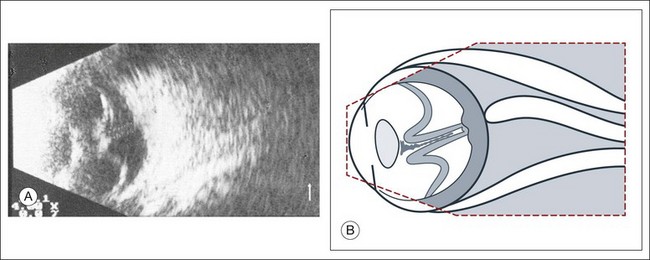
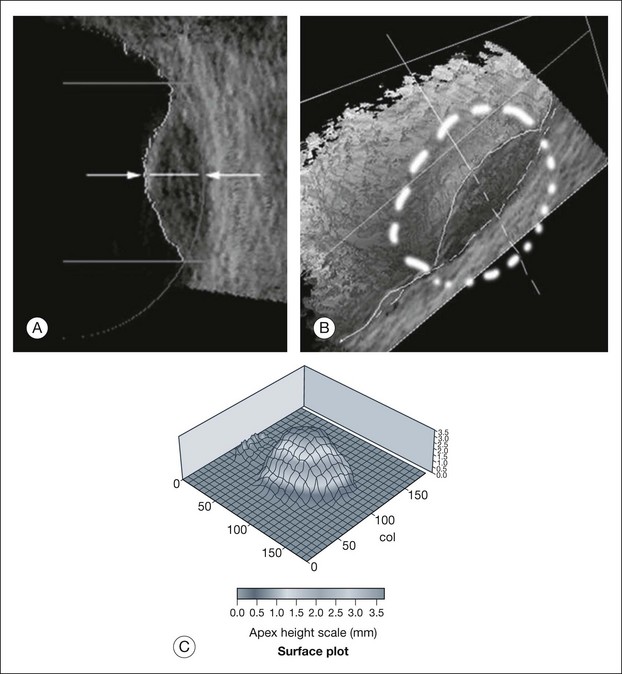
The ultrasound examination is performed with the patient in a reclined position. The frequency of the ultrasound cannot pass through air; therefore, a coupling medium is needed to transmit the sound waves from the transducer to the ocular tissues. A common coupling agent is methylcellulose (Fig. 9.1). The coupling agent is applied to the tip of the transducer probe, which is then placed on the patient’s anesthetized cornea.
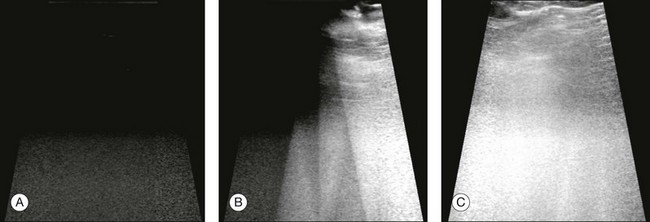
Fig. 9.1 Ultrasound images simulating the effect of transducer (A) without tissue-coupling agent, (B) with partial tissue-coupling agent, and (C) with a complete coupling agent, such as a gel-like contact substance.
B-mode technique
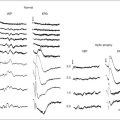
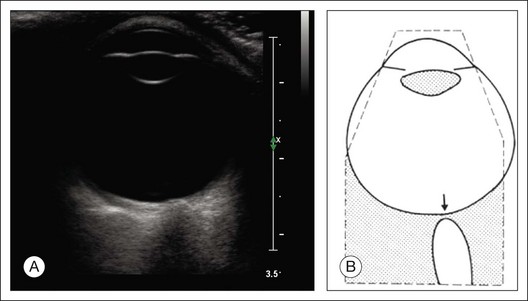
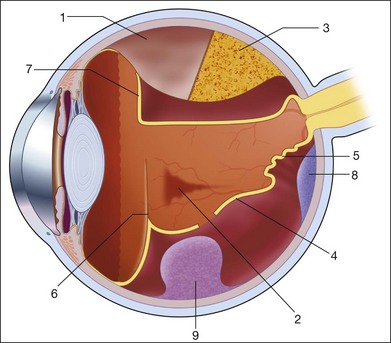
The reflected sound waves are recorded by the device and can be viewed as a two-dimensional image on the screen (Fig. 9.2). The ocular structures can be examined individually. The cornea is characterized ultrasonographically by two separate acoustic interfaces. The anterior chamber appears planoconvex in cross-section. The iris diaphragm cannot be satisfactorily imaged because of the limited lateral resolution power of the normal B-mode. A clear lens is acoustically empty and appears as an ellipsoid structure in axial sections. Similarly, normal vitreous does not give an acoustic signal; however, the presence of a detached posterior vitreous membrane presents an interface that can be imaged by increasing the amplification of the echo signal. The sclera is the most strongly reflecting structure on ocular ultrasonography.
High-frequency ultrasound technique
High-frequency echograms can be used for ultrasound biomicroscopy (UBM). The shorter wavelengths provide better resolution of the anterior structures of the eye, including the cornea, lens, aqueous (Fig. 9.3), and ciliary body (Fig. 9.4).13 High-frequency probes range from 50 to 100 MHz.14–16 The 50-MHz probe provides the best balance between depth and resolution for UBM technique. One limitation of this technique is that the shorter wavelengths, from the higher frequency, have poor depth of penetration. UBM cannot visualize structures deeper than 4 mm from the surface.
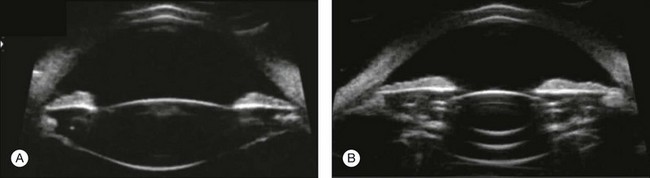
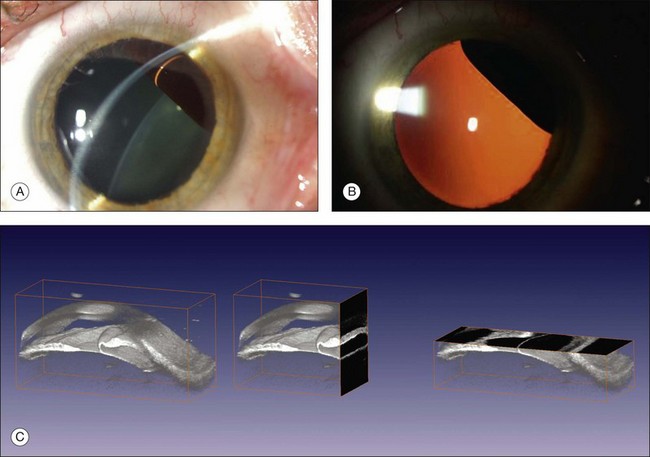
Fig. 9.3 The ultrasound biomicroscopy images of the anterior segment in (A) a phakic and (B) a pseudophakic eye with multiple echo of implant surface.
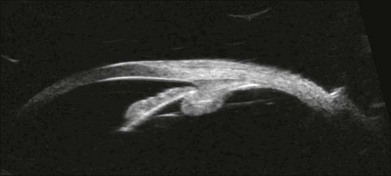
Fig. 9.4 Ultrasound biomicroscopy of the ciliary body.The shorter wavelengths are able to obtain high-resolution images of the anterior structures.
UBM requires immersion of the transducer in a medium to transmit the higher-frequency wavelengths. Saline or methylcellulose can be used as the coupling agent and is held in place over the eye with the use of a custom cup during the examination. UBM is performed through open eyelids in order to obtain a good reflection signal. Images produced by UBM have a resolution of 30–40 µm, which is similar to that seen with a low-power microscope.17
Doppler ultrasound
Doppler images are obtained by using frequency shifts from acoustic reflections to measure movements within a tissue and flow conditions within vessels. These frequency shifts can be observed in tissue volumes of less than 10 mm. False color can be added to the images based on ultrasound frequency to distinguish between higher and lower flow states, which aids in the interpretation of the final result (Fig. 9.5).
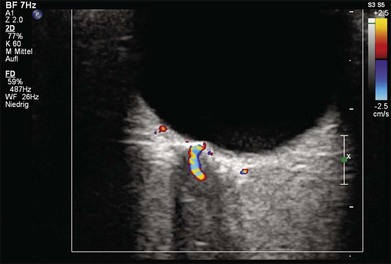
Fig. 9.5 Cross-sectional ultrasonogram through the posterior pole of the eye: color-coded signals from the central retinal artery (red) and the central retinal vein (blue) are displayed inside the optic nerve.
Ultrasound biometry
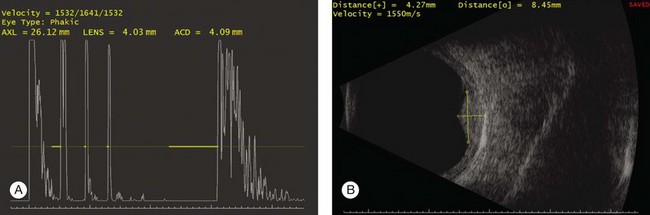
Basic physics formulae can be used to calculate the speed of sound as it passes through various ocular tissues. This number can then be used to calculate distance measurements within the eye (Fig. 9.6). In order to obtain accurate measurements, the specific speed of sound of the different intraocular media, such as the lens, aqueous, and vitreous, must be known.18 These formulae provide precise measurements that can be used to measure intraocular tumors or to deduce the axial length of the globe for intraocular lens power calculations.
Three-dimensional reconstructions
Real-time three-dimensional (3D) and four-dimensional (4D) images are currently used in some medical specialties, including gynecology, obstetrics, and cardiology, but their use in ophthalmology is limited. 3D ultrasonic images can be produced from a series of scan planes.19–22 Silverman et al.23 characterized the ciliary bodies in rabbits and human subjects using 3D high-resolution ultrasound. In the authors’ laboratory a simple extension of the Ultrasound Biomicroscope Model 840 (Humphrey Instruments, Carl Zeiss Group) and VuMax UBM 35/50 (Sonomed) into a user-friendly 3D ultrasonic imaging system was developed (Figs 9.7 and 9.8).24–28
Ultrasound in intraocular pathology
Changes in the shape of the globe
Staphyloma
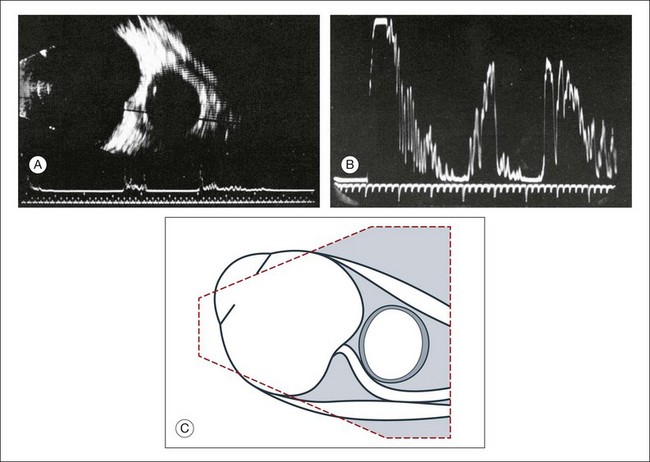
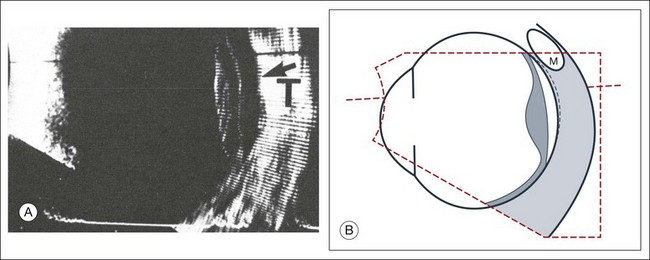
A staphyloma is an abnormal ectasia of the globe that involves uveal tissue. The ectasia typically has a smaller radius of curvature then the normal sclera of the globe. It can be identified on ultrasound by taking axial cross-sectional scans with the transducer probe (Fig. 9.9).
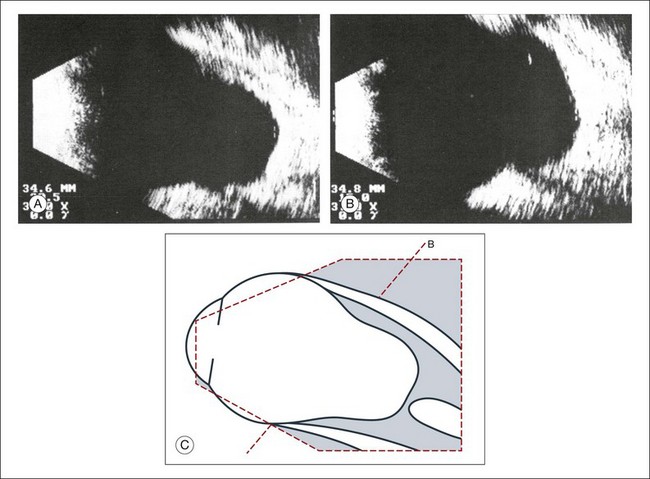
Fig. 9.9 Staphyloma in a highly myopic eye (axial length 34.8 mm). (A) An axial section of the eccentric entrance of the optic nerve can be seen. (B) The misshapen globe is especially well demonstrated on a sectional plane which lies outside the optical axis. (C) Schematic drawing.
Scleral buckle: A scleral buckle can create a posterior scleral deformity that looks similar to a staphyloma. It can be distinguished from a true staphyloma by a careful history or identification of the encircling band around the anterior sclera. Also, if silicone oil was used for repair, the higher index of refraction within the silicone oil can alter the reflectance of the ultrasound wavelengths, which might provide a false impression of globe deformation (Fig. 9.10).
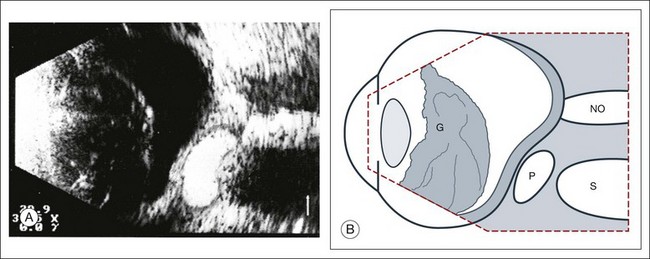
Fig. 9.10 (A) Scleral buckle produced by a silicone sponge explant. After placement of a scleral buckle, the deformity of the globe can be seen in an acoustic cross-section. Silicone explants almost completely reflect the ultrasound. They also cast an acoustic shadow. (B) Schematic drawing. NO, optic nerve; P, explant; S, sound shadow; G, syneretic, densified vitreous.
Microphthalmos
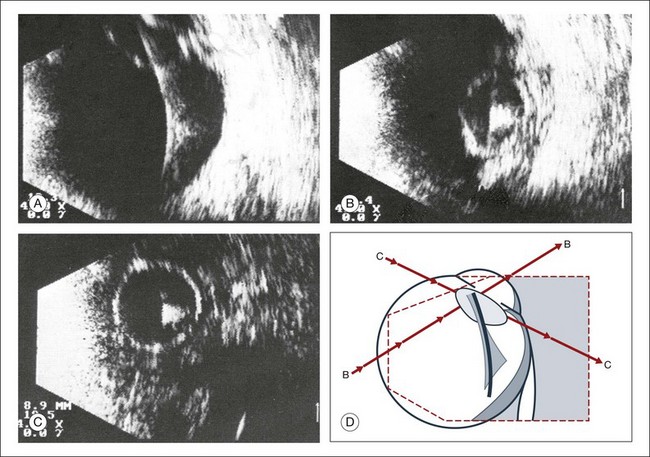
Congenital microphthalmos is an abnormally small eye that can be associated with other ocular abnormalities. The main finding in microphthalmos is axial shortening. This can be identified with A-scan measurements. The B-scan mode can be used to obtain radial and transverse scans to identify abnormalities in the vitreous and posterior segment of the eye, which can also be associated features of microphthalmos. These features include the presence of a coloboma of the retina or optic nerve head, orbital cysts (Fig. 9.11), or persistent hyperplastic vitreous.
Phthisis
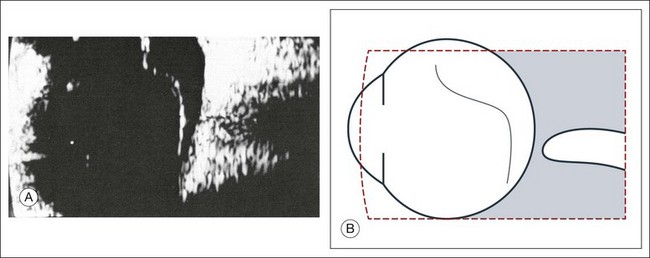
Phthisis is defined as severe atrophy of the globe associated with hypotony. Phthisis is characterized ultrasonographically by a thickened outer scleral wall. Occasionally, calcification or ossification may be observed (Fig. 9.12). This may be due to degenerative processes and from metaplasia of the retinal pigment epithelium (RPE). In advanced cases of phthisis, the sclera and choroid can represent up to 70% of the total volume of the globe. The degree of thickening of the globe in chronic hypotony can be an indication of impending phthisis, but the precise thickness threshold for phthisis formation is unknown.
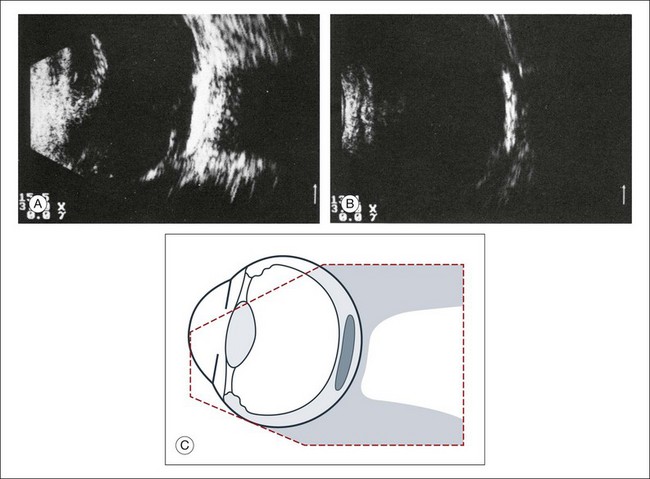
Fig. 9.12 Circumscribed calcification in the ocular wall in advanced phthisis bulbi. (A) Echographically we find highly reflective changes in the ocular wall from calcification or ossification of the choroid which casts a shadow on the soft tissue located posteriorly. (B) These strong echoes can be selectively imaged by reducing the amplification. (C) Schematic drawing.
Vitreous
Echographic examination can provide information on vitreous structure which is particularly useful when visualization of the posterior pole is poor due to anterior media opacities. Ultrasonographic findings allow the examiner to differentiate dot-, strand-, and membrane-like reflections (Fig. 9.13). Table 9.1 summarizes the most frequent conditions associated with pathologic changes in the vitreous.
Fig. 9.13 Vitreous opacities. In maximal amplification, small heterogeneous spots can be seen echographically, even though the vitreous appears optically clear (left). They act as dot-like reflectors.
Vitreous degeneration
Vitreous syneresis can appear as dot-like reflections which can be more pronounced in myopia or senile vitreous. During a symptomatic posterior vitreous detachment, the B-mode echo may demonstrate various stages of vitreous syneresis and may reveal the remaining adhesions of the hyaloid membrane to the retinal surface (Fig. 9.14).
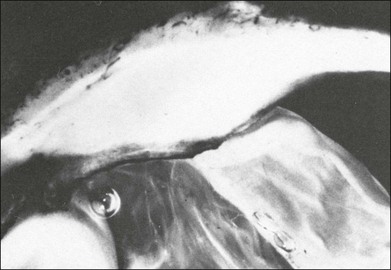
Asteroid hyalosis
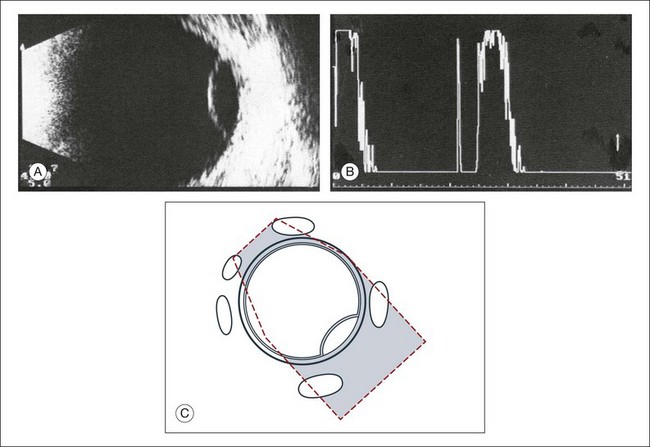
The calcium-containing lipids of asteroid hyalosis are suspended in the vitreous framework and act as distinctive sound reflectors (Fig. 9.15). They can demonstrate the dynamics of vitreous movements.
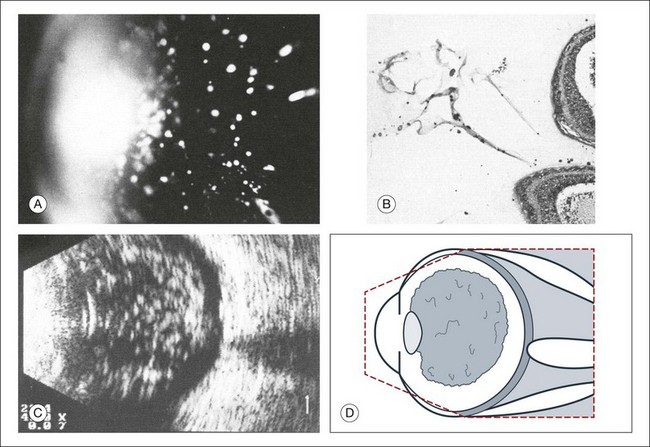
Fig. 9.15 Asteroid hyalosis. (A) Slit-lamp microscopic photograph of the anterior vitreous space. (B) Histological image of asteroid hyalosis shows the calcium crystals adherent to the vitreous scaffold. (C) B-scan cross-section of the crystals, which represent good reflectors for the ultrasound. There is always an echo-free retrovitreal space seen near the ocular walls. (D) Schematic drawing.
Synchysis scintillans: In synchysis scintillans the vitreous is filled with cholesterol crystals. Unlike asteroid hyalosis, these crystals are not suspended within the vitreous but instead float freely in the vitreous space. When the globe moves, the crystals appear in the center of the vitreous body. This clinical picture may resemble asteroid hyalosis, but after a few seconds the cholesterol crystals will sink toward the bottom of the cavity. A-mode images display characteristic flickering spikes from the reflections of these crystals.
Persistent and hyperplastic primary vitreous
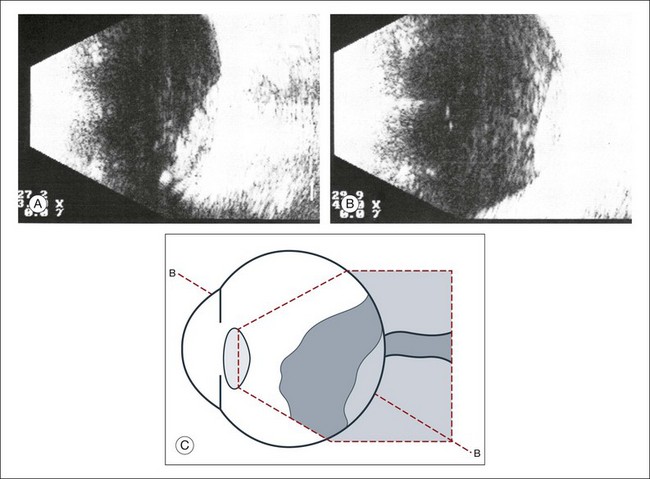
The primary vitreous contains the tunica vasculosa lentis, which is part of the fetal vasculature system. During development, the tunica vasculosa lentis emanates from the optic nerve head and supplies the posterior lens. This structure should involute prior to birth. Failure of the primary vitreous to regress fully is termed persistent hyperplastic primary vitreous. As mentioned earlier, this can be associated with microphthalmos and cataract formation in the newborn. The condition persistent hyperplastic primary vitreous can be ultrasonographically characterized by two features. The first is a strand of membrane that extends between the posterior surface of the lens and the area of the optic nerve head. The second is the reduced axial length of the globe from microphthalmos on ultrasound biometry (Fig. 9.16). If the anomaly is only mild, the lens may be clear at birth but may become cataractous when the posterior lens capsule ruptures.
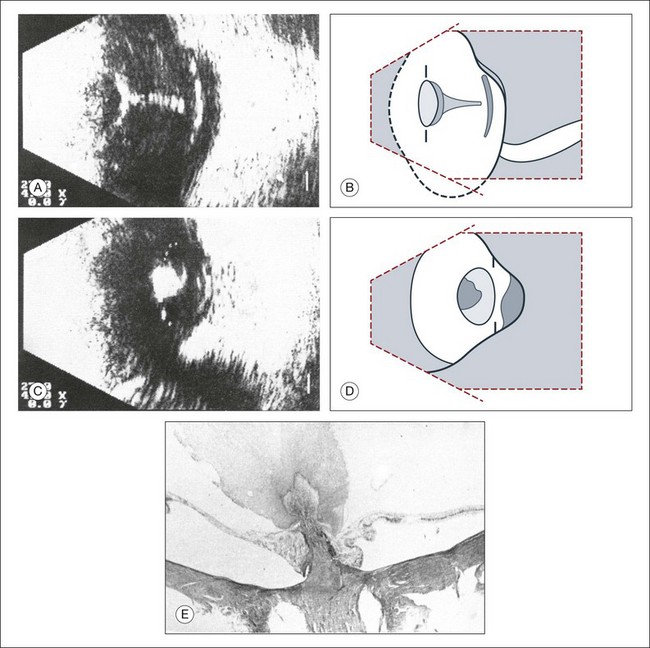
Fig. 9.16 (A–D) Posterior polar cataract in persistent hyperplastic primary vitreous (PHPV). An ultrasonographically demonstrable strand attached to the posterior lens pole points is suspicious for PHPV (A). Frontal plane taken temporally with maximal adduction of the globe (C). (B,D) Schematic drawings. The dark, hatched parts correspond to the opaque area of the posterior cortex and posterior capsule in a child with severe PHPV. (E) Histological section of PHPV as seen at optic nerve head with loupe magnification.
Vitreous hemorrhages
An acute vitreous hemorrhage is an important indication for ultrasonography. Acute hemorrhages can fill the vitreous cavity with small opacities from the particles of the red blood cells. These opacities usually accumulate after a few hours in the lower circumference of the vitreous base (Fig. 9.17).
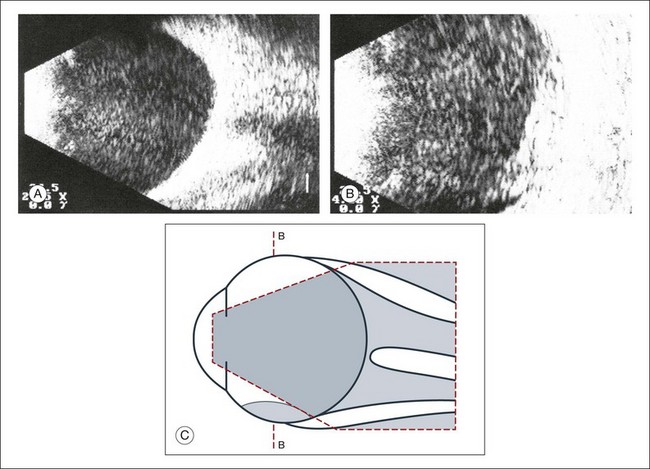
Fig. 9.17 (A) Conspicuous bleeding into syneretic vitreous; erythrocytes within the vitreous create reflective opacities. A static picture may give the impression of a solid lesion. (B) After a few hours the opacities usually accumulate in the lower aspect of the vitreous cavity. (C) Schematic drawing.
If a detachment of the posterior hyaloid membrane precedes a vitreous hemorrhage, the erythrocytes frequently precipitate on to a vitreous strand (Fig. 9.18). This strand may be responsible for the development of a retinal tear, and its traction can be demonstrated directly in acoustic sectioning (Fig. 9.19). A circumscribed thickening of the ocular wall in cross-section may indicate the presence of a retinal operculum (Fig. 9.20). This area should be localized echographically and then carefully scrutinized with ophthalmoscopy if possible.
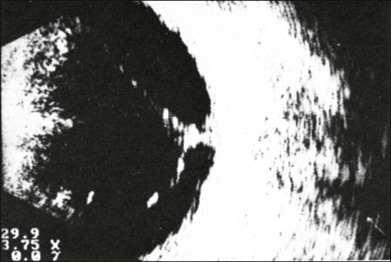
Fig. 9.18 Fresh vitreous hemorrhage. In a cross-sectional echogram the vitreous framework converges towards the ocular wall. Blood precipitates increase the acoustic reflectivity of the vitreous. Traction has to be assumed where the vitreous is in contact with the ocular wall.
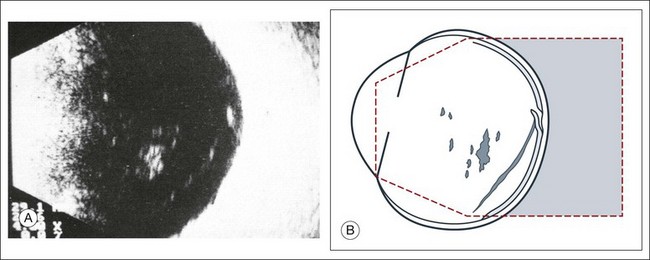
Fig. 9.19 (A) Recent vitreous hemorrhage. The low reflecting membranes float freely with ocular movement. A newly formed horseshoe tear may be present at their connection point to the wall. (B) Schematic drawing.
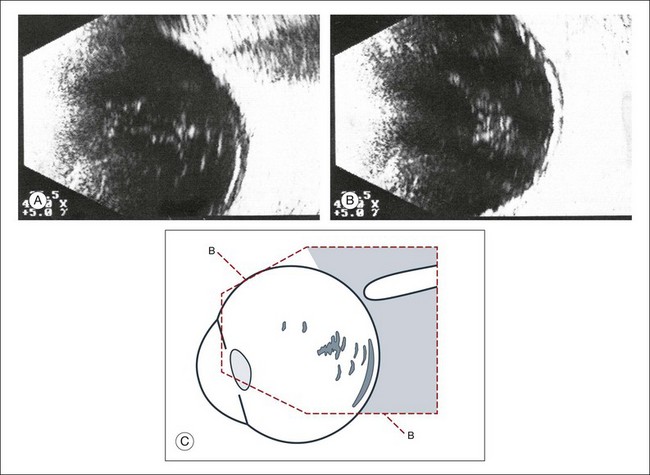
Fig. 9.20 (A,B) Recent vitreous hemorrhage. Erythrocytes have precipitated on to the partly detached posterior hyaloid membrane, increasing its acoustic reflectivity. (C) Schematic drawing.
In larger hemorrhages, the blood can also disseminate into multiple pre-existing vitreous compartments. In the early phase of this process, the erythrocytes will collect in the retrovitreal space (Fig. 9.21). The retrovitreal space may completely clear after a few days or weeks due to its high fluid exchange rate; however, blood on the vitreous framework absorbs much more slowly (Fig. 9.22).
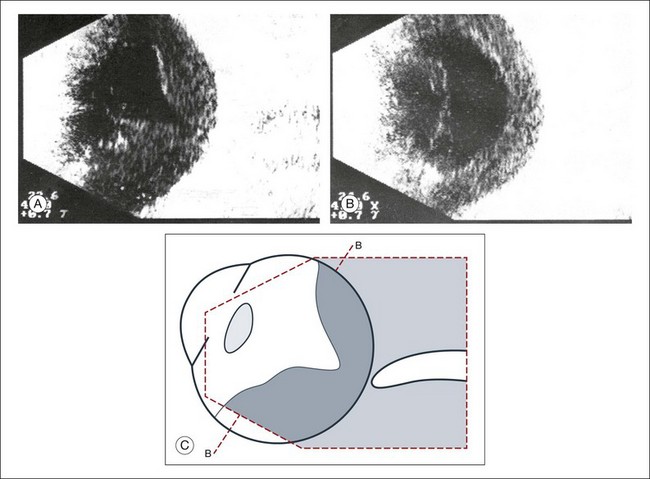
Fig. 9.21 (A) Vitreous hemorrhage with posterior vitreous detachment emphasizing the retrovitreal space. (B) In the early stage after the hemorrhage, erythrocytes accumulate in the retrovitreal space. They may ensheath the part of the vitreous that was free of blood and had a normal structure. (C) Schematic drawing.
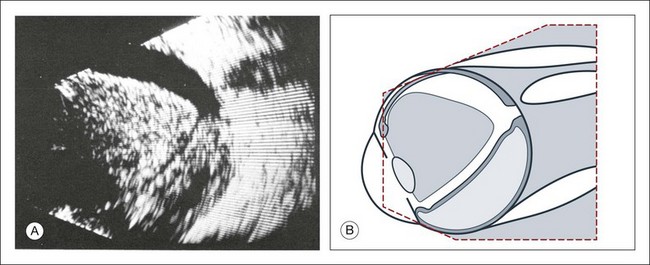
Fig. 9.22 The retrovitreal space may completely clear after a few days or weeks due to its high fluid exchange rate; however, blood on the vitreous framework or located subretinally absorbs much more slowly (A). (B) Schematic drawing.
Vitreous hemorrhage from neovascularization: Hemorrhages that develop from proliferative changes in patients with diabetic retinopathy and retinal neovascularization will always be accompanied by pathologic changes in the vitreous. Vitreous membranes tent rectilinearly between the adhesions to the retina. The normal aftermovements that should occur in the vitreous after eye movements are extinguished in the presence of peripheral neovascular tufts. The vitreous tufts create adhesions that encircle the posterior pole. This is an ominous sign, which is indicative of early retinal tractional detachment from these circular adhesions (Fig. 9.23). Choroidal neovascularization from age-related macular degeneration will have hemorrhage in multiple layers of the eye (Fig. 9.24).
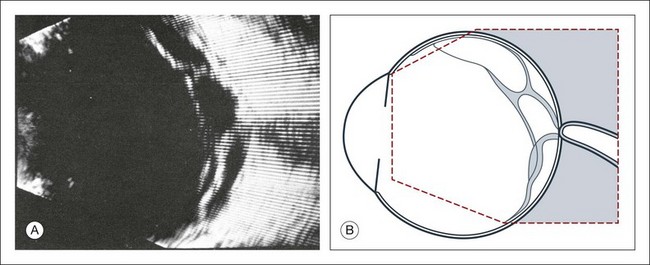
Fig. 9.23 (A) Beginning traction detachment at the posterior pole with vitreous contraction and proliferative diabetic retinopathy, which is hidden behind a diffuse vitreous hemorrhage. A springboard-like, taut, detached hyaloid membrane is still adherent to the retina at the posterior pole and has led to a traction detachment in several places. (B) Schematic drawing.
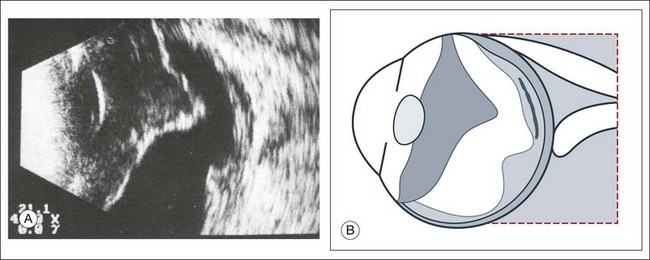
Fig. 9.24 (A) Extensive vitreous hemorrhage from disciform macular degeneration. The blood dissipates into the preretinal or intrachoroidal space, into the area of the macular lesion and into the detached vitreous. The retrovitreal space is echo-free because of its high fluid exchange. (B) Schematic drawing.
Terson syndrome
Terson’s sign is a multilayered, intraocular hemorrhage at the posterior pole that typically occurs after blunt trauma to the head. This is usually accompanied by a subarachnoid hemorrhage. If the posterior hyaloid membrane is still attached, the preretinal bleeding will slowly diffuse into the formed vitreous (Fig. 9.25). This can damage the underlying retina and may be an indication for an early vitrectomy.
Intraocular infections
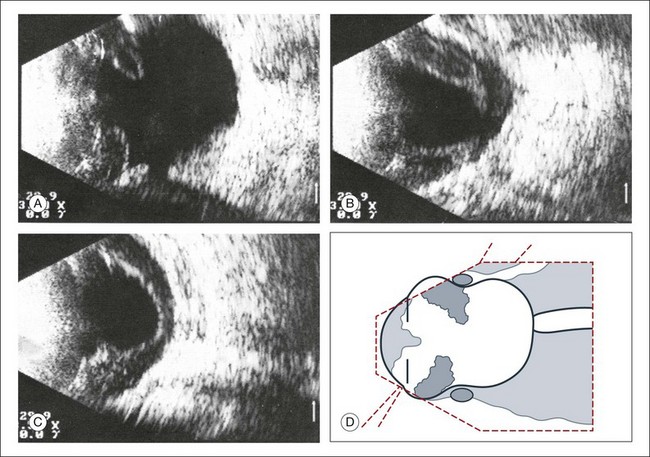
Ocular infection that extends toward the anterior segment or results in a hypopyon formation will have changes within the anterior vitreous space that are demonstrable on ultrasound. A thickening of the retina or choroid can be seen if the inflammation penetrates to the outer layers of the globe (Fig. 9.26). After only a few hours, these changes may involve the entire vitreous body (Fig. 9.27). If panophthalmitis follows a perforating injury, ultrasound evaluation can detect a local reaction at the entrance point of the infection (Figs 9.28 and 9.29).
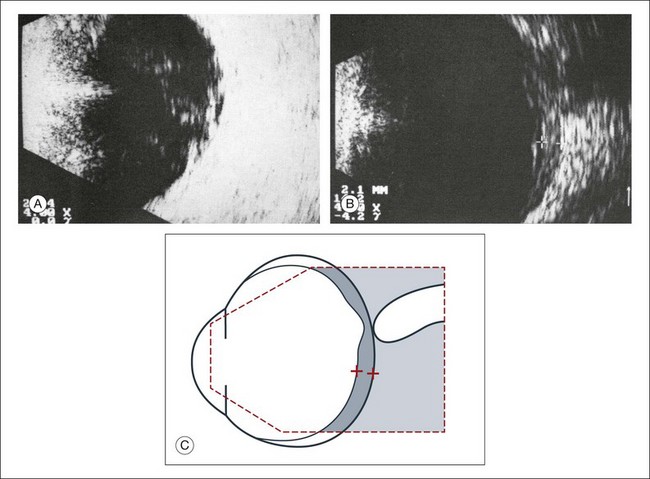
Fig. 9.26 (A,B) Panophthalmitis after an intraocular operation. Widening of the ocular wall to about 2.1 mm indicates inflammatory choroidal infiltrates. (C) Schematic drawing.
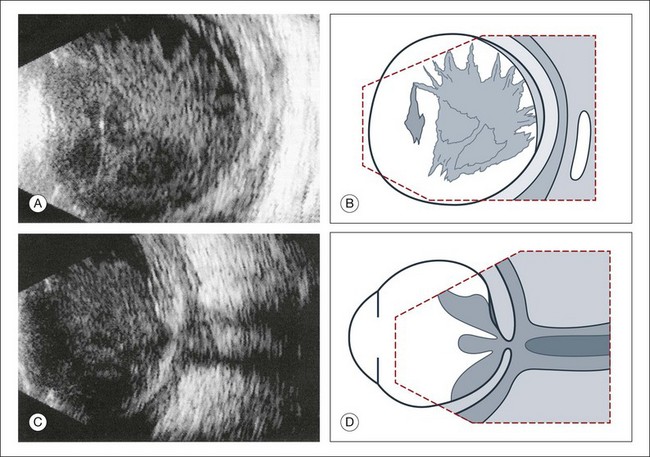
Fig. 9.27 Vitreous abscess that caused a bacterial orbital inflammation. (A) B-scan ultrasonography demonstrates a highly reflective vitreous body which is partly detached from the retina. (B) Schematic drawing of this image. (C) Posterior pole shows infiltration of Tenon’s space and widening of the optic nerve sheath. (D) Schematic drawing.
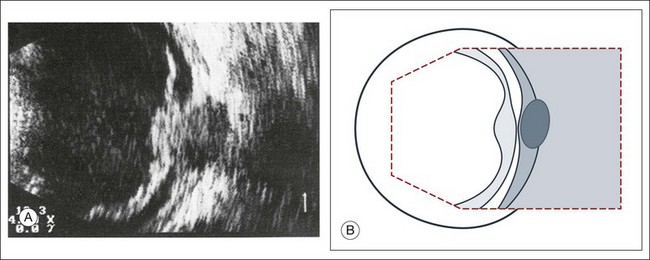
Fig. 9.28 Posttraumatic intraocular infection starting from the side of perforation. (A) B-scan ultrasonography demonstrates localized thickening of the ocular wall indicating the side of the perforation. The vitreous is filled with inflammatory cells, the posterior hyaloid is thickened, and there is a localized retinal detachment. (B) Schematic drawing.
Vitreous inflammation
Inflammatory and hemorrhagic vitreous changes cannot be differentiated on the basis of ultrasonographic findings alone. Both conditions may cause densification of pre-existing vitreous structures with subsequent shrinkage of the vitreous; tractional detachment of the retina can occur, especially if there are postinflammatory adhesions between the vitreous and retina. In chronic uveitis, an early and complete posterior vitreous detachment can occur and cause the formed vitreous to shrink and form a frontal membrane that extends across the vitreous base (Fig. 9.30). If this membrane adheres to the ciliary body, it may detach the ciliary body and produce subsequent ocular hypotony.29
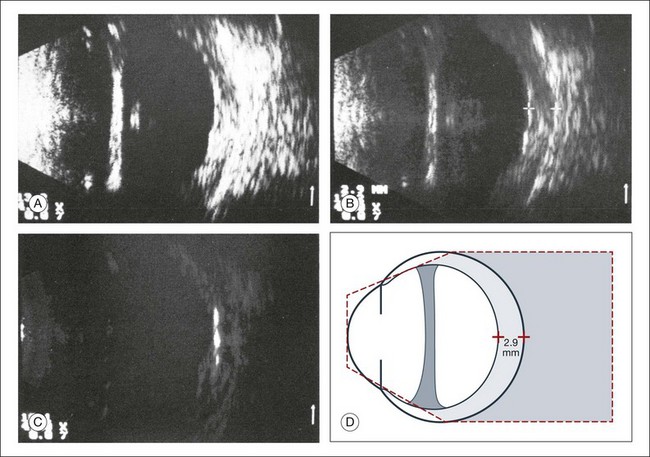
Fig. 9.30 Phthisis oculi in chronic panuveitis. (A) The vitreous has shrunk to form a frontal membrane of high acoustic reflectivity. The ocular wall is widened to 2.9 mm. (B) Using linear amplification, the various layers of the ocular wall have become clearly outlined. (C) Isolated areas of the ocular wall show high acoustic reflectivity, which indicates calcification of the choroid or in the sclera. (D) Schematic drawing highlighting wall thickness.
Intraocular foreign bodies
Intraocular foreign bodies induce a change in echo reflectivity which is based on the composition of the material (Figs 9.31–9.33). The change in the reflectivity on the image should be a helpful clue in the localization of the foreign body within the globe; however, this is not always the case since the foreign bodies can also create signal artifact on echograms that can make identifying their exact location difficult. For example, large metallic foreign bodies have significant artifacts from strong reflected signals that can distort their true location. In addition, foreign bodies from trauma can be associated with air bubbles within the vitreous that can mask the presence of the nearby foreign body within the acoustic shadow (Fig. 9.34).
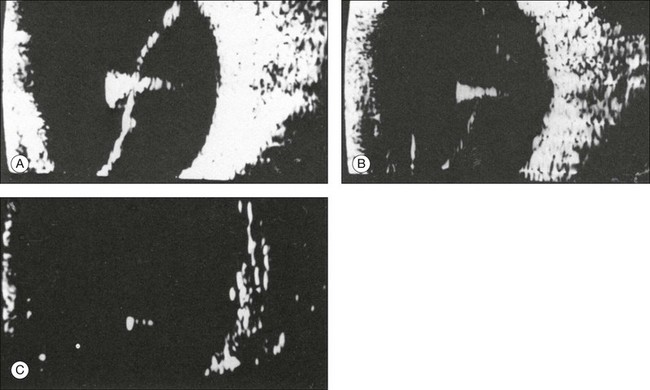
Fig. 9.31 (A) Metallic foreign body in the vitreous with total retinal detachment. (B) The foreign-body spike is characterized by its high amplitude and repetitive echoes. (C) With reduced sensitivity the foreign body can almost be imaged as an isolated echo.
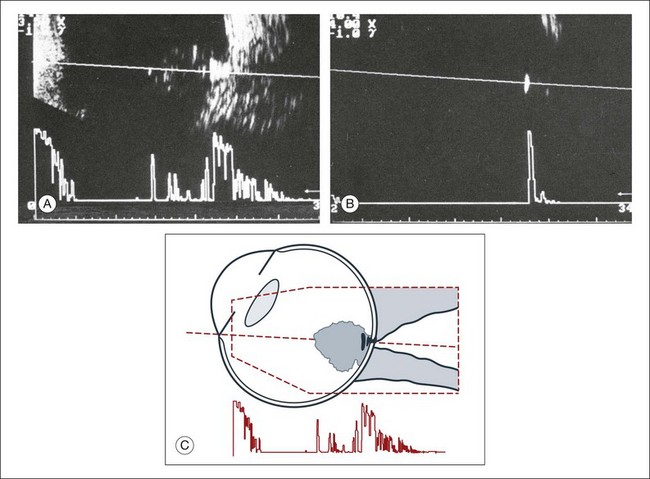
Fig. 9.32 Acute perforating injury with intraocular metallic foreign body. (A) Ultrasonographically, there is a typical foreign-body echo with repetitive spikes in the vitreous about 2 mm in front of the ocular wall. (B) Decreasing the amplification displays the foreign-body echo as the only intraocular structure remaining visible on ultrasonography. (C) Schematic drawing.
Retina
Acute retinal detachment
In a retinal detachment, the neurosensory retina separates from the RPE layer. This development allows fluid to collect in the potential space between these two layers. The detached neurosensory retina appears as a membrane in the vitreous space on ultrasound. Partial retinal detachments may still maintain connections to the optic nerve or ora serrata since these areas have the strongest connections to the retina. Identification of these connections on ultrasound can distinguish a partial retinal detachment from a vitreous or choroidal detachment, which would have different anatomical connections (Fig. 9.35). A complete retinal detachment can form a funnel shape due to the retina folding in the center of the globe.
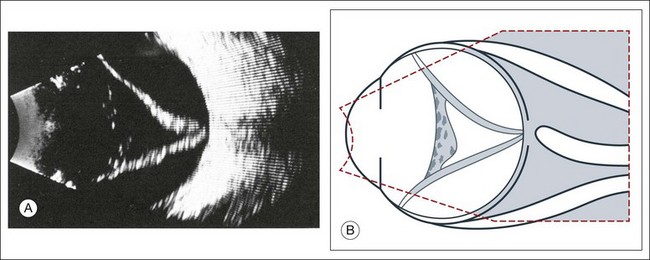
Fig. 9.35 (A) Complete retinal detachment extending between the optic nerve head and the ora serrata. Heterogeneous material in the anterior vitreous is a sign of vitreous reaction. (B) Schematic drawing.
Complicated retinal detachments with severe pathology can make it difficult to identify all the structures on ultrasound (Fig. 9.36). For example, in severe trauma cases that are associated with proliferative vitreoretinopathy or in advanced diabetic disease associated with proliferative retinopathy, the membranes formed within the vitreous can appear similar to a true retinal detachment. The following questions can guide the ultrasound examination of the retina in order to differentiate these common causes of vitreous membranes:
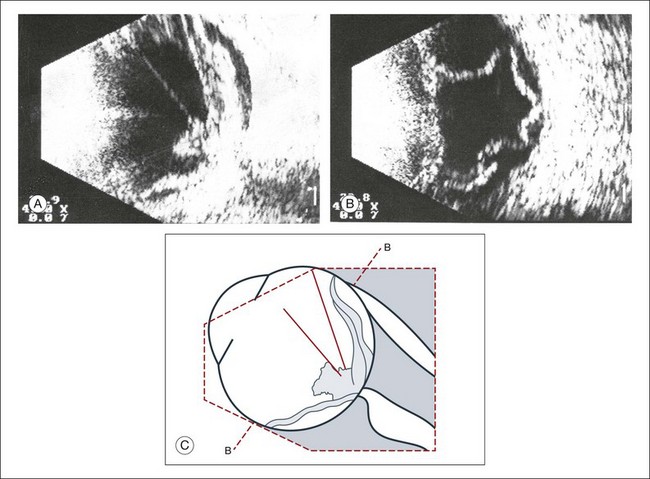
Fig. 9.36 Development of a traction detachment with massive vitreous retraction. (A) Flat subtotal retinal detachment with folds; rigid vitreous strands. (B) In a frontal section, multiple contacts of the retina to the ocular wall can be demonstrated. (C) Schematic drawing.
• What is the spatial extent of the membrane? At which point is there contact with the ocular wall?
• What is the shape of a cross-section of the membrane, especially in the optic nerve head area?
• How great is the difference of the spike from the membrane in question to the scleral standard or to the echo from a standard reflector?
These questions should be clarified in the following way:
1. What is the spatial extent of the membrane? At which point is there contact with the ocular wall? A recent rhegmatogenous retinal detachment can be characterized in cross-section by a membranous structure of high reflectivity that converges in an acute angle toward the ocular wall. If the imaged acoustic section is centered on the optic nerve head, then the border of the detached retina will be captured as it connects to the nerve head (Fig. 9.37). If the membrane passes over the optic nerve head instead of connecting to the optic nerve in the echo image, it is not a retinal detachment (Fig. 9.38). This feature can help identify retinal membranes form vitreous membranes.
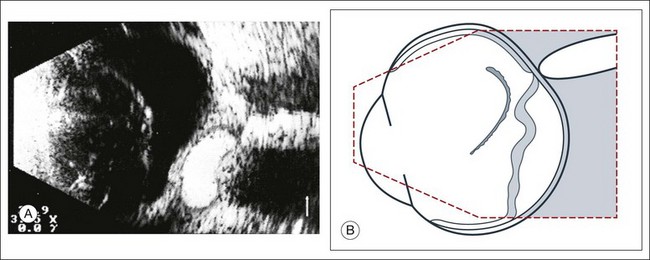
Fig. 9.37 (A) Sectoral retinal detachment. In acute retinal detachment, short aftermovements appear when the globe moves. These aftermovements extend like a whiplash from the area of the contact to the ocular wall. (B) Schematic drawing.
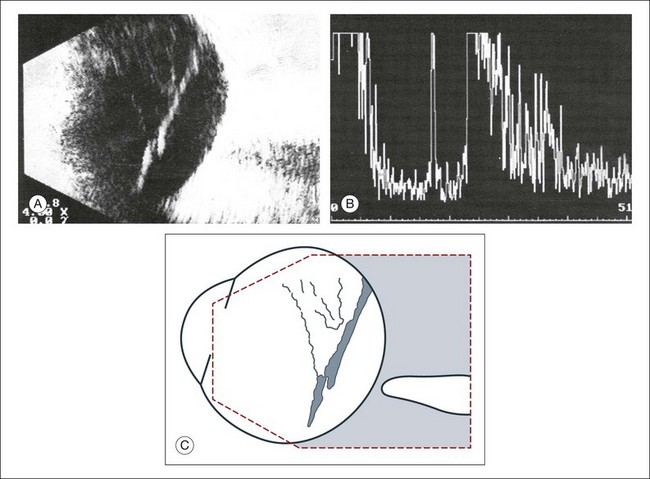
Fig. 9.38 (A,B) Detached posterior hyaloid membrane. Vitreous membranes may reach an acoustic reflectivity similar to that of the retina seen on A-scan. A retinal detachment can be excluded if the membrane tents over the posterior pole without reaching the optic nerve head. (C) Schematic drawing.
2. What is the shape of a cross-section of the membrane, especially at the optic nerve head? In order to appreciate the shape of a retinal detachment, the performance of sonographic examinations in various planes is indicated. First, in a sagittal section, a total detachment looks like an isosceles triangle which is open toward the anterior segment (the sides of which may be unevenly tented: Fig. 9.35). Next, frontal-plane sections should be examined with the disc centered in the image. These sectional plans are obtained at a right angle to the sagittal. The frontal planes can be examined best with the transducer probe placed in the temporal part of the lid fissure when the globe is maximally adducted. In these images, the conical shape of the detachment will appear oval to nearly circular in the various sections (Fig. 9.39).
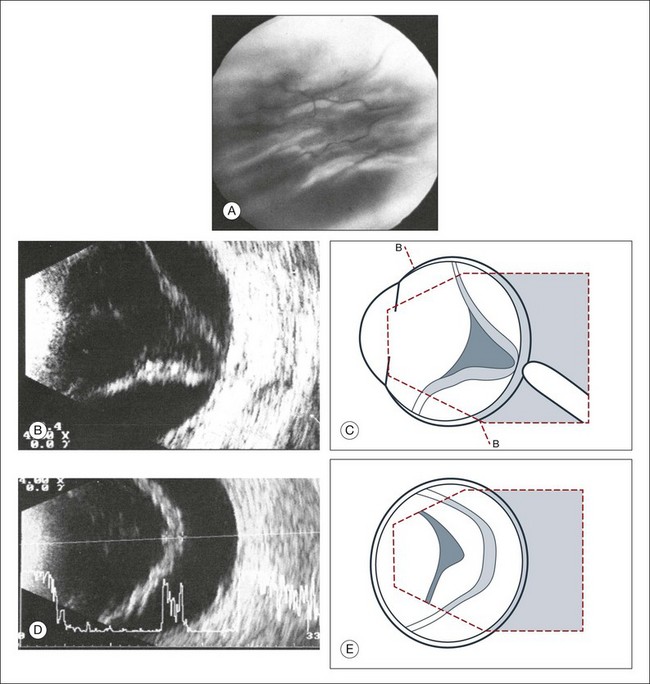
Fig. 9.39 (A) Clinical fundus photograph of recurrent retinal detachment. (B–E) Recurrent retinal detachment with massive vitreous retraction. (B) Axial cross-sectional echogram. The amplitudes of the aftermovements decrease. High-frequency flicker of the taut membrane appears after the eye changes position. (D) Frontal section toward 6 o’clock. An epiretinal membrane of the retinal surface appears echographically as an apparent widening of the retina. (C,E) Schematic drawings.
3. Which aftermovements occur? Dynamic ultrasound can be obtained with patient participation. The quality of tissue movement at the end of the ocular saccade, or the aftermovement of the tissue, can be used to distinguish vitreous tissue from retina tissue. An acute rhegmatogenous retinal detachment shows aftermovements of short duration that extend with a whiplash effect from the area where the retina is still attached, which is usually the optic nerve head. The amplitudes of these aftermovements are smaller and less extensive than those seen in the sinusoidal movements of a vitreous hemorrhage or in asteroid hyalosis.30
4. How great is the difference of the spike from the membrane in question to the scleral standard or to the echo from a standard reflector? Quantitative ultrasonography can detect a difference in the echo of the retina compared to that of the sclera, extending from 8 to 15 db.31 Unfortunately, these measurements provide only guidelines. Well-developed connective tissue membranes may show reflection properties quite similar to those of a detached retina. In complicated cases it may be difficult to correlate an isolated A-spike to the multiple membrane structures as they appear on B-mode.
Chronic retinal detachment
A few weeks after a retinal detachment develops, changes in the proliferation of Müller cells and astrocytes will lead to alterations in the mechanical properties of the detached retina. The massive periretinal proliferation of these cells creates a decrease in the aftermovement amplitude of the retina (Fig. 9.40). The large excursions are replaced by a high-frequency flicker and the retina may appear thickened. After a long-standing retinal detachment, cyst-like cavities within the detached retina can be seen on ultrasound (Fig. 9.41). A long-standing detachment can also result in a funnel-shaped retinal detachment. The first step in this process is the proliferation of the epiretinal connective tissue that causes the vitreous to contract. This stage can be identified on ultrasound by the presence of new acoustic interfaces, which are seen as increased vitreous signals that surround the detached retina (Fig. 9.42). The vitreous shrinks, which creates a narrowing of the retinal cavity, which typically begins to narrow anterior to the optic nerve head and continues to the posterior lens. Frontal “cyclitic membranes” can often be seen early, extending from the vitreous base (Fig. 9.43). Next, the peripheral retina is pulled closer to this membrane until the retinal detachment does not show any recognizable cavity of the original funnel. In frontal sections the shrunken retina appears as a strand, only a few millimeters in diameter (Fig. 9.44). Occasionally, a few retinal folds can be observed.
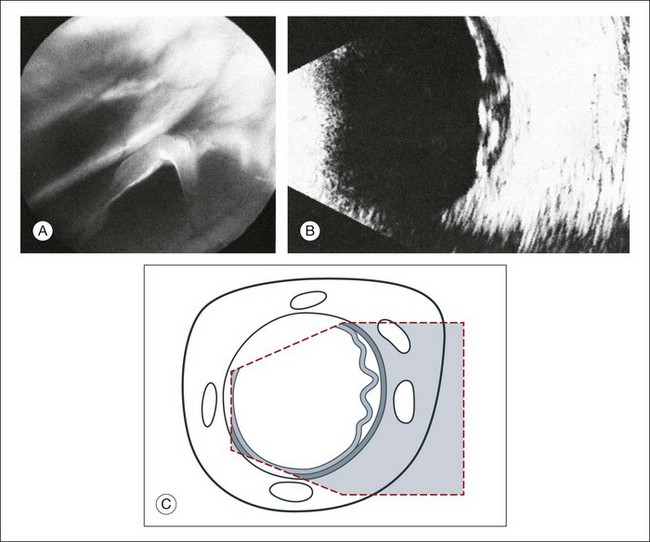
Fig. 9.40 Massive periretinal proliferation with large retinal folds. (A) Ophthalmoscopic picture of large horseshoe tear. (B) The rigid, fixed retinal folds are echographically demonstrable. (C) Schematic drawing.
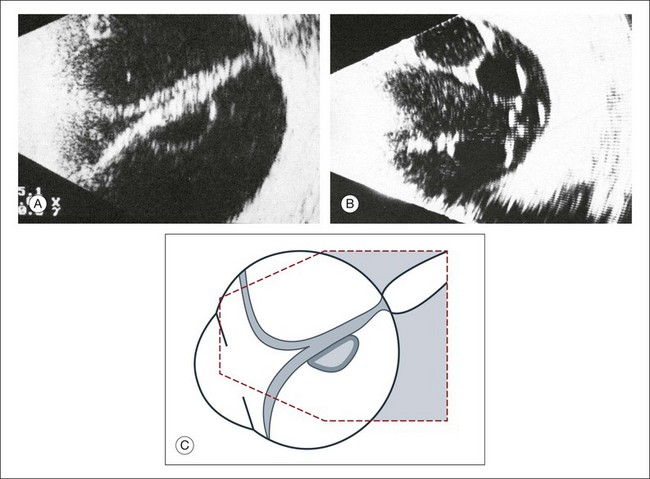
Fig. 9.41 Long-standing total retinal detachment with macrocyst. Intraretinal cyst in the axial area seen on cross-sectional ultrasound (A) and frontal plan (B). The cysts form from coalescing microcystoid degeneration of the retina in chronic detachments. These cavities will not be involved in secondary vitreous changes, such as vitreous hemorrhages or cholesterol deposits. (C) Schematic drawing.
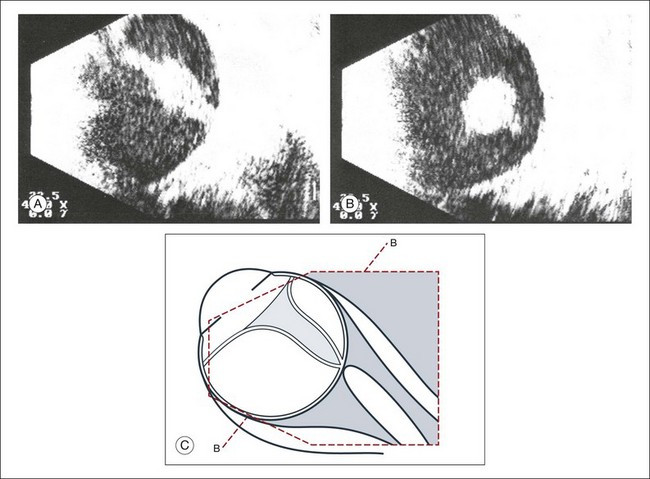
Fig. 9.42 (A,B) Long-standing retinal detachment with increased connective tissue in the vitreous tunnel. Free-floating opacities accumulate in the subretinal space (possibly representing hemorrhage or cholesterol crystals). (C) Schematic drawing.
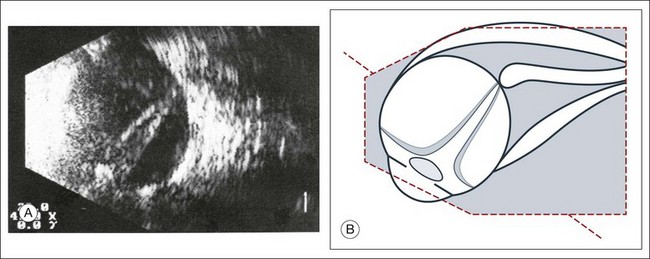
Fig. 9.43 (A) Long-standing total retinal detachment. A tube-like remnant of the vitreous within the shrunken retinal tunnel can be seen. (B) Schematic drawing.
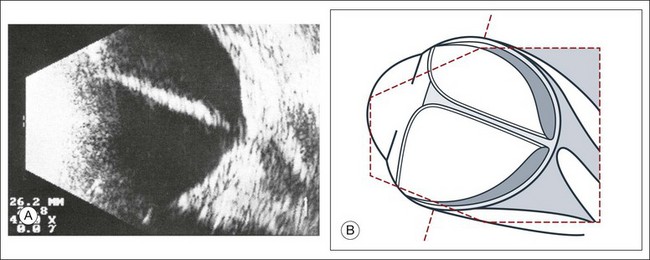
Fig. 9.44 (A) Long-standing retinal detachment with completely obliterated vitreous space. In sagittal sections the extensive adhesions of the retinal leaves produce various acoustic sections. (B) Schematic drawing.
In addition to the above findings, the consistency of the subretinal space can change with increased duration of the detachment. The protein content will increase and may precipitate out of the subretinal fluid. This can be seen as free-floating opacities on ultrasound (Fig. 9.45). If these opacities appear as static particles and not free-floating, then intraocular tumor has to be excluded. Under these circumstances, ultrasonography provides a vital role in obtaining a diagnosis by distinguishing the freely moving protein precipitation in long-standing detachments from the fixed hyperechoic particles of malignant tumors.
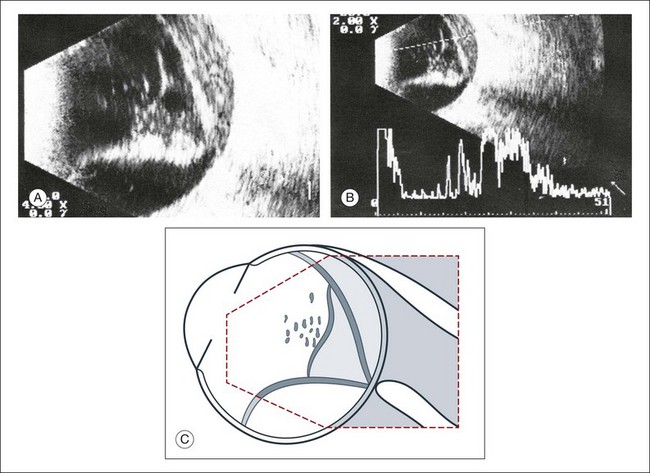
Fig. 9.45 (A,B) Long-standing retinal detachment with floating opacities in the subretinal space. The densifications in the vitreous space indicate a tendency for shrinkage. (C) Schematic drawing.
Retinoschisis: Retinoschisis is a splitting within the neurosensory layer of the retina. This condition frequently occurs in the inferotemporal quadrant. A cross-section echogram can display a membranous structure in the far periphery that has a convex border facing the vitreous (Fig. 9.46). In this situation, clinical correlation is important in order to distinguish the retinoschisis from a retinal detachment since these two entities can appear identical on static ultrasound. However, use of dynamic ultrasound and evaluation of the aftermovements can show that the aftermovements in retinoschisis are less conspicuous than in a retinal detachment. This is because in retinoschisis the retina is attached and there are no vitreous adhesions.
Coats disease: Coats disease is an exudative retinopathy most commonly seen unilaterally. It mainly affects males in the first decade of life. A clinical diagnosis can be made if aneurysmal malformations of retinal vessels and yellowish subretinal plaques are associated with an exudative detachment. Coats disease should be differentiated from retinoblastoma, which can have a similar clinical appearance in this patient group. Ultrasound can differentiate these conditions with careful evaluation of the subretinal space. Retinoblastoma typically shows calcifications with high reflectivity. The exudative detachment that is seen in Coats disease has different echo quality due to the subretinal cholesterol deposits (Fig. 9.47). In Coats disease, the crystals floating in the subretinal space are seen as floating opacities similar to the appearance of crystals in synchysis scintillans. They appear in an A-mode echogram as flickering spikes.32 On B-mode images these high-frequency motions of the echo spikes produce a blurred pattern in the subretinal space.
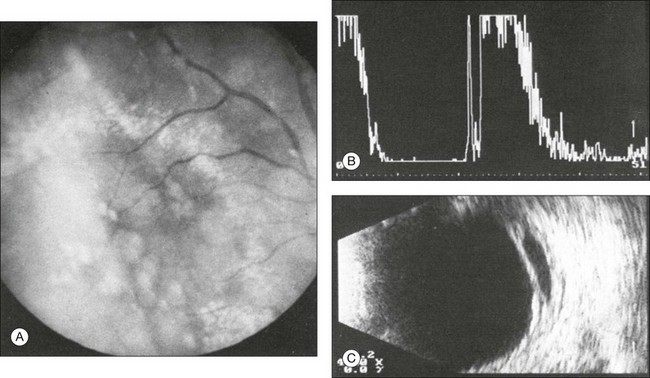
Fig. 9.47 (A) Fundoscopic clinical photo of Coats disease. Circumscribed, strongly reflecting retinal detachment in Coats disease. (B) The A-scan shows the high-intensity signal from the strongly reflecting membrane of the retinal detachment depicted in the image. (C) The B-scan shows the retinal detachment in association with floating opacities in the subretinal space that corroborate the diagnosis of Coats disease.
Retinoblastoma
Retinoblastoma is a life-threatening tumor that can present in children as isolated leukocoria or with a constellation of other ocular findings. Some findings can mimic benign ocular conditions. Since treatment of retinoblastoma can include ocular enucleation, making the appropriate diagnosis is critical. Ophthalmoscopy should be performed but sometimes is limited if there is cataract, hypopyon, vitreous seeding, or opacity. Ultrasound plays a critical role in these patients, especially since certain features on echography can be pathognomonic for retinoblastoma. The presence of calcium deposits in retinoblastoma lesions produces a high sound reflection that creates an acoustic shadow on more distant structures such as the sclera (Fig. 9.48). The calcium deposits can be selectively demonstrated on the image by decreasing the amplification in the cross-section echogram until they are the only remaining tissue structure visible on the screen (Fig. 9.49). In some retinoblastomas the calcium appears only in a few areas, but any calcification is indicative of tumor burden and is an important feature for the diagnosis. In some cases, ultrasound can also define extraocular tumor extension in retinoblastoma and is of great prognostic and therapeutic importance. Additional imaging to supplement ultrasonography is important in retinoblastoma. Computed tomography can show calcification and magnetic resonance imaging can show tumor extension outside the orbit, optic nerve invasion, or pinealoma (Fig. 9.50).
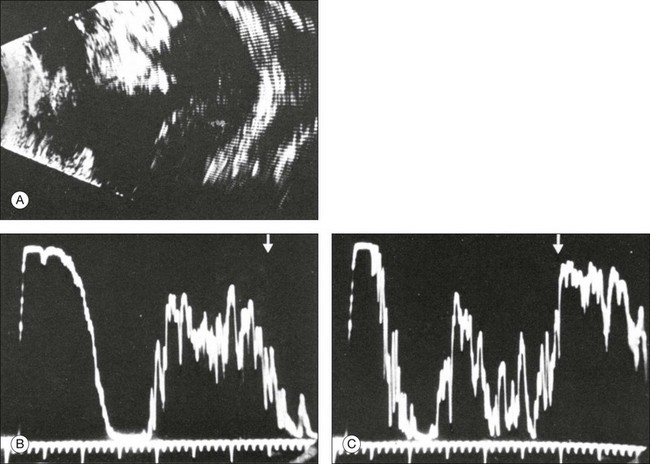
Fig. 9.48 Extensive retinoblastoma with varying appearance. As demonstrated in the cross-sectional echogram (A), the upper tumor portions show high acoustic reflectivity due to massive calcifications. The lower part of the tumor has less acoustic reflectivity than the adjacent sclera. A-scans of the eye (the scleral spikes in the acoustic scans (B,C) are marked by arrows).
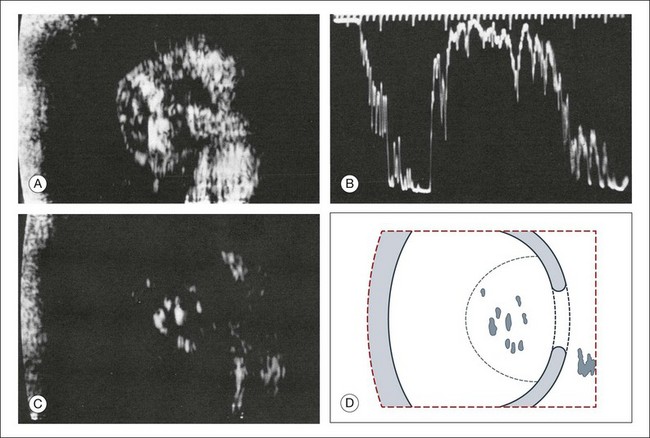
Fig. 9.49 Large retinoblastoma with calcifications and acoustic shadow cast on the adjacent sclera and orbit. (A) The calcifications light up in cross-sectional echograms. (B) In A-mode echograms, they can be quantified as the strongest reflecting structures in the examined area. (C) With reduced amplification, the calcified areas are the only visible signals. (D) Schematic drawing.
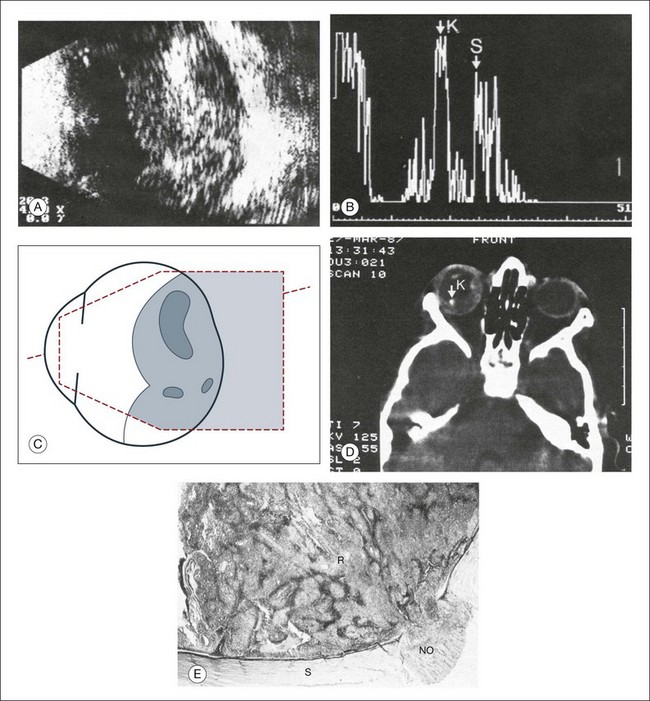
Fig. 9.50 Extensive retinoblastoma. (A) A cross-sectional echographic image. The tumor is characterized by areas of high acoustic reflectivity alternating with areas of low reflectivity. (B) The differences in reflection can be quantified on A-mode echography: calcified parts of the tumor have markedly higher amplitudes as seen at point K as compared to the sclera reflection as seen at point S. (C) Schematic drawing of the ultrasonographical image in (A). (D) Computed tomography scan displays the calcified parts of the retinoblastoma that can be identified with greater certainty than in a plain X-ray picture. (E) A histological sample of the infiltration into the optic nerve. NO, optic nerve; R, retinoblastoma. The calcium deposits explain the nearly pathognomonic echogram.
Retinopathy of prematurity
Early stages of retinopathy of prematurity can be diagnosed by indirect ophthalmoscopy. However, later stages with partial or complete tractional retinal detachments from extensive fibrovascular tissue require ultrasonography for diagnosis and surgical planning. Machemer and Aalberg33 emphasized the importance of information obtained by cross-section ultrasonography in these stages, such as the diameter of the retinal funnel in the retrolental space (Fig. 9.51).
Optic nerve
Colobomas can occur in the iris, lens, retina, and optic nerve. Some are spontaneous and some occur in association with systemic syndromes. Colobomas are also in the differential diagnosis of retinoblastoma.34 Colobomas can be seen clearly by ultrasonography even if the fundus cannot be visualized optically (Fig. 9.52).
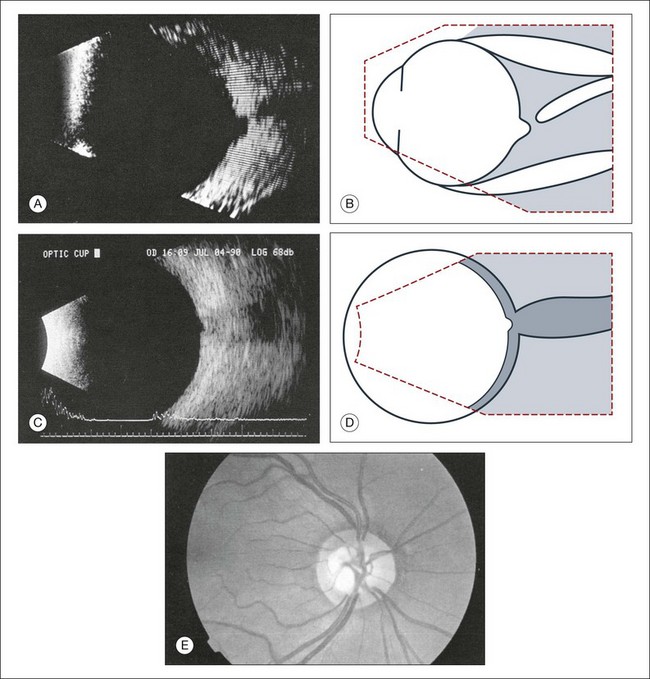
Fig. 9.52 (A) Echogram of the small optic nerve coloboma depicted in (E). In comparision, B-scan section showing normal physiological cupping of an optic nerve head (C). To obtain this vertical section a probe is placed temporal to the limbus, thereby avoiding any artifacts, caused by the lens. (B,D) Schematic drawings. (E) Small coloboma of the optic nerve with a diameter of about 2.5 mm. Fundus photograph showing excavation within the nerve.
Assessment of optic nerve cupping
Evaluation of optic nerve cupping is important for treatment of glaucomatous changes. This is difficult with anterior media opacity. Recently, with improvement of the lateral resolution of B-scan images, optic nerve head cupping can be reliably measured and reproduced on ultrasound images.35
Choroid
Changes in the ocular layers due to hypotony
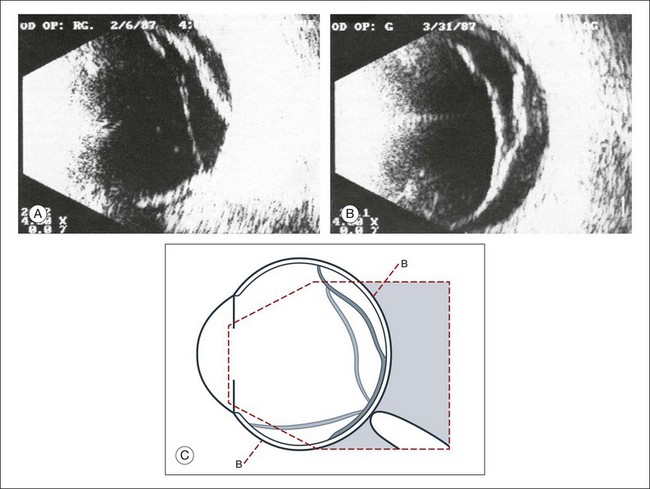
In acute hypotony, exudation into the suprachoroidal space creates an increase in the choroidal vascular pressure. This can lead to a choroidal detachment which will then exacerbate the globe hypotony (Fig. 9.53). This situation is ultrasonographically characterized by a convex border on a cross-sectional image that denotes the location of the choroidal detachment. This convex shape is formed between the pars plana and location of the vortex veins, both of which have strong choroidal attachments. Knowledge of the choroidal anatomic structure and its attachments can aid in ultrasound diagnosis. In addition to the pars plana and vortex veins, the choroid is firmly attached to the optic nerve. The choroid inserts at the optic nerve at a blunt angle, as compared to the retina, which has a steeper insertion. This feature can be used to help differentiate choroidal and retinal detachments of the posterior pole on ultrasound images. In addition, a choroidal detachment would begin at the ciliary body and not the ora serrate, as in a retinal detachment (Fig. 9.54). Occasionally, the detached ciliary body can compress the lens. In severe cases, choroidal detachments may meet in the center of the globe. This feature has been termed “kissing choroidals” and needs to be surgically corrected (Fig. 9.55). In typical cases of serous choroidal detachments the subchoroidal space is acoustically silent. In contrast, an expulsive choroidal hemorrhage can be identified by the hyperechoic signal on ultrasound that the blood clots create within the detachment (Fig. 9.56).
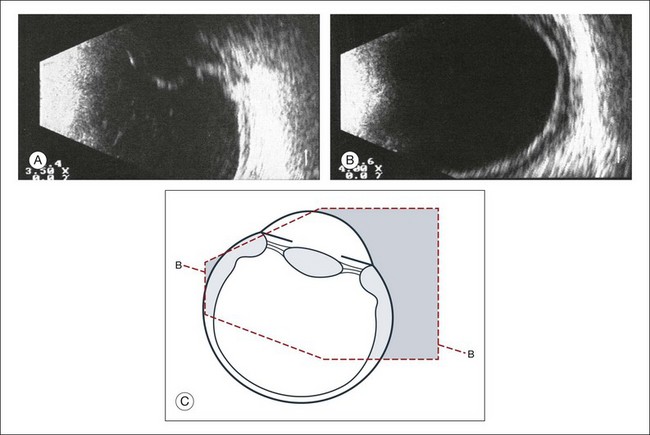
Fig. 9.53 (A) Detachment of the ciliary body and the peripheral choroid due to hypotony. (B) The thickening of the ocular walls begins in the area of the ciliary body and extends to the equator, as seen on the B-scan. (C) Schematic drawing.
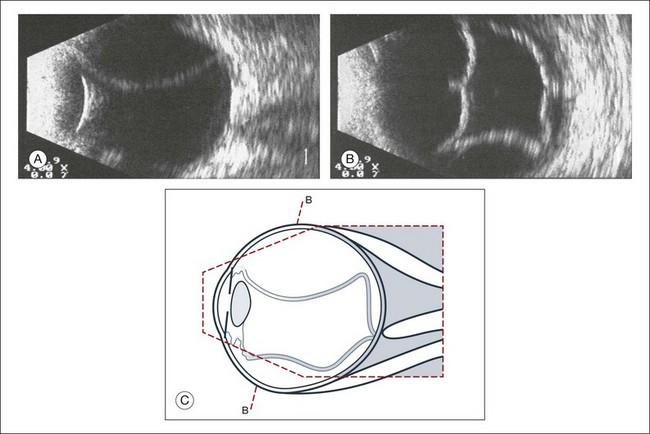
Fig. 9.54 Subtotal exudative choroidal detachment. (A) In contrast to a retinal detachment, the choroidal detachment extends beyond the ora serrata; the detachment extends from the iris diaphragm to the posterior pole without reaching the optic nerve head. (B) The frontal sections depict indentations which are caused by large vessels. (C) Schematic drawing.
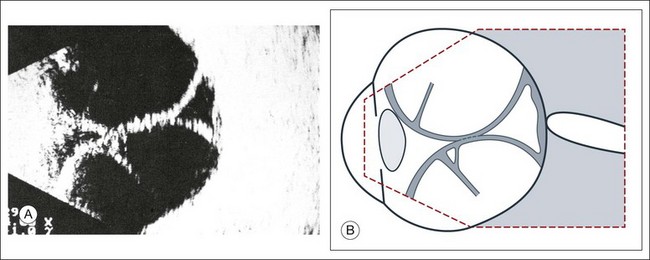
Fig. 9.55 Total exudative choroidal detachment in persistent hypotony after penetrating glaucoma surgery with external fistulation. (A) The apices of the choroidal detachment touch each other in the vitreous and are seen on the echogram. This finding is commonly termed “kissing choroidals.” Strand-like structures (possibly taut vortex veins) course through the intrachoroidal space. (B) Schematic drawing.
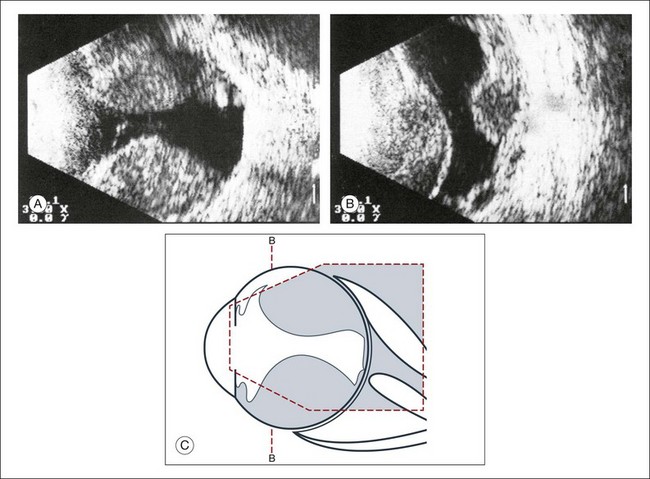
Fig. 9.56 Extensive choroidal detachment in an eye with expulsive hemorrhage. (A) The intrachoroidal space has acquired acoustic reflectivity due to the accumulation of blood. There may be anatomical healing after the absorption of the blood, but we cannot expect visual function to improve. (B) Frontal image of the hemorrhagic choroidal detachments. (C) Schematic drawing.
Choroidal neovascularization
Choroidal neovascularization is a complication seen in many eye diseases, most commonly in macular degeneration. The histological findings include a vascularized collection of connective tissue that extends from the choriocapillaris through defects in Bruch’s membrane and then into the subretinal pigment epithelial or subretinal space. This heterogeneous structure produces mixed ultrasound features, including the strong acoustic reflections from the fibrovascular membranes and dense connective tissue septa and the acoustically silent areas of exudate and subretinal fluid (Figs 9.24 and 9.57). Peripheral choroidal neovascularization membranes can appear similar to choroidal melanomas; therefore, familiarity with the ultrasonographic features of these lesions is important, especially if vitreous hemorrhage prevents direct visualization.
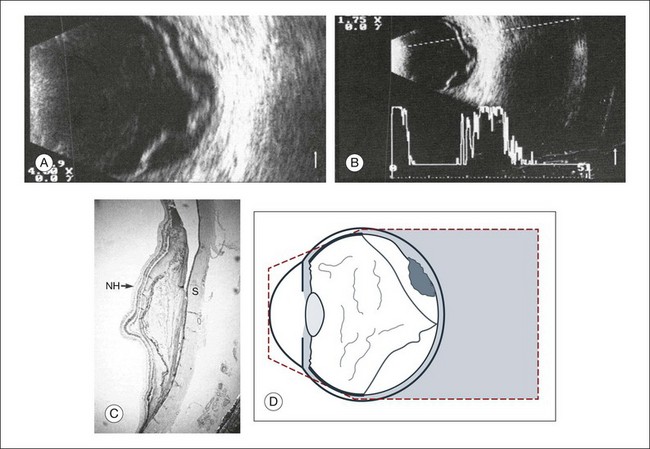
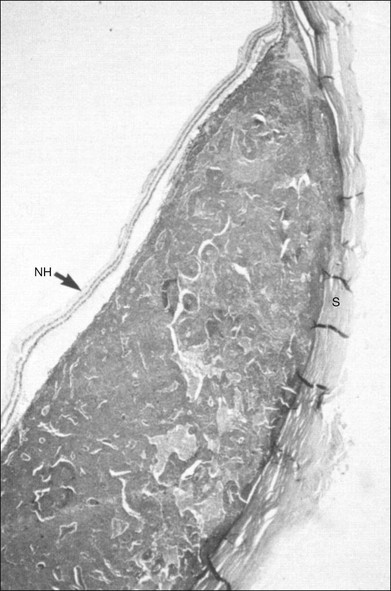
Fig. 9.57 Disciform macular degeneration with exudative retinal detachment. (A) In the cross-sectional echogram, the thickened ocular walls in the macular area appear as a strongly reflecting, layered structure. (B) The acoustic interfaces of the macular degeneration produce high signals. (C) Histologic section of an eye with disciform macular degeneration under loupe magnification. Vascularized connective tissue scars with exudation without acoustic interfaces produce the substrate for the heterogeneous nature of the echogram. NH, retina; S, sclera. (D) Schematic drawing.
Choroidal melanoma
Evaluation of choroidal melanomas includes a comprehensive examination with ophthalmoscopy combined with ultrasound imaging. In choroidal melanomas, the signals produced within the tumor are complicated by overlapping and dampening echo processes. Connective tissue septa and vessels vary in their prominence and interfere with the signals from the tumor tissue. Furthermore, the resolution of the image is limited because the densely packed tumor cells are separated by a considerably shorter distance than the ultrasound wavelength. A thorough understanding of the principles of ultrasonography and a strong knowledge base of the tissue complexity in metastatic processes combined with an extensive case reference aids in the image interpretation of choroidal melanomas. The interpretation of echograms in A- and B-mode is based on reports on this topic which were published by Oksala,36 Baum,37 Buschmann and Trier,38 Till and Ossoinig,32 Trier,39 Coleman et al.,40 and Silverman et al.,41 which include data from the original scans of ocular tissues. The next section will review the principles used to image choroidal tumors and the features of a choroidal melanoma on B-mode and A-mode imaging.
The characteristics of a choroidal melanoma on B-mode echography: In B-mode echograms, a melanoma appears as a biconvex lesion. The internal structure is relatively homogeneous so produces markedly fewer signals than the tumor surface or the sclera (Fig. 9.58). If the tumor has broken through Bruch’s membrane, then a mushroom-shaped lesion, or a collar button, can be demonstrated in cross-section and serves as a pathognomonic sign (Fig. 9.59). If present, this perforation does not necessarily occur at the peak of the tumor; careful ultrasound examination of the entire lesion is needed (Fig. 9.60). In some sections, the collar button of a tumor may even simulate a tumor mass lying free in the vitreous (Fig. 9.59). In addition, the collar button portion of the lesion has unique ultrasound features due to the presence of the mass above Bruch’s membrane in some places and below Bruch’s membrane in other places. Previously this feature was attributed to sound attenuation, which is the continuous decay of spike altitudes in the A-mode and was called the angle kappa. However, the change in signal is most likely due to more than just an attenuation phenomenon. The features of the collar button can be explained on the basis of echographic–histopathologic correlations (Fig. 9.61). Usually, a tumor lying immediately beneath the sensory retina reflects ultrasound more than the portion of the tumor beneath Bruch’s membrane. In a collar button, the part of the tumor growing in front of Bruch’s membrane will be drained less well, leading to a dilatation of the vessels in this part of the tumor.31,42 This creates new acoustic interfaces with higher signal intensity, resulting in brighter dots in B-mode and higher spikes in A-mode. In the area of the tumor base, a “choroidal excavation” can be seen (Figs 9.62 and 9.63). This excavation in the acoustic section develops at the edge of the tumor where melanoma tissue intersects the adjacent strongly reflecting intact choroid.37,43
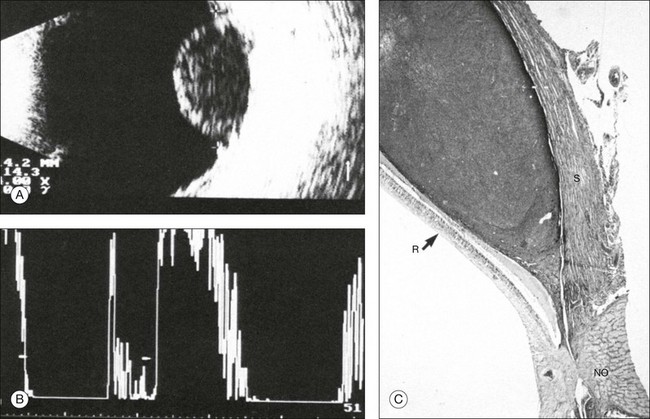
Fig. 9.58 Typical findings of a choroidal melanoma. (A) In cross-section the tumor is biconvex. The diameter of the base is 14 × 14 mm; elevation, 8.5 mm; calculated tumor volume, 750 mm3. (B) With standardized A-mode, the spike amplitude within the tumor amounts to about 20% of the scleral spike. (C) Histological section visualized under loupe magnification of a peripapillary choroidal melanoma. The reason for the low homogeneous acoustic reflectivity of a choroidal melanoma is the densely packed tumor cells, the margins of which are separated by a distance much smaller than the wavelength of ultrasound. R, retina; S, sclera; NO, optic nerve.
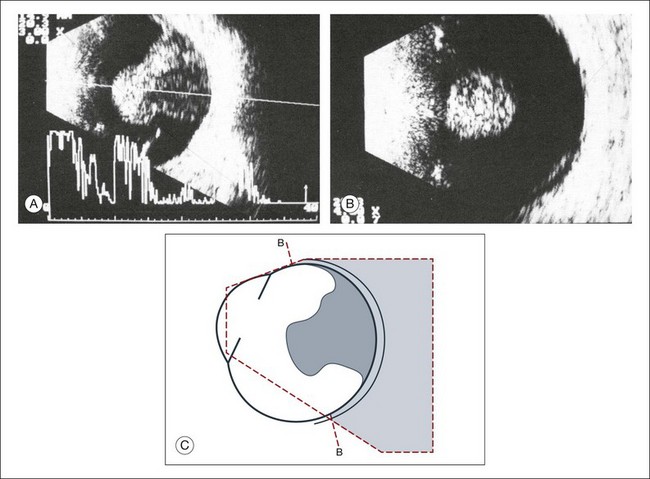
Fig. 9.59 Large choroidal melanoma, mushroom-shaped after perforating Bruch’s membrane. (A) Sagittal section. (B) In the frontal plane, one part of the tumor does not seem to have contact with the ocular outer walls, which demonstrates the principle of the necessity to image tumors in multiple planes to define the full extent of invasion. (C) Schematic drawing.
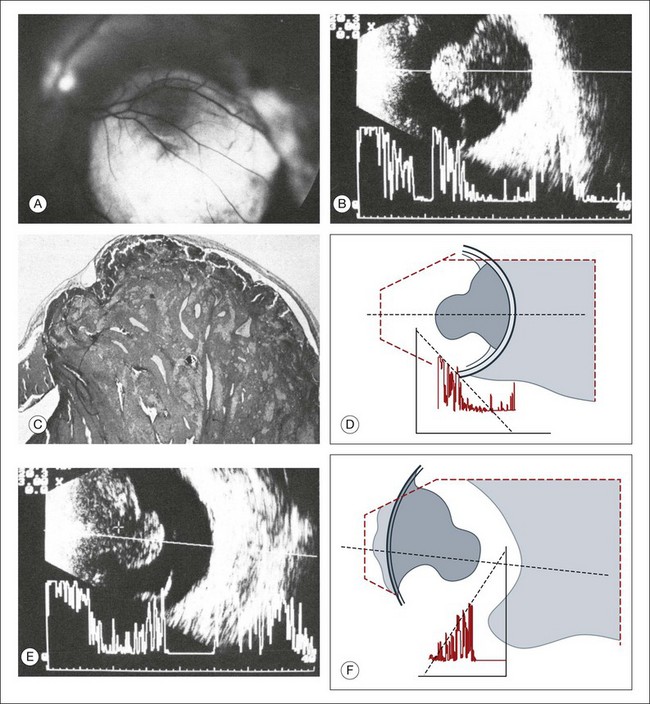
Fig. 9.60 (A) Large mushroom-shaped choroidal melanoma with collar button seen on fundus photography. (B) Sagittal echogram cross-section with A-mode echogram. There is markedly increased reflection in the area of the tumor peak. The part of the tumor in front of Bruch’s membrane often shows dilated vessels, which act as interfaces to increase the acoustic reflectivity. (C) Histological section through the tumor. (D) Schematic drawing. (E) Echogram from the tumor base. This image was obtained with maximal adduction of the globe, and made possible because of the far temporal location of the tumor base. Also in this direction of examination, the part of the tumor anterior to Bruch’s membrane demonstrates high reflectivity. (F) Schematic drawing.
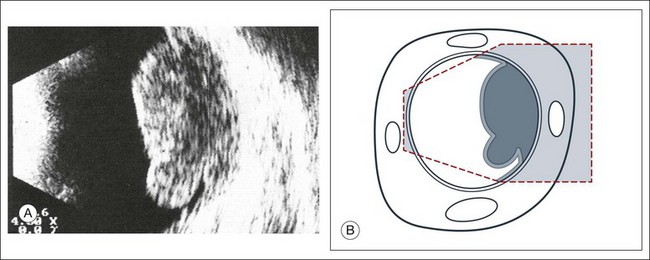
Fig. 9.61 (A) Choroidal melanoma with eccentric perforation of Bruch’s membrane. Echogram shows a mushroom-like shape of the lesion, which is nearly pathognomonic for a melanoma and therefore of great differential diagnostic value. (B) Schematic drawing.
Fig. 9.62 (A) Small choroidal melanoma. Elevation, 2.5 mm; base, 8 × 8 mm; calculated tumor volume: 66 mm3. The choroid at the tumor base has been replaced by tumor, which has less acoustic reflectivity and provokes a choroidal excavation echographically. (B) Schematic drawing.
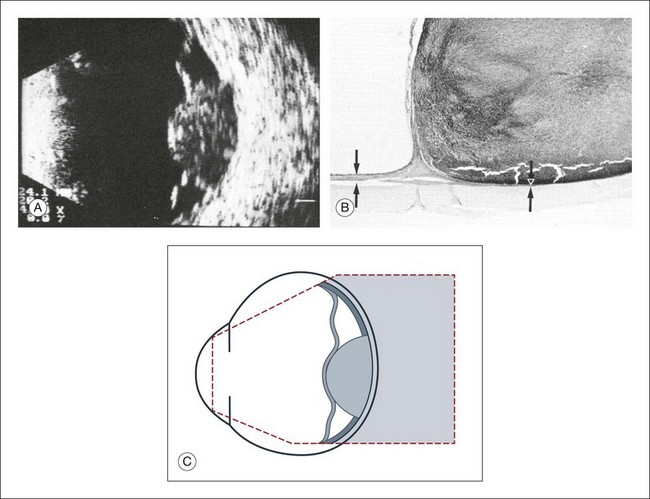
Fig. 9.63 Choroidal melanoma. (A) Elevation, 6 mm; diameter at the base, 11 × 12 mm; calculated tumor volume, 330 mm3. The highly reflecting choroid has been replaced by the poorly reflecting melanoma, producing a choroidal excavation in the cross-section. (B) Histologic section through the margin of a choroidal melanoma. At the base, normal choroid is replaced by tumor. (C) Schematic drawing.
The characteristics of a choroidal melanoma on A-mode ultrasonography: The ultrasonographic internal structure of a tumor is quantitatively best described in the A-mode echogram. An unfocused A-mode transducer can obtain a summation signal from the large tissue area,31 which typically demonstrates spikes of relatively uniform amplitudes within the large biconvex tumor if the lesion has not extensively broken through Bruch’s membrane (Fig. 9.58). This corresponds to the uniform histological structure of a melanoma (Fig. 9.58). Exceptions occur when features of hemorrhage or necrosis within the tumor develop.44,45
Most melanomas consist of solid tissue; therefore, no aftermovements occur as might be expected with a large subretinal or choroidal hemorrhage. In addition, flickering spike complexes may be seen on the A-mode echogram within the tumor itself. Various authors interpret them differently. It is assumed that they are due to blood circulating in large tumor vessels. Although the features of the ultrasound combined with a thorough clinical examination can establish the diagnosis of choroidal melanoma with enough certainty to recommend treatment, a preoperative correlation between the sonographic pattern and the histopathological findings is currently still in debate.40,41
B-mode Doppler devices can obtain signals from the interior of the tumor by using a high-resolution power and a frequency between 7 and 20 MHz. This method is more sensitive than the visual evaluation of a time amplitude echogram46 (Fig. 9.64). In some patients it was possible to determine the blood flow within the tumor using Doppler color-coding technology. In a series of 50 eyes with melanoma, Doppler shifts could be detected in all patients except one. The tumor size varied between 80 and 1500 mm3. Doppler imaging has also been used to study an eye with secondary glaucoma and significantly increased intraocular pressure. In this patient the tumor perforated the sclera and invaded the muscle cone (Fig. 9.65). An intraocular pressure of 45 mmHg compressed the intraocular tumor, which influenced the maximal flow velocities measured by Doppler sonography (Fig. 9.65).
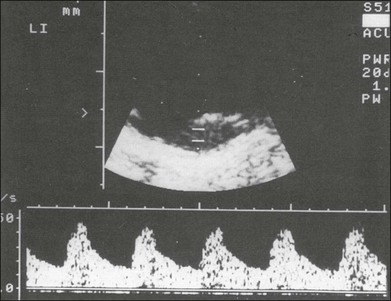
Fig. 9.64 B-mode Doppler sonography (duplex technique) of a choroidal melanoma of average size. In A-mode the occasionally observed flickering amplitudes are produced by the blood flow. They can be quantified when using a B-mode Doppler instrument of high resolution.
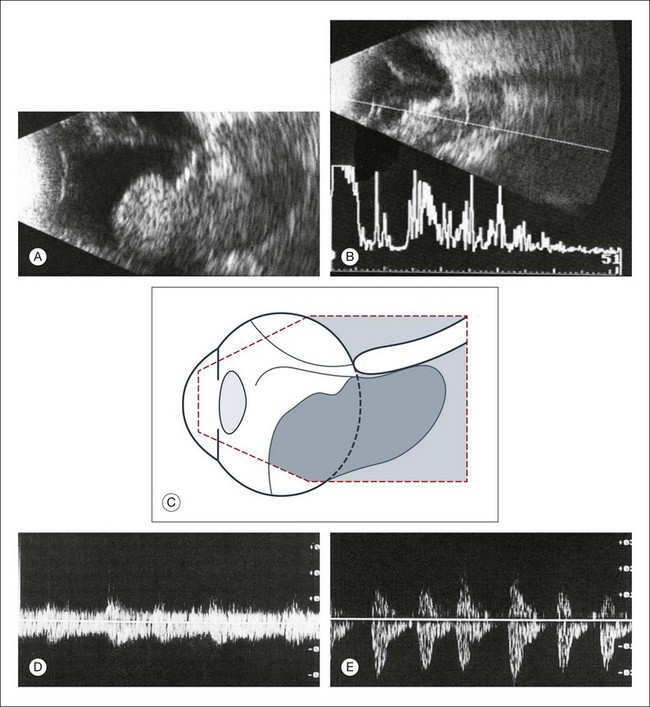
Fig. 9.65 Choroidal melanoma with orbital invasion in a 65-year-old woman. Referral diagnosis was orbital cellulitis. Echographic findings include a large intraocular tumor with wide invasion of the orbital tissues (A). Remnants of the sclera can be demonstrated within the tumor in both A- and B-mode echograms because of their strong acoustic reflectivity (B). Additional findings include a total retinal detachment as seen in both images. (C) Schematic drawing of the echogram. (D,E) Doppler signal of the choroidal tumor. (D) Frequency shift from the intraocular tumor, maximum velocity: 10 cm/s. (E) Frequency shift from the extraocular tumor, maximum velocity: 2 cm/s. With Doppler technique the intraocular part of the tumor shows reduced blood flow compared to the extraocular part.
Determining the volume of a choroidal melanoma by ultrasonography: Ultrasonography produces spikes in the recorded signal when interfaces with different media are encountered. In a normal eye, the first acoustic interface after the signal passes through the vitreous is the retina. In the case of a choroidal tumor the apex is adjacent to the retina spike and the base is anterior to the scleral spike. Identifying these positions, however, can be challenging in some settings. For example, if the retina is attached to the tumor surface, no separate discrimination of the two interfaces is possible (Fig. 9.58). On the other hand, if the accompanying retinal detachment is also present over the peak of the tumor, then the retina will be imaged as a separate membranous structure lying in front of the lesion (Fig. 9.66). Then the transition between tumor and scleral must be identified. In most cases, the scleral spike is still the strongest signal even in the presence of a choroidal tumor. If the tumor breaks through the scleral barrier, the continuity of this strong signal is interrupted at the site of perforation. An exact measurement of the volume of the tumor is important when measuring the lesion height, planning a treatment, or analyzing the effect of therapy.
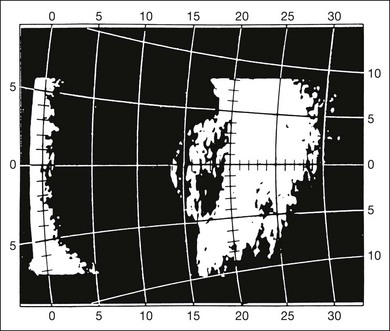
Fig. 9.66 Choroidal melanoma with associated retinal detachment over the peak of the tumor. Tumor size: base, 9 × 9 mm; elevation, 3.5 mm. The detached retina lies about 2 mm in front of the tumor. The calculated tumor volume is about 150 mm3. If the retinal detachment were erroneously included, the volume would be about 230 mm3.
Ultrasonography is capable of providing precise measurements of tumor size. Ultrasound devices have measurement tools that can be applied in the window of the image. The examiner can use this feature to measure the height of the largest and smallest diameter of the tumor. In biconvex tumors, volume data and tumor can be calculated from these linear measurements or it can be evaluated using special equipment designed for 3D evaluation (Fig. 9.67).
The role of ultrasonography for planning the treatment of choroidal melanomas: After a choroidal melanoma is diagnosed by careful clinical examination and ultrasound interpretation, the next step for the physician is to formulate a treatment plan. Radiation therapy is successfully used for the treatment of medium or small ocular melanomas. Scleral contact radiotherapy using ruthenium-l06, cobalt-90, or iodine-125 applicators shows a relatively steep decay of radiation dosage. At a distance of 8 mm from the radiation surface, only 10% of the energy is still available. In order to achieve complete tumor necrosis in this area, an application of 10 times the duration of radiation is needed. Figure 9.68 shows the isodose curves for ruthenium-106 applicators. The aim of any radiation therapy is to destroy the tumor tissue and to spare the adjacent normal ocular tissues as much as possible. The radiation pellets are placed on custom scleral plaques that are designed to cover the full extent of the tumor. It is therefore important to have an exact measurement of the size of the tumor and have precise placement of the scleral plaque over the tumor (Figs 9.69 and 9.70). Ultrasonography provides the most accurate measurements for this purpose. Dynamic imaging using the ultrasound B-mode can also provide information on adjacent pathology such as overlying retinal detachments, which may overestimate the total height of the tumor if not properly identified.
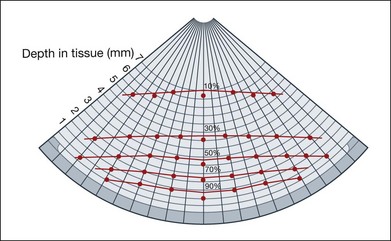
Fig. 9.68 Measuring protocol for a ruthenium applicator type CCC; diameter of the emitting plane, 21 mm. At 5 mm from the applicator surface, only 25% of the scleral contact dose is still available. Because of this steep decay of effective radiation, it is critical to plan the treatment exactly.
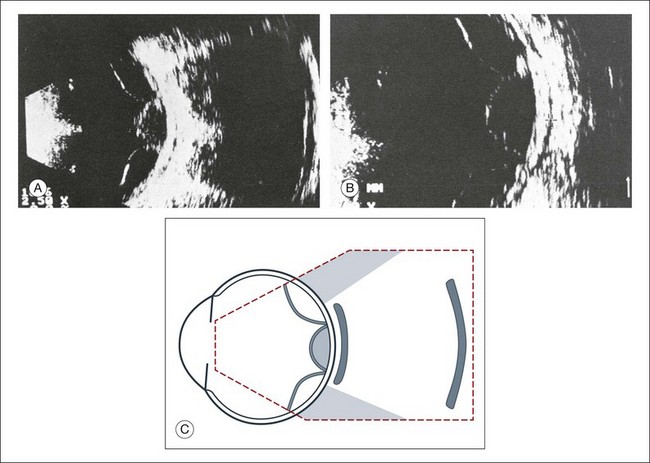
Fig. 9.69 (A,B) Echogram of an eye with the ruthenium-beta applicator in place. The slit between the posterior scleral surface and the applicator is filled with fluid and is less than 0.5 mm wide. The lateral extent of the applicator is marked by the sound shadow. (C) Schematic drawing.
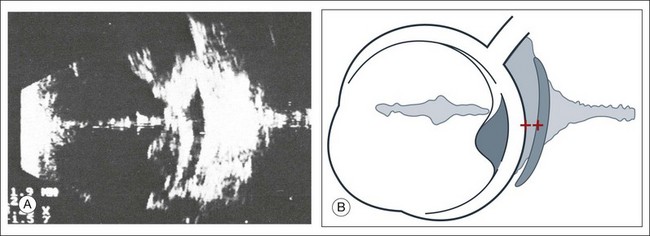
Fig. 9.70 (A) Ruthenium-beta applicator in place with a wide slit between the sclera and the applicator surface. On the basis of this echographic finding, the position of the applicator should be changed or the duration of the treatment has to be prolonged. Distance of the measuring marks: 1.9 mm. (B) Schematic drawing.
Serial examination with ultrasonography posttreatment can be used to monitor the effect of the radiation plaque by measuring the tumor elevation, tumor base, and reflectivity of the internal tumor structure as well as by identifying the presence of tumor vessels. Figure 9.71 illustrates the successful treatment of a choroidal melanoma that was documented echographically. In this case, after 4 months there was a marked increase in reflectivity in the internal tumor structures. Within 10 months the volume was reduced from 380 mm3 to 0 mm3.
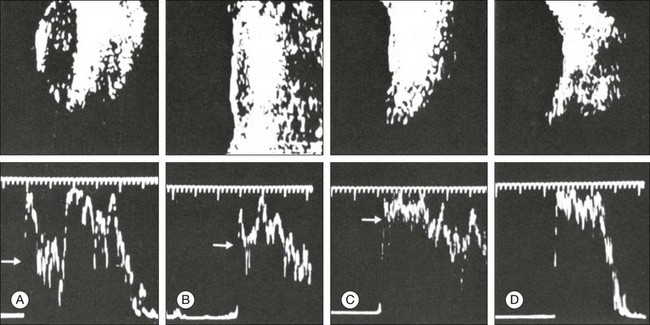
Fig. 9.71 A-mode (bottom) and B-mode (top) echograms during follow-up assessments of a successfully treated choroidal melanoma. The tumor volume was reduced from 380 to 0 mm3 within 10 months. After 8 months the spikes within the tumor increased from about 40% of the scleral spike to about 90% (white arrows). (A) Before radiation, 380 mm3, reflection 40%; (B) after 4 months, 230 mm3, reflection 80%; (C) after 8 months, 100 mm3, reflection 90%; (D) after 10 months, 0 mm3, no reflection.
In some cases of successfully treated tumors, the increased reflectivity within the tumor is the only ultrasonographic parameter that changes after radiotherapy (Fig. 9.72). Increased reflectivity may demonstrate tumor necrosis; however, this may not always be the case, as some tumors remain viable even with the increase in reflectivity noted on ultrasound.
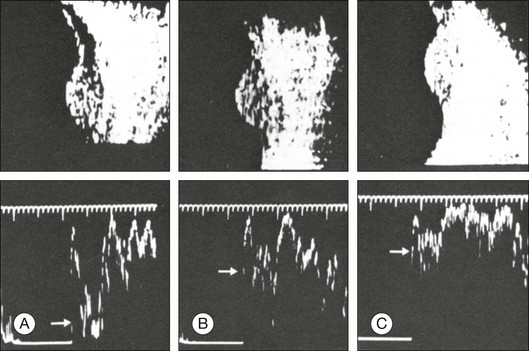
Fig. 9.72 A-mode (bottom) and B-mode (top) echograms demonstrating the effect of brachyradiotherapy on a choroidal melanoma. The external shape of the tumor also remains unchanged after a second series of radiation; the reflectivity of the tumor increases from about 20% of the scleral spike before radiation to about 80% after radiation (white arrows). (A) Before radiation, volume 250 mm3, reflection 20%; (B) after 8 months, 250 mm3, reflection 70%; (C) after 36 months and 22 months after second radiation, volume 250 mm3, reflection 80%.
Determining blood flow by B-mode Doppler sonography is an additional parameter that could be used to monitor the treatment response in highly vascularized choroidal tumors, such as choroidal melanomas. Doppler can detect a decrease in blood flow in the necrotic mass that is left after radiation therapy. The necrotic tissue from treated tumors can be absorbed by the adjacent blood vessels, but radiation may damage these vessels and prevent the clearing of these products, which explains the residual mass on ultrasound seen after treatment with radiation: this mass is called tumefaction. This may explain the increased reflectivity of treated tumors. Figure 9.73 shows an elevated tumor before radiation.
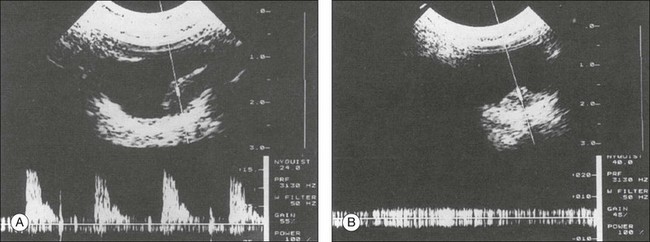
Fig. 9.73 (A) Choroidal melanoma with an elevation of 5 mm. Cross-sectional echogram obtained with the duplex instrument ATL mark 8. The sample volume is identified by the marks on the aiming beam. In this area Doppler spectra are obtained, indicating a high blood flow velocity (represented in the lower part of the illustration). (B) Same patient as in panel A, 4 months after radiation treatment of the choroidal melanoma with ruthenium. There is still a considerable volume of tumor remaining (maximal elevation, about 3.5 mm). No frequency shift can be obtained from the interior of the tumor when using duplex examination. The tissue lying in the guiding beam produces only a biphasic noise (illustrated in the lower part of the image).
Metastatic choroidal tumors
Choroidal metastasis is a known complication of several cancers, including all types of carcinomas and sarcomas. The most frequent primary tumors are breast (40%) and lungs (29%). One study examined 230 eyes from deceased patients with known systemic carcinoma and showed that 12% of the eyes had choroidal metastasis on pathological specimens.47 Many of these tumors remained undetected at the time of death. The detection of such lesions can be a poor prognostic factor. The average survival time after treatment for choroidal metastasis is 7.4 months.48 Therefore, many of these patients are not followed for extended periods of time by their ophthalmologist.
Typically carcinoma metastasis presents as a large, highly reflective thickening of the ocular outer layers. The internal acoustic properties can resemble a disciform macular degeneration or a choroidal hemangioma. A metastatic adenocarcinoma typically presents with high reflectivity from the strong acoustic interfaces from its adenoid-like histological structure (Fig. 9.74).
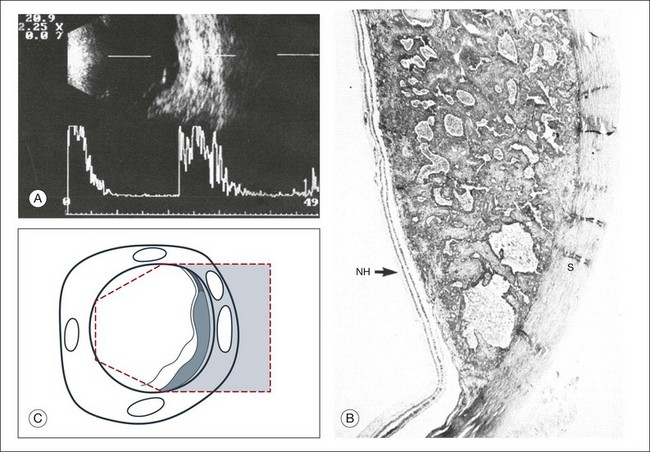
Fig. 9.74 Extensive choroidal metastatic tumor in the lower nasal quadrant. (A) On the echogram the choroid is widened to about 2.5 mm; the retina is partly detached by an exudate. The tissue inside the metastatic tumor shows high acoustic reflectivity. (B) Histologic section of a metastatic adenocarcinoma in the choroid. The gland-like structure provides good acoustic interfaces. NH, retina; S, sclera. (C) Schematic drawing.
In contrast, there are several atypical presentations of choroidal metastasis that have also been reported.49,50 Pathological examination of an eye that was enucleated because of suspicion for choroidal melanoma from ultrasound examination revealed a choroidal metastasis from small-cell bronchial carcinoma (Fig. 9.75).49
Choroidal hemangioma
Choroidal hemangioma may be an isolated lesion or may be associated with Sturge–Weber syndrome. Isolated hemangiomas, described as circumscribed choroidal hemangiomas, usually occur at the posterior pole. The lesions are typically diffuse, slightly elevated, and may have indistinct margins. These features make ophthalmic interpretation of the lesion difficult and often they can be missed. However, associated features of these circumscribed lesions can include retinal detachment and secondary changes of the RPE, which makes their presence more conspicuous on exam. Ultrasonographically, choroidal hemangiomas appear as a strongly reflecting, nearly concentric widening of the outer layers of the eye (Fig. 9.76). In spite of the abundant vascularization, ultrasound images of choroidal hemangiomas do not show the circulating blood as in choroidal melanomas. Instead, the echogram of a choroidal hemangioma is similar to that of metastatic adenocarcinoma or disciform macular degeneration, which may be indicative of a slower circulation more consistent with laminar flow in the cavities of dilated blood vessels shown by Doppler ultrasonography (Fig. 9.77). In long-standing cases the epichoroidal layer may ossify and produce sound shadows. In this stage, a hemangioma may appear identical to an osteoma or a metastatic calcification of the choroid.51,52
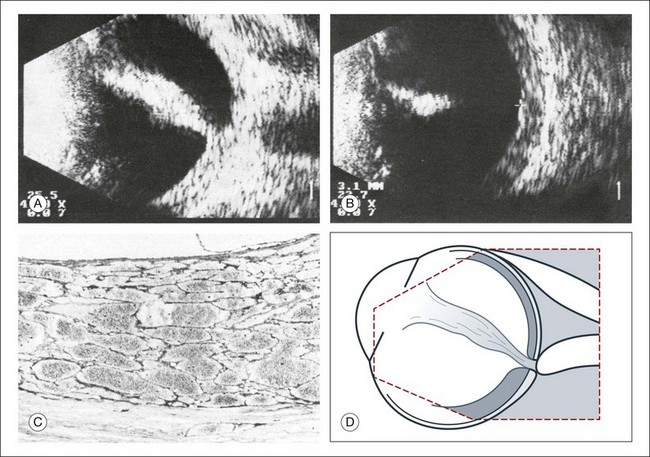
Fig. 9.76 Extensive choroidal hemangioma in Sturge–Weber syndrome (additional finding: total retinal detachment). (A) Cross-sectional echogram through the area of the optic nerve head. In the lower quadrant, the ocular walls are markedly thickened. (In spite of the associated retinal detachment, the intraocular pressure was 50 mmHg by applanation.) (B) With reduced sensitivity, the scleral surface can be delineated in spite of the high acoustic reflectivity within the tumor (distance of the measuring marks, 3.1 mm). (C) Histologic section through the tumor illustrated in (A) and (B): the septa of the cavities are thin and lined with endothelium. They produce strong reflectivity within the lesion. (D) Schematic drawing.
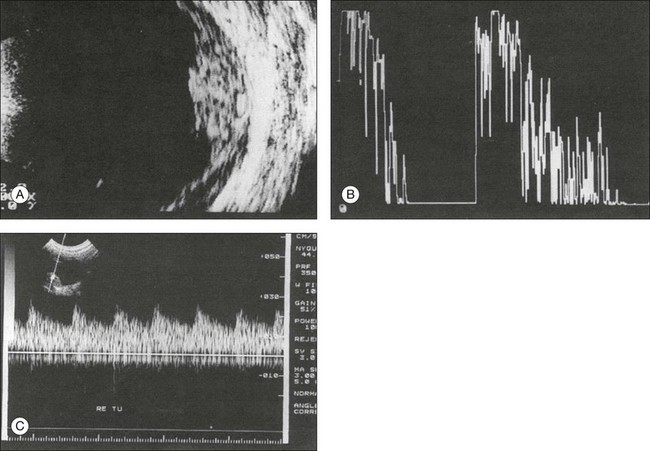
Fig. 9.77 (A) Cross-sectional echogram of a circumscribed choroidal hemangioma in a 12-year-old boy. The tumor has an elevation of 4 mm. (B) In an A-mode echogram with S-shaped amplification the cross-sectional picture corroborates the high reflectivity of the tumor. (C) On Doppler sonography, we see blood circulating within the tumor, synchronous with the pulse. The illustrated velocity profile speaks for a relatively low resistance by the blood vessels.
Choroidal osteoma – metastatic calcifications
Choroidal osteoma is a rare condition which is characterized ultrasonographically by a localized area of high reflectivity at the outer wall (Fig. 9.78). Several conditions can mimic the appearance of a choroidal osteoma. As mentioned above, a chronic circumscribed hemangioma can ossify and resemble a choroidal osteoma.53–55 In addition, several choroidal lesions can contain calcium, including ocular metastasases of the choroid and the sclera51 or metabolic disorders of calcium metabolism that create a localized calcium deposition within the choroid known as an osseous choristoma (Fig. 9.79).54
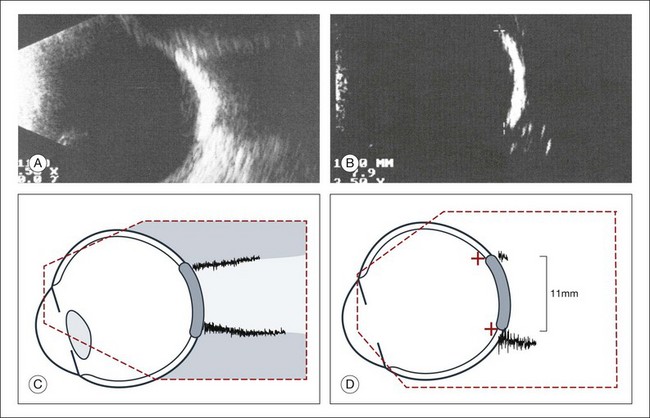
Fig. 9.78 Cross-sectional echogram of the choroidal osteoma. (A) The echogram of the lesion is characterized by total reflection of the ultrasound, and shadow formation. An elevation cannot be unequivocally documented. (B) With reduced amplification it is possible to image the ossification as an isolated signal. The horizontal diameter is 11.0 mm. (C,D) Schematic drawings.
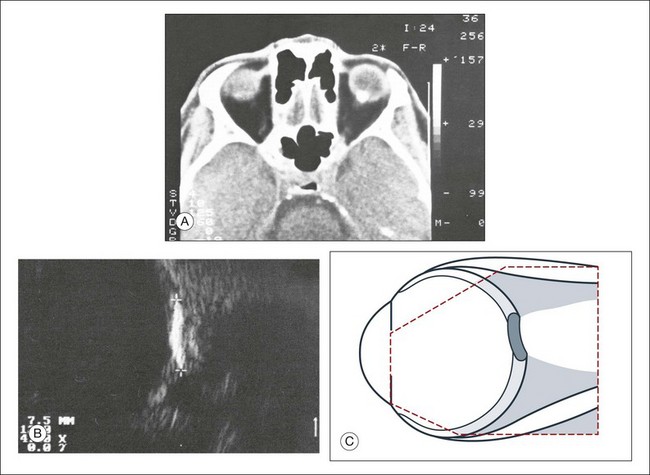
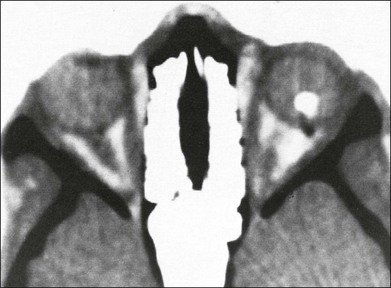
Fig. 9.79 Metastatic calcification of the ocular walls of unknown etiology. Differential diagnosis includes choroidal osteoma. (A) A computed tomography scan was obtained because of nonophthalmological problems. A circumscribed calcified structure within the ocular walls was found incidentally. (B) In cross-sectional echograms, a lesion of the ocular walls above the optic nerve head showed total reflection of the ultrasound signal. The lateral extension was about 7.5 mm. There was no corresponding lesion seen on fundus examination that would be typical of an osteoma. The etiology of this lesion is unknown. (C) Schematic drawing.
Choroidal tuberculoma
Choroidal tuberculomas are another extremely rare choroidal lesion (Fig. 9.80).56 Tuberculomas can also appear similar to choroid melanoma (Figs 9.81). Images that are suggestive of choroidal tuberculomas exemplify the importance of placing the ultrasound image in context with the rest of the patient examination in order to make the proper diagnosis. Tuberculomas are found in patients with disseminated tuberculosis and a complete examination can identify other tuberculomas to confirm the diagnosis. Laboratory confirmation of mycobacterium by blood or sputum sampling is also helpful. In addition, these lesions should respond to antituberculous treatment.
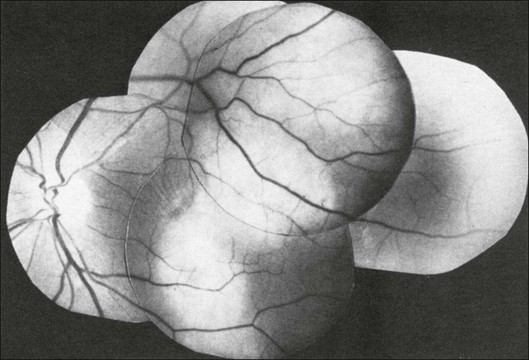
Fig. 9.80 Fundus picture of a 52-year-old woman with active pulmonary tuberculosis. This lesion resolved with antituberculosis treatment.
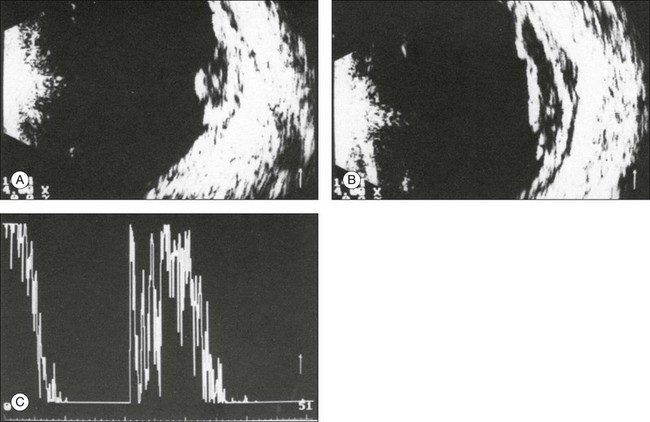
Fig. 9.81 (A,B) Echogram of the fundus lesion shown in Fig. 9.80. (C) The lesion is characterized by low acoustic reflectivity. Tenon’s space can be well demonstrated. The reflectivity corresponds to that of a choroidal melanoma. The infiltration of Tenon’s space points toward inflammatory etiology.
The uveal effusion syndrome
Patients with uveal effusion syndrome can have partial or circular choroidal detachment combined with an exudative retinal detachment (Fig. 9.82). Ultrasonography is very important in this condition. It can reveal fluid in the suprachoroidal space or differentiate choroidal hemorrhage or tumor from the serous fluid seen on imaging from choroidal effusion syndrome.49,57
Sclera
Ultrasonography is the diagnostic method of choice for posterior scleritis.52,58,59 The clinical picture is characterized by an acute loss of vision associated with folds at the posterior pole. The normal high reflectivity of the sclera will be decreased by changes in the tissue from inflammatory swelling. The result is a low reflective signal from a thickened choroid, which is suggestive of posterior scleritis. Choroid and vitreous may appear normal. Occasionally, there is a slight exudation into the subretinal space with accompanying disc edema. In 50% of the patients, fluid accumulates in the Tenon’s space.60 This signal can be similar to a diffuse choroidal melanoma. There is one case report of an eye that was enucleated because of suspicion of an ocular melanoma based on the finding of brawny scleral thickening (Figs 9.83 and 9.84). This case highlights the importance of proper ultrasound interpretation in the clinical context of each patient.61
Ultrasound imaging used to differentiate ocular disease
Ultrasonography is invaluable in the diagnosis of certain ocular and orbital conditions. Proper imaging with ultrasound can narrow the differential diagnosis in certain conditions and guide further workup and management. These conditions include choroidal folds (Tables 9.2–9.4 and see Fig. 9.85), leukocoria (Table 9.5 and see Fig. 9.86), and vitreous hemorrhage (Table 9.6 and see Fig. 9.87). First, choroidal folds can be from orbital masses, ocular inflammation, disc edema in an atypical presentation, or from idiopathic causes.49 Next, leukocoria is a condition of a white pupil that blocks ophthalmic examination, typically diagnosed in infancy. This finding can be from retinoblastoma. Differentiating this disease from other benign causes of leukocoria is critical for providing appropriate treatment of the patient. Finally, vitreous hemorrhage may manifest from a variety of changes in the posterior globe; the urgency of treatment is dependent on the diagnosis of a retinal detachment. All of these conditions require ultrasound technology to establish the proper diagnosis. The tables listed above provide information on the differential diagnosis of each condition and ultrasound features that will help guide image interpretation.
Table 9.2
Orbital causes of orbital folds49
| Diagnosis | Number of patients |
| Graves orbitopathy | 11 |
| Sinusitis | 5 |
| Mucocele | 2 |
| Hemangioma | 6 |
| Orbital pseudotumor | 5 |
| Various orbital tumors | 8 |
| Unexplained | 6 |
| Total | 43 |
Table 9.3
Ocular causes of choroidal folds
| Diagnosis | Number of patients |
| Hyperopic eye | 17 |
| Macular degeneration | 12 |
| Ocular hypotony | 12 |
| Posterior scleritis | 9 |
| Buckling operation | 9 |
| Trauma | 6 |
| Intraocular tumor | 3 |
| Miscellaneous | 10 |
| Total | 78 |
Table 9.4
Choroidal folds: ultrasonographic findings helpful for differential diagnosis
| Diagnosis | Ultrasonographic findings |
| Myositis Graves orbitopathy 1 | Thickened extraocular muscles |
| Periorbital space-occupying lesions 2 | Change in the relief of the orbital wall, sound propagation into perinasal sinuses |
| Orbital neoplasm 3 | Directly evident (it may be difficult to demonstrate a small cavernous hemangioma because of its high acoustic reflectivity) |
| Inflammatory orbital pseudotumor 4 | Widening of normal orbital structures, low acoustic reflectivity, Tenon’s space may be demonstrated |
| Disc edema 5 | Widened dural diameter of the optic nerve |
| Axial hyperopia 6 | Axial length below 22 mm, ocular walls concentrically thickened |
| Ocular hypotony 7 | Ocular walls concentrically thickened |
| Macular degeneration | Thickening of the ocular walls in the area of the macula, high acoustic reflectivity |
| Scleritis 8 | Circumscribed widening of the ocular walls Tenon’s space apparent |
Table 9.5
Leukocoria: ultrasonographic findings helpful for differential diagnosis
| Diagnosis | Ultrasonographic findings |
| Normal axial length for the patient’s age | |
| Retinoblastoma 1 | Widening of the ocular walls, extremely high acoustic reflectivity, shadowing effect, atypical findings possible |
| Congenital cataract 2 | Increased reflectivity from the posterior lens surface, vitreous space empty, ocular walls normal |
| Shortened axial length | |
| Retinopathy of prematurity 3 | In stages IV and V, beginning or complete traction detachment (normal findings in stages I–III) |
| Persistent hyperplastic primary vitreous (PHPV) 4 | Dense strand of tissue between optic nerve head and posterior lens pole; formes frustes may occur (posterior or anterior PHPV) |
| Retinal anomalies | Membranes in the vitreous, atypical detachment, which in part appears solid (no typical echogram) |
| Fundus coloboma 5 | Directly demonstrable protrusion of ocular wall, sometimes with orbital cyst (microphthalmos with cyst) |
| Coats disease 6 | Floating crystals in the vitreous and subretinal space (fast-flickering spikes on A-mode) |
Table 9.6
Vitreous hemorrhage: ultrasonographic findings helpful for establishing the etiology
| Diagnosis | Ultrasonographic findings |
| Symptomatic posterior vitreous detachment 1 | Thickened detached posterior hyaloid membrane, occasionally early retinal detachment |
| Recently formed retinal break with torn vessel 2 | Blood-covered vitreous strands converge toward the retinal break; occasionally a high-floating operculum may be detected |
| Proliferative retinopathy 3 | Strands or membranes extending from the optic nerve head or the posterior pole, high acoustic reflectivity |
| Terson syndrome (vitreous hemorrhage after subchoroidal bleeding) 4 | Vitreous opacities in front of the optic nerve head or behind the detached vitreous |
| Disciform macular degeneration 5 | Widening of the ocular walls in the macular area, high acoustic reflectivity, vitreous strands extending from the macula |
| Choroidal melanoma 6 | Biconvex thickening of the ocular wall, low acoustic reflectivity, sometimes mushroom-shaped; accompanying retinal detachment distant from the tumor |
Fig. 9.85 Choroidal folds: ultrasonographic contribution to the differential diagnosis (for detail, see Table 9.4).
Fig. 9.86 Leukocoria: echographic contribution to the differential diagnosis (for detail, see Table 9.5).
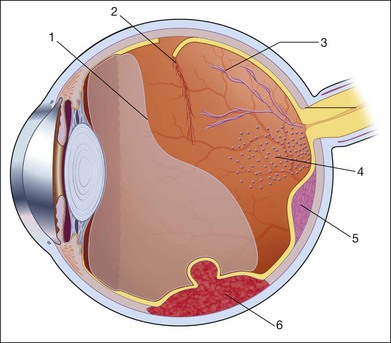
Fig. 9.87 Vitreous hemorrhage: echographic contribution to determine the pathogenesis (for detail, see Table 9.6).
Furthermore, ultrasonography can aid in the preoperative planning and patient counselling for surgery. Table 9.7 lists some of the possible ultrasonographic information and subsequent conclusions that can be obtained for operative planning (and see Fig. 9.88).
Table 9.7
Examination before a vitrectomy: ultrasonographic findings helpful for planning the operation
| Questions on the ultrasonographic examination | Consequences for planning the operation |
| Is the choroidal detachment including the pars plana? 1 | Avoiding this area when inserting the ports |
| Is the posttraumatic vitreous hemorrhage associated with a detached retina? | If retina is detached, strong indication for vitrectomy |
| Is an intraocular foreign body demonstrable? If so, where is it in regard to ocular outer wall? 2 | Choice of surgical approach, magnet extraction possible? |
| Estimating the prognosis | |
| Is there a choroidal detachment caused by blood? 3 | Extremely poor prognosis that may not benefit from surgical intervention |
| Is there a free-floating retinal detachment? 4 | Reattachment probable, can be achieved without tamponade from the inside |
| Is there a rigid retinal detachment? Is there a thickened retina? 5 | Removal of preretinal membranes necessary |
| Are there vitreous strands with traction effect demonstrable? 6 | Consider intraoperatively cutting the strands |
| Is there retinal detachment that is displaced anteriorly to be near the lens? 7 | Special care indicated when entering the vitreous space |
| Are there thickened ocular walls in the macula that may indicate a disciform lesion from macular degeneration? 8 | Poor prognosis for central vision |
| Are there indications of a secondary, e.g., solid retinal detachment? 9 | Additional diagnostic examinations; enucleation may be necessary |
| Is there attached retina with minimal remaining vision? | Reconsider indication for operation, prognosis for vision extremely poor |
Future developments
Many medical fields are using advances in technology to improve ultrasound images. These improvements involve the use of new piezoelectric materials and broadband transducers.62 Current and future developments can be focused on the following trends:
References
1. Mundt, G, Hughes, W. Ultrasonics in ocular diagnosis. Am J Ophthalmol. 1956;41:488.
2. Baum, G, Greenwood, J. The application of ultrasonic locating techniques to ophthalmology, part 1. Am J Ophthalmol. 1958;46:319.
3. Oksala, A, Lehtinen, A. Diagnostic of detachment of the retina by means of ultrasound. Acta Ophthalmol. 1957;35:461–467.
4. Oksala, A, Lehtinen, A. Diagnostic value of ultrasonics in ophthalmology. Ophthalmologica. 1957;134:387–395.
5. Oksala, A, Lehtinen, A. Diagnostic of rupture of the sclera by means of ultrasound. Acta Ophthalmol. 1958;36:37–42.
6. Oksala, A, Lehtinen, A. Measurement of the velocity of sound in some parts of the eye. Acta Ophthalmol. 1958;36:633–639.
7. Ossoinig, K. Standardized echography: basic principles, clinical applications and results. Int Ophthalmol Clin. 1979;19:127.
8. Buschmann, W, Haigis, W. Influence of equipment parameters on results in ophthalmic ultrasonography. Doc Ophthalmol Proc Ser. 1981;29:487.
9. Ossoinig, K, Till, P. 10 years’ study on clinical echography in orbital disease. Bibl Ophthalmol. 1975;83:200.
10. Gernet, H. Ultrasonic biometry of the eye. Klin Monatsbl Augenheilkd. 1967;151:853–871.
11. Baum, G, Greenwood, J. Ultrasound in ophthalmology. Am J Ophthalmol. 1960;49:249–261.
12. Bronson, N, Fisher, Y, Pickering, N, et al. Ophthalmic contact B-scan ultrasonography. Westport, CT: Intercontinental; 1976.
13. Pavlin, C, Foster, F. Ultrasound biomicroscopy of the eye. New York: Springer; 1995.
14. Sherar, M, Starkowski, B, Taylor, W, et al. A 100 Mhz B-scan ultrasound backscatter microscope. Ultrasound Imaging. 1989;11:95–105.
15. Pavlin, C, Harasiwicz, K, Sherar, M, et al. Clinical use of ultrasound biomicroscopy. Ophthalmology. 1991;98:287–295.
16. Sherar, M, Foster, F. The design and fabrication of high frequency transducer. Ultrasound Imaging. 1989;11:75–94.
17. Pavlin, C, Harasiwicz, K, Foster, F. Ultrasound biomicroscopy of anterior segment structures in normal and glaucomatous eyes. Am J Ophthalmol. 1992;113:381–389.
18. Atta, HR. New applications in ultrasound technology. Br J Ophthalmol. 1999;83:1246–1249.
19. Iezzi, R, Rosen, R, Tello, C, et al. Personal computer-based 3-dimensional ultrasound biomicroscopy of the anterior segment. Arch Ophthalmol. 1996;114:520–524.
20. Cusumano, A, Coleman, D, Silverman, R, et al. Three dimensional ultrasound imaging – clinical applications. Ophthalmology. 1998;105:300–306.
21. Coleman, D, Silverman, R, Daly, S. Advances in ophthalmic ultrasound. Radiol Clin North Am. 1998;36:1073–1082.
22. Reinstein, D, Raevsky, T, Coleman, D. Improved system for ultrasonic imaging and biometry. J Ultrasound Med. 1997;16:117–124.
23. Silverman, R, Lizzi, F, Ursea, B, et al. High-resolution ultrasonic imaging and characterization of the ciliary body. Invest Ophthalmol Vis Sci. 2001;42:885–894.
24. Stachs, O, Martin, H, Behrend, D, et al. Three-dimensional ultrasound biomicroscopy, environmental and conventional scanning electron microscopy investigations of the human zonula ciliaris for numerical modelling of accommodation. Graefes Arch Clin Exp Ophthalmol. 2006;244:836–844.
25. Stachs, O, Martin, H, Kirchhoff, A, et al. Monitoring accommodative ciliary muscle function using three-dimensional ultrasound. Graefes Arch Clin Exp Ophthalmol. 2002;240:906–912.
26. Kirchhoff, A, Stachs, O, Guthoff, R. Three-dimensional ultrasound findings of the posterior iris region. Graefes Arch Clin Exp Ophthalmol. 2001;239:968–971.
27. Stachs, O, Schneider, H, Stave, J, et al. Potentially accommodating intraocular lenses – an in vitro and in vivo study using three-dimensional high-frequency ultrasound. J Refract Surg. 2005;21:37–45.
28. Schneider, H, Stachs, O, Göbel, K, et al. Changes of the accommodative amplitude and the anterior chamber depth after implantation of an accommodative intraocular lens. Graefes Arch Clin Exp Ophthalmol. 2006;244:322–329.
29. Jaffe, NS. Complications of acute posterior vitreous detachment. Arch Ophthalmol. 1968;79:568–571.
30. McLeod, D. (chair) Round table discussion on vitreous pathology. Doc Ophthalmol Proc. 1981;Ser:547.
31. Ossoinig, KC. Advances in diagnostic ultrasound. Acta 14th Int Congr Ophthalmol. 1983:89.
32. Till, P, Ossoinig, KC. 10 years’ study on clinical echography in intraocular disease. Bibl Ophthalmol. 1975;83:49.
33. Machemer R, Aalberg TM, eds. Glaskörperchirurgie, Vitrektomie. Indikationen und Technik. Berne: Huber Verlag, 1981.
34. Shapiro, DR, Stone, RD. Ultrasonic characteristics of retinopathy of prematurity presenting with leucokoria. Arch Ophthalmol. 1885;103:1690.
35. Darnley-Fisch, DD, Frazier-Byrne, S, Hughes, JR, et al. Contact B-scan echography in the assessment of optic nerve cupping. Am J Ophthalmol. 1990;109:55.
36. Oksala, A. Echogram in melanoma of the choroid. Br J Ophthalmol. 1959;43:408.
37. Baum, G. Use of ultrasonography in the differential diagnosis of ocular tumors. In: Boniuk M, ed. Ocular and adnexal tumors. St Louis: Mosby; 1964:308.
38. Buschmann, W, Trier, H. Ophthalmologische Ultraschalldiagnostik, mit Atlas, Standardisierung und Einordnung in den ophthalmologischen Untersuchungsbefund. Berlin: Springer; 1989.
39. Trier, H. Gewebsdifferenzierung mit Ultraschall. Bibl Ophthalmol. 1977;86:92.
40. Coleman, DJ, Silverman, R, Rondeau, MJ, et al. Explaining the current role of high frequency ultrasound in ophthalmic diagnosis (ophthalmic ultrasound). Expert Rev Ophthalmol. 2006;1:63–76.
41. Silverman, R, Kong, F, Chen, Y, et al. High-resolution photoacoustic imaging of ocular tissues. Ultrasound Med Biol. 2010;36:733–742.
42. Guthoff, R. Ultraschall in der ophthalmologischen Diagnostik. In: Naumann GOH, Hollwich F, Gloor B, eds. Ein Leitfaden für die Praxis. Stuttgart: Enke-Verlag, 1988.
43. Wolter, J. Parallel horizontal choroidal folds secondary to an orbital tumor. Am J Ophthalmol. 1974;77:669.
44. Coleman, D, Lizzi, S, Jack, R. Ultrasonography of the eye and orbit. Philadelphia: Lea and Febiger; 1977.
45. Bujara, K, von Domarus, D, Guthoff, R. Necrotic malignant melanoma of the choroid with unusual clinical, echographical and histological case study. Ophthalmologica. 1980;180:222–227.
46. Guthoff, R, Berger, R, Helmke, K, et al. Doppersonographische Befunde bei intraokulären Tumoren Forstschr Ophthalmol. 1989;86:239.
47. Bloch, RS, Gartner, S. The incidence of ocular metastatic carcinoma. Arch Ophthalmol. 1971;85:673.
48. Ferry, AP, Font, RI. Carcinoma metastatic to the eye and the orbit: a clinical pathological study of 227 cases. Arch Ophthalmol. 1974;92:276.
49. Verbeek, A. Echographic findings in 36 patients with choroidal folds. Doc Ophthalmol Proc Ser. 1981:29.
50. Manschot, WA. The relation between histopathological and ultrasonographyin intraocular tumors. Doc Ophthalmol Proc Ser. 1981;29:71.
51. Shields CL, Shields JA, Augsburger JJ, editors. Update on choroidal osteomas. Proceedings of the 2nd international meeting on the diagnosis and treatment of intraocular tumors; Lyons; 1987.
52. Wende, S, Aulich, A, Nover, A, et al. Computer tomography of orbital lesions: a cooperative study of 210 cases. Neuroradiology. 1978;13:123.
53. Gass, JDM, Guerry, RK, Jack, RI, et al. Choroidal osteoma. Arch Ophthalmol. 1978;96:428.
54. Gass, JDM. New observations concerning choroidal osteomas. Int Ophthalmol. 71, 1979.
55. Wing, GI, Schepenz, CL, Trempe, CL, et al. Serous choroidal detachment and the thickened choroidal sign detected by ultrasonography. Am J Ophthalmol. 1982;94:499.
56. Blodi, FC. Ein Tuberkulom der Aderhaut, ein melanom vortäuschend. Klin Monatsbl Augenheilkd. 1977;170:845.
57. Wirold, J, Orlowski-Szczypinski, J. Ultrasonography of the subretinal space in rhegmatogeneous retinal detachment. Z Mod Probl Ophthalmol. 1976;18:40.
58. Cappaert, W, Purnell, E, Frank, K. Use of B-scan ultrasound in the diagnosis of benign choroidal folds. Am J Ophthalmol. 1977;84:375.
59. Singh, G, Guthoff, RF, Foster, S. Observations on long-term follow-up of posterior scleritis. Am J Ophthalmol. 1986;101:570.
60. Guthoff, RF. Die differentialdiagnostische Bedeutung des Tenon’schen Raumes. Fortschr Ophthalmol. 1974;81:388.
61. Feldon, S, Sigelman, J, Albert, D, et al. Clinical manifestations of brawny scleritis. Am J Ophthalmol. 1978;85:781.
62. Claudon, M, Tranquart, F, Evans, DH, et al. Advances in ultrasound. Eur Radiol. 2002;12:7–18.