Devices for Assessing Oxygenation and Ventilation
Spirometry
For patients with acute exacerbations of asthma and chronic obstructive pulmonary disease (COPD), accurately estimating the severity of airflow obstruction is a critical component of their care. A focused history plus physical examination is the cornerstone of this assessment in the practice of emergency medicine. The history and physical examination alone, however, cannot reliably quantify airflow obstruction during acute attacks.1–5 In patients with COPD, wide variation exists in the ability to accurately diagnose airway obstruction, and up to 15% of patients with marked airflow obstruction will not be dyspneic.6–9 This blunted perception of disease severity may be a contributor to fatal and near-fatal asthma attacks.10 After therapy for acute exacerbations of asthma, patients may experience subjective resolution of their symptoms even while severe airflow obstruction is still present.11 Given these difficulties in recognizing airflow obstruction, objective measurement provides valuable information.
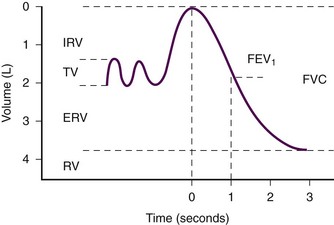
Spirometry is measurement of the volume of air exhaled during forced expiration.12 It can be interpreted as a function of time to determine the flow rate. Spirometry gives the most complete picture of lung mechanics and is the centerpiece of pulmonary function testing. Many parameters can be derived from a spirogram, the most useful of which are forced vital capacity (FVC), which is the total volume exhaled during a forced expiratory maneuver, and forced expiratory volume in 1 second (FEV1), which is the average flow rate during the first second of the forced expiratory maneuver (Fig. 2-1).
The advent of small handheld devices allows convenient spirometric evaluation in the emergency department (ED). The most common objective measurement of respiratory mechanics used in the ED is peak expiratory flow rate (PEFR). PEFR is the maximum flow of gas achieved during a forced expiratory maneuver. It correlates well with standard spirometry and has been studied extensively in the ED setting.13–15
Indications
Evaluation of Acute Asthma Attacks
Currently, no standards exist for the measurement of pulmonary function parameters in ED patients, and practices vary widely. Most patients with asthma exacerbations can be evaluated, treated, and given a disposition with no further pulmonary function testing other than PEFR if quantitative assessment is deemed prudent. Several consensus guidelines recommend obtaining an objective measure of airflow obstruction in all patients seen in the ED with an acute exacerbation of asthma.16–18 Others have proposed that the decision to measure PEFR in patients with acute asthma should be individualized.19 It is reasonable that mild and easily reversible disease be evaluated and treated according to clinical judgment, but if any pulmonary function parameters are to be used, their use is optimized if measured at arrival, after initial treatment, and periodically thereafter.16–18
Evaluation of Exacerbations of COPD
PEFR and spirometry testing can yield objective data on airflow obstruction during the ED evaluation of COPD exacerbations. Though used by some ED practitioners, consensus guidelines do not recommend routine use of these tests in the acute setting.20–22
Differentiating Causes of Dyspnea
PEFR has been studied for its ability to differentiate between COPD and congestive heart failure (CHF).23 Insufficient data exist to recommend its routine use for this purpose in the ED.
Contraindications
Equipment
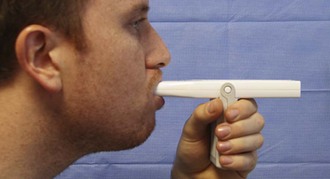
The most commonly used device to measure PEFR is the “mini-Wright” peak-flow flowmeter (Fig. 2-2). These meters provide accurate and reproducible measurements of PEFR.24 The mini-Wright peak-flow flowmeter retains its accuracy for at least 5 years.25 There is significant variation between types and brands of peak-flow flowmeters, so measurements recorded with the same brand of peak-flow flowmeter are most useful when comparing a patient’s baseline PEFR.11,26,27

Figure 2-2 The “mini-Wright” peak flow meter.
Procedure
After a period of normal breathing, ask the patient to take a maximal inspiration with the lips sealed around the mouthpiece while taking care to keep the tongue from partially obstructing the mouthpiece. Request the patient to initiate a rapid, forceful expiration as soon as possible after reaching maximal inspiration (Fig. 2-3). Coach the patient throughout the procedure and remind the patient to continue to make a forceful and complete exhalation. The PEFR usually occurs during the first 100 msec of expiration. In contrast, when performing spirometry, it is essential that the patient exhale fully. With both tests it is important to have a rapid, forceful exhalation rather than a slow, sustained one. Obtain three separate measurements for both spirometry and PEFR.28,29
PEFR measurements are very sensitive to technique and patient effort. Even a small decrease in effort can lead to considerable degradation of results.11,30 Because airflow is greatest when the lung volumes are highest and the airways are larger, the test is accurate only if performed after a maximal inspiration.
Interpretation
Obstructive diseases are characterized by a disproportionate decrease in airflow (FEV1) in relation to the volume of gas exhaled (FVC).31 A decreased FEV1/FVC ratio with preservation of FVC indicates the presence of airflow obstruction. Restrictive diseases decrease total lung capacity and therefore decrease FVC to a greater degree than FEV1. Decreased FVC with a normal or increased FEV1/FVC ratio is indicative of restriction. It is useful to consider the FEV1/FVC ratio when attempting to determine whether a patient has airflow obstruction. In patients with an established diagnosis of obstructive disease, FEV1 is the test that best reflects changes in lung function. Typical values are shown in Table 2-1. These values are dependent on age, gender, ethnicity, and height and can be predicted from mathematical equations.32

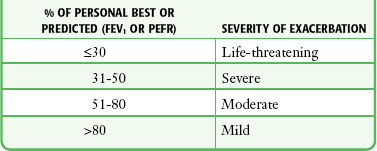
Although measures of airflow obstruction are not stand-alone tests, when considered along with other clinical factors, they can guide decisions regarding the disposition of patients with acute asthma exacerbations. The highest of three PEFR or FEV1 measurements should be used and, whenever possible, compared with the patient’s personal best.16–18 In one study of inner-city patients, only 29% knew their personal best PEFR, and even when known, this number may be unreliable.33 In circumstances in which previous best values are unknown or thought to be inaccurate, comparison with predicted values is appropriate. Normal PEFR values for adults are shown in Figure 2-4. Values for children are presented in Tables 2-2 and 2-3. The National Asthma Education and Prevention Program has used the results of FEV1 and PEFR testing to classify the severity of asthma exacerbations (Table 2-4).16
TABLE 2-4
Severity of Asthma Exacerbations according to Objective Measures of Airflow Obstruction
FEV1, forced expiratory volume in 1 second; PEFR, peak expiratory flow rate.
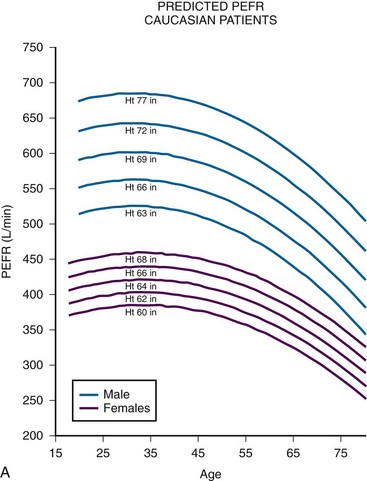
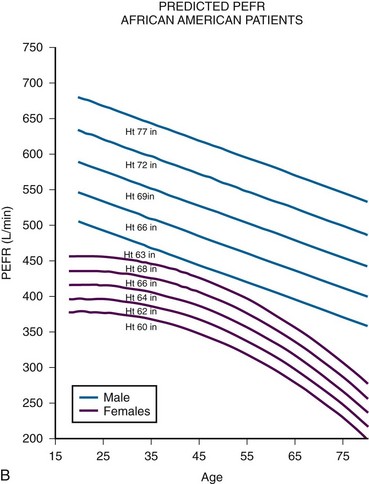
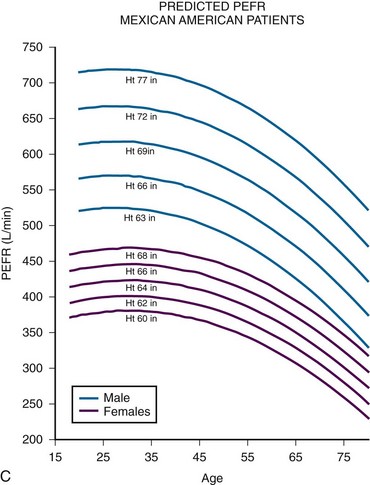
TABLE 2-2
Predicted Peak Expiratory Flow Rate in Males 8-20 Years of Age*


*Based on equations from Hankinson JL, Odencrantz JR, Fedan KB. Spirometric reference values from a sample of the general U.S. population. Am J Respir Crit Care Med. 1999;159:179.
TABLE 2-3
Predicted Peak Expiratory Flow Rate in Females 8-18 Years of Age*

*Based on equations from Hankinson JL, Odencrantz JR, Fedan KB. Spirometric reference values from a sample of the general U.S. population. Am J Respir Crit Care Med. 1999;159:179.
Multiple guidelines and articles have advocated specific cutoff values for PEFR and FEV1 to guide decisions on disposition.16–18 There is variation across these guidelines and no consensus that absolute cutoffs should exist.16 When these values are obtained, they should be viewed as additional data points to be considered, along with other clinical variables, in determining the disposition of asthmatics seen in the ED. At the extremes, data may be useful. For example, asthmatic patients with an initial PEFR greater than 70% of personal best or the predicted value will probably be discharged and those below 35% will probably need admission. Beyond the degree of initial airflow obstruction, the response to inhaled bronchodilators is a useful gauge of suitability for outpatient asthma management. A poor response argues in favor of admission, whereas recovery of PEFR or FEV1 to greater than 70% of personal best is a favorable sign.
Noninvasive Oxygenation Monitoring: Pulse Oximetry
Technology
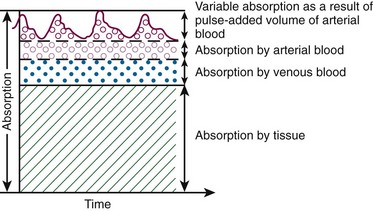
Oximetry is based on the Beer-Lambert law, which states that the concentration of an unknown solute dissolved in a solvent can be determined by light absorption. Pulse oximetry combines the principles of optical plethysmography and spectrophotometry. The probe, set into a reusable clip or a disposable patch, is made up of two photodiodes, which produce red light at 660 nm and infrared light at 900 to 940 nm, and a photodetector, which is placed across a pulsatile vascular bed such as the finger or ear (Fig. 2-5). These particular wavelengths are used because the absorption characteristics of oxyhemoglobin and reduced hemoglobin are quite different at the two wavelengths. The majority of the light is absorbed by connective tissue, skin, bones, and venous blood. The amount of light absorbed by these substances is constant with time and does not vary during the cardiac cycle. A small increase in arterial blood occurs with each heartbeat, thereby resulting in an increase in light absorption (Fig. 2-6). By comparing the ratio of pulsatile and baseline absorption at these two wavelengths, the ratio of oxyhemoglobin to reduced hemoglobin is calculated.
Physiology
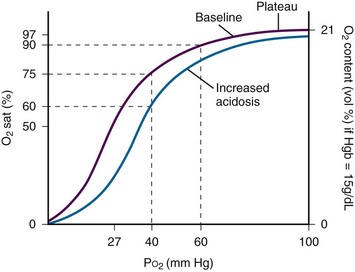
Arterial O2 saturation (Sao2) measures the large reservoir of O2 carried by hemoglobin, 20 mL of O2/100 mL of blood, whereas arterial O2 partial pressure (Pao2) measures only the relatively small amount of O2 dissolved in plasma, approximately 0.3 mL of O2/100 mL of blood. Sao2 correlates well with Pao2, but the relationship is nonlinear and is described by the oxyhemoglobin dissociation curve (Fig. 2-7). In hypoxemic patients, small changes in Sao2 represent large changes in Pao2 because these Sao2 values fall on the steep portion of the curve. Conversely, measurements of Sao2 are relatively insensitive in detecting significant changes in Pao2 at high levels of oxygenation because these Sao2 values fall on the plateau portion of the curve.
Clinical Utility
Data on the clinical efficacy of routine pulse oximetry monitoring in the ED are limited, so clinical value has been extrapolated from anesthesia studies.34–36 These studies have demonstrated that continuous monitoring of saturation decreases the incidence and duration of desaturation episodes, thereby resulting in fewer adverse events during recovery and shortening the time to discovery of hypoxia. It follows logically that use in critically ill patients should result in similar benefits, including more rapid recognition of adverse physiologic events and fewer episodes of severe arterial desaturation. Patient outcomes should be improved by initiation of therapeutic interventions following immediate notification of an unfavorable Sao2.37
Indications
Recommended uses for pulse oximetry fall into two broad categories: (1) as a real-time indicator of hypoxemia, continuous oximetry monitoring can be used as a warning system because many adverse patient events are associated with arterial desaturation,38 and (2) as an end point for titration of therapeutic interventions to avoid hypoxia (Box 2-1).
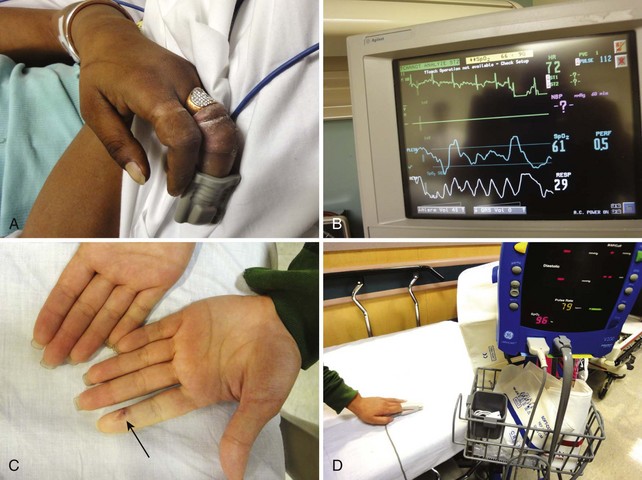
Pulse oximetry can also be used to assess peripheral perfusion and evaluate for possible ischemia in the extremities. Such use is not standardized, and although clinical experience validates its use, minimal data are available for such utilization in the ED. Vascular surgeons will use a pulse oximetry probe on a finger or toe to assess the results of vascular surgery on the arm or leg. Peripheral artery occlusion from peripheral artery disease may be suggested by comparison of pulse oximetry readings in the extremities. Decreased peripheral oxygenation may be detected in patients with compartment syndrome, traumatic arterial injury, and external compression of the proximal circulation (Fig. 2-8).39,40
Procedure
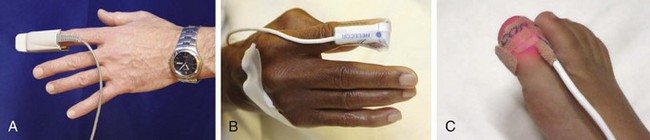
The location for the probe is determined by the clinical situation and the probes available. A reusable clip-on probe works well on digits that are easily accessible. Other sites include the earlobe, the nasal bridge, the septum, the temporal artery, and the foot or palm of an infant. A newer probe developed for use on the forehead may provide better readings in cold ambient temperature or during movement.41 Tape and splints can also be used to secure oximetry probes and minimize motion.
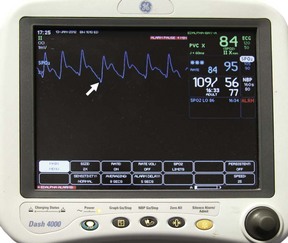
The computer analyzes the incoming data to identify the arteriolar pulsation and displays this parameter as beats per minute. Newer devices also display a pulse plethysmograph (Fig. 2-9). Simultaneously, O2 saturation is displayed on a beat-to-beat basis. Some machines have hard-copy capability and can provide paper documentation of the patient’s status. Machines differ in their display when a pulsatile flow is not detected. Either the reading will not display at all, or the Sao2 value will be given along with a poor-signal quality warning. It is important to evaluate serial measurements and to verify that the measurements correlate with other clinical markers.
Interpretation
Although pulse oximetry represents a significant advance in noninvasive monitoring of oxygenation, clinicians must recognize and understand its limitations.42 Pulse oximetry measures only O2 saturation. In contrast to arterial blood gas determination or capnography, pulse oximetry provides no direct information on pH or the arterial partial pressure of CO2 (Paco2). Witting and Lueck43 empirically demonstrated that a room-air Sao2 value of 97% or higher strongly rules against hypoxemia and moderate to severe hypercapnia. Their validated study of patients with respiratory complaints undergoing arterial blood gas analysis found good discrimination with a room-air Sao2 value of 96% or less. For hypoxemia (Pao2 <70 mm Hg), this value was 100% sensitive and 54% specific. For hypercapnia (Paco2 >50 mm Hg), this value was 100% sensitive and 31% specific. Kelly and colleagues44 found a cutoff value of 92% or less for room-air Sao2 to be more accurate in identifying hypoxemia in patients with COPD.
Pulse oximetry is not a substitute for monitoring ventilation because of the variable lag time between the onset of hypoventilation or apnea and a change in oxygen saturation.45 Therefore, during procedural sedation, monitoring of ventilation is a more desirable goal for prevention of hypoxemia and hypercapnia than simple pulse oximetry is (see “Procedural Sedation and Analgesia” under “Carbon Dioxide Monitoring” later in this chapter). Hypoventilation and the resultant hypercapnia may precede a decrease in hemoglobin O2 saturation by many minutes. Furthermore, supplemental O2 may mask hypoventilation by delaying the eventual O2 desaturation that pulse oximetry is designed to monitor and recognize. In preoxygenated animals, airway obstruction was detected within 10 seconds with capnography, but Sao2 values did not change during the 180-second study periods.45 Other limitations of pulse oximetry are summarized in Box 2-2.
Sources of Interference
In patients with methemoglobinemia or elevated carboxyhemoglobin levels, pulse oximetry does not accurately depict quantitative changes in hemoglobin O2 saturation.46,47 Carboxyhemoglobin results in falsely elevated Sao2 estimates of hemoglobin O2 saturation. Low quantities of methemoglobin will reduce pulse oximetry readings by about half the actual methemoglobin percentage. Large quantities of methemoglobin (>10%) can result in a stable pulse oximetry reading of 85% regardless of the actual Sao2. Because pulse oximetry will variably underestimate the percentage of abnormal hemoglobin, a CO-oximeter or blood gas sample is required for confirmation of these conditions and quantitative analysis.
Intravenous Dyes
A number of dyes and pigments interfere with the accuracy of pulse oximetry.48 Methylene blue, the treatment of methemoglobinemia, absorbs light at 660 nm, which is similar to the absorption of reduced hemoglobin, and can significantly decrease pulse oximeter saturation readings to as low as 1%. Low readings can also be seen with other intravenous dyes such as indigo carmine, indocyanine green, and fluorescein, although the rapid clearance of these agents minimizes this phenomenon.
Nail Polish
Conflicting data exist about the effect of nail polish on the accuracy of pulse oximetry.49,50 Mounting the probe side to side on the finger was found to correspond to readings on uncovered nails.51 This technique also circumvents the problem of only partial placement of the probe because of very long fingernails, which may cause a low O2 saturation reading. An alternative solution to the problem of nail polish is to remove it with acetone. The accuracy of Sao2 readings in the setting of synthetic nails is unknown. If a poor signal is obtained through a synthetic nail, either the nail should be removed or an alternative site should be used for placement.
Anemia
Because pulse oximetry depends on light absorption by hemoglobin, it becomes less accurate and less reliable in conditions of severe anemia. Studies suggest that a hemoglobin content below 5 mg/dL is likely to affect oximetry readings.52,53
CO2 Monitoring
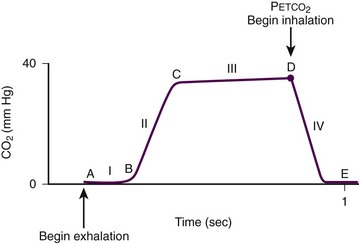
The relationship of CO2 concentration to time is graphically represented by the CO2 waveform or capnogram (Fig. 2-10). The maximum CO2 concentration at the end of each tidal breath is the end-tidal CO2 pressure (Petco2). Changes in the shape of the capnogram are diagnostic of disease conditions, whereas changes in Petco2 can be used to assess disease severity and response to treatment.
Technology
Capnography became a routine part of anesthesia practice in Europe in the 1970s and in the United States in the 1980s.54 Capnography was incorporated into the American Heart Association (AHA) guidelines in 2000 and the American College of Emergency Physicians (ACEP) guidelines in 2001 and has become the standard of care for verification of endotracheal (ET) tube placement in the operating room, the ED, and the prehospital setting.
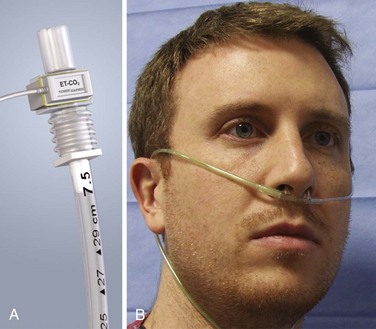
CO2 monitors measure gas concentration or partial pressure by using one of two configurations, depending on the location of the sensor: mainstream or sidestream (Fig. 2-11). Mainstream devices measure CO2 directly from the airway, with the sensor located at the proximal end of the ET tube. Sidestream devices measure CO2 by aspirating a small sample from the exhaled breath through tubing and a sensor located inside the monitor. Mainstream systems are configured only for intubated patients because the sensor is located on the ET tube. Sidestream systems do not require an ET tube because the sensor is located inside the monitor and may therefore be used in either intubated or nonintubated patients. The airway interface for intubated patients is an airway adapter placed on the hub of the ET tube. For spontaneously breathing patients, a nasal-oral cannula is used. This allows concomitant CO2 sampling and delivery of low-flow oxygen to the patient.
Sidestream systems can be high flow (requiring 150 mL/min of CO2 in the breath sample to obtain an accurate reading) or low flow (requiring 50 mL/min of CO2). Low-flow sidestream systems have a lower occlusion rate (from moisture or patient secretions) and are more accurate in patients with low tidal volumes (neonates, infants, and patients with hypoventilation and low–tidal volume breathing).55
CO2 monitors can be either quantitative or qualitative (Fig. 2-12). Quantitative devices measure the precise Petco2 as either a number (capnometry) or a number and a waveform (capnography). Qualitative devices measure the range in which Petco2 falls (e.g., 0 to 10 mm Hg, >35 mm Hg) as opposed to a precise value (e.g., 38 mm Hg). The most commonly used qualitative device is the colorimetric Petco2 detector, which consists of a piece of specially treated litmus paper that turns color when exposed to CO2. Its primary use is for verification of ET tube position. If the tube is in the trachea, the resultant exhalation of CO2 will change the color of the litmus paper; if the tube is in the esophagus with no CO2 in the breath, no change in color will take place.
Physiology
The capnogram, which corresponds to a single tidal breath, consists of four phases (ascending phase, alveolar plateau, inspiratory limb, dead space ventilation) (see Fig. 2-10). Each phase has conventionally been approximated as a straight line.54–56 Phase I (dead space ventilation, A to B) represents the beginning of exhalation in which dead space is cleared from the upper airway. Phase II (ascending phase, B to C) represents the rapid rise in CO2 concentration in the breath stream as CO2 from the alveoli reaches the upper airway. Phase III (alveolar plateau, C to D) represents the CO2 concentration reaching a uniform level in the entire breath stream (from alveolus to nose) and concludes with a point of maximum CO2 pressure (Petco2). This is the number that appears on the monitor display. Phase IV (D to E) represents the inspiratory cycle in which the CO2 concentration drops to zero as atmospheric air enters the airway.
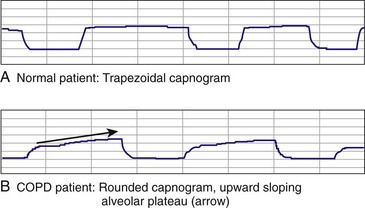
Patients with normal lung function, irrespective of age, will have a characteristic rectangular- or trapezoidal-shaped capnogram and a narrow Petco2-Pco2 gradient (0 to 5 mm Hg), with Petco2 accurately reflecting Paco2.57 Patients with obstructive lung disease will have a more rounded ascending phase and an upward slope in the alveolar plateau (Fig. 2-13).58 In patients with abnormal lung function from  mismatch, the gradient will widen, depending on the severity of the lung disease, and Petco2 will be useful only for trending ventilatory status over time and not as a spot check because it may not correlate with Paco2.59,60
Indications for Intubated Patients
• Verification of ET tube placement
• Continuous monitoring of tube location during transport
• Gauging the effectiveness of resuscitation and prognosis during cardiac arrest
• Titrating Petco2 levels in patients with suspected increases in intracranial pressure
Verification of ET Tube Placement
Unrecognized misplaced intubation (UMI) is placement of an ET tube in a location other than the trachea that is not recognized by the clinician. This life-threatening condition has been extensively documented in the EMS literature, with early studies reporting a 0.4% to 8% UMI rate. Katz and Falk61 in 2001 were the first to perform a study with the primary outcome of identifying the rate of UMI and noted an alarming rate of 25%. More recent EMS studies have reported UMI rates of 7% to 10%.62,63
The accuracy of Petco2 in confirming the tracheal location of an ET tube varies according to the type of CO2 technology used. In patients who are not in cardiac arrest, qualitative colorimetric Petco2 and quantitative capnography studies have demonstrated 100% sensitivity and specificity for tracheal placement.64 In marked contrast, the use of clinical signs for verification has been shown to be unreliable. Fogging or condensation of the tube occurs in 80% of esophageal tubes,65 chest wall movement can be produced by tracheal or esophageal tubes,66 and anesthesiologists under ideal operating room conditions, using breath sounds as the sole means of verification, incorrectly identified tube location in 16% of cases.67
Although the accuracy of Petco2 in verifying ET tube placement is 100% in patients with spontaneous circulation or low-perfusion states, sensitivity for tracheal placement in cardiac arrest patients ranges from 62% to 100%, depending on the type of CO2 monitoring used and the duration of the arrest.64,68 The specificity of capnography for esophageal intubation in patients in cardiac arrest is uncertain because of the small number of esophageal intubations in cardiac arrest studies. When a waveform is present in an intubated patient in cardiac arrest, the ET tube can be assumed to be in the trachea. However, absence of a waveform may result from esophageal intubation or a correctly placed ET tube in a patient with insufficient pulmonary blood flow.
Monitoring Tube Position during Transport
UMI (as a result of either initial misplacement of the ET tube or subsequent dislodgment during transport) can have catastrophic consequences. However, UMI is largely preventable. Continuous monitoring of tube position during transport (prehospital to hospital, interhospital, or intrahospital) is essential for patient safety. Petco2 confirmation of initial ET tube placement with continuous monitoring of tube position is an accepted standard of care by the American Society of Anesthesiologists and is recommended by other national organizations as well.69 In 2005, Silvestri and coworkers70 studied the impact of continuous Petco2 monitoring on the UMI rate and found a 23% UMI rate in the group that did not use continuous Petco2 monitoring and a 0% UMI rate in the group that did.
Gauging the Effectiveness of Cardiopulmonary Resuscitation
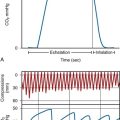
In the 1980s, studies in animal models demonstrated that Petco2 levels reflect cardiac output during cardiopulmonary resuscitation (CPR) and can be used as a noninvasive measure of cardiac output. A landmark study in 1988 demonstrated this principle in humans (Fig. 2-14).71 During cardiac arrest, when alveolar ventilation and metabolism are essentially constant, Petco2 reflects the degree of pulmonary blood flow. Therefore, Petco2 can be used as a gauge of the effectiveness of cardiac compressions. Effective cardiac compression leads to higher cardiac output, and the resultant increase in perfusion corresponds to a rise in Petco2 from baseline. Additional prehospital- and intensive care-based studies found Petco2 levels lower than 3 mm Hg at the onset of cardiac arrest, with higher levels being generated during cardiac compressions and a mean peak greater than 7.5 mm Hg occurring ust before return of spontaneous circulation (ROSC).71,72
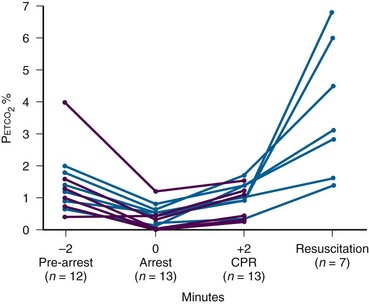
Indicator of ROSC
A peak in Petco2 is the earliest sign of ROSC and may occur before palpable or measurable hemodynamic signs (pulse or blood pressure).71 When the heart is restarted, the dramatic increase in cardiac output and the resulting increase in perfusion lead to a rapid increase in Petco2 from baseline as the CO2 that has built up in the blood during cardiac arrest is effectively transported to the lungs and exhaled.
The AHA guidelines emphasize the importance of continuing chest compressions without interruption until a perfusing rhythm is reestablished. Experimental evidence indicates that interruptions in chest compressions are followed by sustained periods during which flow gradually returns to pre-interruption levels. Capnographic monitoring virtually eliminates the need to “stop pumping” for the purpose of checking for pulses. Reestablishment of a perfusing rhythm will be immediately accompanied by a dramatic increase in Petco2, at which point chest compressions can safely be stopped while ECG rhythm and blood pressure are reassessed.64
The 2010 AHA guidelines further emphasize the importance of capnography for both verification of ET tube placement (class I) and management of cardiac arrest (monitoring CPR quality class IIb, indicating ROSC class IIa).73
Titrating ETCO2 in Patients with Suspected Increased Intracranial Pressure
Sustained hyperventilation is also detrimental and associated with worse neurologic outcome in severely brain-injured patients. Consequently, unless a patient is actively herniating, ventilation with CO2 monitoring to achieve normocapnia is recommended.74,75 The benefit of Petco2 monitoring for this indication has been demonstrated in two prehospital-based studies. Severely head-injury patients monitored with continuous Petco2 had a lower incidence of inadvertent hyperventilation than did those without Petco2 monitoring and were more likely to arrive at the ED appropriately ventilated.76,77
Petco2 monitoring has also demonstrated prognostic value in determining outcome in trauma victims. In a study of blunt trauma patients requiring prehospital intubation, Petco2 levels were able to distinguish survival from nonsurvival groups.78
Indications for Capnography in Spontaneously Breathing Patients
In spontaneously breathing, nonintubated patients, capnography can be used for
• Rapid assessment of critically ill, injured, or seizing patients through assessment of the airway, breathing, and circulation (ABCs)
• Assessment and triage of victims of chemical terrorism and mass casualty
• Gauging the severity and response to treatment in patients with acute respiratory distress
• Determining the adequacy of ventilation in patients with altered mental status
• Detecting metabolic acidosis in diabetic patients and children with gastroenteritis
Assessment of Critically Ill, Injured, or Seizing Patients
The ABCs of critically ill or injured patients can be assessed rapidly by using the capnogram and Petco2. The presence of a normal waveform denotes a patent airway and spontaneous breathing.79 Normal Petco2 (35 to 45 mm Hg) signifies adequate perfusion.71,80
Capnography can be used to assess and triage critically ill or injured patients and actively seizing patients.81 Unlike pulse oximetry, capnography is not affected by motion artifact and provides reliable readings in low-perfusion states.
Assessment and Triage of Victims of Chemical Terrorism and Mass Casualty
EDs and EMS systems have focused on training to identify and effectively manage mass casualty and chemical terrorism events. Capnography can serve as a noninvasive assessment tool to quickly identify the common life-threatening complications of chemical terrorism.82 It can rapidly detect the common airway, respiratory, and central nervous system adverse events associated with nerve agents, including apnea, upper airway obstruction, laryngospasm, bronchospasm, respiratory failure, seizures, and coma (Table 2-5).
TABLE 2-5
Capnographic Identification of Life-Threatening Complications of Nerve Agents
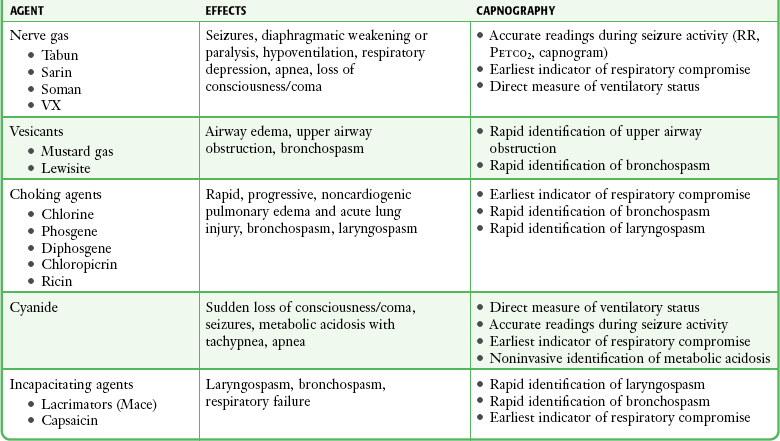
Petco2, end-tidal carbon dioxide pressure; RR, respiratory rate.
Modified from Krauss B. Capnography as rapid assessment and triage tool for chemical terrorism. Pediatr Emerg Care. 2005;21:493.
Gauging Severity and Response to Treatment of Patients in Acute Respiratory Distress
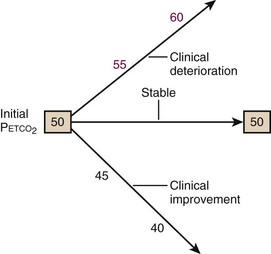
Petco2 trends can be assessed rapidly, especially in tachypneic patients. For example, a patient with an RR of 30 breaths/min will generate 150 Petco2 readings in 5 minutes. This provides sufficient information to determine whether the patient’s ventilation is worsening despite treatment (increasing Petco2), stabilizing (stable Petco2), or improving (decreasing Petco2) (Fig. 2-15).
Procedural Sedation and Analgesia
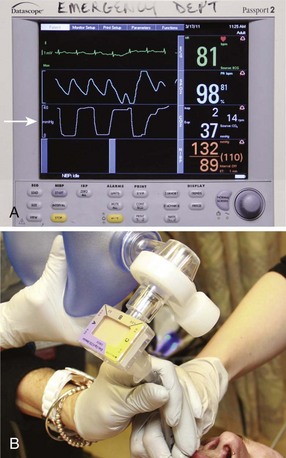
Pulse oximetry is the standard technique for monitoring procedural sedation in the ED, but capnography can also detect the common adverse airway and respiratory events associated with procedural sedation and analgesia.83 Capnography is the earliest indicator of airway or respiratory compromise and will show an abnormally high or low Petco2 well before pulse oximetry detects a falling oxyhemoglobin saturation, especially in patients receiving supplemental oxygen (Fig. 2-16). In addition, as discussed earlier, capnography provides a non–impedance-based RR directly from the airway, which is more accurate than impedance-based respiratory monitoring, especially in patients with obstructive apnea or laryngospasm.
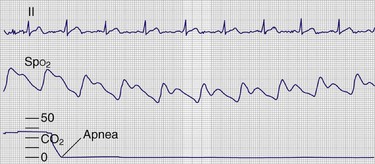
Figure 2-16 Capnographic detection of apnea.
Both central and obstructive apnea can be detected almost instantaneously by capnography (Table 2-6). Loss of the capnogram, in conjunction with no chest wall movement and no breath sounds on auscultation, confirms the diagnosis of central apnea. Obstructive apnea is characterized by loss of the capnogram with continued chest wall movement but absent breath sounds. Response to airway alignment maneuvers can further distinguish upper airway obstruction from laryngospasm.
TABLE 2-6
Capnographic Airway Assessment for Procedural Sedation and Analgesia
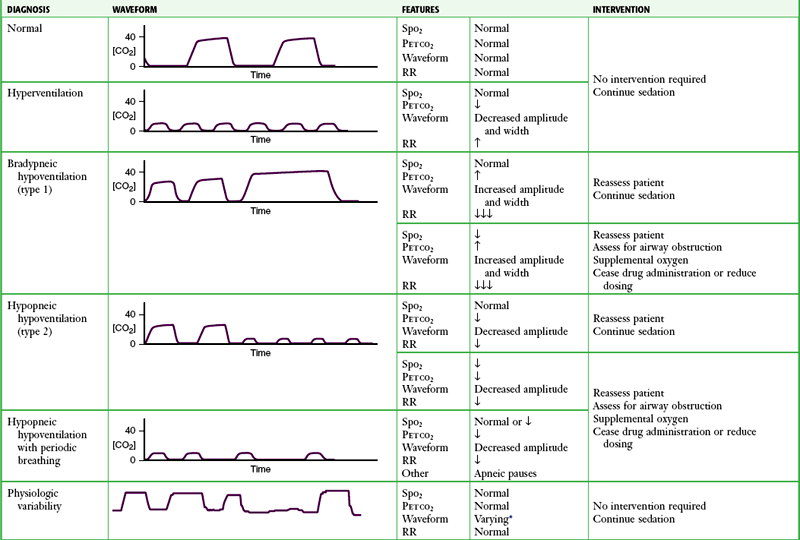
*Varying waveform amplitude and width.
Capnography may be more sensitive than clinical assessment of ventilation in detecting apnea. In one study, 10 of 39 patients (26%) experienced 20-second periods of apnea during procedural sedation and analgesia. All 10 episodes of apnea were detected by capnography but not by the anesthesia providers.84
Because the amplitude of the capnogram is determined by Petco2 and the width is determined by the expiratory time, changes in either of these parameters affect the shape of the capnogram. Hyperventilation (increased RR, decreased Petco2) results in a low-amplitude and narrow capnogram, whereas classic hypoventilation (decreased RR, increased Petco2) results in a high-amplitude and wide capnogram (see Table 2-6). Acute bronchospasm results in a capnogram with a curved ascending phase and an up-sloping alveolar plateau (see Fig. 2-13). A Petco2 reading higher than 70 mm Hg in patients without chronic ventilation problems indicates respiratory failure.
Two types of drug-induced hypoventilation occur during procedural sedation and analgesia (see Table 2-6).83 Bradypneic hypoventilation (type 1), commonly seen with opioids, is characterized by increased Petco2 and increased Paco2. RR is depressed proportionally greater than tidal volume, which results in bradypnea, an increase in expiratory time, and a rise in Petco2, graphically represented by a high-amplitude, wide capnogram (see Table 2-6).
Detection of Metabolic Acidosis
Recent studies have shown that Petco2 and serum bicarbonate (HCO3) are well correlated in patients with diabetes and gastroenteritis. Petco2 can be used as an indicator of metabolic acidosis in these patients (Fig. 2-17).85–87 As the patient becomes acidotic (i.e., HCO3 decreases), a compensatory respiratory alkalosis develops with an increase in minute ventilation and a resultant decrease in Petco2. By increasing minute ventilation, these patients are able to lower arterial CO2 tension to help correct the underlying acidemia. The more acidotic, the lower the HCO3, the higher the RR, and the lower the Petco2.
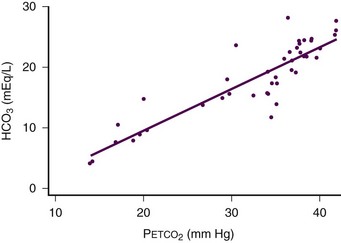
Petco2 can be used to distinguish diabetics in ketoacidosis (metabolic acidosis, compensatory tachypnea, low Petco2) from those who are not (nonacidotic, normal RR, normal Petco2). In a study of diabetic children encountered in the ED, a Petco2 reading of less than 29 mm Hg identified 95% of the patients with ketoacidosis with 83% sensitivity and 100% specificity. Conversely, no ketoacidosis was detected in patients with Petco2 greater than 36 mm Hg.85
A similar association between Petco2 and HCO3 was demonstrated in children with gastroenteritis, with maximal sensitivity occurring at a Petco2 of 34 mm Hg or lower (sensitivity of 100%, specificity of 60%) and optimal specificity without compromise of sensitivity occurring at a Petco2 of 31 mm Hg or lower (sensitivity of 76%, specificity of 96%).87
Limitations
Problems with accuracy continue to affect high-flow sidestream systems. When the tidal volume of the patient drops below the flow rate of the system (e.g., neonates, infants, hypoventilating patients with low–tidal volume breathing), the monitor will entrain room air, thereby falsely diluting Petco2 and slurring the ascending phase of the waveform.88–90
References
1. Emerman, CL, Cydulka, RK. Effect of pulmonary function testing on the management of acute asthma. Arch Intern Med. 1995;155:2225.
2. Shim, CS, Williams, MH, Jr. Evaluation of the severity of asthma: patients versus physicians. Am J Med. 1980;68:11.
3. Emerman, CL, Lukens, TW, Effron, D. Physician estimation of FEV1 in acute exacerbation of COPD. Chest. 1994;105:1709.
4. Kelsen, SG, Kelsen, DP, Fleeger, BF, et al. Emergency room assessment and treatment of patients with acute asthma. Adequacy of the conventional approach. Am J Med. 1978;64:622.
5. Shim, CS, Williams, MH, Jr. Relationship of wheezing to the severity of obstruction in asthma. Arch Intern Med. 1983;143:890.
6. Cydulka, RK, Emerman, CL, Rowe, BH, et al. Differences between men and women in reporting of symptoms during an asthma exacerbation. Ann Emerg Med. 2001;38:123.
7. Kendrick, AH, Higgs, CM, Whitfield, MJ, et al. Accuracy of perception of severity of asthma: patients treated in general practice. BMJ. 1993;307:422.
8. Burdon, JG, Juniper, EF, Killian, KJ, et al. The perception of breathlessness in asthma. Am Rev Respir Dis. 1982;126:825.
9. Rubinfeld, AR, Pain, MC. Perception of asthma. Lancet. 1976;1:882.
10. Kikuchi, Y, Okabe, S, Tamura, G, et al. Chemosensitivity and perception of dyspnea in patients with a history of near-fatal asthma. N Engl J Med. 1994;330:1329.
11. Jain, P, Kavuru, MS, Emerman, CL, et al. Utility of peak expiratory flow monitoring. Chest. 1998;114:861.
12. Petty, TL. John Hutchinson’s mysterious machine revisited. Chest. 2002;121(5 suppl):219S.
13. Emerman, CL, Cydulka, RK. Use of peak expiratory flow rate in emergency department evaluation of acute exacerbation of chronic obstructive pulmonary disease. Ann Emerg Med. 1996;27:159.
14. Martin, TG, Elenbaas, RM, Pingleton, SH. Use of peak expiratory flow rates to eliminate unnecessary arterial blood gases in acute asthma. Ann Emerg Med. 1982;11:70.
15. Langhan, ML, Spiro, DM. Portable spirometry during acute exacerbations of asthma in children. J Asthma. 2009;46:122.
16. National Asthma Education and Prevention Program. Expert Panel Report 3 (EPR3): Guidelines for the Diagnosis and Management of Asthma. Bethesda, MD: National Heart, Lung, and Blood Institute; 2007.
17. Boulet, LP, Becker, A, Berube, D, et al. Canadian Asthma Consensus Report, 1999. Canadian Asthma Consensus Group. CMAJ. 1999;161(11 suppl):S1.
18. British Thoracic Society and Scottish Intercollegiate Guidelines Network. British guideline on the management of asthma. Thorax. 2008;63:iv1–iv121.
19. American College of Emergency Physicians. Use of Peak Flow Monitoring for the Management of Asthma in Adults in the Emergency Department. Dallas: American College of Emergency Physicians; 2007.
20. Global Initiative for Chronic Obstructive Lung Disease. Global Strategy for the Diagnosis, Management, and Prevention of Chronic Obstructive Pulmonary Disease, 2011. Available at http://www.goldcopd.org/guidelines-global-strategy-for-diagnosis-management.html. Accessed October 2012.
21. American Thoracic Society and European Respiratory Society. Standards for the Diagnosis and Management of Patients with COPD. 2004. Available at http://www.thoracic.org/clinical/copd-guidelines/resources/copddoc.pdf. Accessed October 2012.
22. National Institute for Clinical Excellence. Management of Chronic Obstructive Pulmonary Disease in Adults in Primary and Secondary Care. 2010. Available at http://www.nice.org.uk/GS101. Accessed October 2012.
23. McNamara, RM, Cionni, DJ. Utility of the peak expiratory flow rate in the differentiation of acute dyspnea. Cardiac vs pulmonary origin. Chest. 1992;101:129.
24. Wright, BM, Mckerrow, CB. Maximum forced expiratory flow rate as a measure of ventilatory capacity—with a description of a new portable instrument for measuring it. Br Med J. 1959;4:1041.
25. Douma, WR, van der Mark, TW, Folgering, HT, et al. Mini-Wright peak flow meters are reliable after 5 years use. Dutch CNSLD Study Group. Eur Respir J. 1997;10:457.
26. Koyama, H, Nishimura, K, Ikeda, A, et al. Comparison of four types of portable peak flow meters (Mini-Wright, Assess, Pulmo-graph and Wright Pocket meters). Respir Med. 1998;92:505.
27. Deng, CT, Azizi, BH. An evaluation of the agreement between three peak flow meters: Wright’s, Miniwright’s, and Pocket, when used in children. J Asthma. 1996;33:125.
28. Miller, MR, Hankinson, J, Brusasco, V, et al. Standardisation of spirometry. Eur Respir J. 2005;26:319.
29. Holcroft, CA, Eisen, EA, Sama, SR, et al. Measurement characteristics of peak expiratory flow. Chest. 2003;124:501.
30. Baren, JM, Zorc, JJ. Contemporary approach to the emergency department management of pediatric asthma. Emerg Med Clin North Am. 2002;20:115.
31. Pellegrino, R, Viegi, G, Brusasco, V, et al. Interpretative strategies for lung function tests. Eur Respir J. 2005;26:948.
32. Hankinson, JL, Odencrantz, JR, Fedan, KB. Spirometric reference values from a sample of the general U.S. population. Am J Respir Crit Care Med. 1999;159:179.
33. Diner, B, Brenner, B, Camargo, CA, Jr. Inaccuracy of “personal best” peak expiratory flow rate reported by inner-city patients with acute asthma. J Asthma. 2001;38:127.
34. Morris, RW, Busehman, A, Warren, D, et al. The prevalence of hypoxemia detected by pulse oximetry during recovery from anesthesia. J Clin Monit. 1988;4:16.
35. McKay, WPS, Noable, WH. Critical incidents detected by pulse oximetry during anesthesia. Can J Anaesth. 1988;35:265.
36. Cooper, JB, Cullen, DJ, Nemeskal, R, et al. Effects of information feedback and pulse oximetry on the incidence of anesthesia complications. Anesthesiology. 1987;67:686.
37. The Technology Assessment Task Force of the Society of Critical Care Medicine. A model for technology assessment applied to pulse oximetry. Crit Care Med. 1993;21:615.
38. New, W. Pulse oximetry. J Clin Monit. 1985;1:126.
39. Joyce, WP, Walsh, K, Gough, DB, et al. Pulse oximetry: a new non-invasive assessment of peripheral arterial occlusive disease. Br J Surg. 1990;77:1115.
40. Kwon, JN, Lee, WB. Utility of digital pulse oximetry in the screening of lower extremity arterial disease. J Korean Surg Soc. 2012;82:94.
41. Nuhr, M, Hoerauf, K, Joldzo, A, et al. Forehead SpO2 monitoring compared to finger SpO2 recording in emergency transport. Anaesthesia. 2004;59:390.
42. Sinex, JE. Pulse oximetry: principles and limitations. Am J Emerg Med. 1999;17:59.
43. Witting, MD, Lueck, CH. The ability of pulse oximetry to screen for hypoxemia and hypercapnia in patients breathing room air. J Emerg Med. 2001;20:341.
44. Kelly, A-M, McAlpin, R, Kyle, E. How accurate are pulse oximeters in patients with acute exacerbations of chronic obstructive airways disease? Respir Med. 2001;95:336.
45. Poirier, MP, Gonzalez Del-Rey, JA, McAneney, CM, et al. Utility of monitoring capnography, pulse oximetry, and vital signs in the detection of airway mishaps: a hyperoxemic animal model. Am J Emerg Med. 1998;16:350.
46. Bozeman, WP, Myers, RAM, Barish, RA. Confirmation of the pulse oximetry gap in carbon monoxide poisoning. Ann Emerg Med. 1997;30:608.
47. Barker, SJ, Tremper, KK, Hyatt, J. Effects of methemoglobinemia on pulse oximetry and mixed venous oximetry. Anesthesiology. 1989;70:112.
48. Scheller, M, Unger, R, Kelner, M. Effects of intravenously administered dyes on pulse oximetry readings. Anesthesiology. 1986;65:550.
49. Cote, CJ, Goldstein, EA, Fuchsman, WH, et al. The effect of nail polish on pulse oximetry. Anesth Analg. 1988;67:683.
50. Yamamoto, LG, Yamamoto, JA, Yamamoto, JB. Nail polish does not significantly affect pulse oximetry measurements in mildly hypoxic subjects. Respir Care. 2008;53:1470.
51. Chan, MM, Chan, MM, Chan, ED. What is the effect of fingernail polish on pulse oximetry? Chest. 2003;123:163.
52. Severinghaus, JW, Koh, SO. Effect of anemia on pulse oximeters accuracy at low saturation. J Clin Monit. 1990;6:85.
53. Lee, S, Tremper, KK, Barker, SJ. Effects of anemia on pulse oximetry and continuous mixed venous hemoglobin saturation monitoring in dogs. Anesthesiology. 1991;75:118.
54. Smalhout, B, Kalenda, Z. An Atlas of Capnography. Utrecht, The Netherlands: Kerckebusch Zeist; 1975.
55. Colman, Y, Krauss, B. Microstream capnography technology: a new approach to an old problem. J Clin Monit. 1999;15:403.
56. Berengo, A, Cutillo, A. Single-breath analysis of carbon dioxide concentration records. J Appl Physiol. 1961;16:522.
57. Hoffbrand, BI. The expiratory capnogram: a measure of ventilation-perfusion inequalities. Thorax. 1966;21:518.
58. Krauss, B, Deykin, A, Lam, A, et al. Capnogram shape in obstructive lung disease. Anesth Analg. 2005;100:884.
59. Yamanaka, MK, Sue, DY. Comparison of arterial-end-tidal Pco2 difference and dead space/tidal volume ratio in respiratory failure. Chest. 1987;92:832.
60. Hardman, JG, Aitkenhead, AR. Estimating alveolar dead space from the arterial to end-tidal CO2 gradient: a modeling analysis. Anesth Analg. 2003;97:1846.
61. Katz, SH, Falk, JL. Misplaced endotracheal tubes by paramedics in an urban emergency medical services system. Ann Emerg Med. 2001;37:32.
62. Jones, JH, Murphy, MP, Dickson, RL, et al. Emergency physician-verified prehospital intubation, missed rates by ground paramedics. Acad Emerg Med. 2003;10:448.
63. Jemmett, ME, Kendall, KM, Fourre, MW, et al. Unrecognized misplaced endotracheal tubes in a mixed urban-to-rural EMS setting. Acad Emerg Med. 2003;10:481.
64. Grmec, S. Comparison of three different methods to confirm tracheal tube placement in emergency intubation. Intensive Care Med. 2002;28:701.
65. Kelly, JJ, Eynon, CA, Kaplan, JL, et al. Use of tube condensation as an indicator of endotracheal tube placement. Ann Emerg Med. 1998;31:575.
66. Pollard, BJ, Junius, F. Accidental intubation of the oesophagus. Anaesth Intensive Care. 1980;8:183.
67. Birmingham, PK, Cheney, FW, Ward, RJ. Esophageal intubation: a review of detection techniques. Anesth Analg. 1986;65:886.
68. Sayah, AJ, Peacock, WF, Overton, DT. End-tidal CO2 measurement in the detection of esophageal intubation during cardiac arrest. Ann Emerg Med. 1990;19:857.
69. Practice guidelines for management of the difficult airway: an updated report by the American Society of Anesthesiologists task force on management of the difficult airway. Anesthesiology. 2003;98:1269.
70. Silvestri, S, Ralls, GA, Krauss, B, et al. The effectiveness of out-of-hospital use of continuous end-tidal carbon dioxide monitoring on the rate of unrecognized misplaced intubation within a regional emergency medical services system. Ann Emerg Med. 2005;45:497.
71. Falk, JL, Rackow, EC, Weil, MH. End-tidal carbon dioxide concentration during cardiopulmonary resuscitation. N Engl J Med. 1988;318:607.
72. Garnett, AR, Ornato, JP, Gonzalez, ER, et al. End-tidal carbon dioxide monitoring during cardiopulmonary resuscitation. JAMA. 1987;257:512.
73. 2010 American Heart Association Guidelines for Cardiopulmonary Resuscitation and Emergency Cardiovascular Care Science. Part 8: Adult Advanced Cardiovascular Life Support: 2010 American Heart Association Guidelines for Cardiopulmonary Resuscitation and Emergency Cardiovascular Care. Circulation. 2010;122:729.
74. Brain Trauma Foundation. Guidelines for the management of severe traumatic brain injury. 3rd ed. J Neurotrauma. 2007;24:S1.
75. Davis, DP, Dunford, JV, Ochs, M, et al. The use of quantitative end-tidal capnometry to avoid inadvertent severe hyperventilation in patients with head injury after paramedic rapid sequence intubation. J Trauma. 2004;56:808.
76. Hoffmann, RA, Krieger, BP, Kramer, MR, et al. End-tidal carbon dioxide in critically ill patients during changes in mechanical ventilation. Am Rev Respir Dis. 1989;140:1265.
77. Helm, M, Schuster, R, Hauke, J, et al. Tight control of prehospital ventilation by capnography in major trauma victims. Br J Anaesth. 2003;90:327.
78. Deakin, CD, Sado, DM, Coats, TJ, et al. Prehospital end-tidal carbon dioxide concentration and outcome in major trauma. J Trauma. 2004;57:65.
79. Swedlow, DB. Capnometry and capnography: the anesthesia disaster early warning system. Semin Anesth. 1986;3:194.
80. Weil, MH, Bisera, J, Trevino, RP, et al. Cardiac output and end-tidal carbon dioxide. Crit Care Med. 1985;13:907.
81. Abramo, TJ, Wiebe, RA, Scott, S, et al. Noninvasive capnometry monitoring for respiratory status during pediatric seizures. Crit Care Med. 1997;25:1242.
82. Krauss, B. Capnography as a rapid assessment and triage tool for chemical terrorism. Pediatr Emerg Care. 2005;21:493.
83. Krauss, B, Hess, DR. Capnography for procedural sedation and analgesia in the emergency department. Ann Emerg Med. 2007;50:172.
84. Soto, RG, Fu, ES, Vila, H, et al. Capnography accurately detects apnea during monitored anesthesia care. Anesth Analg. 2004;99:379.
85. Fearon, DM, Steele, DW. End-tidal carbon dioxide predicts the presence and severity of acidosis in children with diabetes. Acad Emerg Med. 2002;9:1373.
86. Estevan, G, Abramo, TJ, Okada, P, et al. Capnometry for noninvasive continuous monitoring of metabolic status in pediatric diabetic ketoacidosis. Crit Care Med. 2003;31:2539.
87. Nagler, J, Wright, RO, Krauss, B. End-tidal carbon dioxide as a measure of acidosis in children with gastroenteritis. Pediatrics. 2006;117:260.
88. Friesen, RH, Alswang, M. End-tidal Pco2 monitoring via nasal cannulae in pediatric patients: accuracy and sources of error. J Clin Monit. 1996;12:155.
89. Gravenstein, N. Capnometry in infants should not be done at lower sampling flow rates. J Clin Monit. 1989;5:63.
90. Sasse, FJ. Can we trust end-tidal carbon dioxide measurements in infants? J Clin Monit. 1985;1:147.
McMorrow, RC, Mythen, MG. Pulse oximetry. Curr Opin Crit Care. 2006;12:269.
New, W. Pulse oximetry. J Clin Monit. 1985;1:126.
Sinex, JE. Pulse oximetry: principles and limitations. Am J Emerg Med. 1999;17:59.
The Technology Assessment Task Force of the Society of Critical Care Medicine. A model for technology assessment applied to pulse oximetry. Crit Care Med. 1993;21:615.
Witting, MD, Lueck, CH. The ability of pulse oximetry to screen for hypoxemia and hypercapnia in patients breathing room air. J Emerg Med. 2001;20:341.
Falk, JL, Rackow, EC, Weil, MH. End-tidal carbon dioxide concentration during cardiopulmonary resuscitation. N Engl J Med. 1988;318:607.
Krauss, B. Capnography as a rapid assessment and triage tool for chemical terrorism. Pediatr Emerg Med. 2005;21:493.
Krauss, B, Deykin, A, Lam, A, et al. Capnogram shape in obstructive lung disease. Anesth Analg. 2005;100:884.
Krauss, B, Hess, DR. Capnography for procedural sedation and analgesia in the emergency department. Ann Emerg Med. 2007;50:172.
Silvestri, S, Ralls, GA, Krauss, B, et al. The effectiveness of out-of-hospital use of continuous end-tidal carbon dioxide monitoring on the rate of unrecognized misplaced intubation within a regional emergency medical services system. Ann Emerg Med. 2005;45:497.