Chapter 17 Depth of anaesthesia and neurophysiological monitoring
Nerve stimulators
Assessment of neuromuscular blockade
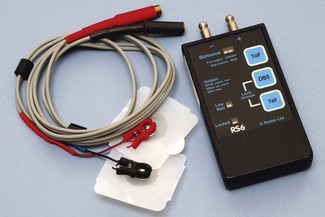
During assessment of neuromuscular blockade a supramaximal stimulus (i.e. one in which all axons in the nerve are made to discharge) is administered to a motor nerve through a pair of ordinary adhesive silver/silver chloride electrodes, applied to the overlying skin. Typically, the stimulus pulse duration might be 0.2 ms, the current 60 mA and the resulting charge, 12 µC. With pulses shorter than 0.2 ms, the amplitude required to generate a supramaximal stimulus may exceed the capacity of the stimulator, while pulses longer than 0.3 ms run the risk of repetitive nerve or muscle stimulation. Higher charges than are classically used may be required to guarantee supramaximal stimulation in nerves with prolonged conduction times (e.g. in diabetic neuropathy).1 The charge required to deliver a supramaximal stimulus is less when the negative electrode is placed distally.2
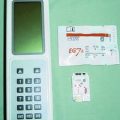
Basic hand-held devices provide a stimulus with a fixed current and pulse width and permit a limited range of stimulation patterns (Fig. 17.1). Other models have liquid crystal screens and user-variable current, enabling both neuromuscular monitoring and nerve localization.
The motor response evoked by peripheral nerve stimulation may be measured in different ways, but is typically evaluated visually. Usually, contraction of adductor pollicis is observed following ulnar nerve stimulation at the wrist. The facial nerve in the cheek is also used, but direct muscle stimulation may contribute to the resulting contraction. More advanced devices attempt to quantify the (force of) muscular contraction elicited by peripheral nerve stimulation.
Accelerometry/acceleromyography
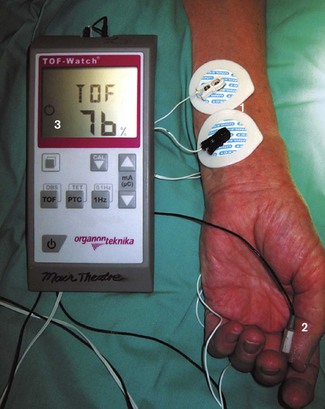
The basis of acceleromyography is that force is the product of mass and acceleration.3 During the assessment of neuromuscular blockade, mass is relatively unchanged so acceleration is proportional to force. An accelerometer comprises a small mass suspended on a strain gauge within a ‘box’ attached to the accelerating object to be studied, the acceleration then being derived from the force exerted on the strain gauge.
A number of accelerometric devices are available, such as the TOF-Watch (Organon Teknika, Fig. 17.2).
Piezoelectric methods (‘Kinemyography’)
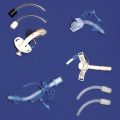
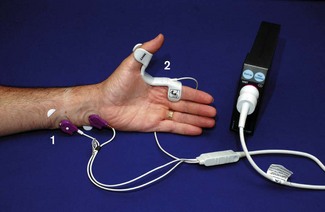
When compressed or distorted, piezoelectric materials produce a charge proportional to the degree of alteration in shape. The M-NMT module for the S/5 anaesthesia monitor (GE Healthcare) uses a piezoelectric sensor incorporated into a clip placed on the patient’s thumb and index finger (Fig. 17.3). Thumb movement on stimulation is converted to an electrical signal and displayed graphically as a proportion of the maximal response. Monitoring, therefore, needs to be started before neuromuscular blockade but after anaesthetic induction. The module initially determines the current required for a supramaximal stimulus and sets a reference response level. By using different patient interface attachments the module can also be used for electromyographic recording or for nerve localization.
Other methods
Mechanomyography, formerly the ‘gold standard’ for the assessment of neuromuscular blockade, has long disappeared from the clinical arena, as has electromyography. They were described in previous editions of this textbook. The general view is that, the above less-cumbersome methods are adequate for clinical purposes.4
Comparative studies suggest that the methods above do not give interchangeable results in assessing response to a train of four (TOF) stimulus.5 TOF measurements indicate residual blockade more consistently if compared with baseline readings, which should be obtained before paralysis.6,7 Some authors recommend the use of ‘preload’ on the thumb to improve the accuracy of the measurement.4
Nerve stimulators for regional anaesthesia
Despite the growing use of ultrasound (see Chapter 13), there remains a need for peripheral nerve stimulators designed specifically for localization of nerves during regional anaesthesia (see Fig. 13.7). A positive surface electrode is applied to the skin and the negative electrode cable is plugged into a unipolar stimulating needle.
Once contractions of the relevant muscle are seen, the current can be reduced. The stimulator-delivered charge required to generate a nerve impulse is proportional to the square of the distance from needle tip to nerve (by Coulomb’s law). Advantage can be taken of this phenomenon during neuraxial blockade in children, where a nerve stimulator attached to an insulated epidural needle may help determine whether the tip is epidural or intrathecal.8 For peripheral nerve blocks, traditional teaching is that injection of local anaesthetic is likely to be effective at the point where a response is still seen at a stimulating current of ≤0.3 mA.9 Recent work, however, suggests a similar probability of successful nerve block in paediatric patients whether the stimulation threshold is below or above 0.5 mA.10
Stimulus duration is adjustable on many devices. This should generally be set at less than 300 µs to avoid repetitive stimulation, though up to 1.0 ms may be required in neuropathic nerves, even with high currents.11 Because chronaxie (the minimum stimulus duration required to elicit a response) is longer in sensory than in motor nerves, pulses longer than 0.15 ms are selected when attempting to locate a purely sensory nerve by inducing paraesthesia.
The accuracy with which peripheral nerve stimulators deliver the selected current tends to deteriorate as the current decreases. Manufacturers often quote accuracy of typically 1–5%, for a current setting of 1 mA. Amplitudes used for peripheral nerve localization, however, are less than 0.5 mA, where variability may be more than 80%.12 A stimulator which delivers less than the set current may increase the risk of nerve damage during peripheral nerve block – with one that delivers more, a failed block may be more likely.
Nerve blocks carry a small risk of intraneural local anaesthetic injection with concomitant damage. Some nerve stimulators currently under evaluation calculate the electrical impedance (EI) of the circuit through the patient. This might be used to reduce the risk of intraneural injection, EI being higher when the stimulating needle is intraneural.13 The exact mechanism for this finding is yet to be elucidated and is controversial.14
Transient pacemaker inhibition by peripheral nerve stimulators has been reported,15 as has interference with the display of pacemaker impulses on the ECG monitor.16
Assessment of neural integrity
Peripheral/cranial nerves
Nerve stimulators may be used intraoperatively to help assess the integrity of peripheral nerves. In many instances the distal contractile response to a proximal stimulus, applied to an intact motor nerve, may be assessed by palpation. Stimulation of motor nerves may be useful to confirm neural function in surgery around the facial nerve, or in thyroidectomy to identify the recurrent laryngeal nerve. For the latter, electrode-embedded endotracheal tubes with attached electromyographic monitors have been employed with variable success.17
Spinal cord/nerve roots
Somatosensory evoked potentials
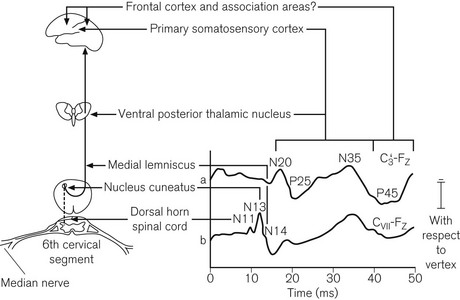
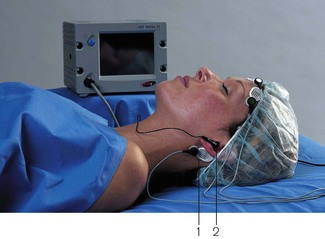
The incidence of neurological damage, secondary to traction and ischaemia of the spinal cord during scoliosis correction is approximately 0.5%. This may be reduced by monitoring somatosensory evoked potentials (SSEP).18 The monitors are complex and require an experienced neurophysiologist. Typically a pair of stimulating electrodes is placed over each posterior tibial nerve at the ankles for lumbar surgery, or over the median nerves for cervical surgery. Stimuli are administered at about 30 mA and 5 Hz. Recording electrodes may be applied at various points adjacent to the ascending tracts and proximal to the site of surgery. Usually two or more scalp electrodes are used (e.g. one frontal and one cervical), together with a reference and a ground electrode. The recorded responses are passed through a digital signal converter and a band-pass filter (20–1000 Hz). An average response is calculated from as many as 200 individual sweeps and the result displayed on the monitor screen. The period of interest is the first 100 ms after the stimulus, during which a characteristic W-shaped potential is seen in recordings from cortical electrodes (Fig. 17.4). Response latency also depends on the distance between the point of stimulation and the recording electrode.
Motor-evoked potentials (MEPs)
MEP monitoring is now employed routinely in some spinal surgery centres, as SSEPs may have limited ability to detect ischaemia secondary to anterior spinal artery hypoperfusion. For spinal surgery, transcranial electrical stimulation is most commonly used. Though this carries a risk of injury secondary to induced contraction of the mandibular muscles; in practice serious complications are rarely seen. Alternatives include transcranial magnetic stimulation or direct stimulation of the rostral spinal cord.19 Multiple-pulse stimulations are performed and the results recorded at subcutaneous or intramuscular needle electrodes in arm and leg muscles. Unlike SSEPs, results can be available within 1 min.
As with SSEPs, the technician can inform the surgeon if MEPs disappear or if the stimulus required to elicit a response exceeds a pre-agreed threshold, indicating potential nerve damage. Spontaneous EMG activity consequent on stretch or compression of nerve roots, which can be detected by MEP recording electrodes, may provide useful information even in the absence of deliberate stimulation.20
Monitoring ‘depth of anaesthesia’
For decades, anaesthetists have sought a monitor which might reflect the conscious level of patients undergoing general anaesthesia. A number of different variables, which may relate to consciousness, can be derived from the electrical activity of the cerebral cortex. Ideally, in variables of this sort, the range of values seen in the conscious state should not overlap with that seen in the unconscious state (i.e. a cut-off value would exist which is 100% sensitive and specific for consciousness). Furthermore, ideally any cut-off value should not be affected by patient physiology or the choice of anaesthetic agent.21
1. Spontaneous electroencephalography (EEG)
2. Provoked EEG in the form of auditory evoked potentials (AEP).
EEG
General principles, signal processing and artefact rejection
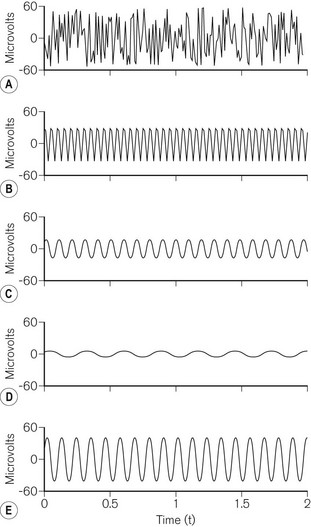
The complex waveform of the EEG comprises many individual sine waves, whose frequencies lie from zero to approximately 50 Hz (Fig. 17.5). Classically these are grouped into frequency bands (Table 17.1). For the purposes of analysis, the EEG is split into epochs of 1–4 s.
| BAND NAME | APPROXIMATE FREQUENCY RANGE (Hz) |
|---|---|
| Alpha | 8–13 |
| Beta | 13–30 |
| Theta | 4–8 |
| Delta | <4 |
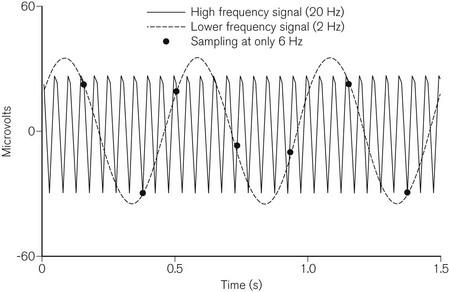
In order to allow processing, the EEG is converted from a smooth continuous analogue signal into a digital one. The fidelity of this conversion depends on the degree of resolution for both voltage and time. The greater the number of bits used, the smaller the change in voltage that can be translated from analogue to digital. EEG monitors usually use 12–16 bits of resolution. The frequency at which the analogue signal is sampled is also important. Too slow a sampling frequency fails to take account of the fastest sine waves and results in ‘aliasing’, where the digital signal incorrectly identifies a low-frequency waveform (Fig. 17.6). EEG monitors usually sample at frequencies above 250 Hz. Signal processing then enables rejection of artefact due to the electrocardiogram, ocular movement or mains interference.
Time and frequency domain analysis and data presentation
In frequency-domain analysis, each individual epoch is subjected to fast Fourier transformation. This mathematical process breaks down the EEG waveform into its constituent sine waves, from which a power (µV2) vs frequency (Hz) histogram can be derived. On many monitors, the frequency histograms from sequential epochs can be presented as a compressed spectral array (CSA) or a density spectral array (DSA) (Fig. 17.7).
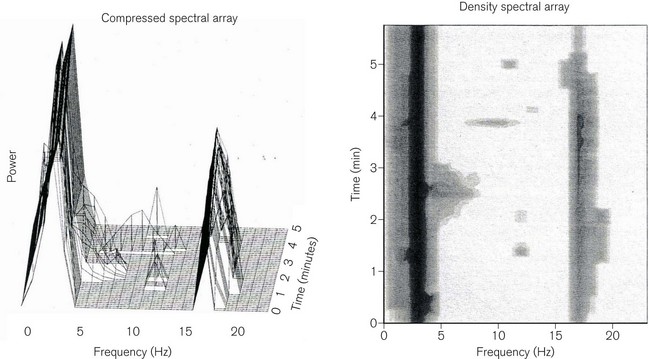
(Rampil IJ (1998) A primer for EEG signal processing. Anesthesiology 89: 980–1002, with permission.)
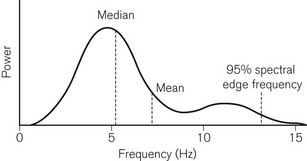
For the purposes of objective comparison, the frequency spectrum may be represented by a summary variable. Two commonly used variables are the median frequency (MF), which divides the power in the spectrum into two equal halves, and the 95% spectral edge frequency (SEF), below which 95% of the spectral power lies (Fig. 17.8). As anaesthesia deepens, lower EEG frequencies generally predominate and there is a concomitant fall in MF and SEF. Despite this broad relationship, MF and SEF are unsatisfactory measures of consciousness during anaesthesia. They have not been related to clinical endpoints, nor are they independent of anaesthetic agents used.
Bispectral analysis and the EEG bispectral index
The bispectral index (BIS) is an EEG-derived variable which is calculated and displayed by several devices manufactured by Aspect Medical Systems: such as the BIS VISTA monitoring system (Fig. 17.9) and BIS modules in multimodal monitors produced by other manufacturers. Bispectral analysis of the EEG signal, a method which is integral to the calculation of BIS, is a method of addressing relationships among signal constituents in the EEG. The use of MF and SEF as indices of anaesthesia described previously relies on assumptions about the linearity of EEG data. In linear systems, there is a simple proportional relationship between cause and effect. However, this situation is demonstrably not the case for many natural phenomena, including the EEG where different frequencies within the signal may not be independent of each other. Bispectral analysis, a higher order analysis based on the phase relationships of individual frequency components to each other, goes some way to addressing this issue and has long been used to examine wave patterns in oceanography. In the EEG, it is particularly applicable to the relationships between the constituent sine waves (described above under frequency domain analysis). These relationships – ‘phase coupling’ – have some relevance to the EEG effects of anaesthesia, becoming progressively more pronounced with increasing anaesthetic dose.
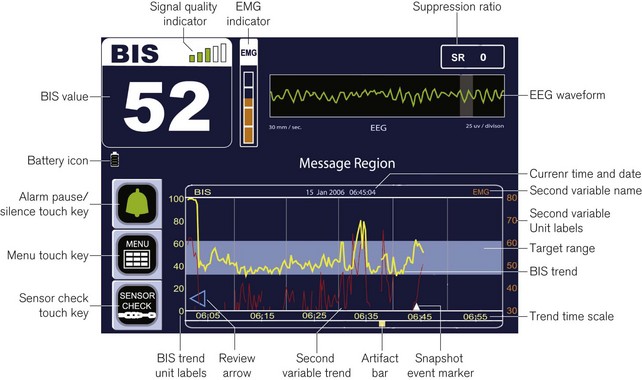
Figure 17.9 Annotated diagram of the display panel: Aspect BIS VISTA monitor.
Image courtesy of Covidien, Ireland.
The BetaRatio constituent relates to a phenomenon called ‘beta activation’, a paradoxical increase in relative beta power occurring at low brain concentrations of some anaesthetics. The overall product of the BIS algorithm is a dimensionless scale from 1 to 100, which indicates the likelihood of consciousness. During general anaesthesia, a BIS of less than 60 is said to indicate a negligible chance of recall.
The development of the BIS algorithm, and of bispectral index monitoring in general, has been described in several reviews.22,23,24 The first algorithm, BIS 1.0, was released in 1992. It was constructed using EEG data acquired from young, fit patients under anaesthesia. Originally, the EEG features that best predicted movement on incision were identified and combined in an index which was then tested prospectively. Research in the early 1990s, however, indicated that the neural mechanisms underlying the movement response to incision differed from those concerned with hypnosis. As a result, BIS 2.0 was formulated using the existing database, to predict hypnotic rather than motor endpoints.
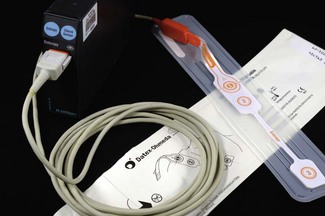
By version 3.0 (1995), the database had increased to about 1500 anaesthetics. This version, and subsequent ones, has represented attempts to improve performance of BIS at very deep or light levels of anaesthesia and to enhance removal of electromyographic or electrocautery-related artefact. To this end, the latest VISTA generation of BIS monitors use the 4.0 or 4.1 versions of the algorithm. In these versions BIS is calculated using data from sensors containing four rather than three electrodes, such as the Quatro (Fig. 17.10), Extend, and semi-re-usable sensors (all Aspect Medical Systems), in which the additional electrode is placed above and lateral to the eyebrow. A bilateral sensor has also been released recently, though its advantages are unclear at present.
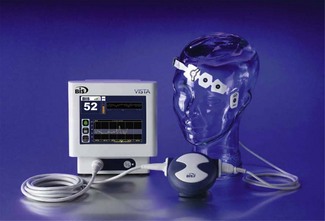
Figure 17.10 The BIS QUATRO sensor for use with the bispectral index monitor.
Image courtesy of Covidien, Ireland.
While BIS is now widely used, its reliability as an indicator of hypnosis during general anaesthesia depends on the agent. It is ineffective during ketamine anaesthesia and doubts remain over the precise relationship between BIS and clinical state during nitrous oxide sedation and high-dose opioid anaesthesia. In recent years, authors have suggested that the BIS algorithm is unnecessarily complex. They argue that a variable, analogous to SynchFastSlow, can be calculated from the EEG without bispectral analysis. This variable, PowerFastSlow, requires fewer data for its calculation. It too measures phase coupling, using a phenomenon known as bicoherence. Unlike the bispectrum, this is independent of signal amplitudes. In patients receiving a propofol, alfentanil and isoflurane anaesthetic, PowerFastSlow appears to predict the anaesthetized state as well as SynchFastSlow.25
Other spontaneous EEG processing devices
Other monitors which record and process the EEG are available. The SEDLine (Hospira), formerly known as the Patient State Analyzer PSA-4000, was developed in a broadly similar fashion to the BIS monitor, using EEG databases and clinical correlates. Most of the EEG descriptors used in the algorithm for Patient State Index (PSI) calculation, relate to EEG power, though the suppression ratio is also taken into account. Six electrodes are placed on the forehead, to acquire data from four EEG channels. The resulting PSI ranges from 0 to 100 and PSI 25–50 is recommended for surgical anaesthesia.26
In the Narcotrend monitor (MonitorTechnik), the EEG is acquired from one reference and two recording electrodes on the forehead. Artefact is rejected, the data are analyzed and an algorithm applied in order to assign a Narcotrend stage. There are six such stages – A (awake) to F (general anaesthesia with increasing burst suppression). A recent version also includes a numerical index. The algorithm is distinct from the BIS and PSI algorithms in that it was developed purely as a means for objective analysis of the EEG waveform, using time and frequency domain information. No clinical correlates were involved.27
Other commercial monitors based on the spontaneous EEG included the Cerebral State Monitor (Danmeter A/S). This is a small battery-operated handheld device attached by electrodes to the forehead. Both proprietary and routine ECG electrodes can be used. It acquires data from a single EEG channel. Fuzzy logic (if x and y, then z) is then applied to four calculated EEG parameters, namely alpha ratio, beta ratio, the difference between these ratios and burst suppression ratio, to determine the Cerebral State Index (CSI). The CSI is a dimensionless number scaled from 0 to 100.28 Danmeter A/S ceased trading in 2008, although the products are still in circulation.
The SNAP II (Everest Biomedical Instruments) is based on a personal digital assistant, onto which can be ‘snapped’ a monitoring module. The single-channel EEG is acquired from a forehead electrode strip and the SNAP II index is calculated using low (0.1–18 Hz) and high (80–420 Hz) frequency components of the EEG. The index runs from zero to 100, the latter indicating the patient is fully awake. A SNAP index of 50–65 is recommended for general anaesthesia.29
Entropy
In 2003, Datex-Ohmeda released a depth of anesthesia module for their S/5 anaesthesia monitor (Fig. 17.11) based on the entropy of the spontaneous EEG. If the awake EEG is characterized by a chaotic signal, then decreasing levels of consciousness are associated with a less disordered signal, as the number of signal generators diminish and slower wave activity becomes more dominant. By calculating the amount of disorder in the power spectrum of the EEG signal, it is suggested that anaesthetic depth may be objectively estimated. In contrast to the often opaque proprietary algorithms above, this system uses a relatively simple mathematical calculation of Shannon entropy with the resultant numerical scale deliberately manipulated to correlate with the now familiar BIS values. A three electrode sensor similar in appearance and application to that for BIS is used to acquire a single-channel EEG. From this, the module calculates two values: one between 0 and 91 for ‘state entropy’ (SE), which reflects cortical activity over the frequency range 0.8–32 Hz, and a second between 0 and 100 for ‘response entropy’ (RE) over the frequency range 0.8–47 Hz, to include components of the frontalis muscle electromyogram (EMG).
Although global correlation with BIS appears good, agreement is poor. This may reflect differences in scale, despite numerical adjustment. In general, the M-Entropy module appears to perform no better than BIS in terms of correlation with effect site drug concentration and prediction of clinical endpoints. In sedated patients the frontalis EMG renders interpretation of SE and RE values difficult.30
Auditory evoked potentials
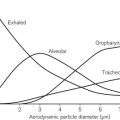
Loss of consciousness under general anaesthesia is accompanied by changes in the electrical response of the cerebral cortex to an auditory stimulus. The period of particular interest is the early cortical response, illustrated in Fig. 17.12, which occurs approximately 10–100 ms after the stimulus (the mid-latency auditory evoked potential, or MLAEP). MLAEP waves are generated in the medial geniculate and primary auditory cortex. Anaesthesia increases the latency and decreases the amplitude of MLAEP waves. Threshold values for both Na and Pb latencies have been proposed as indicators of unconsciousness during anaesthesia. More complex MLAEP-derived indices, which better reflect its overall morphology, have potential clinical advantages and may feature in future monitors.31 Particular frequency components within the MLAEP may also have a role.32
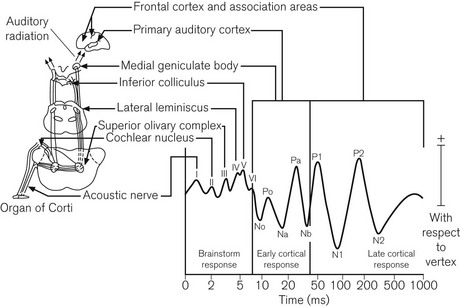
Figure 17.12 The auditory evoked response with its anatomical basis.
(Thornton C, Sharpe RM (1998) Evoked responses in anaesthesia. British Journal of Anaesthesia 81: 771–781, © The Board of Management and Trustees of the British Journal of Anaesthesia. Reproduced by permission of Oxford University Press/British Journal of Anaesthesia.)
The A-Line AEP monitor/2 (Danmeter) is a hybrid spontaneous EEG/AEP monitor (Fig. 17.13). For the AEP component 65–70 dB click stimuli are administered at 9 Hz through headphones, the response being recorded with scalp electrodes. A ‘Click Detection’ function alerts the user if the auditory stimulus ceases for some reason. The response signal undergoes pre-processing, during which artefact is rejected and band-pass filtering applied. Subsequent extraction of the AEP from background cortical activity takes time and results in some latency. In current versions of the monitor, the replacement of ‘moving time averaging’ with an ‘autoregressive model’ (using a proprietary mathematical method called ARX modelling) has reduced the update delay time from 35 to 6 s. The latest A-line ARX Index (AAI) is the sum of absolute differences in the 20–80 ms window of the AEP and is a unitless index ranging from 0 to 99. This is preferentially derived from the AEP, but the EEG signal is used if AEP values are weak. This device is no longer in production.
aepEX monitor
Manufactured by Medical Device Management Ltd, this small handheld monitor, which is also available as a plug-in unit for modular monitors, generates a single number between 0 and 100 based on analysis of auditory evoked potentials (Fig. 17.14). The aepEX index, previously called the ‘AEP index’ and the ‘level of arousal score’, reflects the morphology of the MLAEP curves. It is calculated as the sum of the square root of the absolute difference between every two successive 0.56 ms segments of the AEP waveform.33 The AEP curves recorded from scalp electrodes are produced by averaging 256 sweeps of 144 ms following the presentation of 7 Hz auditory clicks of 1 ms duration at 70 dB above normal hearing threshold. Stimuli are administered through small earphones with single-use gels, available in three sizes. The EEG signal is detected by three disposable sensors: two on the forehead and one on the mastoid process. By using a moving time averaging technique results are updated at 1 s intervals. Typical values in a conscious patient are 65–85 and, during surgery, 30–45.
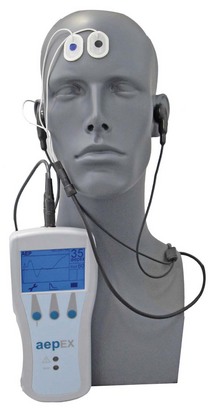
Figure 17.14 The aepEX monitor together with sensors and earphones.
Photograph courtesy of Medical Device Management Ltd. UK.
The aepEX is said by the manufacturers to work equally well with all anaesthetic agents including ketamine and nitrous oxide. There is some evidence to support this particularly where ketamine is given in association with remifentanil.34,35
Clinical use of depth of anaesthesia monitoring
Of the above technologies, at present BIS has European and US market dominance and the largest volume of supporting evidence. AEP index and Entropy also appear to show efficacy in attempting to detect unconsciousness. In a direct experimental comparison during propofol sedation, an AEP-derived variable (the AEP index) was better than BIS at distinguishing the conscious from the unconscious state.33 However, results from a large-scale trial indicate that BIS monitoring can reduce the incidence of intraoperative awareness in patients at risk of this complication,36 although a trial comparing a BIS based protocol and one based on the measurement of end tidal anaesthetic agent showed no advantage.37 At present, there is no corresponding evidence for the effectiveness of AAI-guided general anaesthesia and Danmeter, the manufacturer of both AEP/2 and the Cerebral State Monitor, has recently ceased trading.
Limitations
• Is the patient asleep or awake at present?
• How much effective anaesthetic agent is active in the patient?
• What will be the effect of surgical stimulation on arousal?
• Will there be movement in response to stimulation?
• Is there or will there be information processing or retention taking place?
Pain measurement
In one prospective study of the monitor in postoperative adult patients, NFSC correlated with pain score. Using a predetermined cut-off value for NFSC of 0.1, the monitor distinguished between those with no/mild pain and those with moderate/severe pain with a sensitivity and specificity of 88.5% and 67.7% respectively.38 Though such a monitor might be helpful in some circumstances, the skin conductance method appears to be affected by anticholinergic agents.39
Assessment of cerebral blood flow
• Transcranial Doppler ultrasonography (TCD (see below))
• SSEPs (somatosensory evoked potentials)
Stump pressure
Immediately after clamping the carotid artery the surgeon may insert, distal to the clamp, a needle attached to a standard pressure transducer. In principle, the adequacy of collateral blood supply from the circle of Willis may be reflected in the pressure at this point. Typically, a shunt might be inserted for the duration of clamping if the stump pressure is less than 50 mmHg. There are a number of problems with stump pressure. It is a one-off measurement, it does not consistently reflect flow, and the relationship between stump pressure and ischaemic EEG changes is weak. Nevertheless, in series where stump pressure is used to dictate shunt insertion, rates of shunt insertion are no higher than in series where more complex and expensive methods are used.40
Transcranial Doppler technique (TCD)
TCD is probably the most widely used continuous technique and requires an experienced operator. The principles of Doppler ultrasonography are covered in Chapter 31. Traditional 5–10 MHz ultrasound frequencies do not penetrate the skull and TCD usually involves pulses at 1–2 MHz, with the probe placed over the thin bone of the temporal region (Fig. 17.15). At these relatively low frequencies, spatial resolution is poor and, therefore, the ultrasound is primarily used for measuring blood flow velocities. Even so, up to 30% of elderly patients cannot be insonated, even at the highest available energy output of the devices.
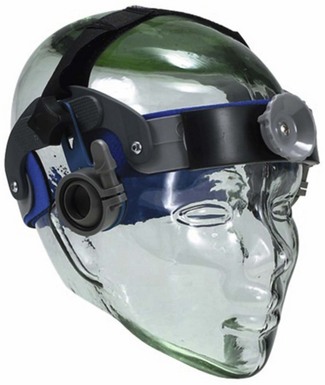
Figure 17.15 Transcranial Doppler ultrasound probe applicator for Sonara TCD system.
Image courtesy of CareFusion (UK).
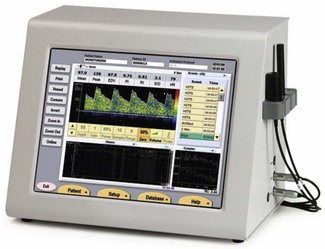
During CEA, TCD is generally used to assess flow in the middle cerebral artery, which is found at a depth of about 50 mm from the temporal window. The probe emits ultrasound pulses and receives reflected frequencies; the frequency attenuation (Doppler shift) is used to produce a moving graph of flow velocity (cm s−1) vs time. The waveform is characterized by its peak systolic velocity and its time averaged mean maximal velocity (Vmax). Vmax is typically 35–90 cm s−1. Another useful variable is the pulsatility index, which reflects the resistance to flow in the examined artery. A TCD monitor is illustrated in Fig. 17.16.
Though changes in Vmax are widely regarded as being more significant than absolute values, it is unclear what constitutes a critical reduction. In one large study, ischaemia after clamping was considered severe if Vmax fell to 0–15% of baseline, mild if 16–40% and absent if greater than 40%.41 A significant decrease on clamping may influence the surgical decision to shunt. Subsequent Vmax changes may allow detection of shunt occlusion and intraoperative emboli, the latter producing a characteristic sound.
SSEPs
Cortical SSEPs are affected by large reductions in CBF. Median nerves may be stimulated bilaterally and evoked potentials recorded at scalp electrodes as described above. A baseline response is recorded before clamping and again about a minute after. Subsequent recording at regular intervals is recommended as delayed changes are occasionally seen. SSEPs have been used successfully as a basis for selective shunting in CEA.42 On carotid clamping, a decrease in N20/P25 amplitude of greater than 50% from baseline has been proposed as an indicator of cortical dysfunction.43
EEG
Cerebral ischaemia occurring on carotid clamping may induce changes in ipsilateral EEG frequencies and amplitudes. Raw EEG monitoring during carotid endarterectomy (CEA) has been advocated, although data interpretation requires considerable expertise. Processed EEG monitors may be more practical, but BIS appears unreliable for detection of cortical ischaemia44 and the predictive sensitivity of intraoperative EEG monitoring for immediate postoperative neurological deficit is poor.45
Jugular bulb oximetry
More usually used in the intensive care unit, jugular bulb oximetry also allows intraoperative assessment of cerebral oxygen extraction during cerebral aneurysm, tumour and haematoma surgery.46 An oximetric catheter, e.g. Opticath (Abbott), is introduced into the internal jugular vein cranially until the jugular venous bulb is encountered. Jugular venous oxygen saturation (SjvO2) reflects the oxygen ‘supply:demand’ ratio and is usually 60–70%. Normal values give limited reassurance as they do not exclude focal cerebral ischaemia. An SjvO2 of 90% or more is seen in hyperaemia – at less than 50%, SjvO2 indicates increased oxygen extraction and impending ischaemia.
Cerebral oximetry
Near infrared spectrometry (e.g. the Somanetics Invos Cerebral Oximeter, Covidien, Ireland) is a non-invasive method of continuously monitoring cerebral oxygen saturation. Regional cerebral oxygen saturation (rsO2) is measured to reflect cerebral perfusion. While the technique may have prognostic potential for cerebral function after cardiac surgery, it appears insufficiently sensitive and specific to predict the need for shunting during carotid endarterectomy.47
1 Saitoh Y, Kaneda K, Hattori H, Nakajima H, Murakawa M. Monitoring of neuromuscular block after administration of vecuronium in patients with diabetes mellitus. Br J Anaesth. 2003;90:480–486.
2 Brull SJ, Silverman DG. Pulse width, stimulus intensity, electrode placement, and polarity during assessment of neuromuscular block. Anesthesiology. 1995;83:702–709.
3 Claudius C, Viby-Mogensen J. Acceleromyography for use in scientific and clinical practice: a systematic review of the evidence. Anesthesiology. 2008;108:1117–1140.
4 Trager G, Michaud G, Deschamps S, Hemmerling TM. Comparison of phonomyography, kinemyography and mechanomyography for neuromuscular monitoring. Can J Anaesth. 2006;53:130–135.
5 Dahaba AA, Rehak PH, List WF. Assessment of accelerography with the TOF-GUARD: a comparison with electromyography. Eur J Anaesthesiol. 1997;14(6):623–629.
6 Suzuki T, Fukano N, Kitajima O, Saeki S, Ogawa S. Normalization of acceleromyographic train-of-four ratio by baseline value for detecting residual neuromuscular block. Br J Anaesth. 2006;96:44–47.
7 Samet A, Capron F, Alla F, Meistelman C, Fuchs-Buder T. Single acceleromyographic train-of-four, 100-Hertz tetanus or double-burst stimulation: which test performs better to detect residual paralysis? Anesthesiology. 2005;102:51–56.
8 Tsui BC, Wagner AM, Cunningham K, Perry S, Desai S, Seal R. Can continuous low current electrical stimulation distinguish insulated needle position in the epidural and intrathecal spaces in pediatric patients? Paediatr Anaesth. 2005;15:959–963.
9 Kaiser H, Niesel HC, Klimpel L, Bodenmueller M. Prilocaine in lumbosacral plexus block–general efficacy and comparison of nerve stimulation amplitude. Acta Anaesthesiology Scandinavica. 1992;36:692–697.
10 Gurnaney H, Ganesh A, Cucchiaro G. The relationship between current intensity for nerve stimulation and success of peripheral nerve blocks performed in pediatric patients under general anesthesia. Anesth Analg. 2007;105:1605–1609. table
11 Szerb J, Persaud D. Long current impulses may be required for nerve stimulation in patients with ischemic pain. Can J Anaesth. 2005;52:963–966.
12 Hadzic A, Vloka J, Hadzic N, Thys DM, Santos AC. Nerve stimulators used for peripheral nerve blocks vary in their electrical characteristics. Anesthesiology. 2003;98:969–974.
13 Tsui BC, Pillay JJ, Chu KT, Dillane D. Electrical impedance to distinguish intraneural from extraneural needle placement in porcine nerves during direct exposure and ultrasound guidance. Anesthesiology. 2008;109:479–483.
14 Cory PC. Increased impedance on nerve stimulator display may actually reflect a decrease in total system impedance. Anesthesiology. 2009;110:1192–1194. author reply 1194–5
15 Engelhardt L, Grosse J, Birnbaum J, Volk T. Inhibition of a pacemaker during nerve stimulation for regional anaesthesia. Anaesthesia. 2007;62:1071–1074.
16 Rozner MA. Peripheral nerve stimulators can inhibit monitor display of pacemaker pulses. J Clin Anesth. 2004;16:117–120.
17 Snyder SK, Hendricks JC. Intraoperative neurophysiology testing of the recurrent laryngeal nerve: plaudits and pitfalls. Surgery. 2005;138:1183–1191.
18 Nuwer MR, Dawson EG, Carlson LG, Kanim LE, Sherman JE. Somatosensory evoked potential spinal cord monitoring reduces neurologic deficits after scoliosis surgery: results of a large multicenter survey. Electroencephalogr Clin Neurophysiol. 1995;96:6–11.
19 Pajewski TN, Arlet V, Phillips LH. Current approach on spinal cord monitoring: the point of view of the neurologist, the anesthesiologist and the spine surgeon. Eur Spine J. 2007;16(Suppl 2):S11529.
20 Owen JH, Kostuik JP, Gornet M, Petr M, Skelly J, Smoes C, et al. The use of mechanically elicited electromyograms to protect nerve roots during surgery for spinal degeneration. Spine. 1994;19:1704–1710.
21 Drummond JC. Monitoring depth of anesthesia: with emphasis on the application of the bispectral index and the middle latency auditory evoked response to the prevention of recall. Anesthesiology. 2000;93:876–882.
22 Rampil IJ. A primer for EEG signal processing in anesthesia. Anesthesiology. 1998;89:980–1002.
23 Johansen JW, Sebel PS. Development and clinical application of electroencephalographic bispectrum monitoring. Anesthesiology. 2000;93:1336–1344.
24 Johansen JW. Update on bispectral index monitoring. Best Pract Res Clin Anaesthesiol. 2006;20:81–99.
25 Miller A, Sleigh JW, Barnard J, Steyn-Ross DA. Does bispectral analysis of the electroencephalogram add anything but complexity? Br J Anaesth. 2004;92:8–13.
26 Drover D, Ortega HR. Patient state index. Best Pract Res Clin Anaesthesiol. 2006;20:121–128.
27 Kreuer S, Wilhelm W. The Narcotrend monitor. Best Pract Res Clin Anaesthesiol. 2006;20:111–119.
28 Jensen EW, Litvan H, Revuelta M, Rodriguez BE, Caminal P, Martinez P, et al. Cerebral state index during propofol anesthesia: a comparison with the bispectral index and the A-line ARX index. Anesthesiology. 2006;105:28–36.
29 Bischoff P, Schmidt G. Monitoring methods: SNAP. Best Pract Res Clin Anaesthesiol. 2006;20:141–146.
30 Bein B. Entropy. Best Pract Res Clin Anaesthesiol. 2006;20:101–109.
31 Kumar A, Anand S, Yaddanapudi LN. Comparison of auditory evoked potential parameters for predicting clinically anaesthetized state. Acta Anaesthesiology Scandinavia. 2006;50:1139–1144.
32 Scheller B, Schneider G, Daunderer M, Kochs EF, Zwissler B. High-frequency components of auditory evoked potentials are detected in responsive but not in unconscious patients. Anesthesiology. 2005;103:944–950.
33 Gajraj RJ, Doi M, Mantzaridis H, Kenny GN. Comparison of bispectral EEG analysis and auditory evoked potentials for monitoring depth of anaesthesia during propofol anaesthesia. Br J Anaesth. 1999;82:672–678.
34 Kang H, Lee HK. Changes of bispectral index and auditory evoked potential index during general anesthesia with propofol, midazolam and ketamine. Korean J Anesthesiol. 2005;49:757–764.
35 Kang H, Scott N, Sutcliffe N, Kenny GNC. The effects of intravenous ketamine and propofol on the BIS and Aepex. Archives of European Society for Intravenous Anaesthesia, Annual Scientific Meeting. Lisbon www.eurosiva.org, 2004.
36 Myles PS, Leslie K, McNeil J, Forbes A, Chan MT. Bispectral index monitoring to prevent awareness during anaesthesia: the B-Aware randomised controlled trial. Lancet. 2004;363:1757–1763.
37 Avidan MS, Zhanjg L, Burnside BA, Finkel KJ, Searleman AC, Selvidge JA, et al. Anaesthesia awareness and the bispectral index. NEJM. 2008;358:1097–1108.
38 Ledowski T, Bromilow J, Wu J, Paech MJ, Storm H, Schug SA. The assessment of postoperative pain by monitoring skin conductance: results of a prospective study4. Anaesthesia. 2007;62:989–993.
39 Ledowski T, Preuss J, Schug SA. The effects of neostigmine and glycopyrrolate on skin conductance as a measure of pain. Eur J Anaesthesiol. 2009;26:777–781.
40 Jacob T, Hingorani A, Ascher E. Carotid Artery Stump Pressure (CASP) in 1135 consecutive endarterectomies under general anesthesia: an old method that survived the test of times. J Cardiovasc Surg (Torino). 2007;48:677–681.
41 Halsey JH, Jr. Risks and benefits of shunting in carotid endarterectomy. The International Transcranial Doppler Collaborators. Eur J Anaesthesiol. 1992;23:1583–1587.
42 Schwartz ML, Panetta TF, Kaplan BJ, Legatt AD, Suggs WD, Wengerter KR, et al. Somatosensory evoked potential monitoring during carotid surgery. Cardiovasc Surg. 1996;4:77–80.
43 Stejskal L, Kramar F, Ostry S, Benes V, Mohapl M, Limberk B. Experience of 500 cases of neurophysiological monitoring in carotid endarterectomy. Acta Neurochir (Wien). 2007;149:681–688.
44 Culp WC, Jr., Kinsky MP, Rios JA, Mendelow AD. Bispectral index monitoring may not reliably indicate cerebral ischaemia during awake carotid endarterectomy. Br J Anaesth. 2005;95:559–560.
45 McCarthy WJ, Park AE, Koushanpour E, Pearce WH, Yao JS. Carotid endarterectomy. Lessons from intraoperative monitoring – a decade of experience. Ann Surg. 1996;224:297–305.
46 Gunn HC, Matta BF, Lam AM, Mayberg TS. Accuracy of continuous jugular bulb venous oximetry during intracranial surgery. J Neurosurg Anesthesiol. 1995;7:174–177.
47 Rigamonti A, Scandroglio M, Minicucci F, Magrin S, Carozzo A, Casati A. A clinical evaluation of near-infrared cerebral oximetry in the awake patient to monitor cerebral perfusion during carotid endarterectomy. J Clin Anesth. 2005;17:426–430.