[level-membership-for-hematology-oncology-and-palliative-medicine-category]
Cytogenetics
After completion of this chapter, the reader will be able to:
1. Describe chromosome structure and the methods used in G-banded chromosome identification.
2. Explain the basic laboratory techniques for preparing chromosomes for analysis.
3. Differentiate between numeric and structural chromosome abnormalities.
4. Discuss the importance of karyotype in the diagnosis of hematologic cancer.
5. Explain the basic technique of fluorescence in situ hybridization (FISH).
6. Discuss the advantage of using FISH analysis in conjunction with G-banded analysis of cells.
7. Describe the types of chromosomal abnormalities that are detectable with cytogenetic methods.
8. Given the designation of a chromosome mutation, be able to determine whether the abnormality is numeric or structural, which chromosomes are affected, what type of abnormality it is, and what portion of the chromosome is affected.
9. Given a diagram of a G-banded generic chromosome, name the structures identifiable by light microscopy.
Case Study
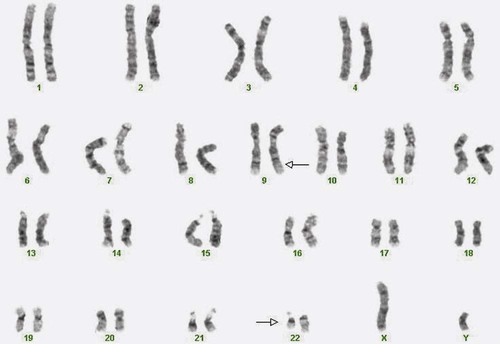
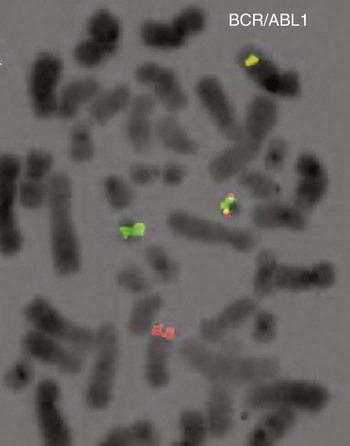
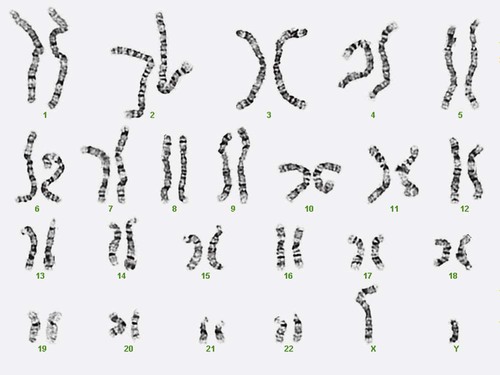
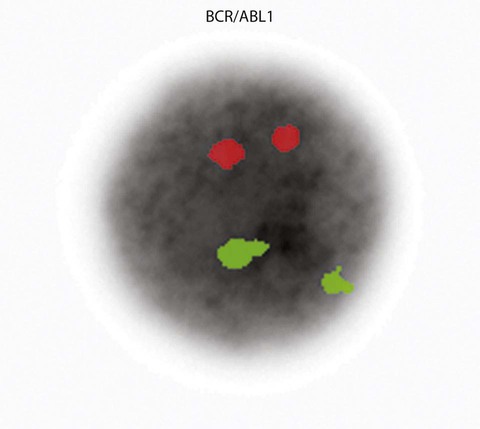
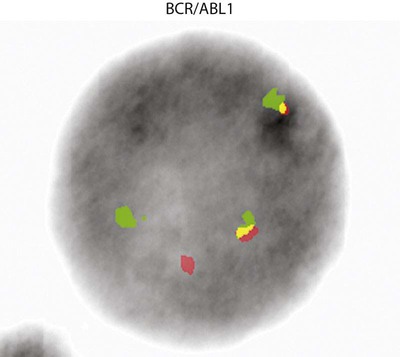
A 54-year-old man came to his physician with a history of fatigue, weight loss, and increased bruising over a 6-month period. His WBC count was elevated at 200 × 109/L. A bone marrow aspirate was sent for cytogenetic analysis. G-banded chromosome analysis of 20 cells from bone marrow cultures showed all cells to be positive for the Philadelphia chromosome, t(9;22)(q34;q11.2), as seen in chronic myelogenous leukemia (Figure 31-1). FISH studies using the BCR and ABL gene probes (Abbott Molecular, Des Plaines, Ill.) produced dual fusion signals, one located on the derivative chromosome 9 and one on the derivative chromosome 22, characteristic of the translocation between chromosomes 9 and 22 leading to the rearrangement of BCR and ABL1 oncogenes (Figure 31-2). The patient was treated with imatinib mesylate for the next 2 months. Another cytogenetic study was performed on a second bone marrow aspirate. This analysis showed that 12 of 20 cells analyzed were normal, 46,XY[12]; however, there were still 8 cells positive for the Philadelphia chromosome, 46,XY,t(9;22)(q34; q11.2)[8].
Human cytogenetics is the study of chromosomes, their structure, and their inheritance. There are approximately 25,000 genes in the human genome, most of which reside on the 46 chromosomes normally found in each somatic cell.1
Chromosome disorders are classified as structural or numerical and involve the loss, gain, or rearrangement of either a piece of a chromosome or the entire chromosome. Because each chromosome contains thousands of genes, a chromosomal abnormality that is observable by light microscopy involves, on average, 3 to 5 megabases of DNA and represents the disruption or loss of hundreds of genes. Such disruptions often have a profound clinical effect. Chromosomal abnormalities are observed in approximately 0.65% of all live births.2 The gain or loss of an entire chromosome, other than a sex chromosome, is usually incompatible with life and accounts for approximately 50% of first-trimester spontaneous abortions.3 In leukemia, cytogenetic abnormalities are observed in more than 50% of bone marrow specimens.4 These recurring abnormalities often define the leukemia and frequently indicate clinical prognosis.
Reasons for Chromosome Analysis
Physicians who care for patients of all ages may order chromosome analysis or karyotyping for patients with mental retardation, infertility, ambiguous genitalia, short stature, fetal loss, risk of genetic or chromosomal disease, and cancer. In the following discussion, basic cytogenetic concepts are presented. This field is in a period of tremendous growth. Supplementation of this chapter with the material in Chapter 32 is recommended.
Chromosome Structure
Cell Cycle
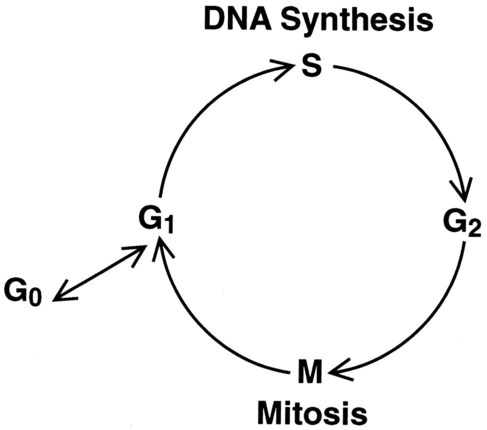
The cell cycle is divided into four stages: G1, the growth period before synthesis of deoxyribonucleic acid (DNA); S phase, the period during which DNA synthesis takes place; G2, the period after DNA synthesis; and M, the period of mitosis or cell division, the shortest phase of the cell cycle (Figure 31-3). During mitosis, chromosomes are maximally condensed. While in mitosis, cells can be chemically treated to arrest cell progression through the cycle so that the chromosomes can be isolated and analyzed.
Chromosome Architecture
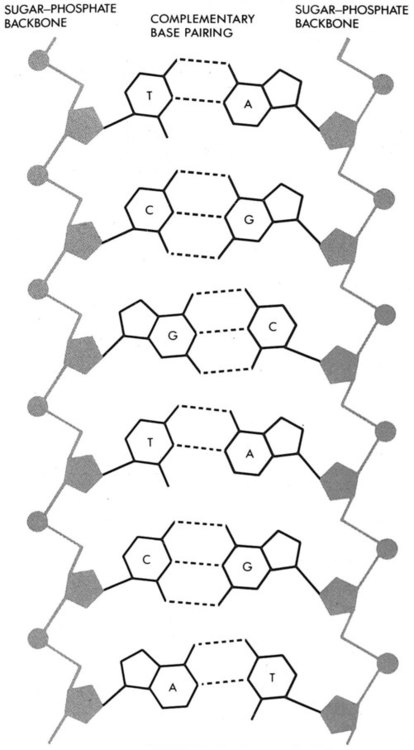
A chromosome is formed from a single long DNA molecule that contains a series of genes. The complementary double-helix structure of DNA was established in 1953 by Watson and Crick.5 The backbone is a sugar-phosphate-sugar polymer. The sugar is deoxyribose. Attached to the backbone and filling the center of the helix are four nitrogen-containing bases. Two of these, adenine (A) and guanine (G), are purines; the other two, cytosine (C) and thymine (T), are pyrimidines (Figure 31-4).
The chromosomal DNA of the cell resides in the cell’s nucleus. This DNA and its accompanying proteins are referred to as chromatin. During the cell cycle, at mitosis, the nuclear chromatin condenses approximately 10,000-fold to form chromosomes.6 Each chromosome results from progressive folding and compaction of the entire nuclear chromatin. This condensation is achieved through multiple levels of helical coiling and supercoiling (Figure 31-5).
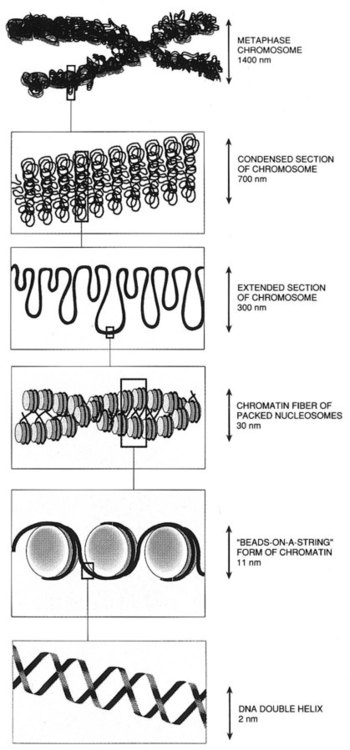
Metaphase Chromosomes
Metaphase is the stage of mitosis where the chromosomes align on the equatorial plate. Electron micrographs of metaphase chromosomes have provided models of chromosome structure. In the “beads-on-a-string” model of chromatin folding, the DNA helix is looped around a core of histone proteins.7 This packaging unit is known as a nucleosome and measures approximately 11 nm in diameter.8 Nucleosomes are coiled into twisted forms to create an approximately 30-nm chromatin fiber. This fiber, called a solenoid, is condensed further and bent into a loop configuration. These loops extend at an angle from the main chromosome axis.9
Chromosome Identification
Chromosome Number
In 1956, Tijo and Levan10 identified the correct number of human chromosomes as 46. This is the diploid chromosome number and is determined by counting the chromosomes in dividing somatic cells. The designation for the diploid number is 2n. Gametes (ova and sperm) have half the diploid number (23). This is called the haploid number of chromosomes and is designated as n. Different species have different numbers of chromosomes. The reindeer has a relatively high chromosome number for a mammal (2n = 76), whereas the Indian muntjac, or barking deer, has a very low chromosome number (2n = 7 in the male and 2n = 6 in the female).11
Chromosome Size and Type
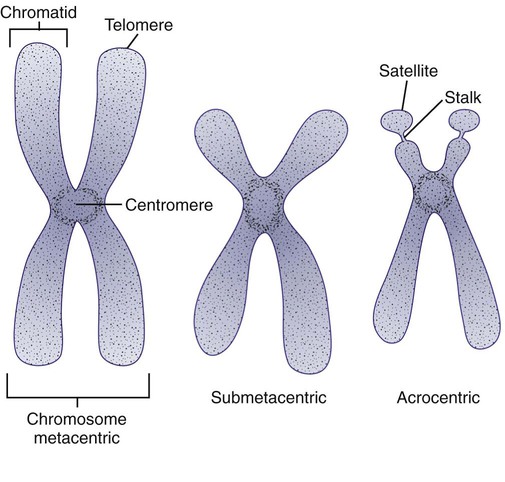
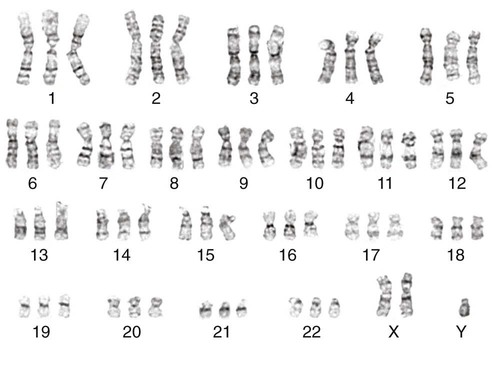
In the 1960s, before the discovery of banding, chromosomes were categorized by overall size and the location of the centromere (primary constriction) and were assigned to one of seven groups, A through G. Group A includes chromosome pairs 1, 2, and 3. These are the largest chromosomes, and their centromeres are located in the middle of the chromosome (i.e., they are metacentric). Group B chromosomes, pairs 4 and 5, are the next largest chromosomes; their centromeres are off center, or submetacentric. Group G consists of the smallest chromosomes, pairs 21 and 22, whose centromeres are located at the ends of the chromosomes and are designated as acrocentric (Figure 31-6).
Techniques for Chromosome Preparation and Analysis
Chromosome Preparation
Tissues used for chromosome analysis contain cells with an inherently high mitotic rate (bone marrow cells) or cells that can be stimulated to divide in culture (peripheral blood lymphocytes). Special harvesting procedures are established for each tissue. Mitogens such as phytohemagglutinin or pokeweed mitogen are added to peripheral blood cultures. Phytohemagglutinin primarily stimulates T cells to divide,12 whereas pokeweed preferentially stimulates B lymphocytes.13
Chromosome Banding
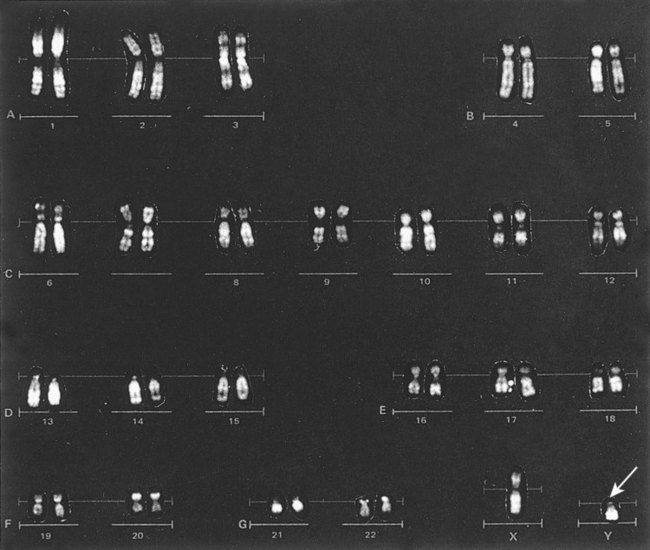
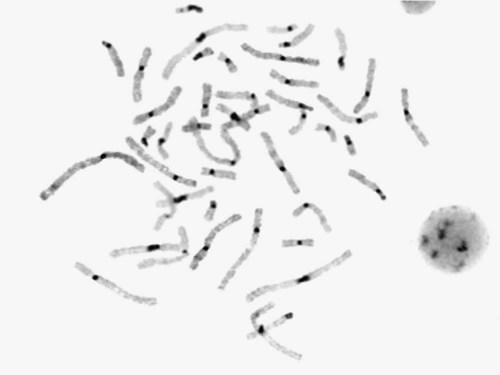
Analysis of each chromosome is made possible by staining with a dye. The name chromosome is derived from the Greek words chroma, meaning “color,” and soma, meaning “body.” Hence chromosome means “colored body.” In 1969, Caspersson, Zech, Modest, et al14 were the first investigators to stain chromosomes successfully with a fluorochrome dye. Using quinacrine mustard, which binds to adenine-thymine–rich areas of the chromosome, they were able to distinguish a banding pattern unique to each chromosome. This banding pattern, called Q banding, differentiates the chromosome into bands of differing widths and relative brightnesses (Figure 31-7). The most brightly fluorescent bands of the 46 human chromosomes include the distal end of the Y chromosome, the centromeric regions of chromosomes 3 and 4, and the short arms of the acrocentric chromosomes (13, 14, 15, 21, and 22).
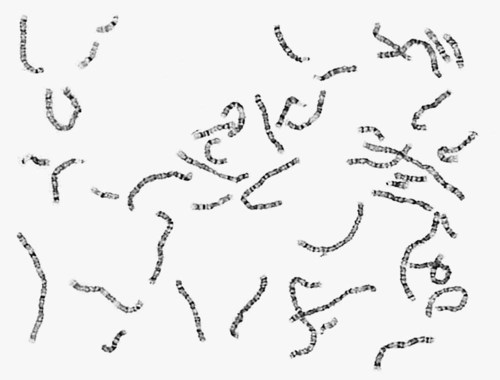
Other stains are used to identify chromosomes, but in contrast to Q banding, these methods normally necessitate some pretreatment of the slide to be analyzed. Giemsa (G) bands are obtained by pretreating the chromosomes with the proteolytic enzyme trypsin. GTG banding means “G banding by Giemsa with the use of trypsin.” Giemsa, like quinacrine mustard, stains AT-rich areas of the chromosome. The dark bands are called G-positive (+) bands. Guanine-cytosine–rich areas of the chromosome have little affinity for the dye and are referred to as G-negative (−) bands. G+ bands correspond with the brightly fluorescing bands of Q banding (Figures 31-8 and 31-9). G banding is the most common method used for staining chromosomes.
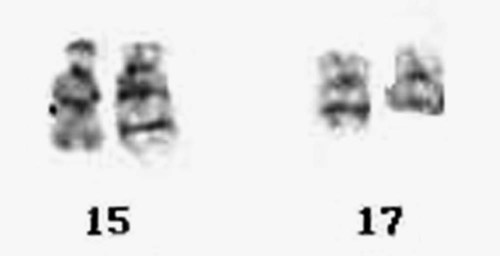
C banding stains the centromere (primary constriction) of the chromosome and the surrounding condensed heterochromatin. Constitutive heterochromatin is a special type of late-replicating repetitive DNA that is located primarily at the centromere of the chromosome. In C banding, the chromosomes are treated first with an acid and then with an alkali (barium hydroxide) before Giemsa staining. C banding is most intense in human chromosomes 1, 9, and 16 and the Y chromosome. Polymorphisms are also observed in the C bands from different individuals. These polymorphisms have no clinical significance (Figure 31-10).
Chromosome banding is visible after chromosome condensation, which occurs during mitosis. The banding pattern observed depends on the degree of condensation. By examination of human chromosomes early in mitosis, it has been possible to estimate a total haploid genome (23 chromosomes) with approximately 2000 AT-rich (G+) bands.15 The later the stage of mitosis, the more condensed the chromosome and the fewer total G+ bands observed.
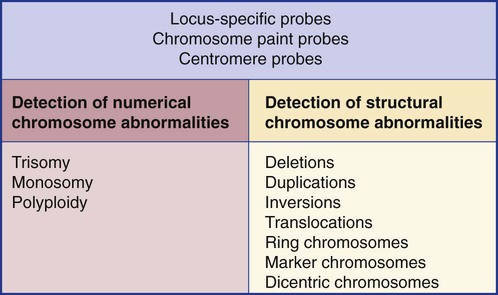
Nonradioactive in Situ Hybridization
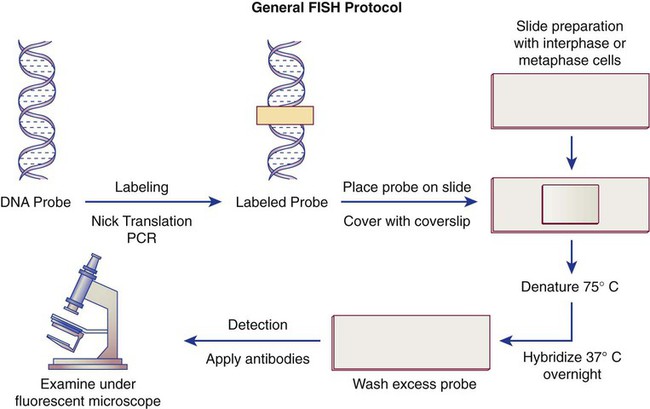
Fluorescence in situ hybridization (FISH) is a molecular technique commonly used in cytogenetic laboratories. FISH studies are a valuable adjunct to the diagnostic workup. In FISH, the DNA or RNA probe is labeled with a fluorophore. Target DNA is treated with heat and formamide to denature the double-stranded DNA, which renders it single-stranded. The target DNA anneals to a similarly denatured, single-stranded, fluorescently labeled DNA or RNA probe with a complementary sequence. After hybridization, the unbound probe is removed through a series of stringent washes, and the cells are counterstained for visualization (Figure 31-11).
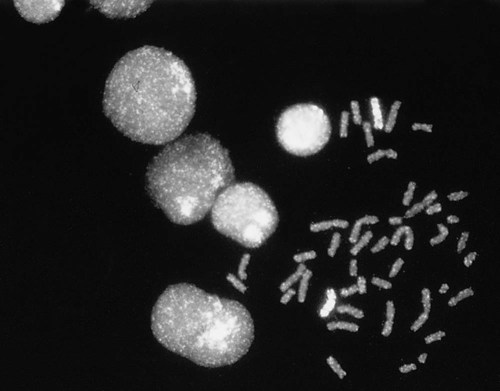
In situ hybridization with centromere or whole-chromosome painting probes can be used to identify individual chromosomes (Figure 31-12). Marker chromosomes represent chromatin material that has been structurally altered and cannot be identified by a G-band pattern. FISH using a centromere or paint probe, or both, is often helpful in identifying the chromosome of origin (Figure 31-13).16 Specific loci probes can be used to detect both structural and numerical abnormalities but are especially helpful in identifying chromosomal translocations or inversions.
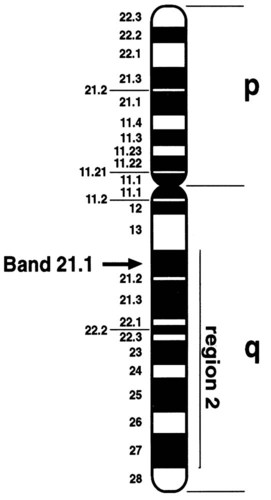
Cytogenetic Nomenclature
Banding techniques enabled scientists to identify each chromosome pair by a characteristic banding pattern. In 1971, a Paris conference for nomenclature of human chromosomes was convened to designate a system to describe the regions and specific bands of the chromosomes. The chromosome arms were designated p (petite) for the short arm and q for the long arm. The regions in each arm and the bands contained within each region were numbered consecutively, from the centromere outward to the telomere or end of the chromosome. To designate a specific region of the chromosome, the chromosome number is written first, followed by the designation of either the short or long arm, then the region of the arm, and finally the specific band. Xq21 designates the long arm of the X chromosome, region 2, band 1. To designate a sub-band, a decimal point is placed after the band designation, followed by the number assigned to the sub-band, as in Xq21.1 (Figure 31-14).
Cytogenetic (and FISH) nomenclature represents a uniform code used by cytogeneticists to communicate chromosome abnormalities. In this nomenclature each string begins with the modal number of chromosomes followed by the sex chromosome designation. A normal male karyotype is designated 46,XY and a normal female karyotype is designated 46,XX. If abnormalities are observed in the cell, the designation is written to include abnormalities of modal chromosome number, sex chromosomes, and then the autosomes. A cell with trisomy of chromosome 8 (three copies of chromosome 8) in a male is written as 47,XY,+8. The number of cells with this abnormality is indicated in brackets. If 20 cells were examined, trisomy 8 was found in 10 cells, and the remainder were normal, the findings would be written as 47,XY,+8[10]/46,XY[10]. Translocations (exchange of material between two chromosomes) are designated t, with the lowest chromosome number listed first. Thus a translocation between the short arm of chromosome 12 at band p13 and the long arm of chromosome 21 at band q22 is written as t(12;21)(p13;q22). A semicolon is used to separate the chromosomes. A chromosome with a translocation is called a derivative chromosome. For the previous example, chromosomes 12 and 21 are referred to as der(12) and der(21). Deletions are written with the abbreviation del preceding the chromosome. A deletion of the long arm of chromosome 5 at band 31 is written as del(5)(q31). No spaces are entered in these designations except between abbreviations.17
Chromosome Abnormalities
Numeric Abnormalities
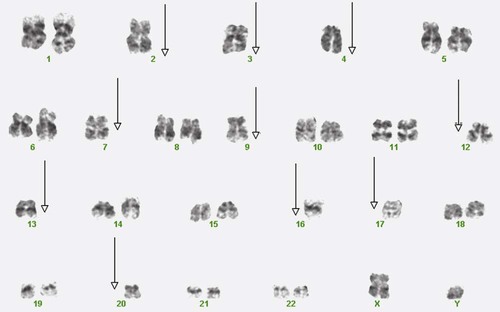
In polyploidy, the chromosome number is higher than 46 but is always an exact multiple of the haploid chromosome number of 23. A karyotype with 69 chromosomes is called triploidy (Figure 31-15). A karyotype with 92 chromosomes is called tetraploidy.
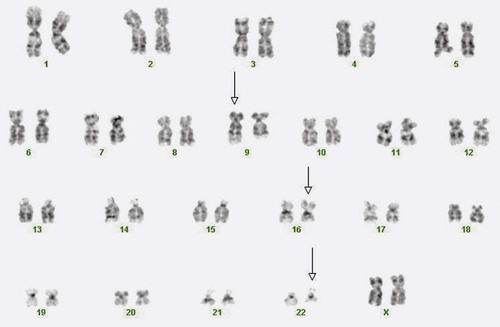
In cancer, numerical abnormalities in the karyotype may be classified further based on the modal number of chromosomes in a neoplastic clone. Hypodiploid refers to a cell with fewer than 46 chromosomes; near-haploid cells have from 23 up to approximately 34 chromosomes (Figure 31-16); hyperdiploid cells have more than 46 chromosomes. High hyperdiploidy refers to a chromosome number of more than 50.18 Finally, the term pseudodiploid is used to describe a cell with 46 chromosome and structural abnormalities.
Structural Aberrations
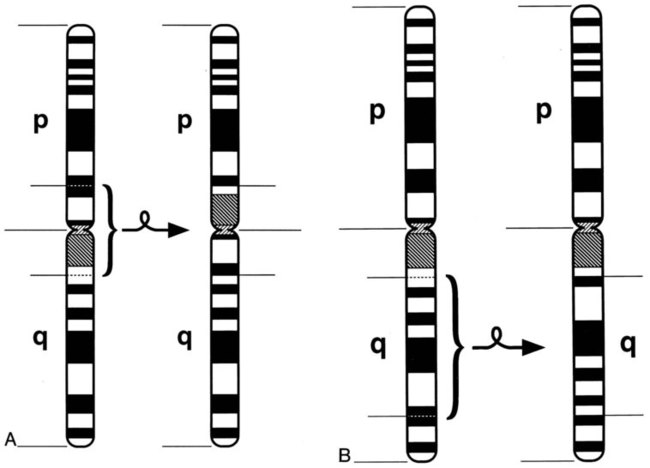
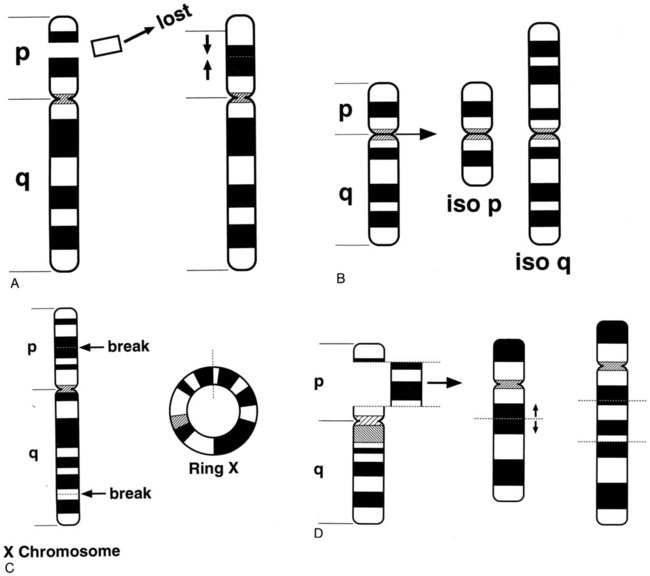
Structural rearrangements result from breakage of a chromosome region with loss or subsequent rejoining in an abnormal combination. Structural rearrangements are defined as balanced (no loss or gain of genetic chromatin) or unbalanced (gain or loss of genetic material). Structural rearrangements of single chromosomes include inversions, deletions, isochromosomes, ring formations, insertions, translocations, and duplications. Inversions (inv) involve one or two breaks in a single chromosome, followed by a 180-degree switch of the segment between the breaks with no loss or gain of material. If the chromosomal material involves the centromere, the inversion is called pericentric. If the material that is inverted does not include the centromere, the inversion is called paracentric (Figure 31-17).
Interstitial deletions arise after two breaks in the same chromosome and loss of the segment between the breaks. Terminal deletions (loss of chromosomal material from the end of a chromosome) and interstitial deletions involve the loss of genetic material. The clinical consequence to the individual with a deletion depends on the extent and location of the deletion (Figure 31-18).
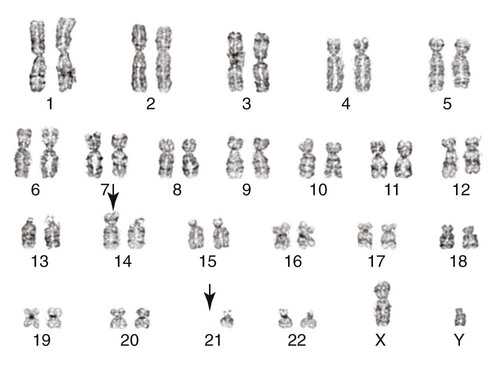
Another type of translocation involving breakage and reunion near the centromeric regions of two acrocentric chromosomes is known as a Robertsonian translocation. Effectively this is a fusion between two whole chromosomes rather than exchange of material, as in a reciprocal translocation. These translocations are among the most common balanced structural rearrangements seen in the general population, with a frequency of 0.09% to 0.1%.19 All five human acrocentric autosomes (13, 14, 15, 21, and 22) are capable of forming a Robertsonian translocation. In this case, the resulting balanced karyotype has only 45 chromosomes, which include the translocated chromosomes (Figure 31-19).
Cancer Cytogenetics
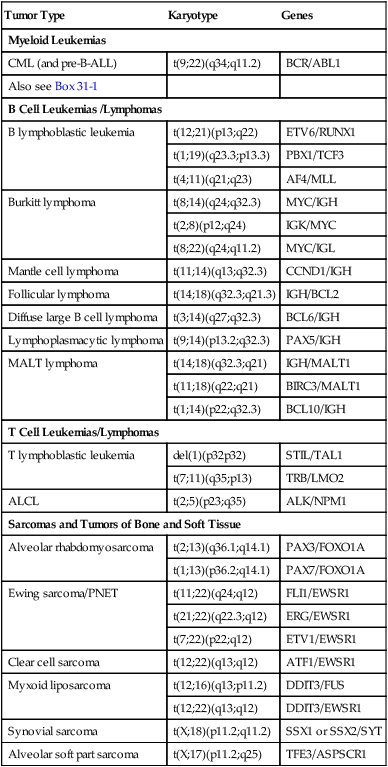
Cancer cytogenetics is a field that has been built upon discovery of nonrandom chromosome abnormalities in many types of cancer. In hematologic neoplasias, specific structural rearrangements are associated with distinct subtypes of leukemia that have characteristic morphologic and clinical features. Cytogenetic analysis of malignant cells can help determine the diagnosis and often the prognosis of a hematologic malignancy, assist the oncologist in the selection of appropriate therapy, and aid in monitoring the effects of therapy. Bone marrow is the tissue most frequently used to study the cytogenetics of a hematologic malignancy. Unstimulated peripheral blood and bone marrow trephine biopsy samples also may be analyzed. Cytogenetic analysis of cancers involving other organ systems can be performed using solid tissue obtained during surgery or by needle biopsy. Chromosomal defects in cancer include a wide range of numeric abnormalities and structural rearrangements as discussed earlier (Table 31-1).
TABLE 31-1
Common Translocations in Hematopoietic and Lymphoid Neoplasia and Sarcoma
| Tumor Type | Karyotype | Genes |
| Myeloid Leukemias | ||
| CML (and pre-B-ALL) | t(9;22)(q34;q11.2) | BCR/ABL1 |
| Also see Box 31-1 | ||
| B Cell Leukemias /Lymphomas | ||
| B lymphoblastic leukemia | t(12;21)(p13;q22) | ETV6/RUNX1 |
| t(1;19)(q23.3;p13.3) | PBX1/TCF3 | |
| t(4;11)(q21;q23) | AF4/MLL | |
| Burkitt lymphoma | t(8;14)(q24;q32.3) | MYC/IGH |
| t(2;8)(p12;q24) | IGK/MYC | |
| t(8;22)(q24;q11.2) | MYC/IGL | |
| Mantle cell lymphoma | t(11;14)(q13;q32.3) | CCND1/IGH |
| Follicular lymphoma | t(14;18)(q32.3;q21.3) | IGH/BCL2 |
| Diffuse large B cell lymphoma | t(3;14)(q27;q32.3) | BCL6/IGH |
| Lymphoplasmacytic lymphoma | t(9;14)(p13.2;q32.3) | PAX5/IGH |
| MALT lymphoma | t(14;18)(q32.3;q21) | IGH/MALT1 |
| t(11;18)(q22;q21) | BIRC3/MALT1 | |
| t(1;14)(p22;q32.3) | BCL10/IGH | |
| T Cell Leukemias/Lymphomas | ||
| T lymphoblastic leukemia | del(1)(p32p32) | STIL/TAL1 |
| t(7;11)(q35;p13) | TRB/LMO2 | |
| ALCL | t(2;5)(p23;q35) | ALK/NPM1 |
| Sarcomas and Tumors of Bone and Soft Tissue | ||
| Alveolar rhabdomyosarcoma | t(2;13)(q36.1;q14.1) | PAX3/FOXO1A |
| t(1;13)(p36.2;q14.1) | PAX7/FOXO1A | |
| Ewing sarcoma/PNET | t(11;22)(q24;q12) | FLI1/EWSR1 |
| t(21;22)(q22.3;q12) | ERG/EWSR1 | |
| t(7;22)(p22;q12) | ETV1/EWSR1 | |
| Clear cell sarcoma | t(12;22)(q13;q12) | ATF1/EWSR1 |
| Myxoid liposarcoma | t(12;16)(q13;p11.2) | DDIT3/FUS |
| t(12;22)(q13;q12) | DDIT3/EWSR1 | |
| Synovial sarcoma | t(X;18)(p11.2;q11.2) | SSX1 or SSX2/SYT |
| Alveolar soft part sarcoma | t(X;17)(p11.2;q25) | TFE3/ASPSCR1 |
Cancer results from multiple and sequential genetic mutations occurring in a somatic cell. At some juncture, a critical mutation occurs, and the cell becomes self-perpetuating or clonal. A clone is a cell population derived from a single progenitor.17 In cytogenetics, a clone exists if two or more cells contain the same structural abnormality or supernumerary marker chromosome or if three or more cells are missing the same chromosome. The primary aberration or stemline of a clone is a cytogenetic abnormality that is frequently observed as the sole abnormality associated with the cancer. The secondary aberration or sideline includes abnormalities additional to the primary aberration.17 In chronic myelogenous leukemia, the primary aberration is the Philadelphia chromosome resulting from a translocation between chromosomes 9 and 22, t(9;22)(q34;q11.2). A sideline of this clone would include secondary abnormalities, such as trisomy for chromosome 8, written as +8,t(9;22)(q34;q11.2).
Leukemia
Leukemias are clonal proliferations of malignant leukocytes that arise initially in the bone marrow before disseminating to the peripheral blood, lymph nodes, and other organs. They are broadly classified by the type of blood cell giving rise to the clonal proliferation (lymphoid or myeloid) and by the clinical course of the disease (acute or chronic). The four main leukemia categories are acute lymphoblastic leukemia (ALL), acute myeloid leukemia (AML), chronic lymphocytic leukemia (CLL), and chronic myelogenous leukemia (CML). The World Health Organization (WHO) classification for myeloid malignancies has categorized AML into seven subtypes: AML with recurrent genetic abnormalities; AML with myelodysplasia-related changes; therapy-related myeloid neoplasms; AML not otherwise specified; myeloid sarcoma; myeloid proliferations related to Down syndrome; and blastic plasmacytoid dendritic cell neoplasm (see Chapter 36).20 “AML with recurrent genetic abnormalities” is a classification based on the cytogenetic abnormalities observed (Box 31-1). Some of the divisions of the French-American-British (FAB) classification21 are included in the “not otherwise classified” category. The WHO has classified lymphoid leukemias by precursor cell type, B or T (see Chapter 36).
Chronic Myelogenous Leukemia
The first malignancy to be associated with a specific chromosome defect was CML, in which approximately 95% of patients were found to have the Philadelphia chromosome, t(9;22)(q34;q11.2) by G-banded analysis.22,23 The Philadelphia chromosome (derivative chromosome 22) is characterized by a balanced translocation between the long arms of chromosomes 9 and 22. At the molecular level, the gene for ABL1, an oncogene on chromosome 9, joins a gene on chromosome 22 named BCR. The result of the fusion of these two genes is a new fusion protein of about 210 kD with growth-promoting capabilities that override normal cell regulatory mechanisms (Figures 31-20 and 31-21) (see Chapter 34).24 The fusion protein activates tyrosine kinase signaling to drive proliferation of the cell. This signaling can be blocked by imatinib mesylate (Gleevec; Novartis Pharmaceuticals, East Hanover, N.J.).25 Patient response to imatinib can be monitored by cytogenetic analysis and FISH. At diagnosis, the characteristic karyotype is the presence of the Philadelphia chromosome in all cells analyzed. After treatment for several months with imatinib, the karyotype typically has a mixture of abnormal and normal cells indicating patient response to therapy. Complete response is defined as a bone marrow karyotype with only normal cells. Often, therapeutic response is monitored using peripheral blood instead of a bone marrow aspirate. In contrast to the bone marrow, the peripheral blood does not contain spontaneously dividing cells. As a result, chromosomal analysis of a specimen of unstimulated peripheral blood often is unsuccessful because of the absence of dividing cells. In these cases, FISH with probes for the specific abnormality may be performed on 200 or more interphase (nondividing) cells of the peripheral blood specimen to search for chromosomally abnormal cells. This is an important advantage of FISH technology.
Acute Leukemia
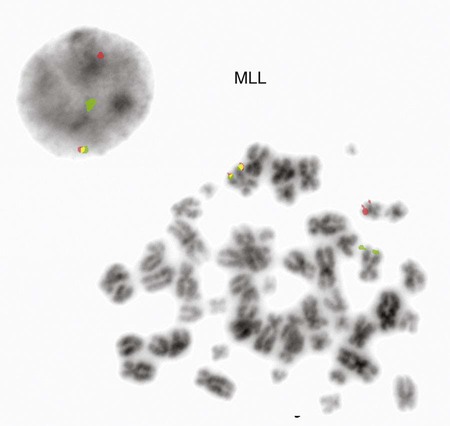
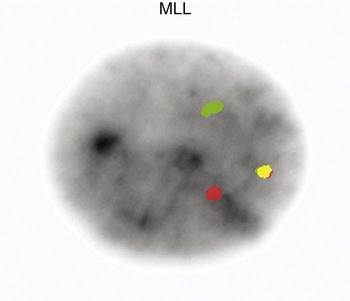
The Philadelphia chromosome is also observed in acute leukemia. It is seen in about 20% of adults with ALL, 2% to 5% of children with ALL, and 1% of patients with AML.26–28 In childhood ALL, chromosome number is critical for predicting the severity of the leukemia. Children whose leukemic cells contain more than 50 chromosomes have the best prognosis for complete recovery with therapy. Recurring translocations observed in ALL include t(4;11)(q21;q23), t(12;21)(p13;q22), and t(1;19)(q23;p13.3). Each translocation is associated with a prognostic outcome and assists oncologists in determining patient therapy. The t(4;11) translocation is the one most commonly found in infants with acute lymphoblastic leukemia. Rearrangements of the AF4 gene on chromosome 4 and the MLL gene on chromosome 11 occur in this translocation.29,30 Disruption of the MLL gene is seen in both ALL and AML.(Figures 31-22 and 31-23).
The AMLs are subdivided into several morphologic classifications ranging from M0 to M7 according to the FAB classification (see Chapter 36).31,32 Characteristic chromosome translocations are associated with some subgroups and were incorporated into the WHO classification. Among them is a translocation between the long arm of chromosome 8 and the long arm of chromosome 21, t(8;21)(q22;q22), which is representative of AML with maturation. Acute promyelocytic leukemia is associated with a translocation between the long arms of chromosomes 15 and 17, t(15;17)(q24;q21) (Figure 31-24). A pericentric inversion of chromosome 16, inv(16)(p13.2q22), is seen in AML with increased eosinophils. The inversion juxtaposes core binding factor beta (CBFB) gene with the myosin heavy chain gene (MYH11) to form a new fusion protein (Figure 31-25).33 These recurring translocations have enabled researchers to localize genes important for cell growth and regulation. As with acute lymphoblastic leukemia, the particular translocation often predicts patient prognosis and response to therapy. Understanding the molecular consequences of the cytogenetic mutations, such as the BCR/ABL translocation, provides the fundamental information for the development of targeted therapies.
Solid Tumors
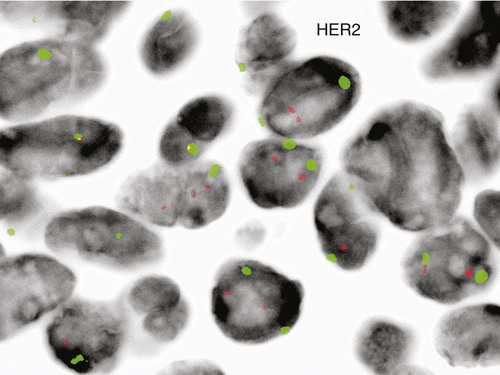
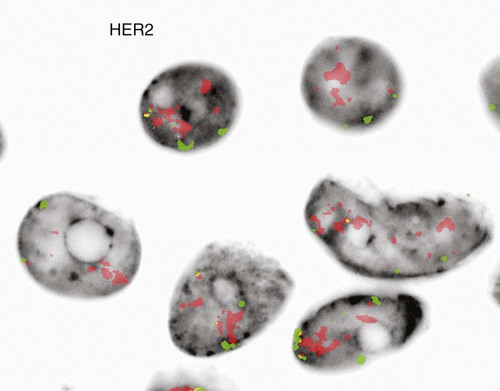
Just as recurring structural and numeric chromosome defects have been observed in the hematologic malignancies, a wide range of abnormalities have also been found in solid tumors. Most of these abnormalities confer a proliferative advantage on the malignant cell and serve as useful prognostic indicators. Amplification of the gene HER2 (also called ERBB2) on chromosome 17, a transmembrane growth factor receptor, is associated with an aggressive form of invasive breast cancer.34,35 FISH with probes for the HER2 gene and an internal control (17 centromere) can determine if there is gene amplification in the tumor (Figure 31-26).36 If FISH testing shows amplification to be present, the patient is eligible for targeted therapy with a monoclonal antibody, trastuzumab (Figure 31-27).37 FISH for HER2 typically is performed on tissue sections from the paraffin-embedded tumor block.
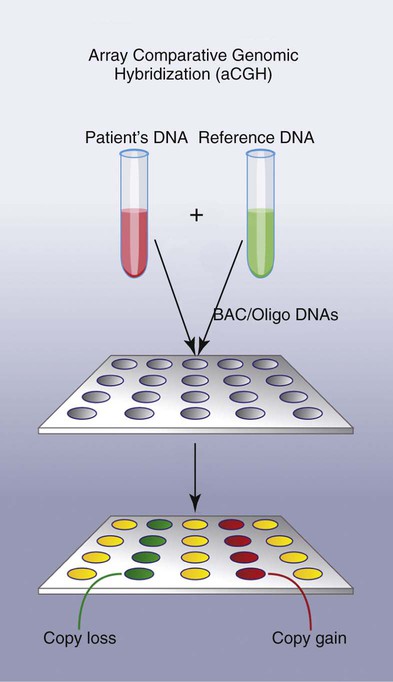
Array Comparative Genomic Hybridization
Array comparative genomic hybridization (aCGH) is a new fluorescence-based molecular technique for analyzing genomic DNA for unbalanced genetic alterations. In this method patient DNA and a normal reference DNA are differently labeled, one with a green fluorophore and one with a red fluorophore. The two DNAs are mixed together and hybridized to an array platform that contains spotted DNA representing the target(s) of interest. Regions of imbalance (copy gain or copy loss) in the patient specimen are assessed relative to the fluorescence signal of the reference DNA when hybridized to the normal DNA of the array (Figure 31-28).38,39 This technique is presently used primarily for diagnosis of constitutional (inherited) disorders but emerging applications for cancer are in development.
Summary
• Cytogenetics is the study of chromosome structure and inheritance.
• Chromosome disorders may be structural or numeric, involving the rearrangement or the loss or gain of a piece of a chromosome or the entire chromosome.
• Nonrandom chromosome abnormalities are associated with cancer.
• A chromosome is composed of a complementary double helix of DNA. Attached to the backbone of deoxyribose are adenine (A), guanine (G), cytosine (C), and thymine (T).
• During mitosis, cells can be chemically treated to arrest cell progression in metaphase so that chromosomes can be analyzed.
• Q banding differentiates chromosomes into bands of different widths and relative brightnesses, revealing a banding pattern unique to each individual chromosome.
• Other stains used to identify chromosomes may require pretreatment of the slide for analysis. These include G banding, C banding, and AG-NOR banding.
• FISH, a molecular cytogenetic technique, uses DNA or RNA probes and fluorescence microscopy to identify individual chromosomes. Metaphase and interphase cells can be analyzed by FISH.
• Tissues used for chromosome analysis include bone marrow cells and peripheral blood lymphocytes, amniotic fluid, nonneoplastic tissue, and tumors.
• A normal cell contains 46 chromosomes, which includes 2 sex chromosomes.
• Defects in chromosomes can be categorized as numeric or structural. Numeric abnormalities can be subclassified as aneuploidy and polyploidy.
• Structural rearrangements include inversions, deletions, isochromosomes, ring formations, insertions, translocations, and duplications.
• Specific structural rearrangements are associated with distinct subtypes of leukemias, and analysis may assist in diagnosis, prognosis, and monitoring of therapy. Solid tumors also may be analyzed using cytogenetics.
Review Questions
1. G-banding refers to the technique of staining chromosomes:
2. Which of the following compounds is used to halt mitosis in metaphase for chromosome analyses?
3. One arm of a chromosome has 30 bands. Which band would be nearest the centromere?
4. Which of the following is not an advantage of the use of FISH?
a. It can be used on nondividing cells.
b. It can be used on paraffin-embedded tissue.
c. It can detect mutations that do not result in abnormal banding patterns.
5. Which of the following types of mutations would likely not be detectable with cytogenetic banding techniques?
a. Point mutation resulting in a single amino acid substitution
b. Transfer of genetic material from one chromosome to another
c. Loss of genetic material from a chromosome that does not appear on any other chromosome
d. Duplication of a chromosome resulting in 3n of that genetic material
6. Which of the following describes a chromosomal deletion?
a. Point mutation resulting in a single amino acid substitution
b. Transfer of genetic material from one chromosome to another
c. Loss of genetic material from a chromosome that does not appear on any other chromosome
d. Duplication of a chromosome resulting in 3n of that genetic material
7. This patient’s cells have which of the following mutations?
a. Loss of the entire number 31 chromosome
b. Loss of the entire number 5 chromosome
8. What other mutation is present in this patient’s cells?
[/level-membership-for-hematology-oncology-and-palliative-medicine-category][not-level-membership-for-hematology-oncology-and-palliative-medicine-category]
Cytogenetics
After completion of this chapter, the reader will be able to:
1. Describe chromosome structure and the methods used in G-banded chromosome identification.
2. Explain the basic laboratory techniques for preparing chromosomes for analysis.
3. Differentiate between numeric and structural chromosome abnormalities.
4. Discuss the importance of karyotype in the diagnosis of hematologic cancer.
5. Explain the basic technique of fluorescence in situ hybridization (FISH).
6. Discuss the advantage of using FISH analysis in conjunction with G-banded analysis of cells.
7. Describe the types of chromosomal abnormalities that are detectable with cytogenetic methods.
8. Given the designation of a chromosome mutation, be able to determine whether the abnormality is numeric or structural, which chromosomes are affected, what type of abnormality it is, and what portion of the chromosome is affected.
9. Given a diagram of a G-banded generic chromosome, name the structures identifiable by light microscopy.
Case Study
A 54-year-old man came to his physician with a history of fatigue, weight loss, and increased bruising over a 6-month period. His WBC count was elevated at 200 × 109/L. A bone marrow aspirate was sent for cytogenetic analysis. G-banded chromosome analysis of 20 cells from bone marrow cultures showed all cells to be positive for the Philadelphia chromosome, t(9;22)(q34;q11.2), as seen in chronic myelogenous leukemia (Figure 31-1). FISH studies using the BCR and ABL gene probes (Abbott Molecular, Des Plaines, Ill.) produced dual fusion signals, one located on the derivative chromosome 9 and one on the derivative chromosome 22, characteristic of the translocation between chromosomes 9 and 22 leading to the rearrangement of BCR and ABL1 oncogenes (Figure 31-2). The patient was treated with imatinib mesylate for the next 2 months. Another cytogenetic study was performed on a second bone marrow aspirate. This analysis showed that 12 of 20 cells analyzed were normal, 46,XY[12]; however, there were still 8 cells positive for the Philadelphia chromosome, 46,XY,t(9;22)(q34; q11.2)[8].
Human cytogenetics is the study of chromosomes, their structure, and their inheritance. There are approximately 25,000 genes in the human genome, most of which reside on the 46 chromosomes normally found in each somatic cell.1
Chromosome disorders are classified as structural or numerical and involve the loss, gain, or rearrangement of either a piece of a chromosome or the entire chromosome. Because each chromosome contains thousands of genes, a chromosomal abnormality that is observable by light microscopy involves, on average, 3 to 5 megabases of DNA and represents the disruption or loss of hundreds of genes. Such disruptions often have a profound clinical effect. Chromosomal abnormalities are observed in approximately 0.65% of all live births.2 The gain or loss of an entire chromosome, other than a sex chromosome, is usually incompatible with life and accounts for approximately 50% of first-trimester spontaneous abortions.3 In leukemia, cytogenetic abnormalities are observed in more than 50% of bone marrow specimens.4 These recurring abnormalities often define the leukemia and frequently indicate clinical prognosis.
Reasons for Chromosome Analysis
Physicians who care for patients of all ages may order chromosome analysis or karyotyping for patients with mental retardation, infertility, ambiguous genitalia, short stature, fetal loss, risk of genetic or chromosomal disease, and cancer. In the following discussion, basic cytogenetic concepts are presented. This field is in a period of tremendous growth. Supplementation of this chapter with the material in Chapter 32 is recommended.
Chromosome Structure
Cell Cycle
The cell cycle is divided into four stages: G1, the growth period before synthesis of deoxyribonucleic acid (DNA); S phase, the period during which DNA synthesis takes place; G2, the period after DNA synthesis; and M, the period of mitosis or cell division, the shortest phase of the cell cycle (Figure 31-3). During mitosis, chromosomes are maximally condensed. While in mitosis, cells can be chemically treated to arrest cell progression through the cycle so that the chromosomes can be isolated and analyzed.
Chromosome Architecture
A chromosome is formed from a single long DNA molecule that contains a series of genes. The complementary double-helix structure of DNA was established in 1953 by Watson and Crick.5 The backbone is a sugar-phosphate-sugar polymer. The sugar is deoxyribose. Attached to the backbone and filling the center of the helix are four nitrogen-containing bases. Two of these, adenine (A) and guanine (G), are purines; the other two, cytosine (C) and thymine (T), are pyrimidines (Figure 31-4).
The chromosomal DNA of the cell resides in the cell’s nucleus. This DNA and its accompanying proteins are referred to as chromatin. During the cell cycle, at mitosis, the nuclear chromatin condenses approximately 10,000-fold to form chromosomes.6 Each chromosome results from progressive folding and compaction of the entire nuclear chromatin. This condensation is achieved through multiple levels of helical coiling and supercoiling (Figure 31-5).
Metaphase Chromosomes
Metaphase is the stage of mitosis where the chromosomes align on the equatorial plate. Electron micrographs of metaphase chromosomes have provided models of chromosome structure. In the “beads-on-a-string” model of chromatin folding, the DNA helix is looped around a core of histone proteins.7 This packaging unit is known as a nucleosome and measures approximately 11 nm in diameter.8 Nucleosomes are coiled into twisted forms to create an approximately 30-nm chromatin fiber. This fiber, called a solenoid, is condensed further and bent into a loop configuration. These loops extend at an angle from the main chromosome axis.9
Chromosome Identification
Chromosome Number
In 1956, Tijo and Levan10 identified the correct number of human chromosomes as 46. This is the diploid chromosome number and is determined by counting the chromosomes in dividing somatic cells. The designation for the diploid number is 2n. Gametes (ova and sperm) have half the diploid number (23). This is called the haploid number of chromosomes and is designated as n. Different species have different numbers of chromosomes. The reindeer has a relatively high chromosome number for a mammal (2n = 76), whereas the Indian muntjac, or barking deer, has a very low chromosome number (2n = 7 in the male and 2n = 6 in the female).11
Chromosome Size and Type
In the 1960s, before the discovery of banding, chromosomes were categorized by overall size and the location of the centromere (primary constriction) and were assigned to one of seven groups, A through G. Group A includes chromosome pairs 1, 2, and 3. These are the largest chromosomes, and their centromeres are located in the middle of the chromosome (i.e., they are metacentric). Group B chromosomes, pairs 4 and 5, are the next largest chromosomes; their centromeres are off center, or submetacentric. Group G consists of the smallest chromosomes, pairs 21 and 22, whose centromeres are located at the ends of the chromosomes and are designated as acrocentric (Figure 31-6).
Techniques for Chromosome Preparation and Analysis
Chromosome Preparation
Tissues used for chromosome analysis contain cells with an inherently high mitotic rate (bone marrow cells) or cells that can be stimulated to divide in culture (peripheral blood lymphocytes). Special harvesting procedures are established for each tissue. Mitogens such as phytohemagglutinin or pokeweed mitogen are added to peripheral blood cultures. Phytohemagglutinin primarily stimulates T cells to divide,12 whereas pokeweed preferentially stimulates B lymphocytes.13
Chromosome Banding
Analysis of each chromosome is made possible by staining with a dye. The name chromosome is derived from the Greek words chroma, meaning “color,” and soma, meaning “body.” Hence chromosome means “colored body.” In 1969, Caspersson, Zech, Modest, et al14 were the first investigators to stain chromosomes successfully with a fluorochrome dye. Using quinacrine mustard, which binds to adenine-thymine–rich areas of the chromosome, they were able to distinguish a banding pattern unique to each chromosome. This banding pattern, called Q banding, differentiates the chromosome into bands of differing widths and relative brightnesses (Figure 31-7). The most brightly fluorescent bands of the 46 human chromosomes include the distal end of the Y chromosome, the centromeric regions of chromosomes 3 and 4, and the short arms of the acrocentric chromosomes (13, 14, 15, 21, and 22).
Other stains are used to identify chromosomes, but in contrast to Q banding, these methods normally necessitate some pretreatment of the slide to be analyzed. Giemsa (G) bands are obtained by pretreating the chromosomes with the proteolytic enzyme trypsin. GTG banding means “G banding by Giemsa with the use of trypsin.” Giemsa, like quinacrine mustard, stains AT-rich areas of the chromosome. The dark bands are called G-positive (+) bands. Guanine-cytosine–rich areas of the chromosome have little affinity for the dye and are referred to as G-negative (−) bands. G+ bands correspond with the brightly fluorescing bands of Q banding (Figures 31-8 and 31-9). G banding is the most common method used for staining chromosomes.
C banding stains the centromere (primary constriction) of the chromosome and the surrounding condensed heterochromatin. Constitutive heterochromatin is a special type of late-replicating repetitive DNA that is located primarily at the centromere of the chromosome. In C banding, the chromosomes are treated first with an acid and then with an alkali (barium hydroxide) before Giemsa staining. C banding is most intense in human chromosomes 1, 9, and 16 and the Y chromosome. Polymorphisms are also observed in the C bands from different individuals. These polymorphisms have no clinical significance (Figure 31-10).
Chromosome banding is visible after chromosome condensation, which occurs during mitosis. The banding pattern observed depends on the degree of condensation. By examination of human chromosomes early in mitosis, it has been possible to estimate a total haploid genome (23 chromosomes) with approximately 2000 AT-rich (G+) bands.15 The later the stage of mitosis, the more condensed the chromosome and the fewer total G+ bands observed.
Nonradioactive in Situ Hybridization
Fluorescence in situ hybridization (FISH) is a molecular technique commonly used in cytogenetic laboratories. FISH studies are a valuable adjunct to the diagnostic workup. In FISH, the DNA or RNA probe is labeled with a fluorophore. Target DNA is treated with heat and formamide to denature the double-stranded DNA, which renders it single-stranded. The target DNA anneals to a similarly denatured, single-stranded, fluorescently labeled DNA or RNA probe with a complementary sequence. After hybridization, the unbound probe is removed through a series of stringent washes, and the cells are counterstained for visualization (Figure 31-11).
In situ hybridization with centromere or whole-chromosome painting probes can be used to identify individual chromosomes (Figure 31-12). Marker chromosomes represent chromatin material that has been structurally altered and cannot be identified by a G-band pattern. FISH using a centromere or paint probe, or both, is often helpful in identifying the chromosome of origin (Figure 31-13).16 Specific loci probes can be used to detect both structural and numerical abnormalities but are especially helpful in identifying chromosomal translocations or inversions.
[/not-level-membership-for-hematology-oncology-and-palliative-medicine-category]
