[level-membership-for-neurosurgery-category]
CHAPTER 334 Critical Care Management of Traumatic Brain Injury
Traumatic brain injury (TBI) is a leading cause of death and disability worldwide. Every year, about 1.5 million affected people die and several millions receive emergency treatment after TBI. Fatality and disability rates depend on the severity and mechanisms of the TBI, but unfavorable outcomes (death, vegetative state, and severe disability) can occur in more than 20% of affected patients after TBI.1
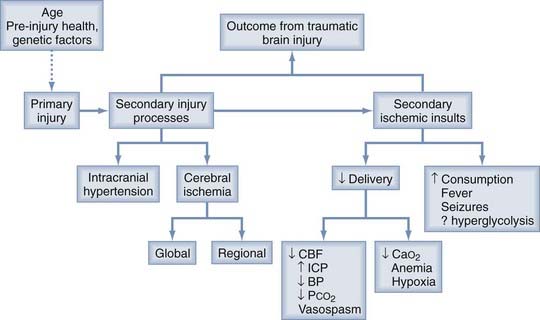
The damage to the brain that occurs after traumatic injury is usually divided into two general types, primary and secondary (Fig. 334-1). The primary injury occurs before arrival at the hospital and, other than trauma preventive programs, cannot be modified by the physicians treating the individual patient. The severity of the primary injury, however, can be classified and quantified for prognostic purposes, and the primary injury often initiates a cascade of secondary injury processes that evolve over the first few postinjury days. Individual characteristics, including age, preinjury health, and certain genetic factors, can also alter the primary injury and subsequent response to the injury. For example, the ε4 allele of the apolipoprotein E gene is a genetic variant that has been associated with a worse outcome after TBI.2 The injured brain is exquisitely sensitive to ischemia, and secondary ischemic insults can additionally damage the brain. Pharmacologic treatment of these secondary injury processes and modern emergency and critical care management to prevent secondary ischemic insults are the primary goals of the early treatment of TBI.
History of Head Trauma Management
Coma Data Banks
The International Data Bank, which consisted of prospectively collected clinical information on 1000 comatose patients from three centers in Scotland, the Netherlands, and the United States, was reported in 1979.3 These investigators developed simple but practical scales for the assessment of coma (the Glasgow Coma Scale [GCS], Table 334-1) and for the assessment of neurological outcome (the Glasgow Outcome Scale [GOS], Table 334-2) and presented some of the early work on factors that determine outcome after neurological injury.4,5 It was apparent from these studies that the outcome after severe head injury was dependent on the severity and type of the primary injury.
TABLE 334-1 Glasgow Coma Scale for Assessment of Coma and Impaired Consciousness
| EYE OPENING | BEST MOTOR RESPONSE | BEST VERBAL RESPONSE |
|---|---|---|
| 4 = Spontaneous | 6 = Obeying | 5 = Oriented |
| 3 = To speech | 5 = Localizing | 4 = Confused |
| 2 = To pain | 4 = Withdrawing | 3 = Inappropriate |
| 1 = None | 3 = Flexing | 2 = Incomprehensible |
| 2 = Extending | 1 = None | |
| 1 = None |
Data from Teasdale G, Jennett B. Assessment of coma and impaired consciousness. Lancet. 1974;2:81-84.
TABLE 334-2 Glasgow Outcome Scale (Original 5-Point Scale and Extended 8-Point Scale) for Assessment of Outcome
| SUMMARY | GLASGOW OUTCOME SCALE | EXTENDED GLASGOW OUTCOME SCALE |
|---|---|---|
| 1 = Dead | 1 = Dead | |
| Sleep/awake, nonsentient | 2 = Persistent vegetative state | 2 = Persistent vegetative state |
| Conscious but dependent | 3 = Severe disability | 3 = Lower severe disability |
| 4 = Upper severe disability | ||
| Independent but disabled | 4 = Moderate disability | 5 = Lower moderate disability |
| 6 = Upper moderate disability | ||
| May have mild residual effects | 5 = Good recovery | 7 = Lower good recovery |
| 8 = Upper good recovery |
Data from Jennett B, Bond MR. Assessment of outcome after severe brain damage. Lancet. 1975;1:480-484; and Wilson JT, Pettigrew LE, Teasdale GM. Structured interviews for the Glasgow Outcome Scale and the extended Glasgow Outcome Scale: Guidelines for their use. J Neurotrauma. 1998;15:573-585.
The Traumatic Coma Data Bank (TCDB) consists of prospectively collected clinical data on 1030 comatose patients from four centers in the United States.6 As part of this study, reported initially in 1991, and work from other individual head injury centers, the critical role of prehospital insults such as hypoxia and hypotension, the importance of prompt evacuation of intracranial mass lesions, and the importance of intracranial hypertension were more clearly identified.7–9 In addition, a new classification of the primary injury based on CT scan findings (the Marshall CT classification) was developed from the TCDB data.10
The International Mission for Prognosis and Clinical Trial (IMPACT) database contains the data collected from most TBI clinical trials conducted over the past 20 years. The database contains information on 9205 patients with severe and moderate TBI from eight randomized placebo-controlled trials and three observational studies. The major emphasis during the first phase of the study was on information from the time of injury to the postresuscitation period and outcome at 6 months, thus providing a unique resource for prognostic analysis.11 Using univariate and multivariate analysis, it was found that the most powerful independent prognostic variables were age, GCS motor score, pupil response, CT scan characteristics (including the Marshall CT classification) traumatic subarachnoid hemorrhage (SAH), and prothrombin time. Other important prognostic factors were hypotension, hypoxia, the eye and verbal components of the GCS, glucose, platelets, and hemoglobin. These results suggest the need for further research, including evaluation of the clinical impact of intervening aggressively to correct abnormalities in hemoglobin, glucose, and coagulation. The combination of prognostic factors also provides a solid foundation for estimation of the probability of each GOS category at 6 months for individual TBI patients.12
Traumatic Brian Injury Guidelines
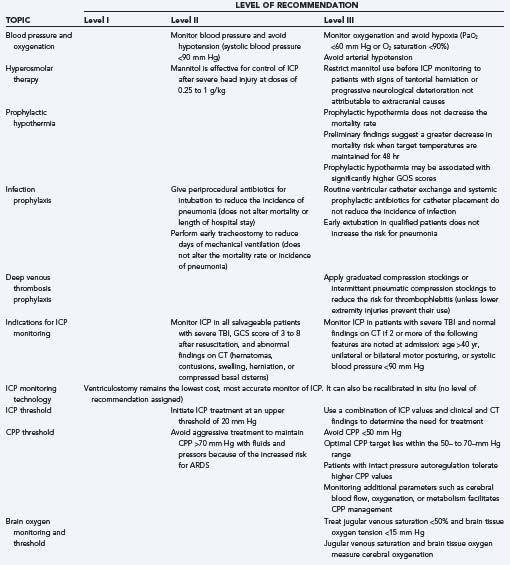
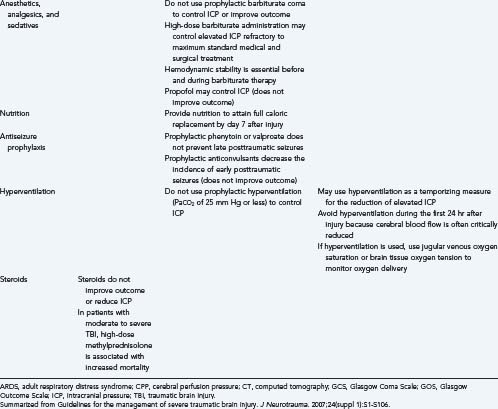
In 2007, a joint undertaking of the Brain Trauma Foundation and the American Association of Neurological Surgeons (AANS), the Congress of Neurological Surgeons (CNS), and the AANS/CNS Joint Section on Neurotrauma and Critical Care updated evidence-based guidelines for the management of severe TBI.13,14 In this third edition, six new topics were added and two were assigned to the prehospital guidelines. The levels of recommendation were changed from “standard, guideline, and option” to “level I, level II, and level III,” respectively. The purpose of the guidelines was to provide not only a road map for improving treatment but also a template for future research so that a sufficient body of class I and II studies for level I and II recommendations in the fourth edition could be generated. The main recommendations from the third edition of the “Guidelines for the Management of Traumatic Brain Injury” are summarized in Table 334-3.
 See also
 Multicenter Clinical Trials
Laboratory studies have provided a better understanding of the basic mechanisms of secondary injury to the brain after trauma. Anticholinergic agents, corticosteroids, calcium channel antagonists, free radical scavengers, NMDA receptor antagonists, bradykinin antagonists, and moderate hypothermia have all been studied in experimental head injury models and found to have beneficial effects. A number of potentially beneficial therapies derived from these laboratory studies have been tested in phase III clinical trials. As reviewed by Bullock and associates, a number of pitfalls can be encountered in taking a treatment from the laboratory to a successful clinical trial.15
The heterogeneity of TBI is considered one of the most significant barriers to translating effective therapeutic interventions from the laboratory to the clinical setting. The National Institute of Neurological Disorders and Stroke, in collaboration with other associations, including the Brain Injury Association of America, convened a workshop to outline a classification system for TBI. They proposed that a new multidimensional classification system be developed for TBI clinical trials and that preclinical models are vital in establishing the pathophysiologic mechanisms relevant to specific pathoanatomic types of TBI. Evaluation of targeted therapies for specific pathoanatomic lesions will probably require the inclusion of less severely injured patients with more homogeneous injuries.16
Pathophysiology of Traumatic Brain Injury
Primary Brain Injury
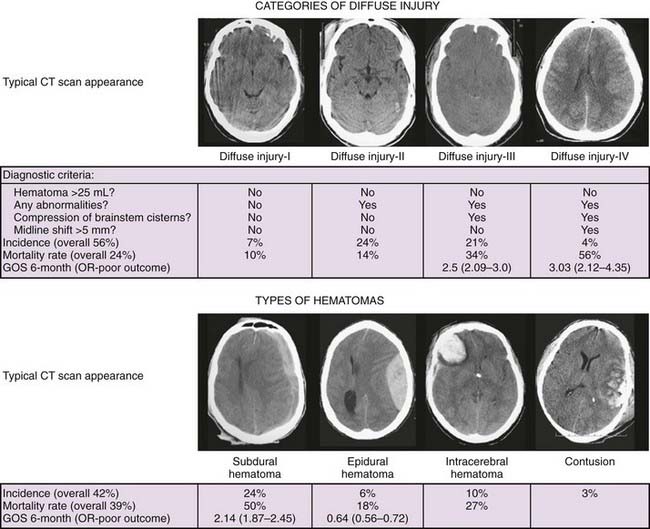
Two pathologic processes are uniquely characteristic of trauma: diffuse axonal injury (DAI) and contusion/hematoma formation. Diffuse injures are more common. In the TCDB series, 56% of patients with severe closed head injury had a diffuse injury and 42% had a focal mass lesion. However, the mortality rate is generally higher with a focal lesion, 39% versus 24% with a diffuse injury.6
Diffuse Axonal Injury
Histopathologic findings of DAI have been observed in 25% of patients who die of TBI.17 When more sensitive indicators of axonal injury are used, such as β-amyloid immunohistochemistry, as many as 90% of patients who die of TBI have DAI changes.18 Current thought about the development of DAI is that axotomy may not be complete immediately after the trauma. Secondary or delayed axotomy may predominate in many circumstances.
DAI is primarily a pathologic diagnosis, with microscopic damage scattered throughout the brain, but clinical correlations have been described. Traumatic loss of consciousness for less than 6 hours is considered a concussion and is usually associated with amnesia for the events related to the injury. Traumatic coma for longer than 6 hours is generally attributed to DAI. Three levels of DAI severity based on clinical criteria are recognized: (1) mild DAI—coma of 6 to 24 hours’ duration; (2) moderate DAI—coma lasting longer than 24 hours without decerebrate posturing; and (3) severe DAI—coma lasting longer than 24 hours with decerebrate posturing or flaccidity. Severe DAI has a 50% mortality.19
Hematomas/Contusions
Subdural hematoma is the most common focal intracranial lesion and occurred in 24% of patients in the TCDB with severe closed head injury.6 The hematoma is located between the dura and brain, usually results from a torn bridging vein between the cortex and draining sinuses, and is typically situated in the frontoparietal region. An acute subdural hematoma, identified within 72 hours after trauma, generally appears on CT as a high-density, homogeneous crescent-shaped mass paralleling the calvaria (Fig. 334-2). However, up to 10% of acute subdural hematomas may be isodense with brain because of the low hemoglobin content.20
The mortality rate in patients with subdural hematomas is high.21 The following CT scan findings are particularly predictive of outcome: hematoma thickness, midline shift, the presence of underlying brain swelling or contusions,22,23 obliteration of the basal cisterns, and the presence of traumatic SAH.21
Subdural hematomas cause brain damage by increasing intracranial pressure (ICP) and by shifting brain structures. Reductions in cerebral blood flow (CBF) below ischemic thresholds24 and marked reductions in cerebral oxygenation25,26 have been observed preoperatively and are rapidly reversed by surgical evacuation of the hematoma. The presence of blood in the subdural space may also have direct toxic effects, but experimental studies have not consistently demonstrated this mechanism.27
The primary treatment of subdural hematoma is prompt surgical evacuation, and the longer the delay between injury and surgery, the more severe the ischemic damage that can occur. Surgical indications for acute subdural hematoma include (1) any subdural hematoma greater than 10 mm in thickness or with a midline shift of greater than 5 mm and (2) a subdural hematoma less than 10 mm in thickness and with a midline shift of less than 5 mm if the GCS score is less than 9 and decreases 2 or more points between the time of injury and hospital admission, asymmetric or fixed and dilated pupils, or ICP exceeding 20 mm Hg.28 Mortality in patients arriving at the hospital in coma with subsequent surgical evacuation is between 57% and 68%.28
Epidural hematomas, or collections of blood between the skull and the dura, are less common than subdural hematomas. Epidural hematomas occurred in 6% of patients with severe closed head injuries in the TCDB series.6 Although patients with subdural hematomas are generally comatose immediately, only a third of patients with epidural hematomas are unconscious from the time of injury, a third have a lucid interval, and a third are never unconscious.29 An epidural hematoma is almost always associated with a skull fracture (91% in adults and 75% in children).30 The blood comes from torn dural vessels, usually arterial, from the fractured skull bone or occasionally from torn venous sinuses. On CT (see Fig. 334-2), an epidural hematoma is characterized by a biconvex, uniformly hyperdense lesion. Associated brain lesions are less common than with subdural hematomas. Epidural hematomas may also develop in delayed fashion31 or on the contralateral side after evacuation of an initial epidural hematoma.32
The outcome of patients with an epidural hematoma depends on their neurological status at the time of surgery. The mortality rate varies from 0% for patients who are not in coma, to 9% for obtunded patients, to 20% for patients in deep coma. The following parameters were found to be significantly related to outcome in patients with epidural hematoma: age, time from injury to treatment, immediate coma or lucid interval, presence of pupillary abnormalities, GCS motor score on admission, CT findings (hematoma volume, degree of midline shift, presence of signs of active hematoma bleeding, associated intradural lesion), and postoperative ICP.33
The primary treatment of an epidural hematoma is prompt surgical evacuation. An acute epidural hematoma with a volume greater than 30 cm3 should be surgically evacuated regardless of the patient’s GCS score. An epidural hematoma less than 30 cm3 in volume, less than 15 mm in thickness, and with less than a 5-mm midline shift in a patient with a GCS score higher than 8 and no focal deficit may be managed nonoperatively with serial CT scanning and close neurological observation.30 Mortality in patients undergoing surgery for evacuation of an epidural hematoma is approximately 10%.30
Intracerebral blood can take the form of a hematoma or a contusion. Intracerebral hematomas are more common and occurred as the primary lesion in 10% of patients with severe closed head injuries in the TCDB series.6 Occasionally, it may be difficult to differentiate a traumatic intracerebral hematoma from spontaneous hemorrhage; however, the presence of associated contusion, fracture, or an air-fluid level in the sinus helps in identifying the hematoma as traumatic. A zone of surrounding hypodensity denotes contusion or edema.
Most intracerebral hematomas are visualized as hyperdense mass lesions (see Fig. 334-2). They are generally located in the frontal and temporal lobes and can be detected on a CT scan immediately after the trauma. However, delayed intracerebral hematomas may also be manifested during the hospital course. A delayed hematoma is one that is seen on a repeated CT scan within 24 to 48 hours of the injury or operation but is not present on the initial CT scan. Commonly, a delayed hematoma is associated with clinical deterioration. Expansion of the intracerebral hemorrhage occurs in half the patients within the initial 24 hours, and larger hematomas exhibit the greatest expansion. Furthermore, the earlier the initial CT scan is obtained, the more likely it is that significant growth of the hematoma will be observed on subsequent scans.34 Indications for surgery are (1) signs or neurological deterioration referable to the parenchymal lesion and medically refractory intracranial hypertension or signs of a mass effect on CT, (2) frontal or temporal contusions greater than 20 cm3 with a midline shift of 5 mm or cisternal compression in a patient with a GCS score of 6 to 8, and (3) any parenchymal lesion with volume greater than 50 cm3.35 Factors that determine outcome in patients with intracerebral hematomas include GCS score, hematoma volume, and the occurrence of hypoxia.36
Hemorrhagic contusions were present as the primary lesion in 3% of patients with severe closed head injuries in the TCDB series.6 Single contusions are located either below the region of the impact or opposite the region of impact. Contusions appear as heterogeneous areas of brain necrosis, hemorrhage, and infarction and represent mixed-density lesions on CT scan.37 Multiple focal contusions have a “salt and pepper” appearance on CT. Ischemia may play a role in the pathogenesis of contusions, and regional CBF (rCBF) values averaging 17.5 ± 4.0 mL/100 g per minute have been measured in pericontusional tissue.38
Classification of Primary Brain Injury
A number of injury severity schemes have been developed for predicting mortality after trauma and other critical illnesses. In general, these schemes have been developed in other patient populations and do not accurately predict outcome in neurologically injured patients. Rocca and colleagues studied 70 patients with TBI and found that the GCS was superior to the Acute Physiology Score (APS), the Simplified Acute Physiology Score (SAPS), and the Therapeutic Intervention Scoring System (TISS).39 Alvarez and coworkers studied 401 patients with TBI and compared the predictive ability of the Acute Physiology and Chronic Health Evaluation (APACHE II), SAPS II, Mortality Probability Models (MPM II), and the GCS.40 The MPM II system provided a good estimation of mortality. The SAPS II and APACHE II systems did not calibrate well, and the logistic regression model containing the GCS as an independent variable and developed in this group of patients was not as well calibrated as MPM II. Of all these systems, the GCS is the most commonly used neurological injury scale for adults because of its high interobserver reliability and generally good prognostic capabilities,41 but it is a poor discriminator for less severe TBI, which accounts for 80% to 90% of all cases.
Schemes that predict outcome well after TBI generally include age, severity of injury, and type of injury. For the severity-of-injury scale, the GCS, either the sum score or, for comatose patients, the motor score alone, is used. For the type of injury, a classification that separates focal and diffuse injuries is typically used. The CT classification of head injury based on information obtained from the initial CT scan was derived from the TCDB data.10 The scheme uses the status of the mesencephalic cisterns, the amount of midline shift, and the presence or absence of surgical masses. Diffuse injuries were defined in all patients with no mixed- or high-density lesions greater than 25 cm3. The category of diffuse injuries was divided into four subgroups: diffuse injury I included all head injuries with no visible pathology, diffuse injury II included all diffuse injuries with cisterns present and less than 5-mm shift, diffuse injury III included all diffuse injuries with compressed or absent cisterns but less than 5-mm shift, and diffuse injury IV included all diffuse injuries with more than 5-mm midline shift. Example of these diffuse injury categories are shown in Figure 334-2. The category of mass lesions, which included all patients with mixed- or high-density lesions greater than 25 cm3, was divided into those with the mass surgically evacuated (including operated subdural, epidural, and intracerebral hematomas) and those with nonevacuated mass lesions.
The IMPACT database studies have confirmed the usefulness of the TCDB classification but have also shown that individual CT characteristics such as traumatic SAH and the individual hematoma type (subdural versus epidural) have added prognostic value.21 Probably the most descriptive scheme at the present time is to use a combination of the TCDB classification plus these individual CT characteristics.
Secondary Brain Injury
Traumatic Brain Swelling/Intracranial Hypertension
Brain edema and vascular engorgement have been used interchangeably to describe the brain swelling that accompanies severe TBI. Although the relative contribution of these two entities to the swelling process is controversial, there is increasing evidence that edema plays the predominant role. In experimental models of brain trauma, the water content of the brain is increased whereas cerebral blood volume is decreased, thus suggesting that edema is the major component of brain swelling after trauma.42 Clinical studies using magnetic resonance imaging (MRI) techniques to quantify water and blood content have confirmed these experimental findings in humans.43
Brain edema can be vasogenic (secondary to opening the blood-brain barrier [BBB]) or cellular. Most experimental evidence, including recent data using diffusion-weighted imaging techniques to differentiate types of edema formation, suggest that the early, immediate increase in brain water after trauma is probably vasogenic whereas the gradual increase in brain water that occurs during the first few days after injury is cellular.44,45
The clinical manifestation of brain swelling is intracranial hypertension, which develops in 50% of patients in coma caused by severe head injury. It is a misconception that ICP will always be low after operative evacuation of a large intracranial hematoma. Intracranial hypertension occurs in 50% to 70% of patients after evacuation of an intracranial hematoma.46,47 This postoperative intracranial hypertension may be due to a postoperative hematoma, either at the site of the operation or at a new site, progressive swelling of a focal contusion, diffuse brain swelling, and other systemic complications. The incidence of intracranial hypertension is greater after evacuation of an intracerebral hematoma, 71%, than after evacuation of a subdural or epidural hematoma, 39%.46 In patients with no mass lesions, elevated ICP has been observed to occur during the hospital course in 30%46 to 80%48 of patients.
The association between the severity of intracranial hypertension and poor outcome after severe head injury is well recognized. In one series, 77% of patients with ICP below 15 mm Hg had a favorable outcome as compared with just 43% of patients with ICP above 15 mm Hg.49 Miller and coauthors reported that the mortality rate increased from 18% to 92% and the frequency of good outcomes decreased from 74% to 3% in patients with normal ICP versus patients who had intracranial hypertension that could not be reduced below 20 mm Hg.50 Similarly, Saul and Ducker reported a 69% mortality rate in patients with ICP greater than 25 mm Hg as opposed to a mortality rate of 15% if ICP remained less than 25 mm Hg.51
The relationship between elevated ICP and a poor outcome is not simply a reflection of the severity of the initial neurological injury. Severe intracranial hypertension can result in secondary injury to the brain through ischemia produced by reduced cerebral perfusion pressure (CPP), and it can also distort and compress the brainstem. Although no randomized clinical trial has addressed this question, several clinical series have suggested that reduction of ICP to less than 20 mm Hg does reduce mortality after severe head injury.46,51–53
Effects of Trauma on the Cerebral Vasculature
Many investigators have studied CBF after TBI and emphasized various patterns of CBF. A few studies have closely examined the evolution of TBI over time with serial measurements of CBF.54,55 These serial studies in particular have helped to develop the overall picture of the postinjury evolution of CBF.
Martin and coworkers described a phasic pattern of cerebral hemodynamic changes in 125 severely head-injured patients with a GCS score lower than 8 who were studied prospectively with intravenous 133Xe-CBF measurements, cerebral metabolic assessment, or transcranial Doppler (TCD) evaluations (or any combination of the three studies).54 An early hypoperfusion phase occurred during the first 24 hours after injury and was characterized by low CBF and normal middle cerebral artery flow velocity (MCA-FV). This was followed by a hyperemic phase that occurred in about 40% of patients between postinjury days 1 and 3 when CBF was transiently increased with a rapidly rising MCA-FV but a normal hemispheric index. Later (postinjury days 4 to 15), a vasospasm phase occurred that was characterized by low-normal CBF values accompanied by high MCA-FV and an elevated hemispheric index. Hlatky and colleagues found a significant reduction in CBF during the first 12 hours after TBI; in patients with CBF lower than 18 mL/100 g per minute, intracranial hypertension played a major causative role in the reduction in CBF, and for levels of CBF between 10 and 40 mL/100 g per minute, the presence of regional hypoperfusion was a more important factor in reducing the average CBF.56 These CBF patterns, which have been described primarily with global CBF measurements, can also occur regionally. Hypoperfusion, in particular, can occur in brain tissue surrounding a focal contusion or underlying a subdural hematoma. Schroder and associates observed rCBF values averaging 17.5 mL/100 g per minute in pericontusional brain.38 McLaughin and Marion observed CBF values within contused brain and in pericontusional brain that were significantly lower than those in the rest of the brain.57 Focal hyperemia has been observed in 38% of patients, particularly in tissue adjacent to intraparenchymal or extracerebral focal lesions.58
Hypoperfusion and Outcome
CBF studies using the 133Xe method or the nitrous oxide saturation method have described the prognostic value of global CBF measurements. Robertson and coauthors reported several hemodynamic patterns from serial measurements of CBF and observed that patients with reduced CBF at any time during the first 7 days after injury had a higher mortality rate and poorer recovery in survivors.55 Kelly and coworkers found that patients with CBF values of less than 33 mL/100 g per minute had a higher incidence of evacuated intracranial hematomas and a worse outcome than did patients with higher CBF.59
Low rCBF has an equally poor prognosis. With the availability of stable xenon–CT, it has been observed that about a third of patients with severe TBI have regional or global CBF in the ischemic range (<18 mL/100 g per minute) within the first 6 hours after injury.60 The occurrence of ischemia was significantly related to a poor outcome. Early reductions in CBF within 4 hours after trauma occurred more commonly in patients with multiple bihemispheric contusions.61
Continuous methods for CBF monitoring have associated transient hypoperfusion, as manifested by a reduction in jugular venous oxygen saturation (SjvO2) to below 50%, with a poor neurological outcome. SjvO2, monitored in 116 patients with severe head injury, was reduced below 50% at least once in 39% of the patients.62 When adjusted for injury severity, one episode of jugular desaturation was associated with a 2-fold increased risk for a poor outcome, and multiple episodes of jugular desaturation were associated with a 14-fold increased risk for a poor outcome.
Hyperemia, Intracranial Hypertension, and Outcome
Hyperemia has been associated with both intracranial hypertension and a poor neurological outcome. Defined as CBF that is above normal values, hyperemia has been observed to occur in 20% of adults. If severely head-injured patients with CBF values in the normal range are considered to have “relative hyperemia” because CBF is higher than needed for the reduced metabolic requirements associated with coma, 55% of severely head-injured adults have hyperemia.63 The incidence is even higher in children, with up to 88% having normal or elevated CBF.64
Numerous studies have associated elevated CBF and outcome. In a study of 36 patients, the mortality rate was 67% in those with elevated CBF versus 9% in those with normal CBF and 27% in those with reduced CBF.65 In contrast, other studies have found elevated CBF to be associated with a relatively good outcome.55 Focal hyperemia has also been thought to be a finding associated with a favorable outcome.58 Sometimes, hyperemia is defined by a low arteriovenous oxygen diffusion capacity (AVDO2) or high SjvO2 because this finding would suggest a CBF in excess of cerebral metabolic requirements. In terms of prognosis, however, the finding of an elevated SjvO2 describes a wide spectrum of outcomes.66 High SjvO2 predicts a poor outcome if it is caused by a low cerebral metabolic rate of oxygen consumption (CMRO2). In contrast, if high CBF is the cause of the elevated SjvO2, it often predicts a favorable outcome.
Vasospasm and Head Injury Outcome
The TCDB study reported the occurrence of SAH in 39% of patients with severe head injury, although more recent studies have reported a higher frequency of traumatic SAH, probably because of the improved resolution of modern CT scanners.9
The incidence of ischemic injury secondary to vasospasm is more difficult to estimate because the neurological signs of ischemia are superimposed on the neurological deficits of the traumatic injury, but a few studies suggest that cerebral vasospasm may be an important cause of evolving injury in some patients. Chan and associates studied the relationship between increased FV and the development of cerebral infarction on CT in 121 patients.67 They found that of 23 patients in whom a mean FV of greater than 100 cm/sec developed, an infarction in the territory of the involved cerebral vessel developed in 4.
Recently, Armonda and coauthors described a significant percentage of patients with severe TBI resulting from a blast or high-velocity gunshot wound to the head in whom cranial vascular injury developed.68 Vasospasm was observed in up to 47% of these patients, the average duration of the spasm was 14 days with a range of up to 30 days, and vasospasm was associated with the presence of pseudoaneurysm, hemorrhage, the number of lobes injured, and mortality.
Secondary Ischemic Insults
Clinical studies have demonstrated an association between the occurrence of secondary insults and a poor neurological outcome. Jones and colleagues reported that secondary insults occurred in 91% of 124 patients studied with a computerized detection system.69 The duration of hypotensive, febrile, and hypoxic insults was significantly associated with mortality. Gopinath and coworkers observed that the occurrence of secondary insults sufficiently severe that they resulted in desaturation of jugular venous blood was significantly related to a poor neurological outcome.62 Even when adjusted for other confounding factors, such as age, type of injury, and neurological status, the occurrence of just one episode of jugular desaturation was associated with a 2-fold increase in risk for a poor neurological outcome, and the occurrence of multiple episodes of jugular desaturation was associated with a 14-fold increase in risk for a poor neurological outcome.
Causes of Secondary Ischemic Insults
Any pathophysiologic process that impairs cerebral energy metabolism can be a secondary ischemic insult after head injury. As shown in Figure 334-1, these processes can be divided into two general categories: (1) those that decrease the cerebral delivery of energy substrates and (2) those that increase cerebral energy consumption.
Cerebral oxygen consumption or CMRO2 has a normal value of 3.4 mg/100 g per minute (1.5 µmol/g per minute). Numerous conditions are known to alter CMRO2. Head injury, anesthesia, and hypothermia are known to decrease CMRO2, whereas fever and seizures increase it.63,70–76 Recent studies using [18F]fluorodeoxyglucose-labeled positron emission tomography (FDG-PET) to study glucose metabolism after severe head injury have suggested that the cerebral metabolic rate of glucose (CMRGlc) may be elevated regionally and perhaps even globally at times when CMRO2 is normal or reduced.77 This “hyperglycolysis” may indicate mitochondrial damage and inability of the brain to metabolize oxygen normally. If energy metabolism is dependent on glucose metabolism, energy failure as a result of glucose depletion is another possible cause of secondary ischemic insults after severe head injury.
Neurological Intensive Care Monitoring
Monitoring Neurological Status
To assess the neurological status of the patient, evaluation of mental status and cranial nerve, pupillary, and motor functions should be included in the periodic neurological examination whenever possible. This will help in determining whether there is improvement, deterioration, or no change in the patient’s clinical condition. A 24-hour record of the patient should be available on one sheet, such as was described by Clifton and Grossman,78 and should include information on vital signs and laboratory values. Computerized information systems are becoming more widespread in ICUs and can markedly reduce the burden of such record keeping.
Monitoring for Secondary Injury Processes: Intracranial Hypertension
ICP cannot be reliably estimated from any clinical feature after severe head injury. Clinical symptoms of raised ICP, such as headache, nausea, and vomiting, are impossible to elicit in comatose patients. Papilledema is uncommon after head injury, even in patients with intracranial hypertension.79 In one study, although 54% of patients had increased ICP, only 3.5% had papilledema on funduscopic examination. Other neurological signs, including pupillary dilation and decerebrate posturing, can occur in the absence of intracranial hypertension. CT signs of brain swelling, such as a midline shift and compressed basal cisterns, are predictive of raised ICP, but intracranial hypertension can occur without these findings.
Techniques for Monitoring Intracranial Pressure
Historical Aspects
Recording of cerebrospinal fluid (CSF) pressure was initially performed through lumbar puncture in the late 1800s. Continuous pressure recordings of ICP were first reported in 1951 by Guillaume and Janny.80 In 1960, Lundberg reported the results of ventricular catheter pressure recordings in 143 patients with various neurosurgical diagnoses.81 This was a landmark work that emphasized both the safety and importance of monitoring ICP.
Currently Available Techniques
Although several new types of monitors have recently been marketed, the ventriculostomy catheter remains the preferred device for monitoring ICP and the standard against which all the newer monitors are compared. The ventriculostomy catheter is positioned with its tip in the frontal horn of the lateral ventricle and is coupled by fluid-filled tubing to an external pressure transducer that can be reset to zero and recalibrated against an external standard. The ventriculostomy catheter provides the most reliable measurement of ICP throughout the normal and pathologic ranges.82 In addition, the ventriculostomy ICP monitor allows treatment of elevated ICP by intermittent drainage of CSF. However, the risk for ventriculitis and intracranial hemorrhage is highest with ventriculostomy,83 and proper placement of the catheter tip in the lateral ventricle can be difficult in patients with small, compressed ventricles.
When the ventricle cannot be cannulated, alternative devices can be used. A number of non–fluid-coupled devices have become available for ICP monitoring and have replaced the subarachnoid bolt as an alternative to ventriculostomy in most institutions. The microsensor transducer84 and the fiberoptic transducer85 are the most widely available. These miniature pressure transducer–tipped catheters can be inserted in the subdural space or directly into brain tissue. The main advantage of these monitors is their ease of insertion, especially in patients with compressed ventricles. They provide more reliable measurements of ICP than do subarachnoid bolts and fluid-coupled catheters in the subdural space because they have no lumen to become obstructed. The transducers, however, cannot be reset to zero after they are inserted into the skull, and they exhibit drift over time.86
ICP monitoring is continued for as long as treatment of intracranial hypertension is required, typically 3 to 5 days. A secondary rise in ICP has been observed 3 to 10 days after injury in 30% of patients with intracranial hypertension87 as a result of the delayed development of intracerebral hematoma or cerebral vasospasm or because of systemic factors such as hypoxia or hypotension. Souter and colleagues associated an increase in the blood leukocyte count with late intracranial hypertension.88
Complications
The two major complications of ICP monitoring are ventriculitis and hemorrhage. Infection may be confined to the skin wound, but ventriculitis occurs in 1% to 10% of patients. Factors that predispose to ventriculitis are intraventricular hemorrhage, SAH, cranial fracture with leakage of CSF, craniotomy, systemic infections, catheter manipulation, leaks, and irrigation. The duration of catheterization has been correlated with an increasing risk for CSF infections during the first 10 days of use. Although prophylactic catheter exchange remains a practice option, the available data suggest that this procedure does not reduce the risk for infection.89 Systemic prophylactic antibiotics are ineffective in reducing the incidence of infections, but antibiotic-impregnated ventriculostomy catheters reduce the risk for CSF infection from 9.4% to 1.3%.90 Systemic prophylactic antibiotics and routine catheter exchange are not recommended in the current TBI guidelines (see Table 334-3—level III recommendation). The best strategies for reducing the risk for ventriculitis associated with ICP monitoring are meticulous aseptic technique during catheter insertion, the use of antibiotic-impregnated catheters, and minimization of the duration of monitoring.
The second major complication of ICP monitoring is intracerebral hemorrhage. Although the risk for hemorrhage has been shown to be consistently low (1% to 2%), it is an important complication to recognize and treat.83 Patients with coagulopathies are at greater risk for the development of this complication. Some evidence suggests that patients with an international normalized ratio of 1.6 or less have a very low risk for hemorrhage if a parenchymal catheter is placed.91
Normal Intracranial Pressure Values
Normally, resting ICP is less than 10 mm Hg. Sustained ICP of greater than 20 mm Hg is clearly abnormal. ICP between 20 and 40 mm Hg is considered moderate intracranial hypertension. ICP greater than 40 mm Hg represents severe, usually life-threatening intracranial hypertension. These thresholds for the severity of intracranial hypertension assume normal BP. When a temporal mass lesion is present, however, herniation can occur at ICP values of less than 20 mm Hg.92
Different authors have recommended treatment of ICP when greater than 15, 20, or 25 mm Hg. No studies have clearly established one of these values as the most appropriate threshold for treatment. Marmarou and coworkers observed an increasingly worse outcome with greater durations of time that ICP was higher than 20 mm Hg.93 Contant and associates observed a worse outcome with greater durations of time that ICP was higher than 25 mm Hg.94 The current TBI guidelines (see Table 334-3) recommend treating ICP above 20 mm Hg (level II recommendation) or using clinical and CT characteristics in addition to the ICP value to determine the need for treatment (level III recommendation).13
Indications for Intracranial Pressure Monitoring
Monitoring of ICP can result in serious complications and is therefore indicated only in patients at significant risk for the development of intracranial hypertension. Indications from the current TBI guidelines are listed in Table 334-3.13,95 ICP should be monitored in all salvageable patients with severe TBI, defined as a GCS score of 3 to 8 after resuscitation and abnormal findings on CT (level II recommendation). ICP monitoring is indicated in patients with severe TBI and normal CT findings if two or more of the following features are present at admission: age older than 40 years, unilateral or bilateral motor posturing, or systolic BP lower than 90 mm Hg (level III recommendation). Patients with a GCS score higher than 8 might be considered for ICP monitoring if they require treatment that would not allow serial neurological examinations, such as prolonged anesthesia for surgery to treat multiple injuries or prolonged pharmacologic paralysis for ventilatory management, or if they require a treatment that might raise ICP, such as positive end-expiratory pressure (PEEP). A severe coagulopathy is the only major contraindication to ICP monitoring.
Monitoring for Secondary Injury Processes: Cerebral Ischemia
Monitors of Cerebral Perfusion
Transcranial Doppler Flow Velocity
Several studies assessing the relationship between peak FV and changes in CBF have suggested that changes in MCA-FV may be used as an indicator of relative changes in blood flow. Kofke and colleagues, investigating the relationship between MCA-FV and CBF assessed by stable xenon–CT during balloon test occlusion of the carotid artery in 31 patients, found a significant correlation in the alteration of flow detected by the two methods.96 More recently, changes in MCA-FV and changes in CBF evaluated by stable xenon–CT in patients with various intracranial pathologies, including 8 with closed head injury, have shown close correlation.97
During arterial spasm, FV increases through the narrowed segment proportional to the reduction in the vessel’s diameter. Severe vasospasm, with a larger than 50% reduction in vessel diameter, is associated with an FV of greater than 200 cm/sec.98 However, an increase in FV may also reflect hyperemia, which is often seen as a posttraumatic event. To differentiate between these two hemodynamic phenomena in the absence of direct CBF measurements, the MCA-to–extracranial internal carotid artery FV ratio, also known as the Lindegaard or hemispheric index, has been measured. In the presence of hyperemia, raised FV in both the extracranial and intracranial vessels does not alter the ratio; however, with vasospasm, FV is high only in the intracranial vessels, which results in a high hemispheric index. The mean hemispheric index in normal individuals is 1.76 ± 0.1, and pathologic values suggestive of vasospasm are generally higher than 3.99
Cerebral Blood Flow
Techniques for Monitoring Cerebral Blood Flow
Recently, newer technologies have made measurement of CBF more feasible in critically ill patients. Measurement of global CBF by the classic Kety-Schmidt technique in which nitrous oxide is used as the diffusible indicator can be performed at the bedside with a minimum of expense and equipment. Measurement of rCBF by stable xenon–CT or perfusion CT is possible and can even be performed in the ICU with a portable CT scanner (examples are shown in Fig. 334-3). However, these measurements of CBF are intermittent and require the patient to be hemodynamically stable during the time required for the measurements. Therefore, transient reductions in CBF or reductions in CBF in an acutely unstable patient are difficult to document with these technologies.
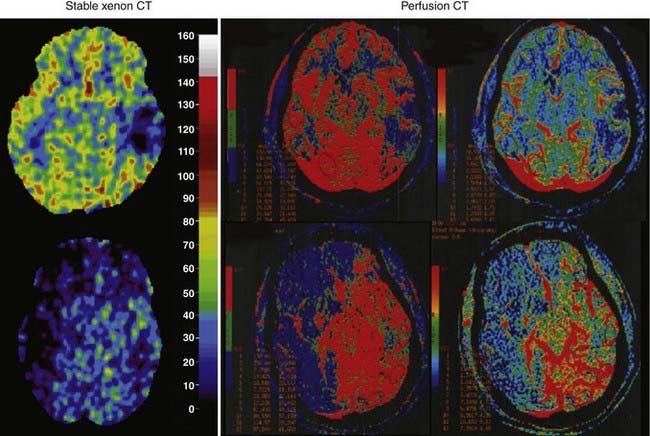
The stable xenon–CT method relies on the radiodensity of xenon and its inertness and rapid diffusion into tissues. An initial non–contrast-enhanced scan helps in choosing the levels for CBF measurement. Baseline scans, usually at four levels, are followed by multiple scans at each of the four levels at 1-minute intervals during the inhalation of 28% to 33% xenon. The baseline pre-xenon scans are subtracted from the subsequent xenon scans to provide quantitative enhancement values in Hounsfield units. Clearance curves proportional to brain and arterial xenon concentrations from an end-tidal analyzer are converted into CT enhancement units. Blood flow is then calculated from the Kety-Schmidt equation for each CT voxel. Studies in normal volunteers have indicated that xenon at a concentration of 30% has an effect on cerebral hemodynamics and causes arterial vasodilation and enhancement of CBF.100,101 This probably occurs as a result of an increase in metabolism and a vasodilatory effect of xenon. Some studies have observed a small increase in ICP averaging 6.9 ± 7.7 mm Hg during CBF measurements with xenon-CT,102 whereas others have not.103
Local Cerebral Blood Flow Sensors for Brain Implantation
Two methods for continuously measuring local CBF are now commercially available, the thermal diffusion method and the laser Doppler method. Both methods are invasive and require the probe to be placed on the surface of the brain at surgery or into the brain through a bur hole. In addition, both methods measure CBF in only a small volume of brain, which may or may not be representative of the whole brain. However, the continuous nature of the measurements gives a dynamic picture of brain perfusion. Although there is extensive documentation of the reliability of these methodologies in the laboratory, experience in the ICU is currently limited.104–107 Nonetheless, especially for patients undergoing a craniotomy, these methods may become practical for monitoring CBF postoperatively.
Thermal diffusion flowmetry (TD-CBF) uses heat transfer as a tracer for the measurement of blood flow. The sensor consists of two gold disks embedded in a 3-mm Silastic leaf or two bands on an intraparenchymal catheter. One disk is heated slightly above brain temperature (to a maximum of 44°C), whereas the other is neutral. The leaf probe is laid on the surface of the brain, and the catheter version can be implanted into the brain parenchyma. The difference in temperature between the two disks is monitored and converted to blood flow in mL/100 g per minute by the monitor and displayed digitally. Carter and Atkinson108 modified a thermal sensor described by Brawley109 and were able to quantitate the flow measured by the thermal sensor. They derived a mathematical formula by comparing TD-CBF with 133Xe-CBF110 and further confirmed its reliability through comparison with hydrogen clearance.111 In TBI patients, the CBF values obtained with the catheter probe have good correlation with those obtained with stable xenon–CT.112
Cerebral Blood Flow Adequacy
Jugular Venous Oxygen Saturation
Initial experiences with fiberoptic oxygen saturation catheters placed in the jugular bulb were unsatisfactory. However, more recently available catheters have been found to have much improved performance.113–115 A number of studies have assessed the role of monitoring jugular venous saturation in patients with severe TBI. In 1995, Robertson and coauthors published the findings from a series of 177 patients with severe TBI and demonstrated that 39% of the patients had at least one episode of desaturation and that good recovery or moderate disability occurred in 44% of the patients with no episodes of desaturation, in 30% of the patients with one episode, and in 15% of the patients with multiple episodes of desaturation.116 Mortality was higher in patients with one episode or multiple episodes of desaturation (37% and 69%) than in those with no episodes (21%).
High SjvO2 values have also been associated with a poor outcome. In 1999, in a series of 450 patients who underwent jugular venous saturation monitoring, Cormio and colleagues reported that high SjvO2 (>75%) occurs with hyperemia or after infarction because nonviable tissue does not extract oxygen.66 In addition, these patients were found to have a worse outcome at 6 months after injury than those with a mean SjvO2 of 56% to 74%.
Side of Catheterization
Early studies suggested that either jugular bulb would provide similar SjvO2 information in most healthy people. However, as early as 1945 it was observed that in patients who have focal lesions, there may be a significant difference in the oxygen saturation values obtained in the right and left jugular bulbs.117 This variability occurs because of the often incomplete mixing of cerebral venous blood before the sagittal sinus divides into the right and left transverse sinuses.
Stocchetti and coworkers compared simultaneous measurements of SjvO2 in the right and left jugular bulbs of 32 patients with severe head injury.118 The average difference in SjvO2 between the right and left jugular bulbs was 5%. Fifteen patients had a maximal right to left difference in SjvO2 of greater than 15%. Three additional patients had differences greater than 10%. Metz and colleagues compared bilateral SjvO2 measurements in 22 patients with severe head injury.119 They found that the greatest success in identifying transient ischemic episodes was achieved if the following strategy was used. When the injury is diffuse, the catheter should be placed on the side of dominant flow. When the injury is focal, the catheter should be placed on the side of the lesion.
These studies are clear that when focal lesions are present, there may be significant differences in the oxygen saturation measured in the left and right jugular bulbs. If the monitoring strategy is to use SjvO2 as a monitor of global oxygenation, cannulating the dominant jugular vein is the most logical because it will be the most representative of the whole brain. However, if the strategy is to identify the most abnormal oxygen saturation, the recommendations of Metz and colleagues should be followed.119
Normal Jugular Venous Oxygen Saturation
Gibbs and coworkers studied 50 healthy young males and observed that their SjvO2 ranged from 55% to 71% (mean of 61.8%).120 More recently, Chieregato and associates measured SjvO2 in 12 subjects undergoing selective bilateral catheterization of the inferior petrosal sinus for the diagnosis of Cushing’s disease and found that even lower values could exist in normal awake subjects.121 That these values for SjvO2 are lower than normal mixed venous oxygen saturation indicates that the brain normally extracts oxygen more completely from arterial blood than do many other organs.
In head-injured patients, the average SjvO2 is higher than normal and the range for SjvO2 is considerably wider than it is in normal subjects. In a series of 116 patients who underwent continuous measurement of SjvO2 for the first 5 to 10 days after a severe head injury, SjvO2 averaged 68.1% ± 9.7% (range, 32% to 96%) in 1329 measurements.62 PjvO2 averaged 37 ± 7 mm Hg (range, 22 to 85 mm Hg).
From studies examining ischemic thresholds, it appears that normal brain metabolism can be altered at SjvO2 values of less than 40% to 50% but that values of less than 20% would be required for irreversible ischemic injury.122–127 The current TBI guidelines (see Table 334-3) recommend treating patients with an SjvO2 of less than 50% (level III recommendation).
Complications
Line sepsis is a complication that is commonly associated with all types of indwelling catheters. Most studies have reported an overall rate of zero to five episodes of infection per 100 catheters.128 Proper sterile technique in placement and maintenance of the jugular bulb catheter should minimize this risk.
ICP can be increased by maneuvers that obstruct venous return from the brain, and it is reasonable to be concerned that a catheter in the jugular vein might raise ICP. However, the 4 or 5 French catheter used for SjvO2 monitoring is quite small relative to the lumen of the internal jugular vein. Stocchetti and coauthors reported that there was a slight increase in ICP “of no clinical significance” during catheter insertion.129
Coplin and colleagues reported that 8 of 20 patients investigated with ultrasonography after jugular bulb catheterization had nonobstructive, subclinical thrombi.130 Symptomatic thrombosis of the internal jugular vein is very uncommon with jugular bulb catheters but could have serious consequences. Depending on normal flow to the thrombosed internal jugular vein, the obstruction could impair venous return from the head and elevate ICP.
Brain Tissue PO2
The major limitation of SjvO2 as a monitor of CBF adequacy is that regional ischemia will not be identified. In circumstances such as brain trauma, where regional differences in CBF may occur, PbtO2 as a monitor of cerebral oxygenation may have an important advantage. Normal values for PbtO2 are 20 to 40 mm Hg, and critical reductions in PbtO2 are 8 to 10 mm Hg. The current TBI guidelines (see Table 334-3) recommend treatment if PbtO2 is lower than 15 mm Hg (level III recommendation). Hoffman and associates found that PbtO2 in patients with ischemia detected by single-photon emission computed tomography averaged 10 ± 5 mm Hg versus 37 ± 12 mm Hg in normal brain.131 Valadka and coworkers found that the likelihood of death after a severe head injury increased with increasing duration of time with a PbtO2 value lower than 15 mm Hg and with any occurrence of a PbtO2 value lower than 6 mm Hg.132 van den Brink and coauthors reported a prospective study of 101 patients and found that PbtO2 values of less than 10 mm Hg that lasted longer than 30 minutes were associated with increased mortality and a worse outcome.133 In 2005, Stiefel and colleagues reported a series of 53 patients with severe TBI treated with ICP and CPP treatments goals and the addition of an oxygen-directed therapy protocol aimed at maintaining PbtO2 greater than 25 mm Hg; they found a significant decrease in mortality (44% to 35%) in those treated with an oxygen-directed therapy.134 In 2008 in a prospective study of 26 children with severe TBI who were managed with continuos PbtO2 monitoring, Figaji and coauthors found a significant association between poor outcome and reduced PbtO2.135
Summary of Monitoring Options for Secondary Cerebral Ischemia
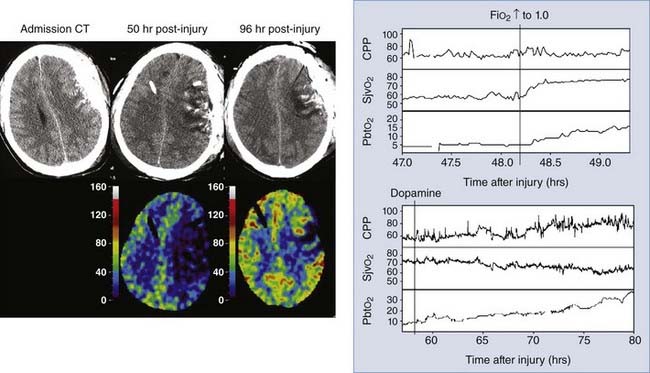
Figure 334-4 illustrates how this strategy might be used to identify and guide the treatment of focal ischemia after a head injury. This patient was initially admitted with a subdural hematoma (Fig. 334-4, left CT scan), which was evacuated promptly on arrival at the hospital. At surgery, a PbtO2 catheter was placed near contused brain underlying the evacuated hematoma. Initially, PbtO2 was normal, but over postinjury hours 36 to 46, PbtO2 gradually decreased to 5 mm Hg with no changes in any other physiologic parameters. Note that SjvO2, which is a measure of global oxygenation, remains low-normal (≈55%) despite the very low PbtO2 and that CPP was 65 to 70 mm Hg. Administering 100% oxygen raised PbtO2 to 15 mm Hg (Fig. 334-4, top graph). A CT scan (Fig. 334-4, middle scan) showed increased swelling around the contusion, and stable xenon–CT showed a large area with rCBF values of less than 10 mL/100 g per minute at the contusion site. Dopamine was started and phenylephrine added later to increase blood pressure. As CPP increased with this treatment, PbtO2 returned to normal (Fig. 334-4, bottom graph), and a repeated stable xenon–CT scan (Fig. 334-4, right scan) showed significant improvement in CBF.
Monitoring for Secondary Ischemic Insults
Monitoring for Cerebral Causes of Secondary Ischemic Insults
Intracranial Hypertension
Intracranial hypertension was the most common cause of jugular venous desaturation in a prospective study of 116 patients with severe head injury; it accounted for 44% of the total number of episodes.62 As discussed earlier, ICP should be monitored, preferably by ventriculostomy.
Seizures
Seizures can dramatically increase CMRO2 and CMRGlc. In rats in which seizures were induced by bicuculline, CMRO2 was increased by 150% to 250%.74 If CBF is marginal or uncoupled from the cerebral metabolic rate, ischemia can occur during the seizure.
The overall risk for seizures after TBI ranges from 2.5% to 5% with all types of injury, but it is 7% to 39% with cortical injury and neurological sequelae.136 Because patients are often sedated and pharmacologically paralyzed for treatment of intracranial hypertension, seizure activity may be subclinical. For this reason, continuous monitoring with electroencephalography (EEG) is useful for this high-risk group of patients.137
Seizures are not a common cause of jugular venous desaturation and can significantly reduce SjvO2 if CBF is unable to meet the increased cerebral metabolic requirements. Increases in extracellular glutamate have also been reported during posttraumatic seizures.138
Monitoring for Systemic Causes of Secondary Insults
Hypotension
Autoregulation is the ability of the brain to maintain normal CBF over a wide range of BP values, normally from a mean BP of 50 to 150 mm Hg. After TBI, the cerebral vasculature can lose the ability to autoregulate completely and CBF rises and falls with BP, or the lower limit of autoregulation, which is normally 50 mm Hg, can be shifted to a higher pressure. The consequence is that low BP values that are normally tolerated without sequelae can result in cerebral ischemia after TBI. Lewelt and colleagues showed in a fluid percussion injury model that autoregulation was severely impaired after both low-level and high-level injuries.139 Normally in the cat, CBF is constant until CPP falls below 60 mm Hg. After a fluid percussion injury, CBF decreased proportionally to a CPP below 80 mm Hg. Chan and coauthors described similar findings in patients with head injury, with MCA-FV measured by TCD and SjvO2 decreasing as CPP was reduced below approximately 70 mm Hg.140
Hypotension is common in head-injured patients on admission to the hospital. The TCDB study of 717 patients reported that 35% had a systolic BP lower than 90 mm Hg on arrival in the emergency department.8 Hypotension on admission increased the mortality rate by 150%. Miller and Becker found in a group of 225 patients that the presence of a systolic BP lower than 95 on arrival in the emergency department was associated with a twofold increase in mortality rate.141
Hypotension is also common during hospitalization and is associated with a worse outcome. In another TCDB study, 29% had a systolic BP lower than 90 mm Hg during their ICU stay.142 Hypotension during the hospitalization was associated with a significantly worse outcome. In a prospective study in which SjvO2 was monitored in 116 patients, hypotension was the third most common cause of jugular venous desaturation and accounted for 10% of the episodes.142 Marmarou and associates analyzed 428 patients who had hourly recordings of ICP, MAP, and CPP and reported that the proportion of time that MAP was lower than 80 mm Hg was significantly related to a poor neurological outcome.93 Pietropaoli and colleagues observed in a study of 53 patients who underwent early surgery for traumatic intracranial hematomas that intraoperative hypotension (systolic BP <90 mm Hg) was associated with a mortality rate of 82% as opposed to 25% in patients without hypotension.143
Hypocapnia
Induced hyperventilation constricts cerebral blood vessels and thereby reduces global CBF and cerebral blood volume. The effect of changes in PaCO2 on cerebral vessels is mediated by the change in pH induced in extracellular fluid.144 CO2 reactivity is preserved in most patients with severe head injury,145 and therefore hyperventilation can rapidly lower ICP through the reduction in cerebral blood volume. The effects of hyperventilation on ICP are immediate, but the duration of the effect is brief because the pH of the brain, at least in normal individuals, soon equilibrates to the lower PaCO2 level. Hyperventilation will clearly reduce ICP, but this potentially beneficial effect is attained at the expense of cerebral perfusion. Whether hyperventilation can actually result in cerebral ischemia in head-injured patients is controversial. However, several studies suggest that excessive hyperventilation after severe head injury can be a secondary ischemic insult. In a prospective study in which SjvO2 was monitored in 116 patients with severe head injury, hypocapnia was the second most common cause of jugular venous desaturation and accounted for 36% of the episodes.62
If areas of the brain that are marginally perfused have impaired CO2 reactivity, hyperventilation might constrict the normal areas of the brain and actually improve perfusion to the previously marginally perfused areas. This has been termed the inverse steal response.146 Cold conducted 45 paired studies of rCBF before and after hyperventilation during days 1 to 3 after injury in 27 comatose patients and did not find this phenomenon.147,148 When PCO2 was reduced from 36 to 26 mm Hg, the frequency of regions with oligemia, defined as rCBF less than 20 mL/100 g per minute, increased from 5% to 16%. Similarly, the frequency of severe oligemia (rCBF <15 mL/100 g per minute) was found to be increased from 0.1% to 0.3% of all regions. A low hemispheric CBF before hyperventilation predisposed to this increased frequency. Stringer and colleagues measured rCBF with xenon-CT before and after hyperventilation in 12 patients with acute brain lesions.149 In 5 of the patients, hyperventilation induced ischemic levels of rCBF in apparently normal regions of the brain. Five of the patients had ischemic areas that demonstrated the inverse steal response (i.e., increases in rCBF with hyperventilation).
End-tidal CO2 is a convenient way to continuously estimate arterial PCO2. In head-injured patients without pulmonary disease, end-tidal CO2 correlates well with arterial PCO2.150 With pulmonary insufficiency, there may be large gradients between end-tidal CO2 and arterial PCO2, and arterial blood gases should be monitored instead. In the absence of intracranial hypertension, the goal should be to maintain a normal arterial PCO2 by carefully avoiding both hypocapnia and hypercapnia.
Hypoxia
Normally, a decrease in arterial PO2 is compensated for by increases in CBF and does not result in a decrease in overall cerebral oxygen delivery, unless the hypoxia is very severe. At an inspired oxygen fraction (FIO2) of 0.10 (corresponding to a PO2 of 40 mm Hg), CBF in normal adults is increased by 35%.151 At an FIO2 of 0.09 (PO2 of 35 mm Hg), CBF is increased by 70%.152 The increase in cerebral blood volume that results from the cerebral vasodilation can markedly increase ICP, especially if intracranial compliance is decreased.153 Nevertheless, the increase in CBF prevents cerebral ischemia from occurring.
Lewelt and associates showed that TBI impairs this normal CBF response to hypoxia.154 In a fluid percussion head injury model in cats, a 1- to 2-atm impact resulted in a mild impairment in the cerebral vasodilator response to hypoxia. After an impact greater than 2 atm, the cerebral vasodilator response to hypoxia was severely impaired; some animals had decreases in CBF in response to hypoxia. It is likely that this is one of the mechanisms whereby hypoxia increases the severity of traumatic injuries.
Pulmonary complications that can result in hypoxia are common after severe head injury. On arrival in the emergency department, hypoxia can be due to hypoventilation, obstruction of the airway, aspiration, or hemothorax or pneumothorax. Hypoxia that persists after the initial resuscitation or develops within the first 24 to 48 hours after injury can be due to a lung contusion, atelectasis, fat emboli, pneumonia, or adult respiratory distress syndrome. Piek and coauthors reported that in the TCDB studies, pneumonia developed as a complication during hospitalization in 41% and pulmonary insufficiency occurred in 28%.142
Several studies have investigated the effects of the presence of hypoxia on admission to the hospital as a secondary insult after TBI. In a prospective study in which SjvO2 was monitored in 116 patients,62 hypoxia was the fourth most common cause of jugular desaturation and accounted for 8% of the episodes. In a study of 225 patients, hypoxia, which was present in 35%, increased the mortality rate from 24% to 50%.141 Hypercapnia, present in 8% of the patients, increased the mortality rate to 67%. In another study, there was a 20% increase in the number of patients left vegetative or dead when the initial PO2 was lower than 60 mm Hg or the patient was apneic.155 In the TCDB studies, the occurrence of hypoxia on admission significantly increased the mortality rate from 27% to 50% relative to patients without hypoxia. The association remained significant when adjusted for age, diagnosis, GCS score, pupillary reactivity, and the presence of other causes of secondary injury, but it had less effect on outcome than the occurrence of systemic hypotension.8
Pulmonary complications during the hospital course have also been associated with worsening of neurological outcome. In the TCDB studies, the occurrence of pneumonia during hospitalization was significantly associated with an unfavorable outcome.142
Anemia
The cerebrovascular effects of anemia have been studied extensively in normal experimental animals and normal humans. Until the decrease in CaO2 is extreme, the primary mechanism of compensation for the decrease in CaO2 is an increase in CBF.156 In healthy humans, normovolemic hemodilution sufficient to decrease the hematocrit by 26% resulted in a 19% increase in CBF.157 As a consequence of the compensatory increase in CBF, SjvO2 stays relatively constant with a normovolemic reduction in hemoglobin concentration. Only when the increase in CBF is no longer able to compensate for the reduction in CaO2 does SjvO2 decrease.
After head injury, however, the cerebral vasculature may not be capable of dilating in response to the drop in CaO2, and ischemia may occur. DeWitt and associates compared the effects on CBF of an acute hemorrhage of 30% of total blood volume followed by resuscitation with blood or hetastarch (hydroxyethyl starch) in normal cats and in cats with a moderate fluid percussion injury.158 The animals with a head injury had significantly lower BP, CBF, and cerebral oxygen delivery than did the uninjured animals. Additionally, after head injury the increase in CBF that results from anemia can increase ICP.
Fever
Fever increases the body’s metabolic rate by approximately 10% to 13% per °C. The effect of fever on CMRO2 has been studied in neonatal pigs.70 Increasing temperature from 38°C to 42°C increased CBF by 97% and CMRO2 by 65%. In experimental studies, moderate hyperthermia (39°C) results in more severe brain damage after fluid percussion injury,159 and moderate hypothermia is protective.160–162 Jones and colleagues found a significant relationship between fever and a poor neurological outcome.69 Methods for reducing temperature include external cooling, intravascular cooling devices, and antipyretics.
Measurement of rectal temperature alone may significantly underestimate actual brain tissue temperature. In a study of seven neurosurgical patients, the temperatures of the lateral ventricle, epidural space, tympanic membrane, and rectum were measured.163 More recently, intracranial temperature has been recorded in neurosurgical patients with a temperature probe that is incorporated into a standard ventriculostomy ICP monitor or with a separate temperature probe.164–167 In these studies, intracranial temperature was 0.5°C to 2.0°C higher than body temperature.
Neurological Intensive Care Management
Approaches to the Management of Traumatic Brain Injury
One approach, called CPP management, has been advocated by Rosner and colleagues.168 This approach is based on a concept called the “vasodilatory cascade.” According to this hypothesis, a reduction in CPP, either a decrease in BP or an increase in ICP (or both), stimulates the cerebral vessels to dilate in an attempt to maintain CBF. This is the normal autoregulatory response to a decrease in CPP. Because the increase in cerebral blood volume that accompanies the vasodilation further reduces CPP, this sets up a cycle that leads to ever reducing CPP. An increase in BP will break the cycle and reduce ICP. A detailed description of this approach has been presented in a report of a clinical series by Rosner and associates.168 In this series of 158 patients admitted with GCS scores of less than 7, mortality was only 29%, and 59% achieved a good recovery or moderate disability by 6 months after injury.
A more recent randomized clinical trial evaluated a treatment strategy similar but not identical to the “CPP management” approach.169 This trial compared a “CBF-targeted” strategy with a conventional “ICP-targeted” strategy in the initial management of acute TBI. The CBF-targeted treatment, in which CPP was kept at a value of at least 70 mm Hg and hyperventilation was not used, reduced the incidence of secondary ischemic events by approximately 50%. However, this treatment strategy also increased the incidence of adult respiratory distress syndrome fivefold and did not improve long-term neurological outcome. One interpretation of this study is that the beneficial effect of the CBF-targeted treatment was offset by systemic complications associated with maintaining BP at an elevated level.
Another approach, called the “Lund therapy,” emphasizes a reduction in microvascular pressure to minimize edema formation in the brain. The goals of this approach are to preserve a normal colloid osmotic pressure (infusion of albumin and red blood cells), reduce capillary hydrostatic pressure by reducing systemic BP (metoprolol and clonidine), and reduce cerebral blood volume by vasoconstricting precapillary resistance vessels (low-dose thiopental and dihydroergotamine). Treatments that would favor increasing transcapillary filtration of fluid are avoided, including CSF drainage, high-dose (to burst suppression) barbiturates, osmotic diuretics, and high CPP. Decompressive craniectomy, which can also increase edema formation, is reserved for last resort after all other treatments have failed. A detailed description of this approach is provided in two recent publications.170,171
General Measures to Minimize Intracranial Hypertension/Improve Cerebral Perfusion
Minimize Venous Outflow Resistance: Head Elevation, Head Position
Elevation of the head of the bed while keeping the head in a neutral position to minimize compression of venous return from the brain has been standard neurosurgery practice for the management of ICP in the past. However, the ideal head position for a patient with head injury has been disputed in recent years. Rosner and Coley advocated keeping the patient’s head flat as part of an overall treatment program intended to maximize CPP.172,173 Other studies have shown a reduction in ICP without a reduction in either CPP or CBF in most patients with elevation of the head to 30 degrees.174–176 In 22 patients with severe head injury, elevation of the head to 30 degrees reduced ICP and BP without changing CPP or CBF in most patients.175 Meixensberger and coworkers observed that elevation of the head to 30 degrees reduced ICP and increased CPP but did not change PbtO2.176 Therefore, unless the patient is hypovolemic and head elevation results in hypotension, the reduction in ICP afforded by 30 degrees of head elevation is probably advantageous. If head elevation is used, it is important to remember that both the ICP and BP transducers should be zeroed at the same level (i.e., at the level of the foramen of Monro).172
In multiple trauma patients in whom abdominal injury may also be present, increased intra-abdominal pressure may also impede venous return from the brain, decrease BP, and increase ICP. Experimental and clinical studies suggest that abdominal decompression can significantly improve control of ICP when abdominal compartment syndrome is present.177,178
Sedation/Analgesia
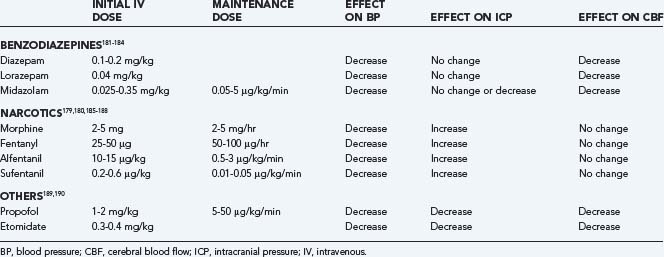
Sedative/analgesic drugs blunt the effect that the routine nursing care of patients has on ICP. In general, the benzodiazepines cause a coupled reduction in CMRO2 and CBF, with no effect on ICP, whereas the narcotics have no effect on CMRO2 or CBF but have been reported to increase ICP in some patients.179,180 A combination of morphine and lorazepam is a frequently used regimen that is well tolerated and provides good sedation/analgesia.
In choosing a sedative agent for a head-injured patient, it is important to remember to avoid drugs with hypotensive side effects (Table 334-4).179–190 Hypovolemia predisposes to the hypotensive side effects of sedatives and should be remedied before administering sedative agents. Propofol has the advantage of a short half-life, which allows intermittent neurological examination, but it is a potent systemic vasodilator and can cause hypotension that exceeds the reduction in ICP, so CPP can be significantly reduced.191 Propofol infusion syndrome can result as a consequence of the use of high doses of propofol. Some clinical features are hyperkalemia, hepatomegaly, lipemia, metabolic acidosis, myocardial failure, rhabdomyolysis, and renal failure. Extreme caution must be taken when using doses greater than 5 mg/kg per hour or when use of any dose exceeds 48 hours in critically ill adults.192
Dexmedetomidine is an α2-agonist that provides adequate sedation without altering the respiratory drive while facilitating frequent neurological examinations. The dosage range for a loading infusion is 0.1 µg/kg infused over a 10-minute period, followed by a 0.2- to 0.7-µg/kg/hr continuous infusion for 24 hours. It is a safe and effective sedative agent in neurosurgical patients, although a loading infusion should be avoided and higher maintenance doses may be required to ensure adequate sedation.193
Treatment of Systemic Hypertension
Systemic hypertension associated with head injury is common and is characterized by an increase in systolic BP that is greater than the increase in diastolic pressure. It is associated with a hyperdynamic state, including tachycardia and increased cardiac output. Systemic hypertension is associated with sympathetic hyperactivity.194 It is unwise to reduce systemic BP in patients with hypertension associated with untreated intracranial mass lesions because cerebral perfusion is being maintained by the higher BP. Treatment of systemic hypertension (systolic BP >160 mm Hg) during the postoperative course after a head injury is recommended by many neurosurgeons. Because autoregulation is frequently impaired after severe head injury, systemic hypertension may increase CBF and ICP195 and exacerbate cerebral edema.196 However, this issue is controversial, and others have emphasized the importance of maintaining CPP, even at the expense of higher ICP.173,197
If hypertension is treated in a head-injured patient, the choice of antihypertensives is important. Frequently, systemic hypertension will resolve with sedation. If antihypertensive drugs are required, vasodilating antihypertensive drugs, including hydralazine, nicardipine, and nitroprusside, consistently increase ICP.198,199 Sympathomimetic-blocking antihypertensive drugs, such as β-blocking agents200,201 (propranolol, esmolol, or labetalol), or centrally acting α-receptor agonists (clonidine or α-methyldopa) are preferred because they reduce BP without affecting ICP.194 Agents with a short half-life have an advantage when BP is labile. Nicardipine has been studied or recommended for the management of hypertension in many neurovascular settings, including TBI. Nicardipine meets the criteria as a short-acting continuous-infusion agent with a reliable dose-response relationship and favorable safety profile. In a controlled, double-blinded, randomized pilot clinical trial, nicardipine was shown to reverse and prevent vasospasm based on Doppler FV in patients with moderate and severe TBI.202
Airway Protection/Controlled Ventilation
TBI patients in coma often cannot protect their airway and should be intubated initially to prevent aspiration and airway obstruction.203 Respiratory dysfunction, reported by clinical observation and measured by abnormal blood gas values, is also common after head injury. Mechanical ventilation is usually needed in the acute recovery period to allow deeper levels of sedation to be used and to reduce the risk that periodic hypoventilation will exacerbate the intracranial hypertension.
In a series of 225 patients with severe head injury, hypoxia (PO2 <60 mm Hg) was seen on admission to the hospital in 35% of the patients, and hypercapnia was present in 8%.141 Kohi and colleagues found that 36% of 67 comatose head-injured patients had either hypoxia (PO2 <65 mm Hg) or severe respiratory dysfunction requiring mechanical ventilation on admission.204 In another study, 9% of 363 patients admitted while in coma from head injury were hypoxic (cyanotic or PO2 <60 mm Hg) on admission.205 In the TCDB studies, hypoxia was present in 19% of the comatose head-injured patients at arrival in the emergency department.8 Pneumonia developed as a complication during hospitalization in 41% and pulmonary insufficiency occurred in 28%.142
After experimental impact and missile head injury, an increasing duration of apnea has been observed with increasing severity of the brain injury.206,207 Immediate deaths in these models are generally caused by apnea. There is little information on apnea after human head injury, probably because the actual impact is typically not observed. Apnea at the scene of the accident, 3 and 12 minutes in duration, was reported in 2 patients who eventually recovered well with the early institution of cardiopulmonary resuscitation and artificial ventilation.208 Pfenninger and associates measured arterial blood gases before resuscitation at the scene of the accident (6 to 21 minutes after injury) in 33 patients with head injury.209 An elevation in PCO2 suggesting apnea or hypoventilation was strongly correlated with the severity of the injury in these patients. These studies suggest that apnea probably occurs in human head injury similar to that observed in experimental models.
North and Jennett examined breathing patterns in 227 spontaneously breathing patients with neurosurgical diagnoses, most commonly trauma.210 Sixty percent of the patients had some type of breathing abnormality, including periodic respirations, tachypnea, and irregular breathing. All 12 patients with medullary lesions had abnormal breathing patterns, 8 of whom had irregular breathing. In contrast, periodic breathing was not correlated with any particular anatomic site of the neurological injury.
Treatment of these ventilatory abnormalities during the acute phase after injury is by controlled ventilation to prevent inducing rapid changes in PCO2. Sedation and occasionally paralysis may be necessary to control ventilation. Hypoxia and hypercapnia can dramatically raise ICP. Patients with severe head injury can have periodic episodes of hypoventilation that precipitate episodes of intracranial hypertension. Controlled ventilation helps prevent these episodes of hypoventilation and intracranial hypertension. Early tracheostomy in trauma patients who remain ventilator dependent has been shown to reduce length of stay in the ICU.211,212
Treatment of Fever
Fever is common during recovery from a head injury. In experimental studies, postinjury fever worsens the outcome after fluid percussion injury.159 Fever is a potent cerebral vasodilator and can raise ICP. In addition, fever can raise cerebral metabolic requirements. Elevated rectal temperatures should be treated with antipyretics, cooling blankets, or both. Infectious causes of fever should be investigated with appropriate cultures and treated with antibiotics.
Prevention of Seizures
The risk for posttraumatic seizure is approximately 15% with severe head injury.213 The risk for seizures is related to the severity of the injury. In a study of 4541 patients with head injury, the standardized incidence ratio for the development of seizures was 1.5 after mild injuries but with no increase over the expected number after 5 years, 2.9 after moderate injuries, and 17.0 after severe injuries. In multivariate analysis, significant risk factors for later seizures were brain contusion with subdural hematoma, skull fracture, loss of consciousness or amnesia for longer than 1 day, and age 65 years or older.214
The use of anticonvulsants to prevent seizures is controversial. Although seizures can dramatically increase the cerebral metabolic rate, there is not a clear relationship between the occurrence of early seizures and a worse neurological outcome.215 Young and coworkers found no difference in the incidence of seizures with prophylactically administered phenytoin.216 Tempkin and coauthors reported the results from a double-blind study in which 404 severely head-injured patients randomly received phenytoin or placebo for 1 year.217 Phenytoin reduced the incidence of seizures during the first week but not thereafter. Therefore, it is reasonable to give all severely head-injured patients in the emergency department phenytoin, 15 mg/kg intravenously at a rate that does not exceed 25 mg/min, followed by a daily maintenance dose adjusted to keep plasma levels in the therapeutic range. If no early seizures occur, the phenytoin is tapered and discontinued after 1 week.
Levetiracetam, which is now available in parenteral form, may be an alternative to phenytoin for seizure prophylaxis. Levetiracetam has the advantages that it does not require serum monitoring or have significant pharmacokinetic interactions. In a recently published case series of 32 patients with severe TBI, it was found that levetiracetam was as effective as phenytoin in preventing early posttraumatic seizures but was associated with an increased tendency for seizure activity on EEG analysis.218
Other General Measures
Prevention of Ventilator-Associated Pneumonia
TBI patients have a high incidence of pneumonia, 40% in some series, and this complication is often associated with aspiration, which may occur even before receiving medical attention. Because of the high incidence, the possibility of aspiration should be considered in every comatose TBI patient. In prehospital series, clinical assessment of the presence of aspiration by the paramedic is usually reliable, and it most commonly occurs before their arrival at the scene.219 Therefore, rapid-sequence intubation in the field does not prevent the occurrence of aspiration, although it may reduce the incidence. Once in the emergency department, CT scanning of the thorax may be a more sensitive method than routine chest radiography for identifying aspiration. The subsequent occurrence of pneumonia does not alter mortality in TBI patients, but it does significantly extend the need for ventilation and prolong the ICU stay.220 Studies of antibiotic prophylaxis for ventilated TBI patients, either cefuroxime, 1500 mg intravenously for two doses after intubation, or ampicillin-sulbactam, 3 g every 6 hours for 3 days, have demonstrated significant reductions in the incidence of subsequent pneumonia.221,222
Beyond antibiotic prophylaxis, the most effective way of minimizing the risk for ventilator-associated pneumonia is to avoid or limit the duration of intubation and mechanical ventilation. In many clinical conditions, noninvasive ventilation can effectively provide the ventilatory support needed and is associated with a lower risk for pneumonia. For a patient with severe TBI, this is not usually an alternative because the major indication for intubation is to protect the airway. However, some strategies to reduce the duration of ventilation and intubation should be applied even in this population. Daily interruption or lightening of sedation to evaluate readiness to wean from ventilatory support can be readily timed to occur with the daily neurological examination. Decisions about whether a patient is ready to be weaned from ventilatory support can then be based on both neurological and pulmonary status. Daily spontaneous breathing trials, which have been successful in other patient populations in shortening the duration of ventilation, have not been shown to do so in neurosurgical patients.223 The decision about whether patients can protect their airway is more likely to determine the timing of extubation.
Other general recommendations to minimize the risk for ventilator-associated pneumonia include the use of oral rather than nasal intubation, continuous aspiration of subglottic secretions, maintenance of endotracheal tube cuff pressure at values of at least 20 cm H2O, remaining in a semirecumbent position (30 to 45 degrees), emptying condensate from the ventilator tubing, and not allowing condensate to contaminate the endotracheal tube.224
Prophylaxis for Thromboembolism
Venous thromboembolism is a common complication after major trauma, with an observed incidence as high as 58% if prophylaxis is not used.225 Within the general trauma population, risk factors for thromboembolism include spinal cord injury; pelvic, femoral, or tibial fracture; surgery; blood transfusion; and older age,225 as well as major head injury in some studies,.226
Both venous compression devices and low-dose heparin are effective in reducing the risk for thromboembolism and subsequent pulmonary embolism. Dennis and colleagues found a reduction in the incidence of thromboembolism from 8.98% to 2.9% with prophylactic treatment.227 Both low-dose heparin and sequential venous compression prophylaxis were equally effective in this study. Because TBI may be a relative contraindication to anticoagulation, sequential compression devices are preferred by many,228 and this is the class II recommendation in the third edition of the head injury guidelines.229 Other guidelines recommend low-molecular-weight heparin prophylaxis as soon as it is safe230; however, there is little convincing information available regarding when prophylactic heparin would be safe in a patient with traumatic intracranial hemorrhage. The finding of stable hemorrhage on CT scans separated by 12 to 24 hours has been suggested to indicate that low-molecular-weight heparin could be started safely.231
The use of prophylactic vena cava filters in high-risk trauma patients also remains controversial. Evidence that vena cava filters actually prevent pulmonary emboli is lacking, and this type of prophylaxis probably has long-term consequences that are not justified by the small increase in protection provided against pulmonary embolism.230 The recent introduction of retrievable vena cava filters has made this option for prophylaxis popular in some trauma centers, although most authorities do not recommend these filters as routine practice for prophylaxis.230
Prophylaxis for Gastric Ulcers
Stress ulcers are a common complication in critically ill patients. Endoscopic evidence of mucosal damage can appear within 24 hours of a severe brain injury, and 17% of these early erosions can progress to clinically significant hemorrhage.232 The major risk factor for the development of gastric bleeding is the severity of the brain lesion.232 Other common risk factors in trauma patients include burns involving greater than 25% of body surface area, respiratory failure, hypotension, sepsis, jaundice, peritonitis, coagulopathy, and hepatic failure.233
The mechanism of stress ulceration is not completely understood, but increased gastric acidity plays a major role. Studies have suggested that intracranial injury, particularly that involving the diencephalon and brainstem, results in increased production of gastrin and gastric acid.234 In a study of high-risk postoperative neurosurgical patients, the major risk factors were a gastric pH lower than 4 and a high daily volume of gastric output.235
Prevention of stress ulceration has traditionally been directed at neutralization of gastric acid or reduction of gastric acid production with H2 blockers. Both methods have been shown to be effective in reducing the incidence of gastric bleeding, but administration of antacids, which is most effective if titrated to stomach pH, is more time-consuming.235,236 H2 blockers, however, can have central nervous system effects that may be troublesome in neurosurgical patients.
One potential side effect common to both these preventive strategies is an increase in the risk for nosocomial pneumonia, probably as a result of aspiration of colonized gastric secretions. When gastric pH is lower than 4, bacterial colonization of the stomach occurs. This may result in an increase in the incidence of nosocomial pneumonia, although the data are conflicting. Sucralfate, which is a complex of sucrose, sulfates, and aluminum hydroxide, is an alternative that achieves its protective effects by mechanisms other than a decrease in gastric acidity. Sucralfate strengthens the gastric mucosa and increases mucosal blood flow, and it has been demonstrated to be at least as effective as antacids in preventing clinical gastric bleeding.236
In a retrospective cohort study conducted by Ecker and colleagues, the use of H2 blockers in neurosurgical patients was associated with an increased incidence of thrombocytopenia.237 Therefore, the use of proton pump inhibitors or sucralfate may be a better choice for gastrointestinal prophylaxis in neurosurgical patients.
Prophylactic Antibiotics to Prevent Meningitis
In a study of posttraumatic bacterial meningitis, the incidence of meningitis was found to be 18% and 9% when associated with otorrhea and rhinorrhea, respectively, versus 0.38% in the absence of a CSF leak.238 Tenney found a higher risk for infection with rhinorrhea than with otorrhea.239 The organisms causing posttraumatic meningitis are evenly divided between gram-positive and gram-negative bacteria.240 The efficacy of prophylactic antibiotics in patients with traumatic CSF fistula is controversial. Antibiotics are recommended only when symptoms or signs of meningitis develop.
Nutritional Support
Patient with severe head injury are hypermetabolic and catabolic, similar to patients with multiple trauma.241 In a large retrospective study of hospitalized TBI patients, those who were not fed within 5 and 7 days after TBI had a twofold and fourfold increased likelihood of death, respectively. The amount of nutrition in the first 5 days was related to death; every 10-kcal/kg decrease in caloric intake was associated with a 30% to 40% increase in mortality rates adjusted for injury severity.242
A number of studies have measured protein and caloric requirements in head-injured patients.243 In these studies, caloric expenditure after TBI averaged 140% of normal resting energy expenditure (REE) based on age, gender, and body size. REE can be calculated from the Harris-Benedict equation:


These projected losses should be replaced, preferably with enteral feedings, beginning as soon after injury as possible, but certainly within 72 hours. The goal should be to gradually increase feedings and be at full caloric replacement by the end of the first week after injury (see Table 334-3—level II recommendation in the TBI guidelines). As the rate of enteral feedings is increased, maintenance fluids should be decreased to maintain balance between total fluid input and output.
Enteral feedings are preferable to parenteral feedings because gut integrity is better maintained and this may reduce the risk for sepsis.244,245 If gastric emptying is impaired, feeding via jejunal tube is usually successful.246,247 In the more chronic phase, percutaneous gastrostomy is a safe and effective method of establishing a permanent route for enteral feeding and is less costly than open gastrostomy.248 Even pentobarbital coma, used to lower ICP, does not completely preclude the enteral route of feeding.249
Management of Fluid/Electrolytes
Electrolyte abnormalities occur commonly in patients with head injury, at least once in the course of 59% of the patients in the TCDB.142 Abnormalities in sodium, both hyponatremia and hypernatremia, are among the most common. Hyperglycemia is also common and is part of the stress response to injury. Meticulous attention should be paid to fluid administration and fluid balance.
Hyponatremia Syndromes
The differential diagnosis of hyponatremia in a head trauma patient is usually reduced to two entities, the syndrome of inappropriate antidiuretic hormone secretion (SIADH) and cerebral salt wasting (Fig. 334-5). The diagnosis of SIADH requires the following: (1) hyponatremia (serum sodium <135 mEq/L), (2) hypo-osmolarity (serum osmolarity <280 mOsm/L), (3) urine osmolarity greater than serum osmolarity, and (4) inappropriately high urine sodium concentration (>40 mEq/L). Patients with SIADH are normovolemic or slightly volume expanded. In contrast, patients with salt-wasting syndrome are hypovolemic. Cerebral salt wasting also results in high urine sodium levels (>40 mEq/L). Volume status is the critical clinical distinction between the two syndromes. SIADH is caused by enhanced secretion of ADH, whereas cerebral salt wasting is due to elevated levels of circulating natriuretic factors, possibly including atrial natriuretic factor.
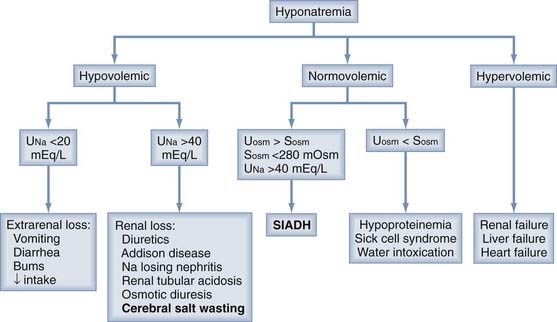
For salt-wasting syndrome, replacement of intravascular volume with normal saline is the initial treatment. One continues to replace sodium deficits with normal or hypertonic saline. Sodium losses in urine may be replaced in the more chronic phase with enterally administered salt tablets.250
Hyperglycemia
Hyperglycemia has been associated with poor neurological outcome after TBI.251,252 Part of this association is due to the fact that hyperglycemia is a feature of the stress response to injury and hyperglycemia simply reflects the occurrence of a more severe injury. However, experimental studies have shown that hyperglycemia can worsen the outcome after a traumatic injury, especially when a secondary insult occurs.253,254 Therefore, part of the association may be due to hyperglycemia exacerbating the secondary injury processes.
In critically ill surgical patients, tight control of blood glucose between 80 and 110 mg/dL has been shown to reduce morbidity and mortality rates in some studies.255 This benefit, seen in patients in the ICU for 5 or more days, included a reduction in infections, acute renal failure, and the need for transfusion. In the subgroup of patients with isolated TBI, intensive insulin therapy decreased ICP and reduced the need for pressors to achieve adequate CPP.255,256 A lower frequency of seizures and a trend for less DI were also observed. This central nervous system protection seems to be directed toward the neural cells. Several potential mechanisms could be involved, including prevention of glucose toxicity and direct effects of insulin independent of glycemic control.256
However, in another randomized trial, 504 critically ill patients in a mixed medical/surgical ICU were randomly assigned to receive either intensive insulin therapy to maintain glucose levels between 50 and 110 mg/dL or standard insulin therapy to maintain glucose between 180 and 200 mg/dL. The strict glucose control group did not have a reduced mortality rate or risk for infections, but they did have a significant increase in the incidence of hypoglycemia.257 Additional studies are needed to confirm the risk-to-benefit ratio for strict glucose control in patients with TBI.
Hypopituitarism
The fact that the pituitary-hypothalamic axis can be damaged after trauma is obvious, but the functional consequences of this injury are a commonly overlooked area in the critical care management of TBI patients. Structural changes in the sella region of the brain are more common in patients in whom hypopituitarism develops after injury. In a study of 22 TBI patients, abnormalities in the sella region were identified in 80% of those with hypopituitarism versus only 29% of those without hypopituitarism. The most common abnormality observed by imaging was loss of volume or an empty sella.258 In patients who died of their injury, autopsy examination of the pituitary gland found infarction of varying size in 43% of the patients who survived at least 3 hours after their injury.259
MRI is the preferred technique to image the pituitary gland. Its spatial resolution and contrast resolution allow identification of abnormalities, and its rapid temporal resolution allows indirect assessment of its blood supply with dynamic imaging. There is a direct relationship between hyperintensity of the neurohypophysis and the functional status of the hypothalamic-hypophysial axis.260 The most common pathologic findings are hemorrhage of the hypothalamus (29%), hemorrhage of the posterior lobe (26.3%), and infarction of the anterior pituitary lobe (25%) Other findings include stalk transection and infarction of the posterior lobe. In up to 7% of patients with posttraumatic hypopituitarism, CT or MRI (or both) failed to reveal any abnormalities. Therefore, the absence of abnormalities on neuroimaging does not exclude hypopituitarism.261
Hypopituitarism after TBI can involve one or more pituitary axes, and in general it tends to improve over time (56% incidence at 3 months and 36% at 12 months), although a substantial proportion of patients may still have abnormalities.262 The pituitary axis most commonly involved at 3 months after injury is the gonadotropic (32%), followed by the corticotropic (19%), somatotropic (9%), and thyrotropic (8%).
Adrenal insufficiency is the most important dysfunction to recognize in the acute recovery period because the clinical signs can include hypotension, hypoglycemia, and hyponatremia. Hypoadrenalism can be primary (caused by adrenal gland failure) or secondary (caused by pituitary or hypothalamic failure). In a study of 80 patients with moderate or severe TBI, 53% had at least transient adrenal insufficiency.263 The occurrence of low cortisol was more common in younger patients, in more severely injured patients, in patients with preceding ischemic events (hypoxia, hypotension, severe anemia), and in patients who received etomidate. Adrenal insufficiency has also been associated with the use of barbiturate coma to treat refractory intracranial hypertension.264 Patients with adrenal insufficiency have lower BP and greater need for pressors.263,264
Although some experts recommend endocrine evaluation for hypopituitarism only in TBI patients with fractures involving the sella turcica or in whom DI develops, others recommend early evaluation of all moderate and severe TBI patients with follow-up at 3 and 12 months after injury.265–267 In the acute recovery period, testing for adrenal insufficiency should try to differentiate primary and secondary causes and include basal serum levels of cortisol and adrenocorticotropic hormone (ACTH), as well as serum cortisol 60 minutes after ACTH stimulation. A basal cortisol level lower than 15 µg/dL suggests either primary or secondary adrenal failure. Failure of the cortisol level to increase by at least 9 µg/dL after ACTH stimulation suggests primary hypoadrenalism.
Timing of Surgery for Other Injuries
Patients with severe head injuries often have other systemic injuries that require surgical procedures. If the systemic injury is life-threatening, the surgical procedure is needed on an emergency basis. However, controversy often arises regarding the timing of surgery for injuries that are not immediately life-threatening. One common example is a femoral fracture. Early surgery is recommended for a femoral fracture to minimize pulmonary complications, primarily fat emboli, but intraoperative hypotension can significantly worsen the neurological consequences of brain trauma,143 and many recommend postponing nonemergency surgery for several days until the intracranial hypertension has resolved.268
McKee and associates compared a group of head-injured patients with multiple trauma, including a femoral fracture, with a similar group without a femoral fracture.269 There was no difference in outcome, and the authors concluded that their practice of early fixation of femoral fractures did not increase morbidity or mortality. Poole and coauthors reported similar findings after retrospectively analyzing a group of 114 patients with head injury and a femoral or tibial fracture.270 Early surgery did not increase morbidity of the head injury, but it also did not reduce the risk for pulmonary complications. Both pulmonary and intracranial complications were related primarily to the severity of the brain injury and not to the timing of the orthopedic surgery. Kalb and colleagues observed that head-injured patients operated on within the first 24 hours after injury for repair of an orthopedic injury required more fluid resuscitation and blood product transfusion than did similar patients operated on after 24 hours.271 However, there was no difference in the long-term neurological outcome. These studies suggest that with meticulous attention to the management of BP, fluid resuscitation, and ICP, surgical procedures for other injuries can often be performed safely.
Treatment of Secondary Injury Processes: Intracranial Hypertension
Pharmacologic Paralysis
Data from the TCDB suggested that routine paralysis of all patients with severe head injury increases the risk for pulmonary complications and prolongs the ICU stay.272 However, increases in ICP as a result of agitation, posturing, or coughing should be prevented by narcotics and nondepolarizing muscle relaxants that do not alter cerebrovascular resistance (Table 334-5).273–283 A reasonable regimen is morphine and lorazepam for analgesia/sedation and cisatracurium or vecuronium as a muscle relaxant, with the dose titrated by twitch response to stimulation.284,285 Although neurological status cannot be closely monitored while the patient is paralyzed, the muscle relaxants can be withheld once a day, usually before morning rounds, to perform a brief neurological examination.
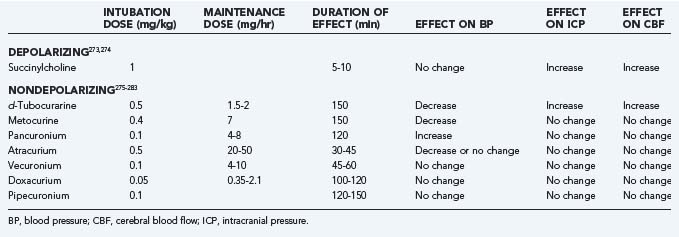
One complication of neuromuscular blockade that has received little attention in patients with TBI is critical illness myopathy and neuropathy. Weakness in a critically ill patient can be categorized into three general syndromes (Fig. 334-6). Critical illness myopathy was initially described in 1977,286 and numerous cases have been reported since that time.287 The syndrome seems to occur most commonly in asthmatics who require mechanical ventilation for status asthmaticus and who receive a combination of corticosteroids and neuromuscular blocking agents. β2-Agonists, methylxanthines, and aminoglycosides may also play a role in the development of this syndrome. Prolonged neuromuscular blockade can occur with neuromuscular blocking agents, particularly in patients with kidney or liver dysfunction, and in patients who also receive aminoglycosides.288 Finally, an acute polyneuropathy has been observed in patients with sepsis and multiple organ syndrome.289 There is considerable overlap in these typical syndromes, and a combined myopathy/neuropathy may also occur. Patients with TBI in whom neuromuscular blocking agents are given to control ICP are a high-risk group for these syndromes, but the symptoms are often difficult to differentiate from those of their neurological injury.290 In the proper setting, however, an electromyogram and muscle and nerve biopsy can be helpful in distinguishing weakness as a result of these syndromes from the underlying brain injury.
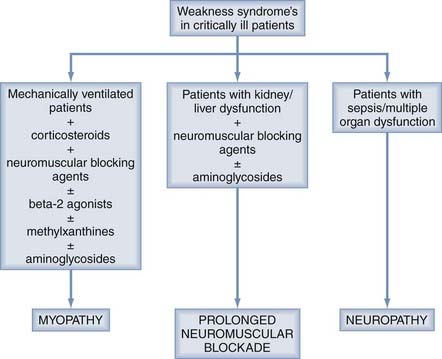
The underlying mechanisms of these syndromes are not known, but the association with neuromuscular blocking agents and critically ill patients is strong. Recommendations to minimize the risk for occurrence of these complications include limiting the use of neuromuscular blocking agents, limiting the dose of neuromuscular blocking agents by train-of-four monitoring, measuring creatine phosphokinase daily while neuromuscular blocking agents are given, and stopping administration of the neuromuscular blocking agents at least once a day to observe motor responses.288
Hyperventilation
The relationship of hyperventilation and global CBF has been examined in a series of 171 head-injured patients during the first 10 days after injury.291 Of 1212 CBF measurements in these patients, 132 (11%) were less than 25 mL/100 g per minute. Of the 132 low CBF values, 71 (54%) were appropriately reduced relative to the lower CMRO2, whereas 61 (46%) were associated with increased oxygen extraction or increased cerebral lactate production (or both), thus suggesting a relative inadequacy of perfusion. The incidence of inadequate CBF steadily increased as PCO2 decreased and was 2%, 4%, 8%, and 23% when PaCO2 was greater than 30, 25 to 30, 20 to 25, and less than 20 mm Hg, respectively. The incidence of inadequate CBF was twice as high during the first 24 hours than on any other day (8% versus 4%). The incidence was higher in patients with reduced CBF (11%) than in patients with normal or elevated CBF (2%).
Routine hyperventilation (to a PaCO2 of 20 to 25 mm Hg) has been shown to have a detrimental effect on outcome in one randomized trial292 and is not recommended in the current TBI guidelines (see Table 334-3—level II recommendation). The authors of this study recommended using hyperventilation only in patients with intracranial hypertension rather than as a routine in all head-injured patients. In general, hyperventilation should not be used during the first 24 hours after injury and only if PbtO2 or SjvO2 is monitored to make certain that ischemia is not being produced (see Table 334-3—level III recommendation).
In patients who have been chronically hyperventilated, abruptly returning the PaCO2 to normal can result in a dramatic increase in ICP. Muizelaar and colleagues showed in an experimental study that this phenomenon occurred after 24 hours of hyperventilation and was associated with vasodilation of cerebral vessels as CSF pH equilibrated at the new lower PaCO2 level.293 Hyperventilation should be withdrawn over a period of several days to avoid this increase in ICP.
Drainage of Cerebrospinal Fluid
Although removal of 1 mL of CSF normally does not change ICP by more than 1 to 2 mm Hg, in patients with elevated ICP, drainage of 1 to 2 mL of CSF through the ventriculostomy catheter can temporarily lower ICP. This modality can be an important adjunctive therapy for lowering ICP.294 However, as the brain becomes more swollen, the ventricles collapse, less CSF is available for drainage, and the effectiveness of this modality is reduced.
Osmotherapy
Before a method for measuring ICP became available, dehydration therapy was common in the management of head-injured patients. However, normovolemia does not result in an increased rate of intracranial hypertension and eliminates severe electrolyte abnormalities and renal failure.295 Fluid overload, however, should be avoided. Fluid restriction may be necessary in patients with hyponatremia caused by SIADH.
Hyperosmolar Therapy: Mannitol versus Hypertonic Saline
Intravenous bolus administration of mannitol lowers ICP within 1 to 5 minutes, with a peak effect at 20 to 60 minutes and lasting 1.5 to 6 hours.296 Mannitol is usually given as a bolus of 0.25 to 1 g/kg body weight (see Table 334-3—level II recommendation). If urgent reduction of ICP is needed, a dose of 1 g/kg should be given. When long-term reduction of ICP is needed, 0.25 to 0.5 g/kg can be repeated every 2 to 6 hours. Serum osmolarity seems to be optimal when increased to 300 to 320 mOsm and should be kept at less than 320 mOsm to avoid side effects such as hypovolemia, hyperosmolarity, and renal failure. Mannitol opens the BBB, and mannitol that has crossed the BBB may draw fluid into the brain, which can aggravate the edema. Mannitol should be tapered to prevent rebound in cerebral edema.
Hypertonic saline, given in concentrations ranging from 3% to 23.4%, reduces intracranial volume and ICP. In some studies, hypertonic saline has been more effective than mannitol in reducing ICP.297,298 Hypertonic saline has an advantage over mannitol in hypovolemic patients, in whom hypertonic saline augments intravascular volume and may increase BP in addition to decreasing ICP. Hypertonic saline has been demonstrated to reduce ICP with concurrent durable elevations in CPP, and it has also been shown to increase brain oxygenation levels.299 However, hypertonic saline was not associated with improved neurological outcomes when given as a prehospital bolus to hypotensive patients who had severe TBI.300 Adverse effects of hypertonic saline administration include bleeding secondary to decreased platelet aggregation, prolonged coagulation times, hypokalemia, and hyperchloremic acidosis.301
Barbiturate Coma
Barbiturate coma is another treatment modality that has been used to lower ICP in head-injured patients.49,302,303 In addition to lowering ICP, extracellular concentrations of lactate and excitatory amino acids are reduced after treatment with barbiturates.304 Although routine use of barbiturates in unselected patients has not been consistently effective in reducing morbidity or mortality after severe head injury,305,306 a randomized multicenter trial demonstrated that instituting barbiturate coma in patients with refractory intracranial hypertension resulted in a twofold greater chance of controlling ICP.307
Because of the hypotensive complications associated with barbiturates and because neurological evaluation is unavailable during treatment, barbiturate coma is generally reserved for patients with intracranial hypertension resistant to other modalities. Pentobarbital is given in both loading and maintenance doses. The loading dose is 10 mg/kg given over a 30-minute period, followed by 5 mg/kg each hour for three doses. This regimen typically provides a therapeutic level after the fourth dose. The maintenance dose is 1 to 2 mg/kg per hour adjusted so that either the serum level is in the therapeutic range of 30 to 50 µg/mL or the EEG has a burst suppression pattern. Winer and coauthors reported that plasma and CSF pentobarbital levels do not accurately reflect the physiologic effects of pentobarbital and recommended monitoring the EEG instead of pentobarbital levels.308 Pulmonary wedge pressure and cardiac output are monitored in all patients. Hypotension caused by pentobarbital is treated first by volume replacement and then with dopamine if necessary. Laboratory studies suggest that for the treatment of hypotension associated with barbiturate coma, volume resuscitation may be better than dopamine.309 In these studies, dopamine infusion increased cerebral metabolic requirements and partially offset the beneficial effects of barbiturates on metabolism.
The mechanism of ICP reduction by barbiturates is not entirely clear but is usually considered to be hemodynamic because of the immediate effect on ICP. Studies by Messeter and associates have suggested that the reduction in ICP with barbiturates is closely tied to the retention of CO2 reactivity by the brain.72,310 Studies by Cruz showed that outcomes are significantly worse in patients who have a reduction in SjvO2 to less than 45% with the initiation of barbiturate coma.311 Complications occurring during treatment of intracranial hypertension with barbiturate coma have been reported to include the following: hypotension in 58%, hypokalemia in 82%, respiratory complications in 76%, infections in 55%, hepatic dysfunction in 87%, and renal dysfunction in 47% of patients.312
In a study of 67 patients in barbiturate coma for refractory intracranial hypertension, the most consistent cerebral effect was a reduction in CMRO2 by an average of 31%.313 The change in CMRO2 with the loading dose of pentobarbital was closely related to the pretreatment value (n = 67, r2 = 0.65, P < .001). In the 30 patients with a good ICP response to pentobarbital infusion, pretreatment CMRO2 and AVDO2 were greater, and CMRO2 and AVDO2 decreased more with the loading dose of pentobarbital than in patients with a partial or no ICP response. Outcome was significantly better in patients with a good or partial ICP response to pentobarbital, with 21% of these patients having a good recovery or moderate disability at 3 months after injury as opposed to a persistent vegetative state or death in 100% of the nonresponders.
Hypothermia
Therapeutic hypothermia has been investigated as a possible neuroprotective strategy for the prevention or reduction of brain injury as a result of several causes. Possible mechanisms include reductions in the cerebral metabolic rate, increased ICP, cerebral edema formation, frequency of epileptic discharges, and opening of the BBB.314 Hypothermia also inhibits the inflammatory response and the release of glutamate, nitric oxide, and free radicals associated with TBI.315 In a systematic review, McIntyre and coauthors reported an overall beneficial effect of moderate hypothermia (32°C to 33°C) in patients with severe TBI: a 19% reduction in deaths and a 22% reduction in poor neurological outcomes relative to normothermic patients.315 The review indicated that the therapy should be continued for at least 24 hours, with temperature ranging between 32°C and 33°C and rewarming period lasting less than 24 hours. Evidence from six randomized controlled trials did not clearly demonstrate that hypothermia is associated with consistent and statistically significant reductions in mortality.316–320 However, patients treated with hypothermia have a favorable neurological outcome. Preliminary findings suggest that hypothermia may have a better chance of reducing mortality when cooling is maintained for more than 48 hours. Based on these results, hypothermia is limited to a recommendation level III in the guidelines for the management of TBI.321 There are two different methods to induce hypothermia: systemic and selective hypothermia. Most of the studies conducted have involved systemic hypothermia; the most frequent risks associated with this method include cardiovascular and pulmonary complications, infections, and increased rates of thrombocytopenia. Methods to induce selective hypothermia include surface cooling, intranasal selective hypothermia, endovascular cooling, and epidural cerebral cooling. From these choices, only surface cooling and intranasal cooling have been tested in humans.322
Decompressive Craniectomy
Decompressive craniectomy has been used to treat uncontrolled intracranial hypertension of various origins, including cerebral infarction, trauma, SAH, and spontaneous hemorrhage. Patient selection, the timing of surgery, the type of surgery, and the clinical and radiologic severity of the brain injury are all factors that determine the outcome of this procedure. The effectiveness of very early decompressive craniectomy was evaluated in one randomized clinical trial that included 27 children who suffered TBI. There was a reduced risk ratio for death of 0.54 (95% confidence interval [CI], 0.17 to 1.72) and a risk ratio of 0.54 for death, vegetative status, or severe disability 6 to 12 months after injury (95% CI, 0.29 to 1.07).323 Other available studies in adults are either case series or cohorts with historical controls. Their results suggest that decompressive craniectomy effectively reduces ICP in most (85%) patients who have intracranial hypertension refractory to conventional medical treatment.323,324 In another case-control study, Polin and coworkers reported improved outcomes in a selected group of patients with diffuse brain swelling who underwent bilateral frontal decompressive craniectomy.325 A favorable outcome was observed in 46% of the patients who underwent surgery within 48 hours of admission. Brain oxygenation measured by tissue PO2 and blood flow estimated by MCV-FV are also usually improved after decompressive craniectomy.326,327 The results of a recently published case series of 33 patients with severe TBI who underwent decompressive craniectomy showed that the long-term (3 years) results justify the use of decompressive craniectomy and that good clinical results are seen in up to 40% of patients who were otherwise most likely to die,328 although further studies will be required to define the parameters of use, including the timing of surgery, the physiologic threshold, the choice of procedure, and the age limit. Randomized controlled trials in patients with TBI are ongoing (Rescue ICP and DECRAN).329
Treatment of Secondary Ischemia Processes: Cerebral Ischemia
The oxygen content of the blood can be increased by ensuring an adequate hemoglobin concentration and by increasing arterial PO2. The optimal hemoglobin concentration for tissue oxygenation is approximately 10 g/dL.330 A lower hemoglobin concentration reduces the oxygen-carrying capacity of blood more than it improves viscosity. A higher hemoglobin concentration reduces viscosity and CBF even though it increases oxygen-carrying capacity.
Increasing arterial PO2 after hemoglobin is nearly 100% saturated only increases the arterial oxygen content by a small amount (i.e., by the amount of oxygen dissolved in the blood). However, if tissues are ischemic, even small increases in oxygen content can be important. As the example in Figure 334-4 illustrates, simply increasing FIO2 can significantly increase PbtO2. Menzel and colleagues observed an increase in PbtO2 and a decrease in extracellular lactate concentration in the brain, measured by microdialysis, when patients with very low baseline PbtO2 were administered 100% oxygen.331 The reduction in lactate accumulation with this therapy suggests that the increase in PbtO2 altered ischemic cerebral metabolism favorably. Given the relatively small effect observed and the potential for toxicity with inspiration of 100% oxygen, this approach to improving oxygenation needs further investigation.
Few studies have compared the effectiveness of the various pressor agents in increasing CBF. Table 334-6 summarizes some of these studies, most of which were done in healthy experimental subjects. All the agents listed raise BP via sympathomimetic actions. Dopamine has the most complex actions and the most variability among the different studies. In very low doses, dopamine can actually reduce CBF. At intermediate doses it increases CBF, and at higher doses the effect again is to decrease CBF.332 Myburgh and associates compared the effects of equal doses of norepinephrine, epinephrine, and dopamine on CBF and ICP.333 At doses higher than 20 µg/kg per minute, dopamine increased ICP, and at doses higher than 60 µg/kg per minute, dopamine increased CBF. Norepinephrine and epinephrine at similar doses did not have a significant effect on either CBF or ICP.
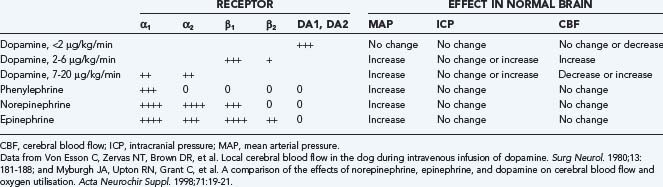
In patients with cerebral ischemia, however, the results may be different. Areas of ischemia are likely to have lost the ability to autoregulate, and blood flow may be more dependent on CPP. It might be expected that any agent that increases CPP would improve CBF, especially in ischemic areas. Darby and coworkers studied CBF before and after raising BP from 90 to 111 mm Hg with dopamine in 13 patients with suspected vasospasm.334 The dopamine infusion increased rCBF in more than 90% of the regions where CBF was lower than 25 mL/100 g per minute at baseline. Dopamine also unexpectedly reduced rCBF in a third of the nonischemic territories. Although dopamine is the most widely used pressor agent in the setting of hypotension and shock, it may not be the best agent for induced hypertension as a treatment of cerebral ischemia. Pressor drugs such as norepinephrine or phenylephrine may have more predictable effects on CBF, although there may also be more systemic ischemic complications with these agents.
Treatment of Secondary Ischemic Insults
Treatment of Hypotension
Hypotension in a head-injured patient is treated in a manner similar to any other critically ill trauma patient, except that the goal must be to provide CPP that is adequate for the injured brain. Initially, intravascular volume should be assessed, and if low, volume should be given. A central venous pressure monitor or in some cases a Swan-Ganz catheter is appropriate to assess intravascular volume. Low intravascular volume should be treated by infusion of crystalloids, colloids, or blood as appropriate for the clinical situation. There is uncertainty about the best choice of fluids, and both crystalloid-based and colloid-based resuscitation strategies have been advocated. From the Saline versus Albumin Fluid Evaluation (SAFE) study, a post hoc follow-up study of patients with TBI (the SAFE-TBI study) was undertaken.335 A higher mortality rate was observed in patients with severe TBI who received 4% albumin than in those who received saline, thus suggesting that saline is preferable to albumin during the acute resuscitation of patients with severe TBI.336
Hypertonic saline has been found to allow replacement of intravascular volume with less of an increase in ICP than is the case with saline or dextran.299 In one multicenter study of hypertonic saline for resuscitation of trauma patients, the head-injured patients treated with hypertonic saline had significantly better survival to discharge.337 If volume replacement does not provide an adequate BP, inotropic or pressor agents, or both, should be used.
The underlying cause of the hypotension must be sought and treated. Hypotension in an adult is only occasionally caused by head injury alone, and another mechanism should be sought.338 Blood loss from another injury, an associated spinal cord injury, cardiac contusion or tamponade, and tension pneumothorax are other causes of hypotension to be considered.
Treatment of Hypoxia
The severity of the effect of PEEP on ICP depends on both intracranial and pulmonary compliance. In patients with normal intracranial compliance, ICP does not change significantly because the brain is able to compensate for the increased cerebral venous blood volume caused by an increase in intrathoracic pressure. In contrast, when intracranial compliance is decreased, even small increases in cerebral venous pressure induced by PEEP may cause dangerous increases in ICP. Apuzzo and associates studied the effects of PEEP in 25 head-injured patients.339 ICP increased in 12 of the patients, all of whom had decreased intracranial compliance. CPP decreased to less than 60 mm Hg in 50% of the patients with increased ICP. Shapiro and Marshall found that 6 of 12 head-injured patients had a 10–mm Hg increase in ICP with the addition of 4 to 8 cm PEEP.340 In most cases, elevating the patient’s head reduces the effect of high airway pressure on ICP.341
The extent to which any given amount of PEEP is transmitted to the venous system also depends on the severity of the pulmonary injury. When the lungs are poorly compliant, exposure to PEEP does not usually cause marked increases in venous pressure or ICP.342,343
Removal of PEEP must also be judicious. Sudden cessation of PEEP may precipitate a sudden increase in central blood volume and a rise in arterial blood pressure and CPP, thereby resulting in an increase in ICP.342,344
Treatment of Anemia
Anemia can easily be remedied by transfusing packed red blood cells. The optimal hematocrit for improving oxygen delivery after head injury is not entirely clear. Studies that examine the relationship between CBF and hematocrit have demonstrated that CBF and tissue oxygen delivery increase as the hematocrit and viscosity decrease until the hematocrit falls to 33%. Below a hematocrit of 33%, tissue oxygen delivery decreases.330 In normal adults, adequate oxygen-carrying capacity is usually met by a hemoglobin concentration of 7 g/dL or a hematocrit of 21% when intravascular volume is normal. However, because cerebral vascular responses are impaired after TBI, it cannot be assumed that the same hematocrit will be adequate in a head-injured patient. In a recent study of 35 patients with severe TBI and SAH who had hematocrits less than 25%, packed red blood cell transfusion increased local brain tissue oxygen saturation in 75% of the patients.345 Current evidence suggests a favorable outcome with a restrictive transfusion practice in the general ICU population. The optimal transfusion threshold in critically ill neurological patients is unknown. In selected patients, a hematocrit of greater than 25% to 30% may be required for maximal oxygen delivery to the brain.346
Treatment of Cerebral Vasospasm
Symptomatic vasospasm after TBI is treated similar to vasospasm after SAH. Nimodipine may be effective in reducing the neurological consequences of vasospasm after head injury. It is not clear that the beneficial effect of nimodipine after head injury is via an effect on vasospasm. However, the only subgroup of head-injured patients who have been found to benefit are those with SAH.347
Hypervolemic hemodilution and induced hypertension are the primary therapies for vasospasm. The patient should undergo volume expansion. Usually, a Swan-Ganz catheter is indicated to optimize cardiac output. If the patient is still symptomatic after volume expansion, a pressor agent should be added to raise BP. The choice of pressor agents is controversial, as discussed under the topic of treatment of secondary ischemia. Information about cardiac output obtained from the Swan-Ganz catheter can be helpful in this decision. If cardiac output is normal or elevated, a pressor agent such as phenylephrine or norepinephrine is likely to be more effective in raising BP. If cardiac output is reduced, dopamine may be a better choice, but it should be remembered that dopamine has been observed to have an unpredictable effect on CBF in some studies.332,334 In patients with vasospasm caused by a blast-type injury, aggressive open surgical and endovascular treatment may improve outcome. In a recent report of vasospasm associated with blast injury, patients received medical management and aggressive endovascular interventions (endovascular nicardipine, angioplasty, or both); although no early improvement in neurological function was noted, there was a clear improvement in blood flow velocities measured by TCD.68
Ahmed N, Kuo YH. Early versus late tracheostomy in patients with severe traumatic head injury. Surg Infect (Larchmt). 2007;8:343-347.
Barzo P, Marmarou A, Fatouros P, et al. Contribution of vasogenic and cellular edema to traumatic brain swelling measured by diffusion-weighted imaging. J Neurosurg. 1997;87:900-907.
Bullock MR, Lyeth BG, Muizelaar JP. Current status of neuroprotection trials for traumatic brain injury: lessons from animal models and clinical studies. Neurosurgery. 1999;45:207-220.
Ecker RD, Wijdicks EF, Wix K, et al. Does famotidine induce thrombocytopenia in neurosurgical patients? J Neurosurg Anesthesiol. 2004;16:291-293.
Ghigo E, Masel B, Aimaretti G, et al. Consensus guidelines on screening for hypopituitarism following traumatic brain injury. Brain Inj. 2005;19:711-724.
, 2007 Guidelines for the management of severe traumatic brain injury. J Neurotrauma. 2007;24(suppl 1):S1-S106.
Hartl R, Gerber LM, Ni Q, et al. Effect of early nutrition on deaths due to severe traumatic brain injury. J Neurosurg. 2008;109:50-56.
Jones KE, Puccio AM, Harshman KJ, et al. Levetiracetam versus phenytoin for seizure prophylaxis in severe traumatic brain injury. Neurosurg Focus. 2008;25(4):E3.
Knudson MM, Ikossi DG, Khaw L, et al. Thromboembolism after trauma: an analysis of 1602 episodes from the American College of Surgeons National Trauma Data Bank. Ann Surg. 2004;240:490-496.
Maas AI, Steyerberg EW, Butcher I, et al. Prognostic value of computerized tomography scan characteristics in traumatic brain injury: results from the IMPACT study. J Neurotrauma. 2007;24:303-314.
Myburgh J, Cooper DJ, Finfer S, et al. Saline or albumin for fluid resuscitation in patients with traumatic brain injury. N Engl J Med. 2007;357:874-884.
Myburgh JA, Upton RN, Grant C, et al. A comparison of the effects of norepinephrine, epinephrine, and dopamine on cerebral blood flow and oxygen utilisation. Acta Neurochir Suppl. 1998;71:19-21.
Namen AM, Ely EW, Tatter SB, et al. Predictors of successful extubation in neurosurgical patients. Am J Respir Crit Care Med. 2001;163:658-664.
Nates JL, Cooper DJ, Day B, et al. Acute weakness syndromes in critically ill patients—a reappraisal. Anaesth Intensive Care. 1997;25:502-513.
Pendem S, Rana S, Manno EM, et al. A review of red cell transfusion in the neurological intensive care unit. Neurocrit Care. 2006;4:63-67.
Sirvent JM, Torres A, El-Ebiary M, et al. Protective effect of intravenously administered cefuroxime against nosocomial pneumonia in patients with structural coma. Am J Respir Crit Care Med. 1997;155:1729-1734.
van den BG, Schoonheydt K, Becx P, et al. Insulin therapy protects the central and peripheral nervous system of intensive care patients. Neurology. 2005;64:1348-1353.
Vespa P. Cerebral salt wasting after traumatic brain injury: an important critical care treatment issue. Surg Neurol. 2008;69:230-232.
Zabramski JM, Whiting D, Darouiche RO, et al. Efficacy of antimicrobial-impregnated external ventricular drain catheters: a prospective, randomized, controlled trial. J Neurosurg. 2003;98:725-730.
1 Steyerberg EW, Mushkudiani N, Perel P, et al. Predicting outcome after traumatic brain injury: development and international validation of prognostic scores based on admission characteristics. PLoS Med. 2008;5:e165.
2 Waters RJ, Nicoll JA. Genetic influences on outcome following acute neurological insults. Curr Opin Crit Care. 2005;11:105-110.
3 Jennett B, Teasdale G, Braakman R, et al. Prognosis of patients with severe head injury. Neurosurgery. 1979;4:283-289.
4 Jennett B, Bond MR. Assessment of outcome after severe brain damage. Lancet. 1975;1:480-484.
5 Teasdale G, Jennett B. Assessment of coma and impaired consciousness. Lancet. 1974;2:81-84.
6 Foulkes M, Eisenberg HM, Jane JA, et al. The Traumatic Coma Data Bank: design, methods, and baseline characteristics. J Neurosurg. 1991;75(suppl):S8-S13.
7 Marshall LF, Gautille T, Klauber MR, et al. The outcome of severe closed head injury. J Neurosurg. 1991;75(suppl):S28-S36.
8 Chestnut RM, Marshall LF, Klauber MR, et al. The role of secondary brain injury in determining outcome from severe head injury. J Trauma. 1993;34:216-222.
9 Eisenberg HM, Gary HEJr, Aldrich EF, et al. Initial CT findings in 753 patients with severe head injury. J Neurosurg. 1990;73:688-698.
10 Marshall LF, Marshall SB, Klauber MR, et al. A new classification of head injury based on computerized tomography. J Neurosurg. 1991;75:S14-S20.
11 Marmarou A, Lu J, Butcher I, et al. IMPACT database of traumatic brain injury: design and description. J Neurotrauma. 2007;24:239-250.
12 Murray GD, Butcher I, McHugh GS, et al. Multivariable prognostic analysis in traumatic brain injury: results from the IMPACT study. J Neurotrauma. 2007;24:329-337.
13 Guidelines for the management of severe traumatic brain injury. J Neurotrauma. 2007;24(suppl 1):S1-106.
14 Guidelines for the management of severe head injury. Brain Trauma Foundation, American Association of Neurological Surgeons, Joint Section on Neurotrauma and Critical Care. J Neurotrauma. 1996;13:641-734.
15 Bullock MR, Lyeth BG, Muizelaar JP. Current status of neuroprotection trials for traumatic brain injury: lessons from animal models and clinical studies. Neurosurgery. 1999;45:207-220.
16 Saatman KE, Duhaime AC, Bullock R, et al. Classification of traumatic brain injury for targeted therapies. J Neurotrauma. 2008;25:719-738.
17 Adams JH, Graham DI, Gennarelli TA. Head injury in man and experimental animals. Neuropathology. Acta Neurochir Suppl. 1983;32:S15-S30.
18 Gentleman SM, Roberts GW, Gennarelli TA, et al. Axonal injury: a universal consequence of fatal closed head injury. Acta Neuropathol (Berl). 1995;89:537-543.
19 Gennarelli TA, Spielman GM, Langfitt TW, et al. Influence of the type of intracranial lesion on outcome from severe head injury: a multicenter study using a new classification system. J Neurosurg. 1982;56:26-32.
20 Smith WP, Batnitzky S, Rengachary SS. Acute isodense subdural hematomas: a problem in anemic patients. Am J Radiol. 1981;136:543-546.
21 Maas AI, Steyerberg EW, Butcher I, et al. Prognostic value of computerized tomography scan characteristics in traumatic brain injury: results from the IMPACT study. J Neurotrauma. 2007;24:303-314.
22 Zumkeller M, Behrmann R, Heissler HE, et al. Computed tomographic criteria and survival rate for patients with acute subdural hematoma. Neurosurgery. 1996;39:708-712.
23 Massaro F, Lanotte M, Faccani G, et al. One hundred and twenty-seven cases of acute subdural haematoma operated on. Correlation between CT scan findings and outcome. Acta Neurochir (Wien). 1996;138:185-191.
24 Schroder ML, Muizelaar JP, Kuta AJ. Documented reversal of global ischemia immediately after removal of an acute subdural hematoma. J Neurosurg. 1994;80:324-327.
25 Gopinath SP, Ritter AM, Robertson CS. Intraoperative monitoring of jugular venous oxygen saturation in patients with severe head injury. Anesth Analg. 1996;83:1014-1021.
26 Doppenberg EM, Watson JC, Broaddus WC, et al. Intraoperative monitoring of substrate delivery during aneurysm and hematoma surgery: initial experience in 16 patients. J Neurosurg. 1997;87:809-816.
27 Duhaime AC, Gennarelli LM, Yachnis A. Acute subdural hematoma: is the blood itself toxic? J Neurotrauma. 1994;11:669-678.
28 Bullock MR, Chesnut R, Ghajar J, et al. Surgical management of acute subdural hematomas. Neurosurgery. 2006;58:S16-S24.
29 Jamieson KG, Yelland JDN. Extradural hematoma: report of 167 cases. J Neurosurg. 1968;29:13-23.
30 Bullock MR, Chesnut R, Ghajar J, et al. Surgical management of acute epidural hematomas. Neurosurgery. 2006;58:S7-S15.
31 Di Rocca A, Ellis SJ, Landes C. Delayed epidural hematoma. Neuroradiology. 1991;33:253-254.
32 Dharker SR, Bhargava N. Bilateral epidural haematoma. Acta Neurochir (Wien). 1991;110:29-32.
33 Servadei F. Prognostic factors in severely head injured adult patients with epidural haematoma. Acta Neurochir (Wien). 1997;139:273-278.
34 Narayan RK, Maas AI, Servadei F, et al. Progression of traumatic intracerebral hemorrhage: a prospective observational study. J Neurotrauma. 2008;25:629-639.
35 Bullock MR, Chesnut R, Ghajar J, et al. Surgical management of traumatic parenchymal lesions. Neurosurgery. 2006;58:S25-S46.
36 Choksey M, Crockard HA, Sandilands M. Acute traumatic intracerebral haematomas: determinants of outcome in a retrospective series of 202 cases. Br J Neurosurg. 1993;7:611-622.
37 Zimmerman RA, Bilaniuk LT, Dolinskas C, et al. Computed tomography of acute intracerebral hemorrhagic contusion. J Comput Assist Tomogr. 1977;1:271-279.
38 Schroder ML, Muizelaar JP, Bullock MR, et al. Focal ischemia due to traumatic contusions documented by stable xenon-CT and ultrastructural studies. J Neurosurg. 1995;82:966-971.
39 Rocca B, Martin C, Viviand X, et al. Comparison of four severity scores in patients with head trauma. J Trauma. 1989;29:299-305.
40 Alvarez M, Nava JM, Rue M, et al. Mortality prediction in head trauma patients: performance of Glasgow Coma Score and general severity systems. Crit Care Med. 1998;26:142-148.
41 Narayan RK, Michel ME, Ansell B, et al. Clinical trials in head injury. J Neurotrauma. 2002;19:503-557.
42 Kita H, Marmarou A. The cause of acute brain swelling after the closed head injury in rats. Acta Neurochir Suppl. 1994;60:452-455.
43 Marmarou A, Barzo P, Fatouros P, et al. Traumatic brain swelling in head injured patients: brain edema or vascular engorgement? Acta Neurochir Suppl. 1997;70:68-70.
44 Barzo P, Marmarou A, Fatouros P, et al. Contribution of vasogenic and cellular edema to traumatic brain swelling measured by diffusion-weighted imaging. J Neurosurg. 1997;87:900-907.
45 Barzo P, Marmarou A, Fatouros P, et al. Biphasic pathophysiological response of vasogenic and cellular edema in traumatic brain swelling. Acta Neurochir Suppl. 1997;70:119-122.
46 Miller JD, Becker DP, Ward JD, et al. Significance of intracranial hypertension in severe head injury. J Neurosurg. 1977;47:503-516.
47 Miller JD, Sweet RC, Narayan RK, et al. Early insults to the injured brain. JAMA. 1978;240:439-442.
48 Bruce DA, Raphaely RC, Goldberg AI, et al. Pathophysiology, treatment, and outcome following severe head injury in children. Childs Brain. 1979;5:174-191.
49 Marshall LF, Smith RW, Shapiro HM. The outcome with aggressive treatment in severe head injuries. Part I: Significance of intracranial pressure monitoring. J Neurosurg. 1979;50:20-25.
50 Miller JD, Butterworth J, Gudeman SK, et al. Further experience in the management of severe head injury. J Neurosurg. 1981;54:289-299.
51 Saul TG, Ducker TB. Effect of intracranial pressure monitoring and aggressive treatment on mortality in severe head injury. J Neurosurg. 1982;56:498-503.
52 Becker DP, Miller JD, Ward JD, et al. The outcome from severe head injury with early diagnosis and intensive management. J Neurosurg. 1977;47:491-502.
53 Bowers SA, Marshall LF. Outcome in 200 consecutive cases of severe head injury treated in San Diego County: a prospective analysis. Neurosurgery. 1980;6:237-242.
54 Martin NA, Patwardhan RV, Alexander MJ, et al. Characterization of cerebral hemodynamic phases following severe head trauma: hypoperfusion, hyperemia, and vasospasm. J Neurosurg. 1997;87:9-19.
55 Robertson CS, Contant CF, Gokaslan ZL, et al. Cerebral blood flow, arteriovenous oxygen difference, and outcome in head injured patients. J Neurol Neurosurg Psychiatry. 1992;55:594-603.
56 Hlatky R, Contant CF, az-Marchan P, et al. Significance of a reduced cerebral blood flow during the first 12 hours after traumatic brain injury. Neurocrit Care. 2004;1:69-83.
57 McLaughlin MR, Marion DW. Cerebral blood flow and vasoresponsivity within and around cerebral contusions. J Neurosurg. 1996;85:871-876.
58 Sakas DE, Bullock MR, Patterson J, et al. Focal cerebral hyperemia after focal head injury in humans: a benign phenomena. J Neurosurg. 1995;83:277-284.
59 Kelly DF, Kordestani RK, Martin NA, et al. Cerebral blood flow as a predictor of outcome following traumatic brain injury. J Neurosurg. 1997;86:633-641.
60 Bouma GJ, Muizelaar JP, Stringer WA, et al. Ultra-early evaluation of regional cerebral blood flow in severely head-injured patients using xenon-enhanced computerized tomography. J Neurosurg. 1992;77:360-368.
61 Marion DW, Darby J, Yonas H. Acute regional cerebral blood flow changes caused by severe head injuries. J Neurosurg. 1991;74:407-414.
62 Gopinath SP, Robertson CS, Contant CF, et al. Jugular venous desaturation and outcome after head injury. J Neurol Neurosurg Psychiatry. 1994;57:717-723.
63 Obrist WD, Langfitt T, Jaggi J, et al. Cerebral blood flow and metabolism in comatose patients with acute head injury. Relationship to intracranial hypertension. J Neurosurg. 1984;61:241-253.
64 Muizelaar JP, Marmarou A, DeSalles AA, et al. Cerebral blood flow and metabolism in severely head-injured children. Part 1: Relationship with GCS score, outcome, ICP, and PVI. J Neurosurg. 1989;71:63-71.
65 Obrist WD, Gennarelli TA, Segawa H, et al. Relation of cerebral blood flow to neurological status on outcome in head-injured patients. J Neurosurg. 1979;51:292-300.
66 Cormio M, Valadka AB, Robertson CS. Elevated jugular bulb oxygen saturation after severe head injury. J Neurosurg. 1999;90:9-15.
67 Chan KH, Dearden NM, Miller JD. The significance of posttraumatic increase in cerebral blood flow velocity: a transcranial Doppler ultrasound study. Neurosurgery. 1992;30:697-700.
68 Armonda RA, Bell RS, Vo AH, et al. Wartime traumatic cerebral vasospasm: recent review of combat casualties. Neurosurgery. 2006;59:1215-1225.
69 Jones PA, Andrews PJD, Midgley S, et al. Measuring the burden of secondary insults in head-injured patients during intensive care. J Neurosurg Anesthesiol. 1994;6:4-14.
70 Busija DW, Leffler CW, Pourcyrous M. Hyperthermia increases cerebral metabolic rate and blood flow in neonatal pigs. Am J Physiol. 1988;255:H343-H346.
71 Croughwell N, Smith LR, Quill T, et al. The effect of temperature on cerebral metabolism and blood flow in adults during cardiopulmonary bypass. J Thorac Cardiovasc Surg. 1992;103:549-554.
72 Nordstrom CH, Messeter K, Sundbarg G, et al. Cerebral blood flow, vasoreactivity, and oxygen consumption during barbiturate therapy in severe traumatic brain lesions. J Neurosurg. 1988;68:424-431.
73 Marion DW, Obrist WD, Carlier PM, et al. The use of moderate therapeutic hypothermia for patients with severe head injuries: a preliminary report. J Neurosurg. 1993;79:354-362.
74 Meldrum BS, Nilsson B. Cerebral blood flow and metabolic rate early and late in prolonged seizures induced in rats by bicuculline. Brain. 1976;99:523-542.
75 Michenfelder JD, Milde JH. The relationship among canine brain temperature, metabolism, and function during hypothermia. Anesthesiology. 1991;75:130-136.
76 Pierce EC, Lambertsen CJ, Deutsch S, et al. Cerebral circulation and metabolism during thiopental anesthesia and hyperventilation in man. J Clin Invest. 1962;41:1664-1671.
77 Bergsneider M, Hovda DA, Shalmon E, et al. Cerebral hyperglycolysis following severe traumatic brain injury in humans: a positron emission tomography study. J Neurosurg. 1997;86:241-251.
78 Clifton GL, Grossman RG. Technical flow: flowsheet for the neurosurgical intensive care units. Neurosurgery. 1982;11:280-283.
79 Selhorst JB, Gudeman SK, Butterworth JF, et al. Papilledema after acute head injury. Neurosurgery. 1985;16:357-363.
80 Guillaume J, Janny P. Manometrie intracranienne continue: interet de la methode et premiers resultats. Rev Neurol. 1951;84:131-142.
81 Lundberg N. Continuous recording and control of ventricular fluid pressure in neurosurgical practice. Acta Psychiatr Neurol Scand. 1960;149(suppl 36):1-193.
82 Bratton SL, Chestnut RM, Ghajar J, et al. Guidelines for the management of severe traumatic brain injury. VII. Intracranial pressure monitoring technology. J Neurotrauma. 2007;24(suppl 1):S45-S54.
83 Narayan RK, Kishore PRS, Becker DP, et al. Intracranial pressure: to monitor or not to monitor? A review of our experience with severe head injury. J Neurosurg. 1982;56:650-659.
84 Gopinath SP, Robertson CS, Contant CF, et al. Clinical evaluation of a miniature strain-gauge transducer for monitoring intracranial pressure. Neurosurgery. 1995;36:1137-1141.
85 Chambers IR, Mendelow AD, Sinar EJ, et al. A clinical evaluation of the Camino subdural screw and ventricular monitoring kits. Neurosurgery. 1990;26:421-423.
86 Czosnyka M, Czosnyka Z, Pickard JD. Laboratory testing of three intracranial pressure microtransducers: technical report. Neurosurgery. 1996;38:219-224.
87 Unterberg A, Kiening K, Schmiedek P, et al. Long-term observations of intracranial pressure after severe head injury. The phenomenon of secondary rise of intracranial pressure. Neurosurgery. 1993;32:17-24.
88 Souter MJ, Andrews PJ, Pereirinha MR, et al. Delayed intracranial hypertension: relationship to leukocyte count. Crit Care Med. 1999;27:177-181.
89 Lozier AP, Sciacca RR, Romagnoli MF, et al. Ventriculostomy-related infections: a critical review of the literature. Neurosurgery. 2008;62(suppl 2):688-700.
90 Zabramski JM, Whiting D, Darouiche RO, et al. Efficacy of antimicrobial-impregnated external ventricular drain catheters: a prospective, randomized, controlled trial. J Neurosurg. 2003;98:725-730.
91 Davis JW, Davis IC, Bennink LD, et al. Placement of intracranial pressure monitors: are “normal” coagulation parameters necessary? J Trauma. 2004;57:1173-1177.
92 Andrews BT, Chiles BWIII, Oslen WL, et al. The effect of intracerebral hematoma location on the risk of brain stem compression and on clinical outcome. J Neurosurg. 1988;69:518-522.
93 Marmarou A, Anderson RL, Ward JD, et al. Impact of ICP instability and hypotension on outcome in patients with severe head injury. J Neurosurg. 1991;75:S59-S64.
94 Contant CF, Robertson CS, Gopinath SP, et al. Determination of clinically important thresholds in continuously monitored patients with head injury. J Neurotrauma. 1993;10(suppl 1):S57.
95 Bratton SL, Chestnut RM, Ghajar J, et al. Guidelines for the management of severe traumatic brain injury. VI. Indications for intracranial pressure monitoring. J Neurotrauma. 2007;24(suppl 1):S37-S44.
96 Kofke WA, Brauer P, Policare R, et al. Middle cerebral artery blood flow velocity and stable xenon-enhanced computed tomographic blood flow during balloon test occlusion of the internal carotid artery. Stroke. 1995;26:1603-1606.
97 Brauer P, Kochs E, Werner C, et al. Correlation of transcranial Doppler sonography mean flow velocity with cerebral blood flow in patients with intracranial pathology. J Neurosurg Anesthesiol. 1998;10:80-85.
98 Newell DW, Winn HR. Transcranial Doppler in cerebral vasospasm. Neursurg Clin N Am. 1990;1:316-328.
99 Lindegaard KF, Nornes H, Bakke SJ, et al. Cerebral vasospasm diagnosis by means of angiography and blood velocity measurements. Acta Neurochir (Wien). 1989;100:12-24.
100 DeWitt DS, Fatouros PP, Wist AO, et al. Stable xenon versus radiolabeled microsphere cerebral blood flow measurements in baboons. Stroke. 1989;20:1716-1723.
101 Gur D, Yonas H, Jackson DL, et al. Measurement of cerebral blood flow during xenon inhalation as measured by the microspheres method. Stroke. 1985;16:871-874.
102 Ploughmann J, Astrup J, Pederson J, et al. Effect of stable xenon inhalation on intracranial pressure during measurement of cerebral blood flow in head injury. J Neurosurg. 1994;81:822-828.
103 Marion DW, Crosby K. The effect of stable xenon on ICP. J Cereb Blood Flow Metab. 1991;11:347-350.
104 Sioutos PJ, Orozco JA, Carter LP, et al. Continuous regional cerebral cortical blood flow monitoring in head-injured patients. Neurosurgery. 1995;36:943-950.
105 Dickman CA, Carter LP, Baldwin HZ, et al. Continuous regional cerebral blood flow monitoring in acute craniocerebral trauma. Neurosurgery. 1991;28:467-472.
106 Lam JM, Hsiang JN, Poon WS. Monitoring of autoregulation using laser Doppler flowmetry in patients with head injury. J Neurosurg. 1997;86:438-445.
107 Soukup J, Bramsiepe I, Brucke M, et al. Evaluation of a bedside monitor of regional CBF as a measure of CO2 reactivity in neurosurgical intensive care patients. J Neurosurg Anesthesiol. 2008;20:249-255.
108 Carter LP, Atkinson JR. Cortical blood flow in controlled hypotension as measured by thermal diffusion. J Neurol Neurosurg Psychiatry. 1973;36:906-913.
109 Brawley BW. The pathophysiology of intracerebral steal following carbon dioxide inhalation, an experimental study. Scand J Clin Lab Invest Suppl. 1968;102:XIII. B
110 Carter LP, Erspamer RJ, Bro WJ. Cortical blood flow thermal diffusion vs. isotope clearance. Stroke. 1981;12:513-518.
111 Gaines C, Carter LP, Crowell RM. Comparison of local cerebral blood flow determined by thermal and hydrogen clearance. Stroke. 1983;14:66-69.
112 Vajkoczy P, Roth H, Horn P, et al. Continuous monitoring of regional cerebral blood flow: experimental and clinical validation of a novel thermal diffusion microprobe. J Neurosurg. 2000;93:265-274.
113 Ritter AM, Gopinath SP, Contant C, et al. Evaluation of a regional oxygen saturation catheter for monitoring SjvO2 in head injured patients. J Clin Monit. 1996;12:285-291.
114 Souter MJ, Andrews PJD. Validation of the EdsLab dual lumen oximetry catheter for continuous monitoring of jugular bulb oxygen saturation [abstract]. J Neurotrauma. 1995;12:471.
115 Howard L, Gopinath SP, Uzura M, et al. Evaluation of a new fiberoptic catheter for monitoring jugular venous oxygen saturation. Neurosurgery. 1999;44:1280-1285.
116 Robertson CS, Gopinath SP, Goodman JC, et al. SjvO2 monitoring in head-injured patients. J Neurotrauma. 1995;12:891-896.
117 Gibbs EL, Lennox WG, Gibbs FA. Bilateral internal jugular blood. Comparison of A-V differences, oxygen-dextrose ratios and respiratory quotients. Am J Psychiatry. 1945;102:184-190.
118 Stocchetti N, Paparella A, Bridelli F, et al. Cerebral venous oxygen saturation studied using bilateral samples in the jugular veins. Neurosurgery. 1994;34:38-44.
119 Metz C, Holzschuh M, Bein T, et al. Monitoring of cerebral oxygen metabolism in the jugular bulb: reliability of unilateral measurements in severe head injury. J Cereb Blood Flow Metab. 1998;18:332-343.
120 Gibbs EL, Lennox WG, Nims LF, et al. Arterial and cerebral venous blood. Arterial-venous differences in man. J Biol Chem. 1942;144:325-332.
121 Chieregato A, Calzolari F, Trasforini G, et al. Normal jugular bulb oxygen saturation. J Neurol Neurosurg Psychiatry. 2003;74:784-786.
122 Sutton LN, McLaughlin AC, Dante S, et al. Cerebral venous oxygen content as a measure of brain energy metabolism with increased intracranial pressure and hyperventilation. J Neurosurg. 1990;73:927-932.
123 Meyer JS, Gotoh F, Ebihara S, et al. Effects of anoxia on cerebral metabolism and electrolytes in man. Neurology. 1965;15:892-901.
124 Lennox WG, Gibbs FA, Gibbs EL. Relationship of unconsciousness to cerebral blood flow and to anoxemia. Arch Neurol Psychiatry. 1935;34:1001-1013.
125 Sapire KJ, Gopinath SP, Farhat G, et al. Cerebral oxygenation during warming after cardiopulmonary bypass. Crit Care Med. 1997;25:1655-1662.
126 Gopinath SP, Cormio M, Ziegler J, et al. Intraoperative jugular desaturation during surgery for traumatic intracranial hematomas. Anesth Analg. 1996;83:1014-1021.
127 Cruz J. On-line monitoring of global cerebral hypoxia in acute brain injury: Relationship to intracranial hypertension. J Neurosurg. 1993;79:228-233.
128 Seneff MG, Rippe JM. Central venous catheters. In: Rippe JM, Irwin RS, Alpert JS, et al, editors. Intensive Care Medicine. Boston: Little, Brown; 1985:16-33.
129 Stocchetti N, Barbagallo M, Gordon CR, et al. Arterio-jugular difference of oxygen and intracranial pressure in comatose, head injured patients. I. Technical aspects and complications. Minerva Anestesiol. 1991;57:319-326.
130 Coplin WM, O’Keefe GE, Grady MS, et al. Thrombotic, infectious, and procedural complications of the jugular bulb catheter in the intensive care unit. Neurosurgery. 1997;41:101-107.
131 Hoffman WE, Charbel FT, Edelman G. Brain tissue oxygen, carbon dioxide, and pH in neurosurgical patients at risk for ischemia. Anesth Analg. 1996;82:582-586.
132 Valadka A, Gopinath SP, Contant CF, et al. Critical values for brain tissue PO2 to outcome after severe head injury. Crit Care Med. 1998;26:1576-1581.
133 van den Brink WA, van Santbrink H, Steyerberg EW, et al. Brain oxygen tension in severe head injury. Neurosurgery. 2000;46:868-878.
134 Stiefel MF, Spiotta A, Gracias VH, et al. Reduced mortality rate in patients with severe traumatic brain injury treated with brain tissue oxygen monitoring. J Neurosurg. 2005;103:805-811.
135 Figaji AA, Fieggen AG, Argent AC, et al. Does adherence to treatment targets in children with severe traumatic brain injury avoid brain hypoxia? A brain tissue oxygenation study. Neurosurgery. 2008;63:83-91.
136 Wang HC, Chang WN, Chang HW, et al. Factors predictive of outcome in posttraumatic seizures. J Trauma. 2008;64:883-888.
137 Vespa PM, Nenov V, Nuwer MR. Continuous EEG monitoring in the intensive care unit: early findings and clinical efficacy. J Clin Neurophysiol. 1999;16:1-13.
138 Vespa P, Prins M, Ronne-Engstrom E, et al. Increase in extracellular glutamate caused by reduced cerebral perfusion pressure and seizures after human traumatic brain injury: a microdialysis study. J Neurosurg. 1998;89:971-982.
139 Lewelt W, Jenkins LW, Miller JD. Autoregulation of cerebral blood flow after experimental fluid percussion injury of the brain. J Neurosurg. 1980;53:500-506.
140 Chan KH, Miller JD, Dearden NM, et al. The effect of changes in cerebral perfusion pressure upon middle cerebral artery blood flow velocity and jugular bulb venous oxygen saturation after severe brain injury. J Neurosurg. 1992;77:55-61.
141 Miller JD, Becker DP. Secondary insults to the injured brain. J R Coll Surg Edinb. 1982;27:292-298.
142 Piek J, Chestnut RM, Marshall LF, et al. Extracranial complications of severe head injury. J Neurosurg. 1992;77:901-907.
143 Pietropaoli JA, Rogers FB, Shackford SR, et al. The deleterious effects of intraoperative hypotension on outcome in patients with severe head injuries. J Trauma. 1992;33:403-407.
144 Kontos HA, Raper AJ, Patterson JLJr. Analysis of vasoactivity of local pH, PCO2, and bicarbonate on pial vessels. Stroke. 1977;8:358-360.
145 Cold GE. Cerebral blood flow in acute head injury. The regulation of cerebral blood flow and metabolism during the acute phase of head injury, and its significance for therapy. Acta Neurochir Suppl. 1990;49:1-64.
146 Lassen NA, Palvolgyi R. Cerebral steal during hypercarbia and the inverse reaction during hypocapnia observed by the (133xenon) technique in man. Scand J Clin Lab Invest. 1968;102(Suppl):D.
147 Cold GE. Measurements of CO2 reactivity and barbiturate reactivity in patients with severe head injury. Acta Neurochir (Wien). 1989;98:153-163.
148 Cold GE. Does acute hyperventilation provoke cerebral oligemia in comatose patients after acute head injury? Acta Neurochir (Wien). 1989;96:100-106.
149 Stringer WA, Hasso AN, Thompson JR, et al. Hyperventilation-induced cerebral ischemia in patients with acute brain lesions: Demonstration by xenon CT. AJNR Am J Neuroradiol. 1993;14:475-484.
150 Kerr ME, Zempsky J, Sereika S, et al. Relationship between arterial carbon dioxide and end-tidal carbon dioxide in mechanically ventilated adults with severe head trauma. Crit Care Med. 1996;24:785-790.
151 Kety S, Schmidt CF. The effects of altered arterial tensions of carbon dioxide and oxygen on cerebral oxygen consumption of normal young man. J Clin Invest. 1948;27:484-492.
152 Cohen PJ, Alexander SC, Smith TC, et al. Effects of hypoxia and normocarbia on cerebral blood flow and metabolism in conscious man. J Appl Physiol. 1967;23:183-189.
153 Siesjo BK, Carlsson C, Hagerdal M, et al. Brain metabolism in the critically ill. Crit Care Med. 1976;4:283-294.
154 Lewelt W, Jenkins LW, Miller JD. Effects of experimental fluid-percussion injury of the brain on cerebrovascular reactivity to hypoxia and to hypercapnia. J Neurosurg. 1982;56:332-338.
155 Eisenberg H, Cayard C, Papinicolaou A, et al. The effects of three potentially preventable complications on outcome after severe head injury. In: Ishii S, Nagai H, Brock M, editors. Intracranial Pressure V. Berlin: Springer-Verlag; 1983:549-553.
156 Borgstrom L, Johannsson H, Siesjo BK. The influence of acute normovolemic anemia on cerebral blood flow and oxygen consumption of anesthetized rats. Acta Physiol Scand. 1975;93:505-514.
157 Paulson OB, Parving HE, Olesen J, et al. Influence of carbon monoxide and of hemodilution on cerebral blood flow and blood gases in man. J Appl Physiol. 1973;35:111-116.
158 DeWitt DS, Prough DS, Taylor CL, et al. Reduced cerebral blood flow, oxygen delivery, and electroencephalographic activity after traumatic brain injury and mild hemorrhage in cats. J Neurosurg. 1992;76:812-821.
159 Dietrich WD, Alonso O, Halley M, et al. Delayed posttraumatic brain hyperthermia worsens outcome after fluid percussion brain injury: A light and electron microscopic study in rats. Neurosurgery. 1996;38:533-541.
160 Clifton GL, Jiang JY, Lyeth BG, et al. Marked protection by moderate hypothermia after experimental traumatic brain injury. J Cereb Blood Flow Metab. 1991;11:114-121.
161 Dietrich WD, Alonso O, Busto R, et al. Post-traumatic brain hypothermia reduces histopathological damage following concussive brain injury in the rat. Acta Neuropathol. 1994;87:250-258.
162 Lyeth BG, Jiang JY, Liu S. Behavioral protection by moderate hypothermia initiated after experimental traumatic brain injury. J Neurotrauma. 1993;10:57-64.
163 Mellergard P, Nordstrom CH. Epidural temperature and possible intracerebral temperature gradients in man. Br J Neurosurg. 1990;4:31-38.
164 Sternau LL, Thompson C, Dietrich WD, et al. Intracranial temperature observations in the human brain. J Cereb Blood Flow Metabol.. 1991;11(Suppl 2):123.
165 Verlooy J, Heytens L, Veeckmans G, et al. Intracerebral temperature monitoring in severely head injured patients. Acta Neurochir (Wien). 1995;134:76-78.
166 Mellergard P. Intracerebral temperature in neurosurgical patients: intracerebral temperature gradients and relationships to consciousness level. Surg Neurol. 1995;43:91-95.
167 Rumana CS, Gopinath SP, Uzura M, et al. Brain temperature exceeds rectal temperature in head-injured patients. Crit Care Med. 1998;26:562-567.
168 Rosner MJ, Rosner SD, Johnson AH. Cerebral perfusion pressure: management protocol and clinical results. J Neurosurg. 1995;83:949-962.
169 Robertson CS, Valadka AB, Hannay HJ, et al. Prevention of secondary insults after severe head injury. Crit Care Med. 1999;27:2086-2095.
170 Andrews PJ, Citerio G. Lund therapy—pathophysiology-based therapy or contrived over-interpretation of limited data? Intensive Care Med. 2006;32:1461-1463.
171 Grande PO. The “Lund concept” for the treatment of severe head trauma—physiological principles and clinical application. Intensive Care Med. 2006;32:1475-1484.
172 Rosner MJ, Coley IB. Cerebral perfusion pressure, intracranial pressure, and head elevation. J Neurosurg. 1986;65:636-641.
173 Rosner M. Cerebral perfusion pressure: Link between intracranial pressure and systemic circulation. In: Wood JH, editor. Cerebral Blood Flow. New York: McGraw-Hill; 1987:425-448.
174 Durward QJ, Amacher AL, Del Maestro RF, et al. Cerebral and cardiovascular responses to changes in head elevation in patients with intracranial hypertension. J Neurosurg. 1983;59:938-944.
175 Feldman Z, Kanter MJ, Robertson CS, et al. Effect of head elevation on intracranial pressure, cerebral perfusion pressure, and cerebral blood flow in head-injured patients. J Neurosurg. 1992;76:207-211.
176 Meixensberger J, Baunach S, Amschler J, et al. Influence of body position on tissue-PO2, cerebral perfusion pressure and intracranial pressure in patients with acute brain injury. Neurol Res. 1997;19:249-253.
177 Bloomfield GL, Ridings PC, Blocker CR, et al. Effects of increased intra-abdominal pressure upon intracranial and cerebral perfusion pressure before and after volume expansion. J Trauma. 1996;40:941-943.
178 Bloomfield GL, Dalton JM, Sugerman HJ, et al. Treatment of increasing intracranial pressure secondary to the acute abdominal compartment syndrome in a patient with combined abdominal and head trauma. J Trauma. 1995;39:1168-1170.
179 de Nadal M, Ausina A, Sahuquillo J, et al. Effects on intracranial pressure of fentanyl in severe head injured patients. Acta Neurochir Suppl. 1998;71:10-12.
180 Albanese J, Viviand X, Potie F, et al. Sufentanil, fentanyl, and alfentanil in head trauma patients: a study on cerebral hemodynamics. Crit Care Med. 1999;27:407-411.
181 Tateishi A, Maekawa T, Takeshita H, et al. Diazepam and intracranial pressure. Anesthesiology. 1981;54:335-337.
182 Cotev S, Shalit MN. Effects of diazepam on cerebral blood flow and oxygen uptake after head injury. Anesthesiology. 1975;43:117-122.
183 Griffin JP, Cottrell JE, Shwiry B, et al. Intracranial pressure, mean arterial pressure, and heart rate following midazolam or thiopental in humans with brain tumors. Anesthesiology. 1984;60:491-494.
184 Larsen R, Hilfiker O, Radle J, et al. The effects of midazolam on the general circulation, the cerebral blood flow, and cerebral oxygen consumption in man. Anaesthetist. 1981;30:18-21.
185 Moyer JH, Pontius R, Morris G, et al. Effect of morphine and n-allylnormorphine on cerebral hemodynamics and oxygen metabolism. Circulation. 1957;15:379-384.
186 Sperry RJ, Bailey PL, Reichman MV, et al. Fentanyl and sufentanil increase intracranial pressure in head trauma patients. Anesthesiology. 1992;77:416-420.
187 Moss E, Powell D, Gibson RM, et al. Effects of fentanyl on intracranial pressure and cerebral perfusion pressure during hypocapnia. Br J Anaesth. 1978;50:779-784.
188 Marx W, Shah N, Long C, et al. Sufentanil, alfentanil, and fentanyl: impact on cerebrospinal fluid pressure in patients with brain tumors. J Neurosurg Anesthesiol. 1989;1:3-7.
189 Pinaud M, Lelausque J-N, Chetanneau A, et al. Effect of propofol on cerebral hemodynamics and metabolism in patients with brain trauma. Anesthesiology. 1990;73:404-409.
190 Moss E, Powell D, Gibson RM, et al. Effect of etomidate on intracranial pressure and cerebral perfusion pressure. Br J Anaesth. 1979;51:347-352.
191 Pinaud M, Lelausque JN, Chetanneau A, et al. Effects of Diprivan on cerebral blood flow, intracranial pressure and cerebral metabolism in head injured patients. Ann Fr Anesth Reanim. 1991;10:2-9.
192 Kang TM. Propofol infusion syndrome in critically ill patients. Ann Pharmacother. 2002;36:1453-1456.
193 Aryan HE, Box KW, Ibrahim D, et al. Safety and efficacy of dexmedetomidine in neurosurgical patients. Brain Inj. 2006;20:791-798.
194 Robertson CS, Clifton GL, Taylor AA, et al. Treatment of hypertension associated with head injury. J Neurosurg. 1983;59:445-460.
195 Enevoldsen EM, Jensen JT. Autoregulation and CO2 responses of cerebral blood flow in patients with severe head injury. J Neurosurg. 1978;48:689-703.
196 Durward QJ, Del Maestro RF, Amacher AL, et al. The influence of systemic arterial pressure and intracranial pressure on the development of cerebral vasogenic edema. J Neurosurg. 1983;59:803-809.
197 Changaris DG, McGraw CP, Richardson JD, et al. Correlation of cerebral perfusion pressure and Glasgow Coma Scale to outcome. J Trauma. 1987;27:1007-1013.
198 Cottrell JE, Patel K, Turndorf H, et al. Intracranial pressure changes induced by sodium nitroprusside in patients with intracranial mass lesions. J Neurosurg. 1978;48:329-331.
199 Overgaard J, Skinhoj E. A paradoxical cerebral hemodynamic effect of hydralazine. Stroke. 1975;6:402-404.
200 Tran TY, Dunne IE, German JW. Beta blockers exposure and traumatic brain injury: a literature review. Neurosurg Focus. 2008;25(4):E8.
201 Gokaslan ZL, Villareal C, Robertson CS, et al. Treating hypertension in neurosurgical patients. Congress of Neurological Surgeons Abstracts, Abstract #12. 1991.
202 Sahuquillo J, Robles A, Poca A, et al. [A controlled, double-blind, randomized pilot clinical trial of nicardipine as compared with a placebo in patients with moderate or severe head injury.]. Rev Neurol. 2000;30:401-408.
203 Hsiao AK, Michelson SP, Hedges JR. Emergent intubation and CT scan pathology of blunt trauma patients with Glasgow Coma Scale scores of 3-13. Prehosp Disaster Med. 1993;8:229-236.
204 Kohi YM, Mendelow AD, Teasdale GM, et al. Extracranial insults and outcome in patients with acute head injury—relationship to the Glasgow Coma Scale. Injury. 1984;16:25-29.
205 Price DJE, Murray A. Influence of hypoxia and hypotension on recovery from head injury. Injury. 1972;3:218-224.
206 Levasseur JE, Patterson JL, Ghatak JR, et al. Combined effect of respirator-induced ventilation and superoxide dismutase in experimental brain injury. J Neurosurg. 1989;71:573-577.
207 Carey ME, Sarna GS, Farrell JB, et al. Experimental missile wound to the brain. J Neurosurg. 1989;71:754-764.
208 Levine JE, Becker D, Chun T. Reversal of incipient brain death from head injury apnea at the scene of accidents. N Engl J Med. 1979;301:109.
209 Pfenninger EG, Ahnefeld FW, Kilian J, et al. Behavior of blood gases in patients with craniocerebral trauma at the accident site and at the time of admission to the clinic. Anesthetist. 1987;36:570-576.
210 North JB, Jennett S. Abnormal breathing patterns associated with acute brain damage. Arch Neurol. 1974;31:338-344.
211 Arabi Y, Haddad S, Shirawi N, et al. Early tracheostomy in intensive care trauma patients improves resource utilization: a cohort study and literature review. Crit Care. 2004;8:R347-R352.
212 Ahmed N, Kuo YH. Early versus late tracheostomy in patients with severe traumatic head injury. Surg Infect (Larchmt). 2007;8:343-347.
213 Jennett B. Epilepsy after Nonmissile Head Injuries. London: Heineman; 1975.
214 Annegers JF, Hauser WA, Coan SP, et al. A population-based study of seizures after traumatic brain injuries. N Engl J Med. 1998;338:20-24.
215 Lee ST, Lui TN, Wong CW, et al. Early seizures after severe closed head injury. Can J Neurol Sci. 1997;24:40-43.
216 Young B, Rapp RP, Norton NA, et al. Failure of prophylactically administered phenytoin to prevent early posttraumatic seizures. J Neurosurg. 1983;58:231-235.
217 Tempkin NR, Dikmen SS, Wilensky AJ, et al. A randomized, double-blind study of phenytoin for the prevention of post-traumatic seizures. N Engl J Med. 1990;323:497-502.
218 Jones KE, Puccio AM, Harshman KJ, et al. Levetiracetam versus phenytoin for seizure prophylaxis in severe traumatic brain injury. Neurosurg Focus. 2008;25(4):E3.
219 Vadeboncoeur TF, Davis DP, Ochs M, et al. The ability of paramedics to predict aspiration in patients undergoing prehospital rapid sequence intubation. J Emerg Med. 2006;30:131-136.
220 Rincon-Ferrari MD, Flores-Cordero JM, Leal-Noval SR, et al. Impact of ventilator-associated pneumonia in patients with severe head injury. J Trauma. 2004;57:1234-1240.
221 Acquarolo A, Urli T, Perone G, et al. Antibiotic prophylaxis of early onset pneumonia in critically ill comatose patients. A randomized study. Intensive Care Med. 2005;31:510-516.
222 Sirvent JM, Torres A, El-Ebiary M, et al. Protective effect of intravenously administered cefuroxime against nosocomial pneumonia in patients with structural coma. Am J Respir Crit Care Med. 1997;155:1729-1734.
223 Namen AM, Ely EW, Tatter SB, et al. Predictors of successful extubation in neurosurgical patients. Am J Respir Crit Care Med. 2001;163:658-664.
224 Guidelines for the management of adults with hospital-acquired, ventilator-associated, and healthcare-associated pneumonia. Am J Respir Crit Care Med. 2005;171:388-416.
225 Geerts WH, Code KI, Jay RM, et al. A prospective study of venous thromboembolism after major trauma. N Engl J Med. 1994;331:1601-1606.
226 Knudson MM, Ikossi DG, Khaw L, et al. Thromboembolism after trauma: an analysis of 1602 episodes from the American College of Surgeons National Trauma Data Bank. Ann Surg. 2004;240:490-496.
227 Dennis JW, Menawat S, Von Thron J, et al. Efficacy of deep venous thrombosis prophylaxis in trauma patients and identification of high-risk groups. J Trauma. 1993;35:132-138.
228 Hammond FM, Meighen MJ. Venous thromboembolism in the patient with acute traumatic brain injury: screening, diagnosis, prophylaxis, and treatment issues. J Head Trauma Rehabil. 1998;13:36-50.
229 Bratton SL, Chestnut RM, Ghajar J, et al. Guidelines for the management of severe traumatic brain injury. V. Deep vein thrombosis prophylaxis. J Neurotrauma. 2007;24(Suppl 1):S32-S36.
230 Geerts WH, Pineo GF, Heit JA, et al. Prevention of venous thromboembolism: the Seventh ACCP Conference on Antithrombotic and Thrombolytic Therapy. Chest. 2004;126:338-400S.
231 Cothren CC, Smith WR, Moore EE, et al. Utility of once-daily dose of low-molecular-weight heparin to prevent venous thromboembolism in multisystem trauma patients. World J Surg. 2007;31:98-104.
232 Kamada T, Fusamoto H, Kawano S, et al. Gastrointestinal bleeding following head injury: a clinical study of 433 cases. J Trauma. 1977;17:44-47.
233 Lu WY, Rhoney DH, Boling WB, et al. A review of stress ulcer prophylaxis in the neurosurgical intensive care unit. Neurosurgery. 1997;41:416-425.
234 Alain BB, Wang YJ. Cushing’s ulcer in traumatic brain injury. Chin J Traumatol. 2008;11:114-119.
235 Chan KH, Lai ECS, Tuen H, et al. Prospective double-blind placebo-controlled randomized trial on the use of ranitidine in preventing postoperative gastroduodenal complications in high-risk neurosurgical patients. J Neurosurg. 1995;82:412-417.
236 Tryba M. Sucralfate versus antacids of H2 blockers for stress ulcer prophylaxis: A meta-analysis on efficacy and pneumonia rate. Crit Care Med. 1991;19:942-949.
237 Ecker RD, Wijdicks EF, Wix K, et al. Does famotidine induce thrombocytopenia in neurosurgical patients? J Neurosurg Anesthesiol. 2004;16:291-293.
238 Lau YL, Kenna AP. Posttraumatic meningitis in children. Injury. 1986;17:407-409.
239 Tenny JH. Bacterial infection of the central nervous system in neurosurgery. Neurol Clin. 1986;4:91-114.
240 Baltas I, Tsoulfa S, Sakellariou P, et al. Posttraumatic meningitis: bacteriology, hydrocephalus, and outcome. Neurosurgery. 1994;35:422-426.
241 Clifton GL, Robertson CS, Grossman RG, et al. The metabolic response to severe head injury. J Neurosurg. 1984;60:687-696.
242 Hartl R, Gerber LM, Ni Q, et al. Effect of early nutrition on deaths due to severe traumatic brain injury. J Neurosurg. 2008;109:50-56.
243 Clifton GL, Robertson CS, Choi SC. Assessment of nutritional requirements of head injured patients. J Neurosurg. 1986;64:895-901.
244 Jenkins M, Gottschlich M, Alexander JW, et al. Effect of immediate enteral feeding on the hypermetabolic response following severe burn injury. JPEN J Parenter Enteral Nutr. 1989;13(Suppl 1):128.
245 Inoue S, Epstein MD, Alexander JW. Prevention of yeast translocation across the gut by a single enteral feeding after burn surgery. JPEN J Parenter Enteral Nutr. 1989;13A:565-571.
246 Graham TW, Zadrozny DB, Harrington T. Benefits of early jejunal hyperalimentation in the head-injured patient. Neurosurgery. 1989;25:729-735.
247 Kirby DF, Clifton GL, Turner H, et al. Early enteral nutrition after brain injury by percutaneous endocopic gastrojejunostomy. JPEN J Parenter Enteral Nutr. 1991;15:298-302.
248 Harbrecht BG, Moraca RJ, Saul M, et al. Percutaneous endoscopic gastrostomy reduces total hospital costs in head-injured patients. Am J Surg. 1998;176:311-314.
249 Stevens AM, Then JE, Frock KM, et al. Evaluation of feeding intolerance in patients with pentobarbital-induced coma. Ann Pharmacother. 2008;42:516-522.
250 Vespa P. Cerebral salt wasting after traumatic brain injury: an important critical care treatment issue. Surg Neurol. 2008;69:230-232.
251 Young B, Ott L, Dempsey R, et al. Relationship between admission hyperglycemia and neurologic outcome of severely brain-injured patients. Ann Surg. 1989;210:466-472.
252 Lam AM, Winn HR, Cullen BF, et al. Hyperglycemia and neurological outcome in patients with head injury. J Neurosurg. 1991;75:545-551.
253 Cherian L, Goodman JC, Robertson CS. Hyperglycemia increases brain injury caused by secondary ischemia after cortical impact injury in rats. Crit Care Med. 1997;25:1378-1383.
254 Cherian L, Hannay HJ, Vagner G, et al. Postinjury hyperglycemia increases neurological damage caused by secondary ischemic insults after cortical impact injury. J Neurotrauma. 1998;15:307-322.
255 van den BG, Wouters P, Weekers F, et al. Intensive insulin therapy in the critically ill patients. N Engl J Med. 2001;345:1359-1367.
256 van den BG, Schoonheydt K, Becx P, et al. Insulin therapy protects the central and peripheral nervous system of intensive care patients. Neurology. 2005;64:1348-1353.
257 De La Rosa GD, Donado JH, Restrepo AH, et al. Strict glycaemic control in patients hospitalised in a mixed medical and surgical intensive care unit: a randomised clinical trial. Crit Care. 2008;12:R120.
258 Schneider HJ, Samann PG, Schneider M, et al. Pituitary imaging abnormalities in patients with and without hypopituitarism after traumatic brain injury. J Endocrinol Invest. 2007;30:RC9-RC12.
259 Salehi F, Kovacs K, Scheithauer BW, et al. Histologic study of the human pituitary gland in acute traumatic brain injury. Brain Inj. 2007;21:651-656.
260 Makulski DD, Taber KH, Chiou-Tan FY. Neuroimaging in posttraumatic hypopituitarism. J Comput Assist Tomogr. 2008;32:324-328.
261 Benvenga S, Campenni A, Ruggeri RM, et al. Clinical review 113: Hypopituitarism secondary to head trauma. J Clin Endocrinol Metab. 2000;85:1353-1361.
262 Schneider HJ, Schneider M, Saller B, et al. Prevalence of anterior pituitary insufficiency 3 and 12 months after traumatic brain injury. Eur J Endocrinol. 2006;154:259-265.
263 Cohan P, Wang C, McArthur DL, et al. Acute secondary adrenal insufficiency after traumatic brain injury: a prospective study. Crit Care Med. 2005;33:2358-2366.
264 Llompart-Pou JA, Perez-Barcena J, Raurich JM, et al. Effect of barbiturate coma on adrenal response in patients with traumatic brain injury. J Endocrinol Invest. 2007;30:393-398.
265 Schneider HJ, Stalla GK, Buchfelder M. Expert meeting: hypopituitarism after traumatic brain injury and subarachnoid haemorrhage. Acta Neurochir (Wien). 2006;148:449-456.
266 Ghigo E, Masel B, Aimaretti G, et al. Consensus guidelines on screening for hypopituitarism following traumatic brain injury. Brain Inj. 2005;19:711-724.
267 Schneider HJ, Kreitschmann-Andermahr I, Ghigo E, et al. Hypothalamopituitary dysfunction following traumatic brain injury and aneurysmal subarachnoid hemorrhage: a systematic review. JAMA. 2007;298:1429-1438.
268 Meixensberger J, Roosen K. Clinical and pathophysiological significance of severe neurotrauma in polytraumatized patients. Langenbecks Arch Surg. 1998;383:214-219.
269 McKee MD, Schemitsch EH, Vincent LO, et al. The effect of a femoral fracture on concomitant closed head injury in patients with multiple injuries. J Trauma. 1997;42:1041-1045.
270 Poole GV, Miller JD, Agnew SG, et al. Lower extremity fracture fixation in head-injured patients. J Trauma. 1992;32:654-659.
271 Kalb DC, Ney AL, Rodriguez JL, et al. Assessment of the relationship between timing of fixation of the fracture and secondary brain injury in patients with multiple trauma. Surgery. 1998;124:739-744.
272 Hsiang J, Chesnut RM, Crisp CB, et al. Early, routine paralysis for ICP control in severe head injury: Is it necessary? Crit Care Med. 1994;22:1471-1476.
273 Stirt JA, Grosslight KR, Bedford RF, et al. “Defasciculation” with metocurine prevents succinylcholine induced increases in intracranial pressure. Anesthesiology. 1987;67:50-53.
274 Lanier WL, Milde JH, Michenfelder JD. Cerebral stimulation following succinylcholine in dogs. Anesthesiology. 1986;64:551-559.
275 Tarkkanen L, Laitinen L, Johansson G. Effects of D-tubocurarine on intracranial pressure and thalamic electrical impedance. Anesthesiology. 1975;40:247-251.
276 Vesely R, Hoffman WE, Gil KSL. Cerebrovascular effects of curare and histamine in the rat. Anesthesiology. 1986;65:A336.
277 Lanier WL, Milde JH, Michenfelder JD. The cerebral effects of pancuronium and atracurium in halothane anesthetized dogs. Anesthesiology. 1985;63:587-597.
278 Griffin JP, Litwak B, Cottrell JE, et al. Intracranial pressure, mean arterial pressure, and heart rate after rapid paralysis with atracurium in cats. Can Anaesth Soc J. 1985;32:618-621.
279 Minton MD, Stirt JA, Bedford RF, et al. Intracranial pressure after atracurium in neurosurgical patients. Anesth Analg. 1985;64:1113-1116.
280 Rosa G, Orfei P, Sanfilippo M, et al. The effects of atracurium besylate (Tracrium) on intracranial pressure and cerebral perfusion pressure. Anesth Analg. 1986;65:381-384.
281 Rosa G, Sanfilippo M, Viardi V, et al. Effects of vecuronium bromide on intracranial pressure and cerebral perfusion pressure. Br J Anaesth. 1986;58:437-440.
282 Rosa G, Sanfilippo M, Orfei P, et al. The effects of pipecuronium bromide on intracranial pressure and cerebral perfusion pressure. J Neurosurg Anesthesiol. 1991;3:253-257.
283 Stirt JA, Maggio W, Haworth C, et al. Vecuronium: effect on intracranial pressure and hemodynamics in neurosurgical patients. Anesthesiology. 1987;67:570-573.
284 Lauer KK, Connolly LA, Schmeling WT. Opioid sedation does not alter intracranial pressure in head injured patients. Can J Anaesth. 1997;44:929-933.
285 Schramm WM, Jesenko R, Bartunek A, et al. Effects of cisatracurium on cerebral and cardiovascular hemodynamics in patients with severe brain injury. Acta Anaesthesiol Scand. 1997;41:1319-1323.
286 MacFarlane I, Rosenthal F. Severe myopathy after status asthmaticus. Lancet. 1977;2:615-616.
287 Douglass JA, Tuxen DV, Horne M, et al. Myopathy in severe asthma. Am Rev Respir Dis. 1992;148:817-819.
288 Nates JL, Cooper DJ, Day B, et al. Acute weakness syndromes in critically ill patients—a reappraisal. Anaesth Intensive Care. 1997;25:502-513.
289 Zochodne DW, Bolton CF, Wells GA, et al. Critical illness polyneuropathy. Brain. 1987;110:819-842.
290 Latronico N, Rasulo FA, Recupero D, et al. Acute quadriplegia with delayed onset and rapid recovery. J Neurosurg. 1998;88:769-772.
291 Hayes C, Robertson CS, Narayan RK, et al. The effect of hyperventilation on cerebral blood flow in head injured patients. American Association of Neurological Surgeons Abstract #1271. 1992.
292 Muizelaar JP, Marmarou A, Ward JD, et al. Adverse effects of prolonged hyperventilation in patients with severe head injury: a randomized clinical trial. J Neurosurg. 1991;75:731-739.
293 Muizelaar JP, van der Poel HG, Li ZC, et al. Pial artery diameter and CO2 reactivity during prolonged hyperventilation in the rabbit. J Neurosurg. 1988;69:923-927.
294 Ghajar JB, Hariri R, Patterson RH. Improved outcome from traumatic coma using only ventricular CSF drainage for ICP control. Adv Neurosurg. 1993;21:173-177.
295 Robertson CS, Clifton GL, Grossman RG. Oxygen utilization and cardiovascular function in head-injured patients. Neurosurgery. 1984;15:307-314.
296 Knapp JM. Hyperosmolar therapy in the treatment of severe head injury in children: mannitol and hypertonic saline. AACN Clin Issues. 2005;16:199-211.
297 Battison C, Andrews PJ, Graham C, et al. Randomized, controlled trial on the effect of a 20% mannitol solution and a 7.5% saline/6% dextran solution on increased intracranial pressure after brain injury. Crit Care Med. 2005;33:196-202.
298 Vialet R, Albanese J, Thomachot L, et al. Isovolume hypertonic solutes (sodium chloride or mannitol) in the treatment of refractory posttraumatic intracranial hypertension: 2 mL/kg 7.5% saline is more effective than 2 mL/kg 20% mannitol. Crit Care Med. 2003;31:1683-1687.
299 Pascual JL, Maloney-Wilensky E, Reilly PM, et al. Resuscitation of hypotensive head-injured patients: is hypertonic saline the answer? Am Surg. 2008;74:253-259.
300 Cooper DJ, Myles PS, McDermott FT, et al. Prehospital hypertonic saline resuscitation of patients with hypotension and severe traumatic brain injury: a randomized controlled trial. JAMA. 2004;291:1350-1357.
301 Doyle JA, Davis DP, Hoyt DB. The use of hypertonic saline in the treatment of traumatic brain injury. J Trauma. 2001;50:367-383.
302 Rea GL, Rockswold GL. Barbiturate therapy in uncontrolled intracranial hypertension. Neurosurgery. 1983;12:401-404.
303 Lee MW, Deppe SA, Sipperly ME, et al. The efficacy of barbiturate coma in the management of uncontrolled intracranial hypertension following neurosurgical trauma. J Neurotrauma. 1994;11:325-331.
304 Goodman JC, Valadka AB, Gopinath SP, et al. Lactate and excitatory amino acids measured by microdialysis are decreased by pentobarbital coma in head-injured patients. J Neurotrauma. 1996;13:549-556.
305 Schwartz ML, Tator CH, Rowed DW, et al. The University of Toronto Head Injury Treatment Study: A prospective, randomized comparison of pentobarbital and mannitol. Can J Neurol Sci. 1984;11:434-440.
306 Ward JD, Becker DP, Miller JD, et al. Failure of prophylactic barbiturate coma in the treatment of severe head injury. J Neurosurg. 1985;62:383-388.
307 Eisenberg HM, Frankowski RF, Contant CF, et al. High-dose barbiturate control of elevated intracranial pressure in patients with severe head injury. J Neurosurg. 1988;69:15-23.
308 Winer JW, Rosenwasser RH, Jimenez F. Electroencephalographic activity and serum and cerebrospinal fluid pentobarbital levels in determining the therapeutic endpoint during barbiturate coma. Neurosurgery. 1991;29:739-742.
309 Sato M, Niiyama K, Kuroda R, et al. Influence of dopamine on cerebral blood flow, and metabolism for oxygen and glucose under barbiturate administration in cats. Acta Neurochir (Wien). 1991;110:174-180.
310 Messeter K, Nordstrom CH, Sundbarg G, et al. Cerebral hemodynamics in patients with acute severe head trauma. J Neurosurg. 1986;64:231-237.
311 Cruz J. Adverse effects of pentobarbital on cerebral venous oxygenation of comatose patients with acute traumatic brain swelling: relationship to outcome. J Neurosurg. 1996;85:758-761.
312 Schalen W, Messeter K, Nordstrom CH. Complications and side effects during thiopentone therapy in patients with severe head injuries. Acta Anaesthesiol Scand. 1992;36:369-377.
313 Cormio M, Gopinath SP, Valadka AB, et al. Cerebral hemodynamic effects of pentobarbital coma in head injured patients. J Neurotrauma. 1999;16:927-936.
314 Smith SL, Hall ED. Mild pre- and posttraumatic hypothermia attenuates blood-brain barrier damage following controlled cortical impact injury in the rat. J Neurotrauma. 1996;13:1-9.
315 McIntyre LA, Fergusson DA, Hebert PC, et al. Prolonged therapeutic hypothermia after traumatic brain injury in adults: a systematic review. JAMA. 2003;289:2992-2999.
316 Aibiki M, Maekawa S, Yokono S. Moderate hypothermia improves imbalances of thromboxane A2 and prostaglandin I2 production after traumatic brain injury in humans. Crit Care Med. 2000;28:3902-3906.
317 Clifton GL, Allen S, Barrodale P, et al. A phase II study of moderate hypothermia in severe brain injury. J Neurotrauma. 1993;10:263-271.
318 Jiang J, Yu M, Zhu C. Effect of long-term mild hypothermia therapy in patients with severe traumatic brain injury: 1-year follow-up review of 87 cases. J Neurosurg. 2000;93:546-549.
319 Marion DW, Penrod LE, Kelsey SF, et al. Treatment of traumatic brain injury with moderate hypothermia. N Engl J Med. 1997;336:540-546.
320 Qiu WS, Liu WG, Shen H, et al. Therapeutic effect of mild hypothermia on severe traumatic head injury. Chin J Traumatol. 2005;8:27-32.
321 Bratton SL, Chestnut RM, Ghajar J, et al. Guidelines for the management of severe traumatic brain injury. III. Prophylactic hypothermia. J Neurotrauma. 2007;24(Suppl 1):S21-S25.
322 Christian E, Zada G, Sung G, Giannotta SL. A review of selective hypothermia in the management of traumatic brain injury. Neurosurg Focus. 2008;25(4):E9.
323 Taylor A, Butt W, Rosenfeld J, et al. A randomized trial of very early decompressive craniectomy in children with traumatic brain injury and sustained intracranial hypertension. Childs Nerv Syst. 2001;17:154-162.
324 Aarabi B, Hesdorffer DC, Ahn ES, et al. Outcome following decompressive craniectomy for malignant swelling due to severe head injury. J Neurosurg. 2006;104:469-479.
325 Polin RS, Shaffrey ME, Bogaev CA, et al. Decompressive bifrontal craniectomy in the treatment of severe refractory posttraumatic cerebral edema. Neurosurgery. 1997;41:84-94.
326 Stiefel MF, Heuer GG, Smith MJ, et al. Cerebral oxygenation following decompressive hemicraniectomy for the treatment of refractory intracranial hypertension. J Neurosurg. 2004;101:241-247.
327 Bor-Seng-Shu E, Hirsch R, Teixeira MJ, et al. Cerebral hemodynamic changes gauged by transcranial Doppler ultrasonography in patients with posttraumatic brain swelling treated by surgical decompression. J Neurosurg. 2006;104:93-100.
328 Morgalla MH, Will BE, Roser F, et al. Do long-term results justify decompressive craniectomy after severe traumatic brain injury? J Neurosurg. 2008;109:685-690.
329 Hutchinson PJ, Corteen E, Czosnyka M, et al. Decompressive craniectomy in traumatic brain injury: the randomized multicenter RESCUEicp study (www.RESCUEicp.com). Acta Neurochir Suppl. 2006;96:17-20. 17-20
330 Kee DB, Wood JH. Rheology of the cerebral circulation. Neurosurgery. 1984;15:125-131.
331 Menzel M, Doppenberg EMR, Zauner A, et al. Increased inspired oxygen concentration as a factor in improved brain tissue oxygenation and tissue lactate levels after severe human head injury. J Neurosurg. 1999;91:1-10.
332 Von Esson C, Zervas NT, Brown DR, et al. Local cerebral blood flow in the dog during intravenous infusion of dopamine. Surg Neurol. 1980;13:181-188.
333 Myburgh JA, Upton RN, Grant C, et al. A comparison of the effects of norepinephrine, epinephrine, and dopamine on cerebral blood flow and oxygen utilisation. Acta Neurochir Suppl. 1998;71:19-21.
334 Darby JM, Yonas H, Marks EC, et al. Acute cerebral blood flow response to dopamine-induced hypertension after subarachnoid hemorrhage. J Neurosurg. 1994;80:857-864.
335 Finfer S, Bellomo R, Boyce N, et al. A comparison of albumin and saline for fluid resuscitation in the intensive care unit. N Engl J Med. 2004;350:2247-2256.
336 Myburgh J, Cooper DJ, Finfer S, et al. Saline or albumin for fluid resuscitation in patients with traumatic brain injury. N Engl J Med. 2007;357:874-884.
337 Vassar MJ, Fisher RP, O’Brien PE, et al. A multicenter trial for resuscitation of injured patients with 7.5% sodium chloride. The effect of added dextran-70. Arch Surg. 1993;128:1003-1011.
338 Illingworth G, Jennett B. The shocked head injury. Lancet. 1965;2:511-514.
339 Apuzzo ML, Weiss MH, Petersons V, et al. Effects of positive end-expiratory pressure ventilation on intracranial pressure in man. J Neurosurg. 1977;46:227-232.
340 Shapiro HM, Marshall LF. Intracranial pressure response to PEEP in head-injured patients. J Trauma. 1978;18:254-256.
341 Frost EA. Effect of positive end-expiratory pressure on intracranial pressure and compliance in brain-injured patients. J Neurosurg. 1977;47:195-200.
342 Aidinis AJ, Lafferty J, Shapiro HM. Intracranial responses to PEEP. Anesthesiology. 1976;45:275-286.
343 Huseby JS, Luce JM, Cary JM, et al. Effects of positive end-expiratory pressure on intracranial pressure in dogs with intracranial hypertension. J Neurosurg. 1981;55:704-705.
344 Papo I, Caruselli G. The effects on intracranial pressure of stopping controlled ventilation in patients with severe head injury. Neurochirurgia. 1978;21:157-163.
345 Smith MJ, Stiefel MF, Magge S, et al. Packed red blood cell transfusion increases local cerebral oxygenation. Crit Care Med. 2005;33:1104-1108.
346 Pendem S, Rana S, Manno EM, et al. A review of red cell transfusion in the neurological intensive care unit. Neurocrit Care. 2006;4:63-67.
347 Harders A, Kakarieka A, Braakman R. Traumatic subarachnoid hemorrhage and its treatment with nimodipine: German tSAH Study Group. J Neurosurg. 1996;85:82-89.
APPENDIX Form for Neurosurgical Intensive Care Unit Admission
| Admit to: Neurosurgical ICU_ Attending: _______________________________ Service: Neurosurgery | |
| Diagnosis: | |
Condition:  GOOD GOOD  FAIR FAIR  GUARDED GUARDED  CRITICAL CRITICAL |
|
| Allergies: | |
| Vital Signs: 1. Record body weight on admission | |
| 2. Monitor continuously and record every hour: | |
 ECG, HR, Rectal temperature, ABP, MAP, ICP, SpO2 ECG, HR, Rectal temperature, ABP, MAP, ICP, SpO2 |
|
 Petco2, SjvO2, PbtO2, Brain temperature Petco2, SjvO2, PbtO2, Brain temperature |
|
 CVP CVP |
|
 PAP PAP |
|
| 3. Record every 4 hours: | |
 PWP and cardiac output PWP and cardiac output |
|
| 4. GCS and pupils hourly and inform MD of changes | |
| 5. Call MD for MAP <80 mm Hg, CPP <60 mm Hg, PbtO2 <10 mmHg, or SjvO2 <50% | |
Nursing:  Strict I&O Strict I&O  Foley to gravity Foley to gravity  NG to low continuous wall suction NG to low continuous wall suction  Oral care every shift Oral care every shift |
|
 ICP catheter to monitor, drain CSF 10-20 drops for ICP >20 mm Hg ICP catheter to monitor, drain CSF 10-20 drops for ICP >20 mm Hg |
|
 Calibrate SjvO2 catheter every 12 hours; recalibrate PRN if <50. Call MD if <50% after calibration. Calibrate SjvO2 catheter every 12 hours; recalibrate PRN if <50. Call MD if <50% after calibration. |
|
 Keep cervical collar on at all times Keep cervical collar on at all times |
|
Activity:  HOB >30° HOB >30°  Bed rest Bed rest  OOB every shift as tolerated OOB every shift as tolerated  Spinal precautions Spinal precautions |
|
 Logroll only Logroll only  Ad lib Ad lib  Other: ________________________ Other: ________________________ |
|
Diet:  NPO NPO  NPO except medications NPO except medications  Clear liquids Clear liquids  Regular Regular  Other: ______________ Other: ______________ |
|
IV Fluids: _____(initials)  NS + 20 mEq KCl/L @ _____ mL/hr NS + 20 mEq KCl/L @ _____ mL/hr |
|
_____(initials)  NS 1 L with 100 mg thiamine, 1 mg folate, 10 mL MVI @ _____mL/hr × 1 bag NS 1 L with 100 mg thiamine, 1 mg folate, 10 mL MVI @ _____mL/hr × 1 bag |
|
_____(initials)  Other: ____________________________________________________ Other: ____________________________________________________ |
|
Radiology:  Portable CXR on admission Indications: ___________________ Portable CXR on admission Indications: ___________________ |
|
 Portable CXR every morning Indications: Intubation Portable CXR every morning Indications: Intubation |
|
 Lateral C-spine x-ray Indications: placement of SjvO2 catheter Lateral C-spine x-ray Indications: placement of SjvO2 catheter |
|
 Xenon CT Indications: head trauma Xenon CT Indications: head trauma |
|
 Other: _______________________ Indications: ____________________ Other: _______________________ Indications: ____________________ |
|
 Other: _______________________ Indications: ____________________ Other: _______________________ Indications: ____________________ |
|
Admission laboratory tests:  CBC CBC  BMP BMP  LFT LFT  PTT PTT  PT/INR PT/INR  ABG ABG  Serum alcohol Serum alcohol  Urine toxicology screen Urine toxicology screen |
|
 Type/screen Type/screen  Type/crossmatch ___ units PRBC ___ units FFP ___ units platelets Type/crossmatch ___ units PRBC ___ units FFP ___ units platelets |
|
 Hemoglobin/hematocrit every ___ hours Hemoglobin/hematocrit every ___ hours |
|
 Urine pregnancy test Urine pregnancy test |
|
 Other: ____________________________________ Other: ____________________________________ |
|
 Other: ____________________________________ Other: ____________________________________ |
|
Daily AM laboratory tests:  CBC CBC  BMP BMP  ABG ABG  Other: ________________ Other: ________________  Other: _________________ Other: _________________ |
|
Respiratory:  O2 per _________ @ ____L/min. Titrate to keep SpO2 > ____ O2 per _________ @ ____L/min. Titrate to keep SpO2 > ____ |
|
 Ventilator: Mode Ventilator: Mode  AC AC  SIMV SIMV  Bilevel (____high ____low) PS/CPAP___ Bilevel (____high ____low) PS/CPAP___ |
|
| Rate _____ Tidal volume ____ PS ____ PEEP ____ FIO2 _____ | |
| Scheduled Medications: | |
| _____(initials) Phenytoin, 1000 mg IV piggyback now over 1-hr period | |
| _____(initials) Phenytoin, 100 mg IV push every 8 hr | |
| _____(initials) Esomeprazole, 40 mg IV piggyback every day | |
| _____(initials) Folate, 1 mg PO every day | |
| _____(initials) Iron sulfate, 325 mg per Dobbhoff tube 3 times per day (after Dobbhoff tube is placed) | |
| _____(initials) Artificial tears ointment to both eyes every 4 hr | |
| _____(initials) Docusate sodium, 100 mg PO/NGT twice a day | |
| _____(initials) Other:_________________________________________ | |
| _____(initials) Other:_________________________________________ | |
| _____(initials) Other:_________________________________________ | |
| PRN Medications: | |
| _____(initials) Morphine sulfate, 10 mg IV push every hr PRN for ICP >20 mm Hg or agitation | |
| _____(initials) Lorazepam, 2 mg IV push every 6 hr PRN for ICP >20 mm Hg or agitation | |
| _____(initials) Cisatracurium besylate, 10 mg IV push every hr PRN for ICP >20 mm Hg or agitation | |
| _____(initials) Acetaminophen, 650 mg PO or rectally every 6 hr PRN for temperature >100.5°F | |
| _____(initials) Mannitol, 25 g IV push every 2 hr PRN for ICP >20 mm Hg after sedation and CSF drainage | |
| _____(initials) Artificial tear ointment to both eyes PRN for dry eyes | |
| _____(initials) Bisacodyl suppository, 1 per rectum daily PRN for constipation | |
| _____(initials) Other:_________________________________________ | |
| _____(initials) Other:_________________________________________ | |
| _____(initials) Other:_________________________________________ | |
| DVT/PE Prophylaxis: | |
 TEDS TEDS  bilateral SVCDs bilateral SVCDs |
|
 Lovenox, 30 mg SQ every 12 hr, OR Lovenox, 30 mg SQ every 12 hr, OR  contraindication to heparin: ______________________ contraindication to heparin: ______________________ |
ABG, arterial blood gases; ABP, arterial blood pressure; AC, assist/control; BMP, basic metabolic panel; CBC, complete blood count; CPAP, continuous positive airway pressure; CPP, cerebral perfusion pressure; CSF, cerebrospinal fluid; CT, computed tomography; CVP, central venous pressure; CXR, chest x-ray; DVT, deep venous thrombosis; ECG, electrocardiogram; FFP, fresh frozen plasma; FIO2, fraction of inspired oxygen; GCS, Glasgow Coma Scale score; HOB, head of bed; HR, heart rate; ICP, intracranial pressure; ICU, intensive care unit; I&O, input and output; INR, international normalized ratio; IV, intravenous; LFT, liver function tests; MAP, mean arterial pressure; MVI, multivitamin infusion; NG, nasogastric; NGT, nasogastric tube; NPO, nothing by mouth; NS, normal saline; OOB, out of bed; PAP, peak airway pressure; PRBC, packed red blood cells; PbtO2, partial brain tissue oxygen pressure; PE, pulmonary embolism; PEEP, positive end-expiratory pressure; Petco2, partial end-tidal carbon dioxide pressure; PO, orally; PRN, as needed; PS, pressure support; PT, prothrombin time; PTT, partial thromboplastin time; PWP, pulmonary wedge pressure; SIMV, synchronized intermittent mandatory ventilation; SpO2, oxygen saturation measured by pulse oximetry; SjvO2, jugular venous oxygen saturation; SVCD, sequential venous compression device; TBI, traumatic brain injury; TEDS, antiembolism stockings.
[/level-membership-for-neurosurgery-category][not-level-membership-for-neurosurgery-category]
CHAPTER 334 Critical Care Management of Traumatic Brain Injury
Traumatic brain injury (TBI) is a leading cause of death and disability worldwide. Every year, about 1.5 million affected people die and several millions receive emergency treatment after TBI. Fatality and disability rates depend on the severity and mechanisms of the TBI, but unfavorable outcomes (death, vegetative state, and severe disability) can occur in more than 20% of affected patients after TBI.1
The damage to the brain that occurs after traumatic injury is usually divided into two general types, primary and secondary (Fig. 334-1). The primary injury occurs before arrival at the hospital and, other than trauma preventive programs, cannot be modified by the physicians treating the individual patient. The severity of the primary injury, however, can be classified and quantified for prognostic purposes, and the primary injury often initiates a cascade of secondary injury processes that evolve over the first few postinjury days. Individual characteristics, including age, preinjury health, and certain genetic factors, can also alter the primary injury and subsequent response to the injury. For example, the ε4 allele of the apolipoprotein E gene is a genetic variant that has been associated with a worse outcome after TBI.2 The injured brain is exquisitely sensitive to ischemia, and secondary ischemic insults can additionally damage the brain. Pharmacologic treatment of these secondary injury processes and modern emergency and critical care management to prevent secondary ischemic insults are the primary goals of the early treatment of TBI.
History of Head Trauma Management
Coma Data Banks
The International Data Bank, which consisted of prospectively collected clinical information on 1000 comatose patients from three centers in Scotland, the Netherlands, and the United States, was reported in 1979.3 These investigators developed simple but practical scales for the assessment of coma (the Glasgow Coma Scale [GCS], Table 334-1) and for the assessment of neurological outcome (the Glasgow Outcome Scale [GOS], Table 334-2) and presented some of the early work on factors that determine outcome after neurological injury.4,5 It was apparent from these studies that the outcome after severe head injury was dependent on the severity and type of the primary injury.
TABLE 334-1 Glasgow Coma Scale for Assessment of Coma and Impaired Consciousness
| EYE OPENING | BEST MOTOR RESPONSE | BEST VERBAL RESPONSE |
|---|---|---|
| 4 = Spontaneous | 6 = Obeying | 5 = Oriented |
| 3 = To speech | 5 = Localizing | 4 = Confused |
| 2 = To pain | 4 = Withdrawing | 3 = Inappropriate |
| 1 = None | 3 = Flexing | 2 = Incomprehensible |
| 2 = Extending | 1 = None | |
| 1 = None |
Data from Teasdale G, Jennett B. Assessment of coma and impaired consciousness. Lancet. 1974;2:81-84.
TABLE 334-2 Glasgow Outcome Scale (Original 5-Point Scale and Extended 8-Point Scale) for Assessment of Outcome
| SUMMARY | GLASGOW OUTCOME SCALE | EXTENDED GLASGOW OUTCOME SCALE |
|---|---|---|
| 1 = Dead | 1 = Dead | |
| Sleep/awake, nonsentient | 2 = Persistent vegetative state | 2 = Persistent vegetative state |
| Conscious but dependent | 3 = Severe disability | 3 = Lower severe disability |
| 4 = Upper severe disability | ||
| Independent but disabled | 4 = Moderate disability | 5 = Lower moderate disability |
| 6 = Upper moderate disability | ||
| May have mild residual effects | 5 = Good recovery | 7 = Lower good recovery |
| 8 = Upper good recovery |
Data from Jennett B, Bond MR. Assessment of outcome after severe brain damage. Lancet. 1975;1:480-484; and Wilson JT, Pettigrew LE, Teasdale GM. Structured interviews for the Glasgow Outcome Scale and the extended Glasgow Outcome Scale: Guidelines for their use. J Neurotrauma. 1998;15:573-585.
The Traumatic Coma Data Bank (TCDB) consists of prospectively collected clinical data on 1030 comatose patients from four centers in the United States.6 As part of this study, reported initially in 1991, and work from other individual head injury centers, the critical role of prehospital insults such as hypoxia and hypotension, the importance of prompt evacuation of intracranial mass lesions, and the importance of intracranial hypertension were more clearly identified.7–9 In addition, a new classification of the primary injury based on CT scan findings (the Marshall CT classification) was developed from the TCDB data.10
The International Mission for Prognosis and Clinical Trial (IMPACT) database contains the data collected from most TBI clinical trials conducted over the past 20 years. The database contains information on 9205 patients with severe and moderate TBI from eight randomized placebo-controlled trials and three observational studies. The major emphasis during the first phase of the study was on information from the time of injury to the postresuscitation period and outcome at 6 months, thus providing a unique resource for prognostic analysis.11 Using univariate and multivariate analysis, it was found that the most powerful independent prognostic variables were age, GCS motor score, pupil response, CT scan characteristics (including the Marshall CT classification) traumatic subarachnoid hemorrhage (SAH), and prothrombin time. Other important prognostic factors were hypotension, hypoxia, the eye and verbal components of the GCS, glucose, platelets, and hemoglobin. These results suggest the need for further research, including evaluation of the clinical impact of intervening aggressively to correct abnormalities in hemoglobin, glucose, and coagulation. The combination of prognostic factors also provides a solid foundation for estimation of the probability of each GOS category at 6 months for individual TBI patients.12
Traumatic Brian Injury Guidelines
In 2007, a joint undertaking of the Brain Trauma Foundation and the American Association of Neurological Surgeons (AANS), the Congress of Neurological Surgeons (CNS), and the AANS/CNS Joint Section on Neurotrauma and Critical Care updated evidence-based guidelines for the management of severe TBI.13,14 In this third edition, six new topics were added and two were assigned to the prehospital guidelines. The levels of recommendation were changed from “standard, guideline, and option” to “level I, level II, and level III,” respectively. The purpose of the guidelines was to provide not only a road map for improving treatment but also a template for future research so that a sufficient body of class I and II studies for level I and II recommendations in the fourth edition could be generated. The main recommendations from the third edition of the “Guidelines for the Management of Traumatic Brain Injury” are summarized in Table 334-3.
Multicenter Clinical Trials
Laboratory studies have provided a better understanding of the basic mechanisms of secondary injury to the brain after trauma. Anticholinergic agents, corticosteroids, calcium channel antagonists, free radical scavengers, NMDA receptor antagonists, bradykinin antagonists, and moderate hypothermia have all been studied in experimental head injury models and found to have beneficial effects. A number of potentially beneficial therapies derived from these laboratory studies have been tested in phase III clinical trials. As reviewed by Bullock and associates, a number of pitfalls can be encountered in taking a treatment from the laboratory to a successful clinical trial.15
The heterogeneity of TBI is considered one of the most significant barriers to translating effective therapeutic interventions from the laboratory to the clinical setting. The National Institute of Neurological Disorders and Stroke, in collaboration with other associations, including the Brain Injury Association of America, convened a workshop to outline a classification system for TBI. They proposed that a new multidimensional classification system be developed for TBI clinical trials and that preclinical models are vital in establishing the pathophysiologic mechanisms relevant to specific pathoanatomic types of TBI. Evaluation of targeted therapies for specific pathoanatomic lesions will probably require the inclusion of less severely injured patients with more homogeneous injuries.16
Pathophysiology of Traumatic Brain Injury
Primary Brain Injury
Two pathologic processes are uniquely characteristic of trauma: diffuse axonal injury (DAI) and contusion/hematoma formation. Diffuse injures are more common. In the TCDB series, 56% of patients with severe closed head injury had a diffuse injury and 42% had a focal mass lesion. However, the mortality rate is generally higher with a focal lesion, 39% versus 24% with a diffuse injury.6
Diffuse Axonal Injury
Histopathologic findings of DAI have been observed in 25% of patients who die of TBI.17 When more sensitive indicators of axonal injury are used, such as β-amyloid immunohistochemistry, as many as 90% of patients who die of TBI have DAI changes.18 Current thought about the development of DAI is that axotomy may not be complete immediately after the trauma. Secondary or delayed axotomy may predominate in many circumstances.
DAI is primarily a pathologic diagnosis, with microscopic damage scattered throughout the brain, but clinical correlations have been described. Traumatic loss of consciousness for less than 6 hours is considered a concussion and is usually associated with amnesia for the events related to the injury. Traumatic coma for longer than 6 hours is generally attributed to DAI. Three levels of DAI severity based on clinical criteria are recognized: (1) mild DAI—coma of 6 to 24 hours’ duration; (2) moderate DAI—coma lasting longer than 24 hours without decerebrate posturing; and (3) severe DAI—coma lasting longer than 24 hours with decerebrate posturing or flaccidity. Severe DAI has a 50% mortality.19
Hematomas/Contusions
Subdural hematoma is the most common focal intracranial lesion and occurred in 24% of patients in the TCDB with severe closed head injury.6 The hematoma is located between the dura and brain, usually results from a torn bridging vein between the cortex and draining sinuses, and is typically situated in the frontoparietal region. An acute subdural hematoma, identified within 72 hours after trauma, generally appears on CT as a high-density, homogeneous crescent-shaped mass paralleling the calvaria (Fig. 334-2). However, up to 10% of acute subdural hematomas may be isodense with brain because of the low hemoglobin content.20
The mortality rate in patients with subdural hematomas is high.21 The following CT scan findings are particularly predictive of outcome: hematoma thickness, midline shift, the presence of underlying brain swelling or contusions,22,23 obliteration of the basal cisterns, and the presence of traumatic SAH.21
Subdural hematomas cause brain damage by increasing intracranial pressure (ICP) and by shifting brain structures. Reductions in cerebral blood flow (CBF) below ischemic thresholds24 and marked reductions in cerebral oxygenation25,26 have been observed preoperatively and are rapidly reversed by surgical evacuation of the hematoma. The presence of blood in the subdural space may also have direct toxic effects, but experimental studies have not consistently demonstrated this mechanism.27
The primary treatment of subdural hematoma is prompt surgical evacuation, and the longer the delay between injury and surgery, the more severe the ischemic damage that can occur. Surgical indications for acute subdural hematoma include (1) any subdural hematoma greater than 10 mm in thickness or with a midline shift of greater than 5 mm and (2) a subdural hematoma less than 10 mm in thickness and with a midline shift of less than 5 mm if the GCS score is less than 9 and decreases 2 or more points between the time of injury and hospital admission, asymmetric or fixed and dilated pupils, or ICP exceeding 20 mm Hg.28 Mortality in patients arriving at the hospital in coma with subsequent surgical evacuation is between 57% and 68%.28
Epidural hematomas, or collections of blood between the skull and the dura, are less common than subdural hematomas. Epidural hematomas occurred in 6% of patients with severe closed head injuries in the TCDB series.6 Although patients with subdural hematomas are generally comatose immediately, only a third of patients with epidural hematomas are unconscious from the time of injury, a third have a lucid interval, and a third are never unconscious.29 An epidural hematoma is almost always associated with a skull fracture (91% in adults and 75% in children).30 The blood comes from torn dural vessels, usually arterial, from the fractured skull bone or occasionally from torn venous sinuses. On CT (see Fig. 334-2), an epidural hematoma is characterized by a biconvex, uniformly hyperdense lesion. Associated brain lesions are less common than with subdural hematomas. Epidural hematomas may also develop in delayed fashion31 or on the contralateral side after evacuation of an initial epidural hematoma.32
The outcome of patients with an epidural hematoma depends on their neurological status at the time of surgery. The mortality rate varies from 0% for patients who are not in coma, to 9% for obtunded patients, to 20% for patients in deep coma. The following parameters were found to be significantly related to outcome in patients with epidural hematoma: age, time from injury to treatment, immediate coma or lucid interval, presence of pupillary abnormalities, GCS motor score on admission, CT findings (hematoma volume, degree of midline shift, presence of signs of active hematoma bleeding, associated intradural lesion), and postoperative ICP.33
The primary treatment of an epidural hematoma is prompt surgical evacuation. An acute epidural hematoma with a volume greater than 30 cm3 should be surgically evacuated regardless of the patient’s GCS score. An epidural hematoma less than 30 cm3 in volume, less than 15 mm in thickness, and with less than a 5-mm midline shift in a patient with a GCS score higher than 8 and no focal deficit may be managed nonoperatively with serial CT scanning and close neurological observation.30 Mortality in patients undergoing surgery for evacuation of an epidural hematoma is approximately 10%.30
Intracerebral blood can take the form of a hematoma or a contusion. Intracerebral hematomas are more common and occurred as the primary lesion in 10% of patients with severe closed head injuries in the TCDB series.6 Occasionally, it may be difficult to differentiate a traumatic intracerebral hematoma from spontaneous hemorrhage; however, the presence of associated contusion, fracture, or an air-fluid level in the sinus helps in identifying the hematoma as traumatic. A zone of surrounding hypodensity denotes contusion or edema.
Most intracerebral hematomas are visualized as hyperdense mass lesions (see Fig. 334-2). They are generally located in the frontal and temporal lobes and can be detected on a CT scan immediately after the trauma. However, delayed intracerebral hematomas may also be manifested during the hospital course. A delayed hematoma is one that is seen on a repeated CT scan within 24 to 48 hours of the injury or operation but is not present on the initial CT scan. Commonly, a delayed hematoma is associated with clinical deterioration. Expansion of the intracerebral hemorrhage occurs in half the patients within the initial 24 hours, and larger hematomas exhibit the greatest expansion. Furthermore, the earlier the initial CT scan is obtained, the more likely it is that significant growth of the hematoma will be observed on subsequent scans.34 Indications for surgery are (1) signs or neurological deterioration referable to the parenchymal lesion and medically refractory intracranial hypertension or signs of a mass effect on CT, (2) frontal or temporal contusions greater than 20 cm3 with a midline shift of 5 mm or cisternal compression in a patient with a GCS score of 6 to 8, and (3) any parenchymal lesion with volume greater than 50 cm3.35 Factors that determine outcome in patients with intracerebral hematomas include GCS score, hematoma volume, and the occurrence of hypoxia.36
Hemorrhagic contusions were present as the primary lesion in 3% of patients with severe closed head injuries in the TCDB series.6 Single contusions are located either below the region of the impact or opposite the region of impact. Contusions appear as heterogeneous areas of brain necrosis, hemorrhage, and infarction and represent mixed-density lesions on CT scan.37 Multiple focal contusions have a “salt and pepper” appearance on CT. Ischemia may play a role in the pathogenesis of contusions, and regional CBF (rCBF) values averaging 17.5 ± 4.0 mL/100 g per minute have been measured in pericontusional tissue.38
Classification of Primary Brain Injury
A number of injury severity schemes have been developed for predicting mortality after trauma and other critical illnesses. In general, these schemes have been developed in other patient populations and do not accurately predict outcome in neurologically injured patients. Rocca and colleagues studied 70 patients with TBI and found that the GCS was superior to the Acute Physiology Score (APS), the Simplified Acute Physiology Score (SAPS), and the Therapeutic Intervention Scoring System (TISS).39 Alvarez and coworkers studied 401 patients with TBI and compared the predictive ability of the Acute Physiology and Chronic Health Evaluation (APACHE II), SAPS II, Mortality Probability Models (MPM II), and the GCS.40 The MPM II system provided a good estimation of mortality. The SAPS II and APACHE II systems did not calibrate well, and the logistic regression model containing the GCS as an independent variable and developed in this group of patients was not as well calibrated as MPM II. Of all these systems, the GCS is the most commonly used neurological injury scale for adults because of its high interobserver reliability and generally good prognostic capabilities,41 but it is a poor discriminator for less severe TBI, which accounts for 80% to 90% of all cases.
Schemes that predict outcome well after TBI generally include age, severity of injury, and type of injury. For the severity-of-injury scale, the GCS, either the sum score or, for comatose patients, the motor score alone, is used. For the type of injury, a classification that separates focal and diffuse injuries is typically used. The CT classification of head injury based on information obtained from the initial CT scan was derived from the TCDB data.10 The scheme uses the status of the mesencephalic cisterns, the amount of midline shift, and the presence or absence of surgical masses. Diffuse injuries were defined in all patients with no mixed- or high-density lesions greater than 25 cm3. The category of diffuse injuries was divided into four subgroups: diffuse injury I included all head injuries with no visible pathology, diffuse injury II included all diffuse injuries with cisterns present and less than 5-mm shift, diffuse injury III included all diffuse injuries with compressed or absent cisterns but less than 5-mm shift, and diffuse injury IV included all diffuse injuries with more than 5-mm midline shift. Example of these diffuse injury categories are shown in Figure 334-2. The category of mass lesions, which included all patients with mixed- or high-density lesions greater than 25 cm3, was divided into those with the mass surgically evacuated (including operated subdural, epidural, and intracerebral hematomas) and those with nonevacuated mass lesions.
The IMPACT database studies have confirmed the usefulness of the TCDB classification but have also shown that individual CT characteristics such as traumatic SAH and the individual hematoma type (subdural versus epidural) have added prognostic value.21 Probably the most descriptive scheme at the present time is to use a combination of the TCDB classification plus these individual CT characteristics.
Secondary Brain Injury
Traumatic Brain Swelling/Intracranial Hypertension
Brain edema and vascular engorgement have been used interchangeably to describe the brain swelling that accompanies severe TBI. Although the relative contribution of these two entities to the swelling process is controversial, there is increasing evidence that edema plays the predominant role. In experimental models of brain trauma, the water content of the brain is increased whereas cerebral blood volume is decreased, thus suggesting that edema is the major component of brain swelling after trauma.42 Clinical studies using magnetic resonance imaging (MRI) techniques to quantify water and blood content have confirmed these experimental findings in humans.43
Brain edema can be vasogenic (secondary to opening the blood-brain barrier [BBB]) or cellular. Most experimental evidence, including recent data using diffusion-weighted imaging techniques to differentiate types of edema formation, suggest that the early, immediate increase in brain water after trauma is probably vasogenic whereas the gradual increase in brain water that occurs during the first few days after injury is cellular.44,45
The clinical manifestation of brain swelling is intracranial hypertension, which develops in 50% of patients in coma caused by severe head injury. It is a misconception that ICP will always be low after operative evacuation of a large intracranial hematoma. Intracranial hypertension occurs in 50% to 70% of patients after evacuation of an intracranial hematoma.46,47 This postoperative intracranial hypertension may be due to a postoperative hematoma, either at the site of the operation or at a new site, progressive swelling of a focal contusion, diffuse brain swelling, and other systemic complications. The incidence of intracranial hypertension is greater after evacuation of an intracerebral hematoma, 71%, than after evacuation of a subdural or epidural hematoma, 39%.46 In patients with no mass lesions, elevated ICP has been observed to occur during the hospital course in 30%46 to 80%48 of patients.
The association between the severity of intracranial hypertension and poor outcome after severe head injury is well recognized. In one series, 77% of patients with ICP below 15 mm Hg had a favorable outcome as compared with just 43% of patients with ICP above 15 mm Hg.49 Miller and coauthors reported that the mortality rate increased from 18% to 92% and the frequency of good outcomes decreased from 74% to 3% in patients with normal ICP versus patients who had intracranial hypertension that could not be reduced below 20 mm Hg.50 Similarly, Saul and Ducker reported a 69% mortality rate in patients with ICP greater than 25 mm Hg as opposed to a mortality rate of 15% if ICP remained less than 25 mm Hg.51
The relationship between elevated ICP and a poor outcome is not simply a reflection of the severity of the initial neurological injury. Severe intracranial hypertension can result in secondary injury to the brain through ischemia produced by reduced cerebral perfusion pressure (CPP), and it can also distort and compress the brainstem. Although no randomized clinical trial has addressed this question, several clinical series have suggested that reduction of ICP to less than 20 mm Hg does reduce mortality after severe head injury.46,51–53
Effects of Trauma on the Cerebral Vasculature
Many investigators have studied CBF after TBI and emphasized various patterns of CBF. A few studies have closely examined the evolution of TBI over time with serial measurements of CBF.54,55 These serial studies in particular have helped to develop the overall picture of the postinjury evolution of CBF.
Martin and coworkers described a phasic pattern of cerebral hemodynamic changes in 125 severely head-injured patients with a GCS score lower than 8 who were studied prospectively with intravenous 133Xe-CBF measurements, cerebral metabolic assessment, or transcranial Doppler (TCD) evaluations (or any combination of the three studies).54 An early hypoperfusion phase occurred during the first 24 hours after injury and was characterized by low CBF and normal middle cerebral artery flow velocity (MCA-FV). This was followed by a hyperemic phase that occurred in about 40% of patients between postinjury days 1 and 3 when CBF was transiently increased with a rapidly rising MCA-FV but a normal hemispheric index. Later (postinjury days 4 to 15), a vasospasm phase occurred that was characterized by low-normal CBF values accompanied by high MCA-FV and an elevated hemispheric index. Hlatky and colleagues found a significant reduction in CBF during the first 12 hours after TBI; in patients with CBF lower than 18 mL/100 g per minute, intracranial hypertension played a major causative role in the reduction in CBF, and for levels of CBF between 10 and 40 mL/100 g per minute, the presence of regional hypoperfusion was a more important factor in reducing the average CBF.56 These CBF patterns, which have been described primarily with global CBF measurements, can also occur regionally. Hypoperfusion, in particular, can occur in brain tissue surrounding a focal contusion or underlying a subdural hematoma. Schroder and associates observed rCBF values averaging 17.5 mL/100 g per minute in pericontusional brain.38 McLaughin and Marion observed CBF values within contused brain and in pericontusional brain that were significantly lower than those in the rest of the brain.57 Focal hyperemia has been observed in 38% of patients, particularly in tissue adjacent to intraparenchymal or extracerebral focal lesions.58
Hypoperfusion and Outcome
CBF studies using the 133Xe method or the nitrous oxide saturation method have described the prognostic value of global CBF measurements. Robertson and coauthors reported several hemodynamic patterns from serial measurements of CBF and observed that patients with reduced CBF at any time during the first 7 days after injury had a higher mortality rate and poorer recovery in survivors.55 Kelly and coworkers found that patients with CBF values of less than 33 mL/100 g per minute had a higher incidence of evacuated intracranial hematomas and a worse outcome than did patients with higher CBF.59
Low rCBF has an equally poor prognosis. With the availability of stable xenon–CT, it has been observed that about a third of patients with severe TBI have regional or global CBF in the ischemic range (<18 mL/100 g per minute) within the first 6 hours after injury.60 The occurrence of ischemia was significantly related to a poor outcome. Early reductions in CBF within 4 hours after trauma occurred more commonly in patients with multiple bihemispheric contusions.61
Continuous methods for CBF monitoring have associated transient hypoperfusion, as manifested by a reduction in jugular venous oxygen saturation (SjvO2) to below 50%, with a poor neurological outcome. SjvO2, monitored in 116 patients with severe head injury, was reduced below 50% at least once in 39% of the patients.62 When adjusted for injury severity, one episode of jugular desaturation was associated with a 2-fold increased risk for a poor outcome, and multiple episodes of jugular desaturation were associated with a 14-fold increased risk for a poor outcome.
Hyperemia, Intracranial Hypertension, and Outcome
Hyperemia has been associated with both intracranial hypertension and a poor neurological outcome. Defined as CBF that is above normal values, hyperemia has been observed to occur in 20% of adults. If severely head-injured patients with CBF values in the normal range are considered to have “relative hyperemia” because CBF is higher than needed for the reduced metabolic requirements associated with coma, 55% of severely head-injured adults have hyperemia.63 The incidence is even higher in children, with up to 88% having normal or elevated CBF.64
Numerous studies have associated elevated CBF and outcome. In a study of 36 patients, the mortality rate was 67% in those with elevated CBF versus 9% in those with normal CBF and 27% in those with reduced CBF.65 In contrast, other studies have found elevated CBF to be associated with a relatively good outcome.55 Focal hyperemia has also been thought to be a finding associated with a favorable outcome.58 Sometimes, hyperemia is defined by a low arteriovenous oxygen diffusion capacity (AVDO2) or high SjvO2 because this finding would suggest a CBF in excess of cerebral metabolic requirements. In terms of prognosis, however, the finding of an elevated SjvO2 describes a wide spectrum of outcomes.66 High SjvO2 predicts a poor outcome if it is caused by a low cerebral metabolic rate of oxygen consumption (CMRO2). In contrast, if high CBF is the cause of the elevated SjvO2, it often predicts a favorable outcome.
Vasospasm and Head Injury Outcome
The TCDB study reported the occurrence of SAH in 39% of patients with severe head injury, although more recent studies have reported a higher frequency of traumatic SAH, probably because of the improved resolution of modern CT scanners.9
The incidence of ischemic injury secondary to vasospasm is more difficult to estimate because the neurological signs of ischemia are superimposed on the neurological deficits of the traumatic injury, but a few studies suggest that cerebral vasospasm may be an important cause of evolving injury in some patients. Chan and associates studied the relationship between increased FV and the development of cerebral infarction on CT in 121 patients.67 They found that of 23 patients in whom a mean FV of greater than 100 cm/sec developed, an infarction in the territory of the involved cerebral vessel developed in 4.
Recently, Armonda and coauthors described a significant percentage of patients with severe TBI resulting from a blast or high-velocity gunshot wound to the head in whom cranial vascular injury developed.68 Vasospasm was observed in up to 47% of these patients, the average duration of the spasm was 14 days with a range of up to 30 days, and vasospasm was associated with the presence of pseudoaneurysm, hemorrhage, the number of lobes injured, and mortality.
Secondary Ischemic Insults
Clinical studies have demonstrated an association between the occurrence of secondary insults and a poor neurological outcome. Jones and colleagues reported that secondary insults occurred in 91% of 124 patients studied with a computerized detection system.69 The duration of hypotensive, febrile, and hypoxic insults was significantly associated with mortality. Gopinath and coworkers observed that the occurrence of secondary insults sufficiently severe that they resulted in desaturation of jugular venous blood was significantly related to a poor neurological outcome.62 Even when adjusted for other confounding factors, such as age, type of injury, and neurological status, the occurrence of just one episode of jugular desaturation was associated with a 2-fold increase in risk for a poor neurological outcome, and the occurrence of multiple episodes of jugular desaturation was associated with a 14-fold increase in risk for a poor neurological outcome.
Causes of Secondary Ischemic Insults
Any pathophysiologic process that impairs cerebral energy metabolism can be a secondary ischemic insult after head injury. As shown in Figure 334-1, these processes can be divided into two general categories: (1) those that decrease the cerebral delivery of energy substrates and (2) those that increase cerebral energy consumption.
Cerebral oxygen consumption or CMRO2 has a normal value of 3.4 mg/100 g per minute (1.5 µmol/g per minute). Numerous conditions are known to alter CMRO2. Head injury, anesthesia, and hypothermia are known to decrease CMRO2, whereas fever and seizures increase it.63,70–76 Recent studies using [18F]fluorodeoxyglucose-labeled positron emission tomography (FDG-PET) to study glucose metabolism after severe head injury have suggested that the cerebral metabolic rate of glucose (CMRGlc) may be elevated regionally and perhaps even globally at times when CMRO2 is normal or reduced.77 This “hyperglycolysis” may indicate mitochondrial damage and inability of the brain to metabolize oxygen normally. If energy metabolism is dependent on glucose metabolism, energy failure as a result of glucose depletion is another possible cause of secondary ischemic insults after severe head injury.
Neurological Intensive Care Monitoring
Monitoring Neurological Status
To assess the neurological status of the patient, evaluation of mental status and cranial nerve, pupillary, and motor functions should be included in the periodic neurological examination whenever possible. This will help in determining whether there is improvement, deterioration, or no change in the patient’s clinical condition. A 24-hour record of the patient should be available on one sheet, such as was described by Clifton and Grossman,78 and should include information on vital signs and laboratory values. Computerized information systems are becoming more widespread in ICUs and can markedly reduce the burden of such record keeping.
Monitoring for Secondary Injury Processes: Intracranial Hypertension
ICP cannot be reliably estimated from any clinical feature after severe head injury. Clinical symptoms of raised ICP, such as headache, nausea, and vomiting, are impossible to elicit in comatose patients. Papilledema is uncommon after head injury, even in patients with intracranial hypertension.79 In one study, although 54% of patients had increased ICP, only 3.5% had papilledema on funduscopic examination. Other neurological signs, including pupillary dilation and decerebrate posturing, can occur in the absence of intracranial hypertension. CT signs of brain swelling, such as a midline shift and compressed basal cisterns, are predictive of raised ICP, but intracranial hypertension can occur without these findings.
Techniques for Monitoring Intracranial Pressure
Historical Aspects
Recording of cerebrospinal fluid (CSF) pressure was initially performed through lumbar puncture in the late 1800s. Continuous pressure recordings of ICP were first reported in 1951 by Guillaume and Janny.80 In 1960, Lundberg reported the results of ventricular catheter pressure recordings in 143 patients with various neurosurgical diagnoses.81 This was a landmark work that emphasized both the safety and importance of monitoring ICP.
Currently Available Techniques
Although several new types of monitors have recently been marketed, the ventriculostomy catheter remains the preferred device for monitoring ICP and the standard against which all the newer monitors are compared. The ventriculostomy catheter is positioned with its tip in the frontal horn of the lateral ventricle and is coupled by fluid-filled tubing to an external pressure transducer that can be reset to zero and recalibrated against an external standard. The ventriculostomy catheter provides the most reliable measurement of ICP throughout the normal and pathologic ranges.82 In addition, the ventriculostomy ICP monitor allows treatment of elevated ICP by intermittent drainage of CSF. However, the risk for ventriculitis and intracranial hemorrhage is highest with ventriculostomy,83 and proper placement of the catheter tip in the lateral ventricle can be difficult in patients with small, compressed ventricles.
When the ventricle cannot be cannulated, alternative devices can be used. A number of non–fluid-coupled devices have become available for ICP monitoring and have replaced the subarachnoid bolt as an alternative to ventriculostomy in most institutions. The microsensor transducer84 and the fiberoptic transducer85 are the most widely available. These miniature pressure transducer–tipped catheters can be inserted in the subdural space or directly into brain tissue. The main advantage of these monitors is their ease of insertion, especially in patients with compressed ventricles. They provide more reliable measurements of ICP than do subarachnoid bolts and fluid-coupled catheters in the subdural space because they have no lumen to become obstructed. The transducers, however, cannot be reset to zero after they are inserted into the skull, and they exhibit drift over time.86
ICP monitoring is continued for as long as treatment of intracranial hypertension is required, typically 3 to 5 days. A secondary rise in ICP has been observed 3 to 10 days after injury in 30% of patients with intracranial hypertension87 as a result of the delayed development of intracerebral hematoma or cerebral vasospasm or because of systemic factors such as hypoxia or hypotension. Souter and colleagues associated an increase in the blood leukocyte count with late intracranial hypertension.88
Complications
The two major complications of ICP monitoring are ventriculitis and hemorrhage. Infection may be confined to the skin wound, but ventriculitis occurs in 1% to 10% of patients. Factors that predispose to ventriculitis are intraventricular hemorrhage, SAH, cranial fracture with leakage of CSF, craniotomy, systemic infections, catheter manipulation, leaks, and irrigation. The duration of catheterization has been correlated with an increasing risk for CSF infections during the first 10 days of use. Although prophylactic catheter exchange remains a practice option, the available data suggest that this procedure does not reduce the risk for infection.89 Systemic prophylactic antibiotics are ineffective in reducing the incidence of infections, but antibiotic-impregnated ventriculostomy catheters reduce the risk for CSF infection from 9.4% to 1.3%.90 Systemic prophylactic antibiotics and routine catheter exchange are not recommended in the current TBI guidelines (see Table 334-3—level III recommendation). The best strategies for reducing the risk for ventriculitis associated with ICP monitoring are meticulous aseptic technique during catheter insertion, the use of antibiotic-impregnated catheters, and minimization of the duration of monitoring.
The second major complication of ICP monitoring is intracerebral hemorrhage. Although the risk for hemorrhage has been shown to be consistently low (1% to 2%), it is an important complication to recognize and treat.83 Patients with coagulopathies are at greater risk for the development of this complication. Some evidence suggests that patients with an international normalized ratio of 1.6 or less have a very low risk for hemorrhage if a parenchymal catheter is placed.91
Normal Intracranial Pressure Values
Normally, resting ICP is less than 10 mm Hg. Sustained ICP of greater than 20 mm Hg is clearly abnormal. ICP between 20 and 40 mm Hg is considered moderate intracranial hypertension. ICP greater than 40 mm Hg represents severe, usually life-threatening intracranial hypertension. These thresholds for the severity of intracranial hypertension assume normal BP. When a temporal mass lesion is present, however, herniation can occur at ICP values of less than 20 mm Hg.92
Different authors have recommended treatment of ICP when greater than 15, 20, or 25 mm Hg. No studies have clearly established one of these values as the most appropriate threshold for treatment. Marmarou and coworkers observed an increasingly worse outcome with greater durations of time that ICP was higher than 20 mm Hg.93 Contant and associates observed a worse outcome with greater durations of time that ICP was higher than 25 mm Hg.94 The current TBI guidelines (see Table 334-3) recommend treating ICP above 20 mm Hg (level II recommendation) or using clinical and CT characteristics in addition to the ICP value to determine the need for treatment (level III recommendation).13
Indications for Intracranial Pressure Monitoring
Monitoring of ICP can result in serious complications and is therefore indicated only in patients at significant risk for the development of intracranial hypertension. Indications from the current TBI guidelines are listed in Table 334-3.13,95 ICP should be monitored in all salvageable patients with severe TBI, defined as a GCS score of 3 to 8 after resuscitation and abnormal findings on CT (level II recommendation). ICP monitoring is indicated in patients with severe TBI and normal CT findings if two or more of the following features are present at admission: age older than 40 years, unilateral or bilateral motor posturing, or systolic BP lower than 90 mm Hg (level III recommendation). Patients with a GCS score higher than 8 might be considered for ICP monitoring if they require treatment that would not allow serial neurological examinations, such as prolonged anesthesia for surgery to treat multiple injuries or prolonged pharmacologic paralysis for ventilatory management, or if they require a treatment that might raise ICP, such as positive end-expiratory pressure (PEEP). A severe coagulopathy is the only major contraindication to ICP monitoring.
Monitoring for Secondary Injury Processes: Cerebral Ischemia
Monitors of Cerebral Perfusion
Transcranial Doppler Flow Velocity
Several studies assessing the relationship between peak FV and changes in CBF have suggested that changes in MCA-FV may be used as an indicator of relative changes in blood flow. Kofke and colleagues, investigating the relationship between MCA-FV and CBF assessed by stable xenon–CT during balloon test occlusion of the carotid artery in 31 patients, found a significant correlation in the alteration of flow detected by the two methods.96 More recently, changes in MCA-FV and changes in CBF evaluated by stable xenon–CT in patients with various intracranial pathologies, including 8 with closed head injury, have shown close correlation.97
During arterial spasm, FV increases through the narrowed segment proportional to the reduction in the vessel’s diameter. Severe vasospasm, with a larger than 50% reduction in vessel diameter, is associated with an FV of greater than 200 cm/sec.98 However, an increase in FV may also reflect hyperemia, which is often seen as a posttraumatic event. To differentiate between these two hemodynamic phenomena in the absence of direct CBF measurements, the MCA-to–extracranial internal carotid artery FV ratio, also known as the Lindegaard or hemispheric index, has been measured. In the presence of hyperemia, raised FV in both the extracranial and intracranial vessels does not alter the ratio; however, with vasospasm, FV is high only in the intracranial vessels, which results in a high hemispheric index. The mean hemispheric index in normal individuals is 1.76 ± 0.1, and pathologic values suggestive of vasospasm are generally higher than 3.99
Cerebral Blood Flow
Techniques for Monitoring Cerebral Blood Flow
Recently, newer technologies have made measurement of CBF more feasible in critically ill patients. Measurement of global CBF by the classic Kety-Schmidt technique in which nitrous oxide is used as the diffusible indicator can be performed at the bedside with a minimum of expense and equipment. Measurement of rCBF by stable xenon–CT or perfusion CT is possible and can even be performed in the ICU with a portable CT scanner (examples are shown in Fig. 334-3). However, these measurements of CBF are intermittent and require the patient to be hemodynamically stable during the time required for the measurements. Therefore, transient reductions in CBF or reductions in CBF in an acutely unstable patient are difficult to document with these technologies.
The stable xenon–CT method relies on the radiodensity of xenon and its inertness and rapid diffusion into tissues. An initial non–contrast-enhanced scan helps in choosing the levels for CBF measurement. Baseline scans, usually at four levels, are followed by multiple scans at each of the four levels at 1-minute intervals during the inhalation of 28% to 33% xenon. The baseline pre-xenon scans are subtracted from the subsequent xenon scans to provide quantitative enhancement values in Hounsfield units. Clearance curves proportional to brain and arterial xenon concentrations from an end-tidal analyzer are converted into CT enhancement units. Blood flow is then calculated from the Kety-Schmidt equation for each CT voxel. Studies in normal volunteers have indicated that xenon at a concentration of 30% has an effect on cerebral hemodynamics and causes arterial vasodilation and enhancement of CBF.100,101 This probably occurs as a result of an increase in metabolism and a vasodilatory effect of xenon. Some studies have observed a small increase in ICP averaging 6.9 ± 7.7 mm Hg during CBF measurements with xenon-CT,102 whereas others have not.103
Local Cerebral Blood Flow Sensors for Brain Implantation
Two methods for continuously measuring local CBF are now commercially available, the thermal diffusion method and the laser Doppler method. Both methods are invasive and require the probe to be placed on the surface of the brain at surgery or into the brain through a bur hole. In addition, both methods measure CBF in only a small volume of brain, which may or may not be representative of the whole brain. However, the continuous nature of the measurements gives a dynamic picture of brain perfusion. Although there is extensive documentation of the reliability of these methodologies in the laboratory, experience in the ICU is currently limited.104–107 Nonetheless, especially for patients undergoing a craniotomy, these methods may become practical for monitoring CBF postoperatively.
Thermal diffusion flowmetry (TD-CBF) uses heat transfer as a tracer for the measurement of blood flow. The sensor consists of two gold disks embedded in a 3-mm Silastic leaf or two bands on an intraparenchymal catheter. One disk is heated slightly above brain temperature (to a maximum of 44°C), whereas the other is neutral. The leaf probe is laid on the surface of the brain, and the catheter version can be implanted into the brain parenchyma. The difference in temperature between the two disks is monitored and converted to blood flow in mL/100 g per minute by the monitor and displayed digitally. Carter and Atkinson108 modified a thermal sensor described by Brawley109 and were able to quantitate the flow measured by the thermal sensor. They derived a mathematical formula by comparing TD-CBF with 133Xe-CBF110 and further confirmed its reliability through comparison with hydrogen clearance.111 In TBI patients, the CBF values obtained with the catheter probe have good correlation with those obtained with stable xenon–CT.112
Cerebral Blood Flow Adequacy
Jugular Venous Oxygen Saturation
Initial experiences with fiberoptic oxygen saturation catheters placed in the jugular bulb were unsatisfactory. However, more recently available catheters have been found to have much improved performance.113–115 A number of studies have assessed the role of monitoring jugular venous saturation in patients with severe TBI. In 1995, Robertson and coauthors published the findings from a series of 177 patients with severe TBI and demonstrated that 39% of the patients had at least one episode of desaturation and that good recovery or moderate disability occurred in 44% of the patients with no episodes of desaturation, in 30% of the patients with one episode, and in 15% of the patients with multiple episodes of desaturation.116 Mortality was higher in patients with one episode or multiple episodes of desaturation (37% and 69%) than in those with no episodes (21%).
High SjvO2 values have also been associated with a poor outcome. In 1999, in a series of 450 patients who underwent jugular venous saturation monitoring, Cormio and colleagues reported that high SjvO2 (>75%) occurs with hyperemia or after infarction because nonviable tissue does not extract oxygen.66 In addition, these patients were found to have a worse outcome at 6 months after injury than those with a mean SjvO2 of 56% to 74%.
Side of Catheterization
Early studies suggested that either jugular bulb would provide similar SjvO2 information in most healthy people. However, as early as 1945 it was observed that in patients who have focal lesions, there may be a significant difference in the oxygen saturation values obtained in the right and left jugular bulbs.117 This variability occurs because of the often incomplete mixing of cerebral venous blood before the sagittal sinus divides into the right and left transverse sinuses.
Stocchetti and coworkers compared simultaneous measurements of SjvO2 in the right and left jugular bulbs of 32 patients with severe head injury.118 The average difference in SjvO2 between the right and left jugular bulbs was 5%. Fifteen patients had a maximal right to left difference in SjvO2 of greater than 15%. Three additional patients had differences greater than 10%. Metz and colleagues compared bilateral SjvO2 measurements in 22 patients with severe head injury.119 They found that the greatest success in identifying transient ischemic episodes was achieved if the following strategy was used. When the injury is diffuse, the catheter should be placed on the side of dominant flow. When the injury is focal, the catheter should be placed on the side of the lesion.
These studies are clear that when focal lesions are present, there may be significant differences in the oxygen saturation measured in the left and right jugular bulbs. If the monitoring strategy is to use SjvO2 as a monitor of global oxygenation, cannulating the dominant jugular vein is the most logical because it will be the most representative of the whole brain. However, if the strategy is to identify the most abnormal oxygen saturation, the recommendations of Metz and colleagues should be followed.119
Normal Jugular Venous Oxygen Saturation
Gibbs and coworkers studied 50 healthy young males and observed that their SjvO2 ranged from 55% to 71% (mean of 61.8%).120 More recently, Chieregato and associates measured SjvO2 in 12 subjects undergoing selective bilateral catheterization of the inferior petrosal sinus for the diagnosis of Cushing’s disease and found that even lower values could exist in normal awake subjects.121 That these values for SjvO2 are lower than normal mixed venous oxygen saturation indicates that the brain normally extracts oxygen more completely from arterial blood than do many other organs.
In head-injured patients, the average SjvO2 is higher than normal and the range for SjvO2 is considerably wider than it is in normal subjects. In a series of 116 patients who underwent continuous measurement of SjvO2 for the first 5 to 10 days after a severe head injury, SjvO2 averaged 68.1% ± 9.7% (range, 32% to 96%) in 1329 measurements.62 PjvO2 averaged 37 ± 7 mm Hg (range, 22 to 85 mm Hg).
From studies examining ischemic thresholds, it appears that normal brain metabolism can be altered at SjvO2 values of less than 40% to 50% but that values of less than 20% would be required for irreversible ischemic injury.122–127 The current TBI guidelines (see Table 334-3) recommend treating patients with an SjvO2 of less than 50% (level III recommendation).
Complications
Line sepsis is a complication that is commonly associated with all types of indwelling catheters. Most studies have reported an overall rate of zero to five episodes of infection per 100 catheters.128 Proper sterile technique in placement and maintenance of the jugular bulb catheter should minimize this risk.
ICP can be increased by maneuvers that obstruct venous return from the brain, and it is reasonable to be concerned that a catheter in the jugular vein might raise ICP. However, the 4 or 5 French catheter used for SjvO2 monitoring is quite small relative to the lumen of the internal jugular vein. Stocchetti and coauthors reported that there was a slight increase in ICP “of no clinical significance” during catheter insertion.129
Coplin and colleagues reported that 8 of 20 patients investigated with ultrasonography after jugular bulb catheterization had nonobstructive, subclinical thrombi.130 Symptomatic thrombosis of the internal jugular vein is very uncommon with jugular bulb catheters but could have serious consequences. Depending on normal flow to the thrombosed internal jugular vein, the obstruction could impair venous return from the head and elevate ICP.
Brain Tissue PO2
The major limitation of SjvO2 as a monitor of CBF adequacy is that regional ischemia will not be identified. In circumstances such as brain trauma, where regional differences in CBF may occur, PbtO2 as a monitor of cerebral oxygenation may have an important advantage. Normal values for PbtO2 are 20 to 40 mm Hg, and critical reductions in PbtO2 are 8 to 10 mm Hg. The current TBI guidelines (see Table 334-3) recommend treatment if PbtO2 is lower than 15 mm Hg (level III recommendation). Hoffman and associates found that PbtO2 in patients with ischemia detected by single-photon emission computed tomography averaged 10 ± 5 mm Hg versus 37 ± 12 mm Hg in normal brain.131 Valadka and coworkers found that the likelihood of death after a severe head injury increased with increasing duration of time with a PbtO2 value lower than 15 mm Hg and with any occurrence of a PbtO2 value lower than 6 mm Hg.132 van den Brink and coauthors reported a prospective study of 101 patients and found that PbtO2 values of less than 10 mm Hg that lasted longer than 30 minutes were associated with increased mortality and a worse outcome.133 In 2005, Stiefel and colleagues reported a series of 53 patients with severe TBI treated with ICP and CPP treatments goals and the addition of an oxygen-directed therapy protocol aimed at maintaining PbtO2 greater than 25 mm Hg; they found a significant decrease in mortality (44% to 35%) in those treated with an oxygen-directed therapy.134 In 2008 in a prospective study of 26 children with severe TBI who were managed with continuos PbtO2 monitoring, Figaji and coauthors found a significant association between poor outcome and reduced PbtO2.135
Summary of Monitoring Options for Secondary Cerebral Ischemia
Figure 334-4 illustrates how this strategy might be used to identify and guide the treatment of focal ischemia after a head injury. This patient was initially admitted with a subdural hematoma (Fig. 334-4, left CT scan), which was evacuated promptly on arrival at the hospital. At surgery, a PbtO2 catheter was placed near contused brain underlying the evacuated hematoma. Initially, PbtO2 was normal, but over postinjury hours 36 to 46, PbtO2 gradually decreased to 5 mm Hg with no changes in any other physiologic parameters. Note that SjvO2, which is a measure of global oxygenation, remains low-normal (≈55%) despite the very low PbtO2 and that CPP was 65 to 70 mm Hg. Administering 100% oxygen raised PbtO2 to 15 mm Hg (Fig. 334-4, top graph). A CT scan (Fig. 334-4, middle scan) showed increased swelling around the contusion, and stable xenon–CT showed a large area with rCBF values of less than 10 mL/100 g per minute at the contusion site. Dopamine was started and phenylephrine added later to increase blood pressure. As CPP increased with this treatment, PbtO2 returned to normal (Fig. 334-4, bottom graph), and a repeated stable xenon–CT scan (Fig. 334-4, right scan) showed significant improvement in CBF.
Monitoring for Secondary Ischemic Insults
Monitoring for Cerebral Causes of Secondary Ischemic Insults
Intracranial Hypertension
Intracranial hypertension was the most common cause of jugular venous desaturation in a prospective study of 116 patients with severe head injury; it accounted for 44% of the total number of episodes.62 As discussed earlier, ICP should be monitored, preferably by ventriculostomy.
Seizures
Seizures can dramatically increase CMRO2 and CMRGlc. In rats in which seizures were induced by bicuculline, CMRO2 was increased by 150% to 250%.74 If CBF is marginal or uncoupled from the cerebral metabolic rate, ischemia can occur during the seizure.
The overall risk for seizures after TBI ranges from 2.5% to 5% with all types of injury, but it is 7% to 39% with cortical injury and neurological sequelae.136 Because patients are often sedated and pharmacologically paralyzed for treatment of intracranial hypertension, seizure activity may be subclinical. For this reason, continuous monitoring with electroencephalography (EEG) is useful for this high-risk group of patients.137
Seizures are not a common cause of jugular venous desaturation and can significantly reduce SjvO2 if CBF is unable to meet the increased cerebral metabolic requirements. Increases in extracellular glutamate have also been reported during posttraumatic seizures.138
Monitoring for Systemic Causes of Secondary Insults
Hypotension
Autoregulation is the ability of the brain to maintain normal CBF over a wide range of BP values, normally from a mean BP of 50 to 150 mm Hg. After TBI, the cerebral vasculature can lose the ability to autoregulate completely and CBF rises and falls with BP, or the lower limit of autoregulation, which is normally 50 mm Hg, can be shifted to a higher pressure. The consequence is that low BP values that are normally tolerated without sequelae can result in cerebral ischemia after TBI. Lewelt and colleagues showed in a fluid percussion injury model that autoregulation was severely impaired after both low-level and high-level injuries.139 Normally in the cat, CBF is constant until CPP falls below 60 mm Hg. After a fluid percussion injury, CBF decreased proportionally to a CPP below 80 mm Hg. Chan and coauthors described similar findings in patients with head injury, with MCA-FV measured by TCD and SjvO2 decreasing as CPP was reduced below approximately 70 mm Hg.140
Hypotension is common in head-injured patients on admission to the hospital. The TCDB study of 717 patients reported that 35% had a systolic BP lower than 90 mm Hg on arrival in the emergency department.8 Hypotension on admission increased the mortality rate by 150%. Miller and Becker found in a group of 225 patients that the presence of a systolic BP lower than 95 on arrival in the emergency department was associated with a twofold increase in mortality rate.141
Hypotension is also common during hospitalization and is associated with a worse outcome. In another TCDB study, 29% had a systolic BP lower than 90 mm Hg during their ICU stay.142 Hypotension during the hospitalization was associated with a significantly worse outcome. In a prospective study in which SjvO2 was monitored in 116 patients, hypotension was the third most common cause of jugular venous desaturation and accounted for 10% of the episodes.142 Marmarou and associates analyzed 428 patients who had hourly recordings of ICP, MAP, and CPP and reported that the proportion of time that MAP was lower than 80 mm Hg was significantly related to a poor neurological outcome.93 Pietropaoli and colleagues observed in a study of 53 patients who underwent early surgery for traumatic intracranial hematomas that intraoperative hypotension (systolic BP <90 mm Hg) was associated with a mortality rate of 82% as opposed to 25% in patients without hypotension.143
Hypocapnia
Induced hyperventilation constricts cerebral blood vessels and thereby reduces global CBF and cerebral blood volume. The effect of changes in PaCO2 on cerebral vessels is mediated by the change in pH induced in extracellular fluid.144 CO2 reactivity is preserved in most patients with severe head injury,145 and therefore hyperventilation can rapidly lower ICP through the reduction in cerebral blood volume. The effects of hyperventilation on ICP are immediate, but the duration of the effect is brief because the pH of the brain, at least in normal individuals, soon equilibrates to the lower PaCO2 level. Hyperventilation will clearly reduce ICP, but this potentially beneficial effect is attained at the expense of cerebral perfusion. Whether hyperventilation can actually result in cerebral ischemia in head-injured patients is controversial. However, several studies suggest that excessive hyperventilation after severe head injury can be a secondary ischemic insult. In a prospective study in which SjvO2 was monitored in 116 patients with severe head injury, hypocapnia was the second most common cause of jugular venous desaturation and accounted for 36% of the episodes.62
If areas of the brain that are marginally perfused have impaired CO2
[/not-level-membership-for-neurosurgery-category]
