Color Vision and Night Vision
Rod and cone functions
Differences in the anatomy and physiology (see Chapters 4, Autofluorescence imaging, and 9, Diagnostic ophthalmic ultrasound) of the rod and cone systems underlie different visual functions and modes of visual perception. The rod photoreceptors are responsible for our exquisite sensitivity to light, operating over a 108 (100 millionfold) range of illumination from near total darkness to daylight. Cones operate over a 1011 range of illumination, from moonlit night light levels to light levels that are so high they bleach virtually all photopigments in the cones. Together the rods and cones function over a 1014 range of illumination. Depending on the relative activity of rods and cones, a light level can be characterized as photopic (cones alone mediate vision), mesopic (both rods and cones are active), or scotopic (rods alone mediate vision).1 In the literature, the terms photopic vision and scotopic vision are used to reflect cone and rod vision, respectively. Table 10.1 shows this overlapping range of activity.
Table 10.1
The dynamic range of the human visual system
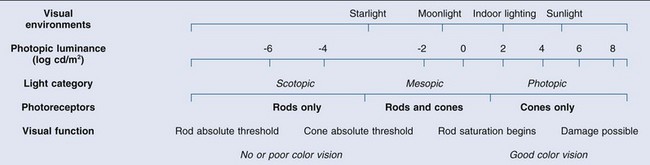
Modified from Hood DC, Finkelstein MA. Sensitivity to light. In: Boff KR, Kaufman L, Thomas JP, editors. The handbook of perception and human performance, vol. 1. Sensory processes and perception. New York: John Wiley; 1986.
The distribution of rods and cones in the retina (see Chapter 4, Autofluorescence imaging) is also reflected in visual function. The greatest sensitivity to light occurs in the midperiphery of the visual field, which has a predominance of rods, while high-acuity and good color vision are mediated by the fovea, which has a predominance of cones. Nonetheless, the entire retina, with the exception of a very small area within the fovea, is capable of mediating night vision, and color vision is present throughout the visual field with daylight stimulation of the entire retina. The following will introduce rod and cone differences in light adaptation, spectral sensitivity, and spatial/temporal sensitivity.
Light adaptation
Photoreceptors, whether they are rods or cones, respond well to only a small range of variations in illumination within a steady adapting background.2 However, adaptation mechanisms adjust photoreceptor sensitivity so that this small range of responses is always centered near the current adaptation level, even though adaptation levels can vary over a wide range. This behavior forms the basis for the large operating range of the visual system.
It is possible to measure a threshold for the perception of an increment in light on a large, steady background field. As the background light level is increased, the increment threshold starts to increase. Rods and cones behave somewhat differently in this regard. For the rod system, as shown in Fig. 10.1A, the increment threshold increases steadily over almost a thousand-fold range. With further increases in background adaptation levels, an increment is not detected, no matter how much additional test light is presented as an increment, due to rod saturation. In comparison, the cone system, as shown in Fig. 10.1B, shows a continuous steady increase in the increment threshold with increases in background illumination, even at levels that bleach almost the entire amount of available photopigment. The portion of the curve that rises linearly with illumination levels is called the Weber region (Fig. 10.1). In the Weber region, an incremental light can be detected when it is a constant proportion (i.e., the Weber fraction) of the background light level. Different photoreceptor systems have a characteristic Weber fraction. Cones have lower Weber fractions than rods and the M and L cones have lower Weber fractions than S cones. Under optimal conditions, the cone system can detect a light level difference of 1%, while rods need a light change of 20%.
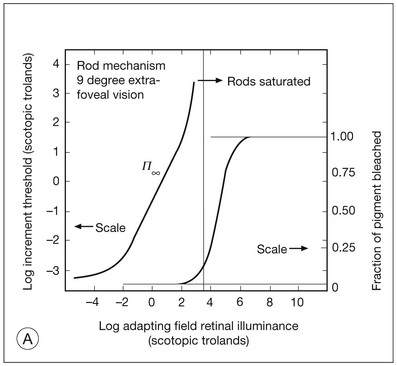
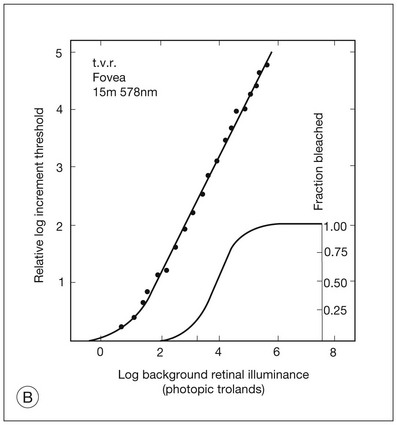
Fig. 10.1 The increment threshold functions for scotopic (rod) and photopic (cone) vision as a function of background illuminance. (A) Rod increment thresholds measured at 9° in the parafovea. The dashed line has a slope of 1. The portion where the curve has unit slope (in parallel to the dashed line) is the Weber region, followed at higher levels by the region of rod saturation. To the right is shown the fraction of rod photopigment bleached. The rods are saturated before there is substantial photopigment bleaching. (B) Cone increment thresholds measured at the fovea. To the right is shown the fraction of photopigment bleached. The Weber region extends to luminances (6 million tds) that bleach virtually all the cone photopigment. (Reproduced with permission from Enoch JM. The two-color threshold technique of Stiles and derived component color mechanisms. In: Jameson D, Hurvich L, editors. Visual psychophysics: handbook of sensory physiology, vol. VII/4. Berlin: Springer-Verlag; 1972.)
In addition to photoreceptor adaptational properties, other factors, including pupil size, the temporal and spatial summation characteristics, and photopigment depletion, can also contribute to extend the operating range of the visual system over a large luminance range. While some adaptation operates within the photoreceptors themselves, other properties of adaptation may reflect the effects of the complex neural circuitry of the retina.2
Spectral sensitivity
Day vision is primarily mediated by three types of cone photoreceptors with different but overlapping spectral sensitivities. Each is identified by the relative position of the peak in spectral sensitivity. The three cone types are called the long-, middle-, and short-wavelength-sensitive (L, M, and S) cones. When overall sensitivity to light is measured at the light-adapted fovea, a broad sensitivity spectrum peaking near 555 nm is found. This sensitivity spectrum represents the combined activity of the L and M cones and is called the V(λ) function. When sensitivity to light is measured in the dark-adapted peripheral retina, where rods dominate, a broad-sensitivity spectrum is found with a peak sensitivity at 507 nm. This rod spectral sensitivity function is called V’(λ) (Fig. 10.2A). Both V(λ) and V’(λ) functions have practical significance and have been accepted by the International Commission of Illumination as representative of human vision relative luminous efficiency at photopic and scotopic levels. They are also used to relate luminous (perceived energy of light) to radiant (emitted light) energy.
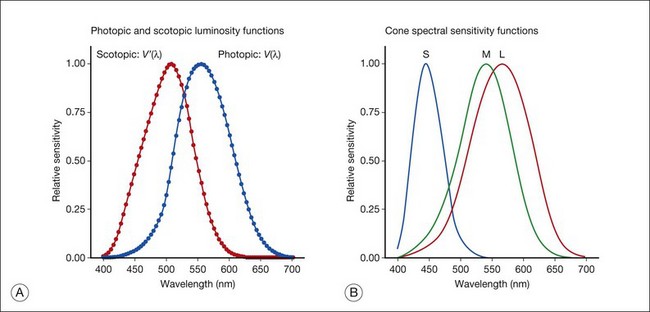
Fig. 10.2 Spectral sensitivities of cones and rods. (A) The relative spectral luminous efficiency functions for scotopic and photopic vision adopted by the Commission International d’Eclairage (CIE), V ’(λ) and V(λ) respectively. (Data from Wyszecki G, Stiles WS. Color science – concepts and methods, quantitative data, and formulae, 2nd edn. New York: John Wiley; 1982). (B) Spectral sensitivities of the S, M, and L cones derived from color-matching function.14
Estimates of the spectral sensitivities of the three cone types have been obtained from a variety of psychophysical procedures. One approach was to derive the spectral sensitivities of cones from analysis of color-matching data. Another approach used spectral bleaching lights to depress the responses of two cone types relative to the third so that measurements of the spectral sensitivity of the third cone type could be isolated. Figure 10.2B shows the relative spectral sensitivities of the three cone types. The S cones are most sensitive to light near 445 nm, with sensitivity declining rapidly at longer wavelengths. At 555 nm and longer wavelengths, the S cones are virtually unresponsive to light. The M and L cones have overlapping spectral sensitivities that span the entire visible spectrum. The M cones peak in sensitivity near 543 nm, while the L cones peak near 566 nm. The differential spectral sensitivity functions of the L, M, and S cones provide the foundation of early spectral processing.
Spatial and temporal resolution
Compared with the cone system, the rod system has poorer spatial resolution (acuity). For an observer with 20/20 photopic acuity, scotopic acuity would be about 20/200 (10 times worse than photopic acuity). The rod system also has poorer temporal resolution, which refers to the ability to perceive a physically alternating light as steady or flickering in time. The transitional temporal frequency at which the light appears from flickering to steady is called the critical fusion frequency (CFF). CFFs increase with light adaptation level, reaching a maximum of 20 Hz for rods and 55–60 Hz for cones. This means that flickering lights can be perceived at higher frequencies in brighter light conditions. Interestingly, dark-adapted rods can suppress cone-mediated flicker detection3 and this suppression mainly occurs in the magnocellular (MC) pathway (explained below).4
Visual pathways for rod and cone functions
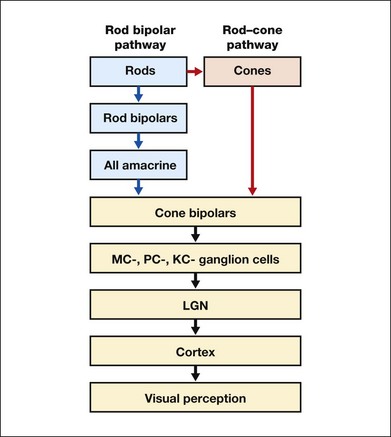
Rod signals are conveyed by two primary neural pathways that are dependent on the illumination level.5 One pathway is via ON rod bipolars, AII amacrine cells, and ON and OFF cone bipolars, which are all cells in the retina. This is a temporally sluggish pathway that mediates rod vision at low scotopic light levels. The second pathway transmits rod information via rod–cone gap junctions and ON and OFF cone bipolar cells in the retina. This is a fast pathway that mediates vision at higher scotopic and mesopic light levels. A third insensitive rod pathway between rods and OFF cone bipolars has been identified in rodents but, thus far, not in primates. The significant point here is that rods and cones share neural pathways and have joint inputs to retinal ganglion cells.
Retinogeniculate pathways
There are three major neural retinogeniculate pathways in primates that convey retinal information to the visual cortex.6,7 The pathways are named after the layers of the lateral geniculate nucleus (LGN) that receive input from distinct types of ganglion cells and project to different areas of the primary visual cortex. The MC layer of the LGN receives inputs from parasol ganglion cells. The MC pathway processes the summed output of the L and M cones to signal luminance information. The parvocellular (PC) layer of the LGN receives input from midget ganglion cells. The PC pathway mediates spectral opponency of L and M cones (discussed later) to signal chromatic information. The koniocellular (KC) layer of the LGN, which receives input from small bistratified as well as other ganglion cells, detects changes in S-cone signals compared to the sum of the L- and M-cone signals. These three pathways mediate different aspects of vision, with the MC pathway mainly carrying out luminance and motion processing, the PC pathway mainly processing red–green color, acuity, and shape information, and the KC pathway mainly handling blue–yellow color processing.
The sharing of neural pathways between rods and cones implies that rods should have input to the MC, PC, and KC pathways. Indeed, physiological studies have shown that there is strong rod input to the MC pathway, but weak input to the PC pathway.8 Demonstration of rod input to the KC pathways is less clear. An earlier study8 did not find rod input to the bistratified ganglion cells in the parafovea, while two recent studies demonstrated strong rod input in the peripheral retina.9,10 Figure 10.3 shows a schematic diagram of the visual pathways conveying rod and cone inputs to the MC, PC, and KC ganglion cells, which would then produce signals that are projected into the cortex to mediate different aspects of visual perception.
Dark adaptation functions: assessment of the shift from day vision to night vision
Measurements of sensitivity thresholds during adaptation to darkness have produced a characteristic biphasic function with an initial segment that is attributed to cone responses and a subsequent segment attributed to rod responses. Figure 10.4 shows a characteristic dark adaptation function measured in the peripheral retina. Thresholds decrease quickly initially and this rapid recovery is attributed to cones. Thresholds then reach a plateau in about 5 minutes and remain invariant for another 5 minutes (cone plateau, reflecting cone absolute thresholds). Then, there is a second rapid decrease in thresholds due to sensitivity recovery of the rods, referred to as the rod–cone break, to a new plateau that is reached in 40–50 minutes (rod plateau, reflecting rod absolute thresholds).
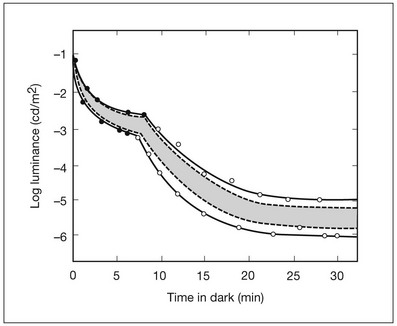
Fig. 10.4 The time course of dark adaptation. The range of threshold sensitivities of 110 normal observers is shown. The circular points represent data of the most and least sensitive individuals. The area enclosed by the dashed lines represents 80% of this population. The cone absolute thresolds are obtained during the cone and rod plateaus, respectively. (Data from Hecht S, Mandlebaum J. The relationship between vitamin A and dark adaptation. JAMA 1939;112:1910–6.)
The shape of the dark adaptation function depends on testing parameters, including retinal location, wavelength, and temporal and spatial characteristics.1,11 The effects of these parameters on dark adaptation curves can be understood by the differences between rods and cones in terms of their distributions, spectral sensitivity, and spatial/temporal resolution characteristics. For instance, because there are only cones in the fovea, dark adaptation measured at the fovea using a small test light reveals a rapid monophasic branch attributable to the cones. On the other hand, because the rod and cone systems have similar absolute sensitivities at long wavelengths, dark adaptation measured with long-wavelength lights is monophasic, resembling the cone function. As the test wavelength is changed to shorter wavelengths, a biphasic curve emerges because the rods show greater absolute sensitivity than cones at shorter wavelengths.12
Clinical evaluation using dark adaptation functions
It is known that certain retinal disorders may selectively affect rods (e.g., retinitis pigmentosa) or cones (e.g., cone dystrophies). Clinically, rod and cone functions can be evaluated electrophysiologically by measuring rod and cone electroretinograms (ERG: see Chapter 7, Electrogenesis of the electroretinogram) or, psychophysically, by measuring dark adaptation functions. Dark adaptation functions quantify the ability of the rod and cone systems to recover sensitivity (i.e., regenerate photopigment) after exposure to light. The recovery is faster for cones, but the absolute level of sensitivity is greatest for rods. Variations in sensitivity and sensitivity recovery times can be used to characterize retinal disorders.
Color vision
Color vision refers to our ability to perceive colors based on spectral variations in light absorbed by the photoreceptors. Color vision includes both chromatic discrimination and color appearance appreciation. Color matching and color discrimination experimental tasks are two fundamental psychophysical procedures that have provided theoretical insights into the nature of color vision and have also been developed for clinical diagnosis of color vision. Color matching and color discrimination results, however, do not address questions of color appearance, for example, why an object appears red. Color appearance is far more complex because it depends on not only the chromatic properties of an object but also the spatial, temporal, and spectral characteristics of the neighboring objects.13 Neural processing beyond the retina is required for color appearance perceptions.
Color matching
Color matching as the foundation for the theory of trichromacy
The psychophysical procedure in which an observer sets a mixture of three primary lights to match the color of a test stimulus is called color matching. It has been known since the 19th century that different colors perceived by humans can be specified by an economical three-variable (trichromatic) system. In the 1800s, Thomas Young and Hermann von Helmholtz proposed that there must be three kinds of physiological entities in the eye accounting for this trichromacy and their theory is called the Young–Helmholtz trichromatic theory of color vision. We now know the basis for trichromacy is the existence of three cone types in the retina. Color matching was the means to uncover the spectral sensitivity functions of the three different cone types (Fig. 10.1B).14
The CIE colorimetric system
Figure 10.5A shows the 1931 CIE chromaticity chart, in which the coordinates of the Y primary [y = Y/(X + Y + Z)] are plotted against those of the X primary [x = X/(X + Y + Z)]. The spectrum loci (their wavelengths are indicated on the graph) form the horseshoe-shaped curve. Equal-energy-spectrum (EES) light is plotted in the center, with the coordinates of x = 0.3333 and y = 0.3333. A straight line connects 400 nm to 700 nm for purples, which result from mixtures of short- and long-wavelength light. All possible lights occur within the boundaries of the spectrum locus and the purple line. Highly saturated colors occur near the locus and desaturated (pale) colors occur near the white point.
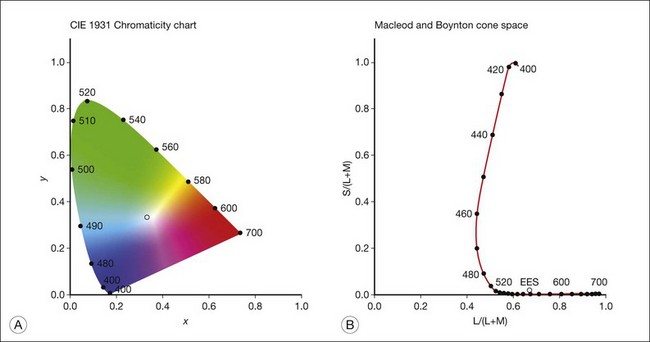
Fig. 10.5 Chromaticity spaces. (A) The Commission International d’Eclairage (CIE) 1931 x, y chromaticity diagram. An equal-energy-spectrum (EES) light has a coordinate of x = 0.3333 and y = 0.3333. Spectral wavelengths are represented on the horseshoe-shaped spectrum locus. All lights can be represented in this diagram. (Data from Wyszecki G, Stiles WS. Color science – concepts and methods, quantitative data, and formulae, 2nd edn. New York: John Wiley; 1982.) (B) The MacLeod and Boynton cone space, which plots S-cone excitation versus relative L/M-cone excitations. In this space, the S/(L + M) chromaticity of 400 nm spectral light is normalized to be 1. In such a normalization, an EES light has a chromaticity of L/(L + M) = 0.665 and S/(L + M) = 0.016. In a relative cone troland space, the S/(L + M) for an EES light is normalized to be 1. The chromaticities of the spectral loci form an “L” shape in this space.
Cone chromaticity space
The concept of cone chromaticity space appeared in the early 20th century. It was not until 1979 that MacLeod and Boynton15 published a cone chromaticity space based on modern estimates of the cone spectral sensitivities.14 In the MacLeod and Boynton cone chromaticity space (Fig. 10.5B), the horizontal axis [L/(L + M)] represents the variation of relative L- versus M-cone stimulation at equiluminance, while the vertical axis [S/(L + M)] represents the variation of S-cone stimulation. The space normalizes in that S/(L + M) = 1 for spectral light of 400 nm. Later, a relative cone troland space that normalizes S/(L + M) for EES light to be 1 was proposed to link cone excitations with retinal illuminance, which is measured in trolands.16 Another spectral opponency space normalizes the cone chromaticity based at the EES-white to reflect both cone contrasts and postreceptoral opponency signals.17 These cone chromaticity spaces are a major breakthrough for vision research because neurons in the PC and KC pathways show preferred responses to stimuli along the two axes of the cone chromaticity spaces.17,18 Therefore, psychophysical experiments can be designed to infer the functions of the postreceptoral pathways by generating stimuli along the two theoretical axes.
Chromatic discrimination
Chromatic discrimination refers to the ability of an observer to discriminate two colors. Chromatic discrimination has been investigated using three approaches: wavelength discrimination, purity discrimination, and chromaticity discrimination (reviewed by Pokorny and Smith19). Chromatic discrimination is usually measured at a constant luminance level to avoid potential interactions between the luminance pathway (MC pathway) and the chromatic pathway (PC or KC pathway).
Wavelength discrimination
In a typical wavelength discrimination experiment, the stimulus consists of two equiluminant semicircular fields, one filled with a narrow band of spectral light to serve as the standard field and the other as the comparison field. The observer is instructed to change the wavelength of the comparison field to achieve a just noticeable difference (JND) from the standard wavelength. Typical wavelength discrimination thresholds, as a function of standard wavelengths, form a skewed “W” shape with two minima, one at 490 nm and the other at 580 nm.20
Chromaticity discrimination
Early attempts to measure chromaticity discrimination included measurement of the minimum variation needed in chromaticity to achieve a JND from any point in the CIE diagram.21 Another measure of chromatic discrimination involved derived discrimination ellipses using the standard deviations of repeated color matches at a set of chromaticities in the CIE diagram.22
In modern chromaticity discrimination experiments, discrimination thresholds are obtained for test field chromaticities varied along the two cardinal axes of a cone chromaticity space in a steady adaptation field. A cone chromaticity space allows that discrimination can be mediated by the L/M cones only (L/M cone discrimination) or by the S cones only (S-cone discrimination).23 Chromatic discrimination was found to be the best at the adaptation chromaticity and then deteriorated with increasing chromatic contrast between the test and adapting fields. Chromatic discrimination data can be explained adequately by a model based on primate ganglion cell responses in the PC and KC pathways.24
Color appearance
In color-matching and color discrimination experiments, observers determine whether two colors appear the same or different but they do not determine which color is perceived. Color appearance has three perceptual dimensions: hue, saturation, and brightness. Hue is the perceptual dimension that differs from white, such as red, orange, green, blue, yellow, purple, and pink. Saturation indicates how different the hue is from white. For instance, colors on the spectral locus are highly saturated compared with desaturated colors near white (Fig. 10.5A). Brightness is the perceptual dimension related to luminance variance.
An important feature of color appearance is that colors do not simultaneously appear red and green, nor do they simultaneously appear blue and yellow. However, colors do appear as mixtures of red and yellow or red and blue and they also appear as mixtures of green and yellow or green and blue. Further, human observers can separately abstract the qualities of redness–greenness or blueness–yellowness in an arbitrary test color. These facts have led to the concept that color appearance can be represented in a double-opponent system, with red and green placed in opposite directions on one dimension and blue and yellow placed in opposite directions in the other dimension (Fig. 10.6). Red and green are said to be opponent sensations, as are blue and yellow. This observation triggered Ewald Hering, a German physiologist, to propose the “opponent-color” theory in the late 19th century.
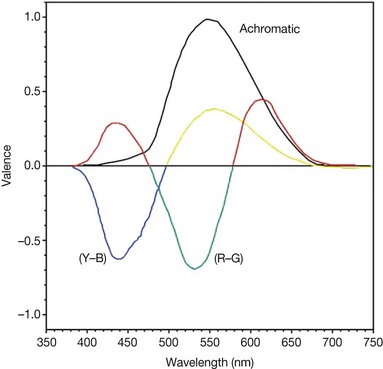
Fig. 10.6 Color opponency. Theoretical curves for the first stage of opponent coding for normal 2° foveal color vision. The (all-positive) achromatic function represents the whiteness response. Two (opponent) chromatic functions, (R–G) and (Y–B), represent redness–greenness and yellowness–blueness, respectively. (Reproduced with permission from Hurvich LM, Jameson D. Some quantitative aspects of an opponent-colors theory. II. Brightness, saturation and hue in normal and dichromatic vision. J Opt Soc Am 1955;45:602–16.)
The theories of opponency and trichromacy were two competing theories in the history of color vision research; however, the two theories have been reconciled in that chromatic processing starts with three types of cones, supporting trichromacy, and spectral responses from the cones are transmitted in bipolar and ganglion cells that have antagonistic receptive field structures, consistent with opponency. This interpretation of color vision, first proposed by von Kries in 1905,25 is referred to as the two-stage or two-process model of color vision.
In a complex visual scene, the perceived color of a light (emitted from a source or reflected from an object) cannot be predicted from its spectral power distribution because the context of other nearby light affects color appearance. For instance, chromatic induction occurs when perception changes because of the presence of other lights nearby in space or time. Chromatic induction includes both chromatic contrast and chromatic assimilation. Chromatic contrast occurs when the color appearance of a test light shifts away (in terms of color opponency) from the color appearance of a nearby light. Chromatic assimilation occurs when the color appearance of a test light shifts toward the color appearance of inducing nearby light. Therefore, the color of a light seen in isolation (surrounded by darkness) is called an unrelated color while the color perceived in the presence of a complex context is called a related color; that is, its percept is related to the surrounding colors. Cortical mechanisms are likely involved in color perception in a complex scene.26
Variations in human color vision
Abnormal color vision that is either inherited or acquired is present in about 4.5% of the population. Congenital color vision defects are stationary over the lifespan and do not result from other visual problems. These color vision defects have been studied extensively and their classification is well established based on psychophysical and genetic works. The most common are the congenital X-chromosome-linked red–green color vision defects, which have been associated with alterations in the gene sequences encoding the opsins on the X chromosome.27,28 Acquired color vision defects refer to abnormalities that accompany eye diseases or drug toxicity. Acquired color vision defects are more variable and their classification is more difficult and less satisfactory. Color vision is often tested clinically with screening tests that allow identification of abnormalities and most screening tests are based on color discrimination and color-matching abilities.29
Color vision classifications
Color vision classifications are based on both the number of functioning cone types and the presence of abnormal cones. An observer with three functioning cone types is called a trichromat, an observer with two functioning cone types is a dichromat, and an observer with one functioning cone type is a monochromat (monochromacy sometimes is also termed achromatopsia in the literature since it is believed that vision based on a single cone type cannot produce color perception, assuming rods are not involved). An observer with normal color vision has three normal cone types, in terms of spectral sensitivity, and is called a normal trichromat. Observers who are said to have defective color vision have at least one abnormal cone type or are missing at least a cone type with conventional color-matching techniques. Observers with rods only (lack of any cones) are called rod monochromat or complete achromatopsia.30
The genes encoding the human photopigments
It has been known for many years that the spectral sensitivities of rods and cones reflect the absorption spectra of the visual photopigments. In a major advance, the genes encoding the opsins of the human visual photopigments were cloned and mapped in the human genome in 1983.27,31 The gene for rhodopsin was found on chromosome 3 and the human rhodopsin gene showed high homology (93.4%) to that of bovine rhodopsin.31 A visual photopigment gene for the opsin of S cones (OPN1SW gene) was found on chromosome 7. A tandem array of visual photopigment genes for the opsins of the M and L cones (OPN1MW and OPN1LW genes) was found on the X chromosome. The human opsin genes show about 45% homology between rhodopsin and any of the three cone photopigment genes and between the chromosome 7 and the X-chromosome pigment genes. This similarity among the photopigment genes suggests a common ancestor. The genes on the X chromosome have a high homology to each other (about 96%), suggesting a more recent evolutionary appearance. An unexpected finding was that of multiple genes in a tandem array on the X chromosome, which has been proposed to range from 2 to 6. Nathans et al.28 postulated that the multiple genes in the tandem array on the X chromosome arose as a result of unequal homologous recombination. Subsequent study has suggested there are polymorphisms among these genes in color-normal and color-defective individuals.27
The initial study of the opsin genes on the X chromosome was based on the long-standing conventional ideas about X-linked congenital color vision defects28; that is, protanopes are missing L cones and deuteranopes are missing M cones, and that the genetics of these types of defective color vision may be based on missing genes for either L or M cones. Specifically, protanopes were thought to be dichromats who lacked an L-cone gene and deuteranopes were dichromats who lacked an M-cone gene.
Subsequent studies that have been carried out on both normal and X-linked defective color vision have their roots in the initial RFLP analysis based on the conventional idea of missing cone types and missing genes using one normal observer and a few color-defectives. The variations that have been found in subsequent studies on the visual pigment genes have correlated largely, but not absolutely, with phenotypes established by color vision testing. The current view is that the X-chromosome tandem array consists of one or more opsin genes encoding L-cone photopigment, followed by one or more opsin genes encoding the M-cone photopigment. The expression of the genes in the tandem array is believed to be governed by a stochastic process.27
Clinical evaluation of color vision
Chromatic discrimination ability tests
Clinical assessment of color discrimination ability involves arrangement tests that require the observer to arrange a set of colored samples according to their similarity in color. If the samples are closely spaced in chromaticity (e.g., the Farnsworth–Munsell 100-hue test: Fig. 10.7), the task becomes one of fine chromatic discrimination. Tests involving fine chromatic discrimination are usually relatively time-consuming. If the samples are widely spaced in chromaticity (e.g., the Farnsworth panel D-15), the test evaluates color confusions that occur with defective color vision that would not be perceived by a normal observer. Tests with widely spaced colors are conducted rapidly and can even be used for screening. An arrangement test may use samples that differ only in chromaticity to test hue discrimination (e.g., the Farnsworth–Munsell 100-hue test, Farnsworth panel D-15, Farnsworth desaturated panel D-15, and Lanthony new color test), may vary in luminance only to test lightness discrimination (Verriest’s lightness discrimination test), or may vary only in grayness to test saturation discrimination (Sahlgren’s saturation test, Lanthony new color test). Arrangement tests are easy to administer but require the concept of abstract ordering, manual dexterity, and patience. As a result, they are rarely suitable for children under 10 years of age.
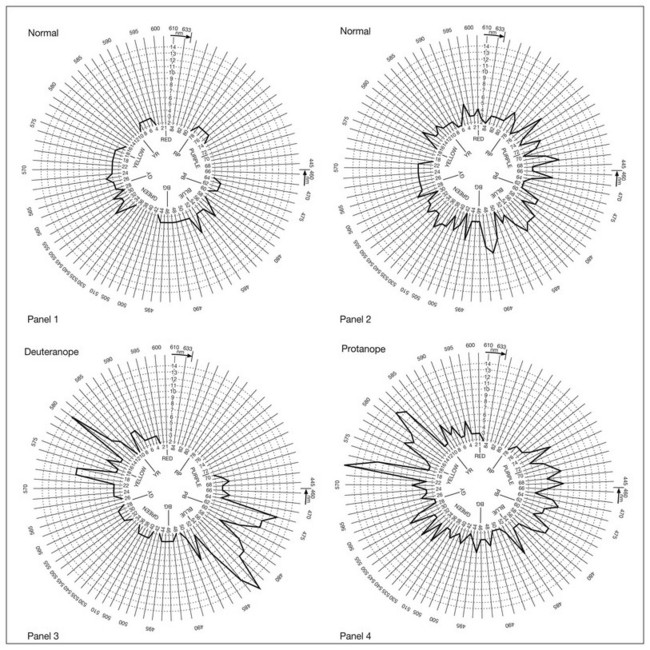
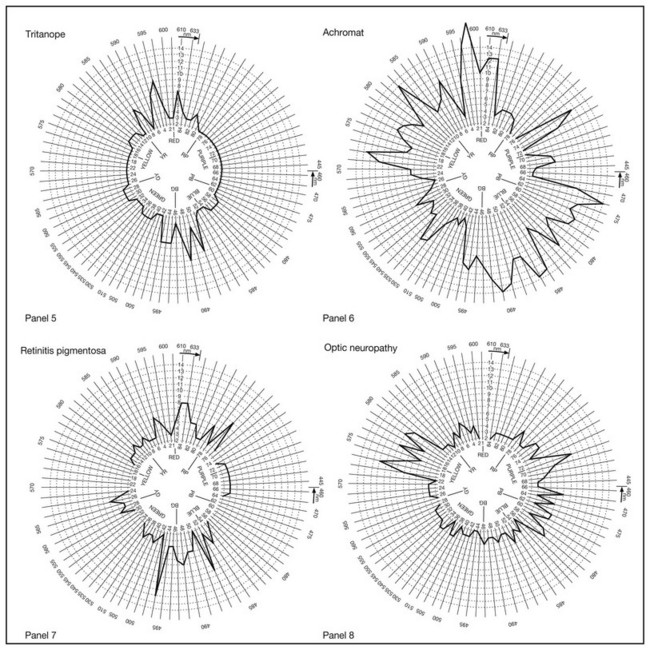
Fig. 10.7 Examples of Farnsworth–Munsell 100-hue test error patterns in normal subjects (panels 1 and 2) and in observers with congenital (panels 3–6) and later onset or acquired (panels 7 and 8) color vision defects. Panel 1, normal with good discrimination. Panel 2, normal with poor discrimination. Panel 3, deuteranope. Panel 4, protanope. Panel 5, tritanope. Panel 6, achromat. Panel 7, retinitis pigmentosa with an acquired violet–yellow defect. Panel 8, optic neuritis with an acquired red–green defect.
Observers with congenital color vision deficiencies make characteristic errors on arrangement tests because their chromatic discrimination ability is weakened or lost on particular axes in chromaticity space. Discrimination loss in acquired color vision defects is more variable. However, following the idea that discrimination of blueness content is, to a first order, independent of discrimination of redness–greenness, it is possible to partition the caps into those where correct ordering depends on normal function of the S-cone system (caps 1 through 12, 34 through 54, and 76 through 84) and those where correct ordering depends on normal function of the M- and L-cone opponent system (caps 13 through 33 and 55 through 75). The partitioned scores can be examined to determine whether an acquired color vision defect causes a particular type of discrimination loss, i.e., the S or L/M systems.32
Color-matching tests
Anomaloscope color matching test using the Rayleigh equation
In a Rayleigh match, a spectral “yellow” test field (589 nm) is presented in one-half of a circular field with an adjustable brightness. In the half field, a mixture of two “green” and “red” spectral primaries (545 and 670 nm) is presented. The mixture field can appear green (545 nm), green–yellow, yellow, orange, or red (670 nm) as the ratio of the primaries is varied. The task of the observer is to adjust the primary red–green ratio and brightness of the yellow to make the two fields appear identical. Observers with normal color vision accept a narrow range of ratios near the middle of the red–green range, but color-deficient observers will pick ratios shifted away from this range, depending on the specific deficiency. Matching abnormalities accompanying ophthalmic disease or X-linked color vision variations may include a widened matching range or acceptance of an abnormal match.33
The Rayleigh equation assesses the normality of M- and L-cone functions, since S cones are not contributing to the match because they are unresponsive to the primary wavelengths. A graphic display of the cone photopigment excitations allows the tester to evaluate which photopigments participated in an observer’s match. Figure 10.8A shows the expected yellow setting, based on the L- and M- photopigments, as a function of the red–green primary ratios. For each photopigment, the quantal catch in cones may be characterized by a straight line in a chromaticity diagram as the red–green primary ratio is changed. Two lines show the predicted responses of the L cones alone (dashed and labeled L) and the M cones alone (dotted and labeled M). The rod photopigment is responsive at these wavelengths as well and the predicted rod response (solid and labeled Rod) is also shown. The normal match occurs at or near the intersection of the L- and M-cone settings and the matching range is narrow.
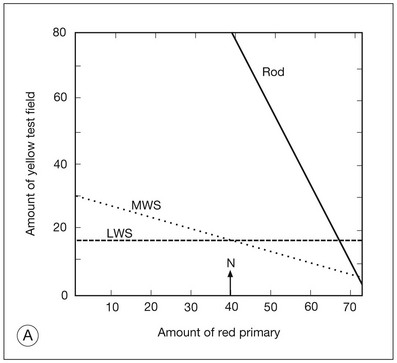
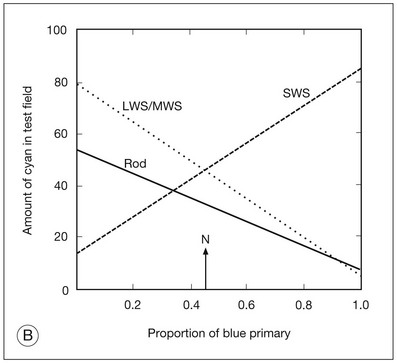
Fig. 10.8 Graphic analysis of the Rayleigh equation and Moreland equation. (A) The Rayleigh equation. The relative light in the “yellow” (589 nm) test is plotted as a function of the proportion of the “red” (670 nm) primary. The lines are calculated from the cone and rod photopigment excitations. The line marked LWS represents the L-cone response of Figure 10.2B and predicts the matching behavior of deuteranopes. The line marked MWS represents the middle-wavelength cone response of Figure 10.2B and predicts the matching behavior of protanopes. The normal match (N) occurs at the intersection of the L and M lines. The line marked Rod represents the rod response of Figure 10.2A and predicts the matching behavior of achromats. (B) The Moreland equation. The relative light in the bicolor (480 nm + 580 nm) test is shown as a function of the proportion of the 440-nm primary. The lines are calculated from the cone and rod photopigment excitations. The line marked LWS/MWS represents the L- and M-cone response and predicts the matching behavior of tritanopes. The line marked SWS represents the short-wavelength cone response. The normal match (N) occurs at the intersection of the L/M line with the S line. The line marked Rod represents the rod response and predicts the matching behavior of achromats.
Anomaloscope analysis is important in ophthalmic disease assessment since it can be used to recognize a number of clinical entities, such as rod-dominated vision characteristic of cone degenerations and incomplete and complete achromatopsias. These diseases are characterized by Rayleigh matches extending along the rod line (solid line in Fig. 10.7A). Matching abnormalities that are characteristic of choroidal disorders affecting the fovea lead to Rayleigh matches that extend along or just below the L line but are shifted to higher red primary ratios (pseudoprotanomaly). The discrimination loss characteristic of optic nerve disorders leads to matches that widen around the normal match on the L line.
Anomaloscope color-matching test using the Moreland equation
The Moreland equation34 is a match of a bicolor test field (480 and 580 nm) to a mixture of two primaries (440 and 500 nm). The test field appears blue–green to a normal observer, while appearance of the mixture field appearance ranges from violet, to blue, to blue–green, to green–blue, to green as the primary ratio is changed from mostly 440 nm to mostly 500 nm. The primary ratio is expressed in terms of the amount of the 440 nm (“violet”) primary required for the match. As with the Rayleigh equation, an observer with normal color vision can find a primary ratio and test field luminance at which both fields appear identical.
The Moreland equation assesses the normality of S-cone function. Figure 10.8B shows the predicted function for a single photopigment to the bicolor test field as a function of the violet–green primary ratio. The L and M cones share the same line (dotted and labeled as L/M). The S-cone response crosses this on the diagonal (dashed and labeled as S). The predicted rod (solid line labeled as Rod) line has the same direction as the L- and M-cone lines. The normal match occurs at the intersection of the S-cone line with the L/M line. Both congenital and acquired color vision defects can be recognized using the Moreland equation.35 The tritanope (an observer lacking S-cone function) has matches extending along the L/M line, as do observers with acquired defects that affect S-cone function. Point mutations in the S-cone opsin gene on chromosome 7 have been reported in affected individuals in tritan pedigrees.36
Patients with X-linked achromatopsia (i.e., S-cone monochromacy) have matches that extend along the S-cone line. The majority of X-linked achromat pedigrees show major deletions of the region just preceding the cone opsin tandem gene array on the X chromosome in affected individuals.37 This region is thought to be a regulatory area controlling expression of the L- and M- cone opsin genes. Additionally, some X-linked achromat pedigrees show only a single abnormal gene instead of the normal tandem array. Patients with complete achromatopsia have matches extending along the rod line.
Computerized color vision tests
Color assessment and diagnosis (CAD) test
The CAD test was developed by Dr Barbur and coworkers at City University, London.38 The web-based CAD uses a color square that moves against a flickering luminance contrast noise. The color of the square changes along different chromaticity directions. Color-defective observers have difficulty seeing the square moving, whereas normal observers easily see the square move. The web-based CAD test requires a monitor to be balanced at around 9000 K and the ambient illumination must be kept at a minimum. It is reported that this web-based test has good sensitivity and specificity for red–green color deficiencies.39
Cambridge color test (CCT)
The CCT is a computer-controlled, easy-to-use color vision test. The CCT was developed by Drs Mollon, Reffin, and Regan at the University of Cambridge, England.40 The CCT system provides 14-bit color and luminance control on a calibrated CRT display. The stimulus is a Landolt C on an achromatic background. The chromaticity of the target C is varied along the protan, deutan, and tritan lines of a chromaticity diagram. The task is to indicate the position of the gap in the target C. A staircase procedure is used to measure discrimination thresholds along any of the three lines. The results are plotted as discrimination ellipses in a CIE space. Individuals with color vision deficiencies will have elongated discrimination ellipses along a protan, deutan, or tritan line and, therefore, this test can be used for all color vision deficiencies.
The portal color sort test (PCST)
The PCST is based on the FM-100 hue test but uses only 36 colored “chips,” which significantly reduces the testing time. The chips are representative of the original 85 chips in the FM-100 hue test. The observer arranges the order of the chips according to color similarities and the computer provides automatic scores. The correlation between the PCST and FM-100 hue test is high for testing congenital color vision defects but is unknown for testing acquired defects.41
New developments in color vision research
Gene therapy for color vision defects
Drs Jay and Maureen Neitz and coworkers have carried out pioneering studies on “curing” red–green color deficiency in dichromatic adult squirrel monkeys that were missing the L-cone opsin gene at birth.42,43 As gene therapy, the human L-cone opsin gene was delivered into the photoreceptor layers of the retinas of the monkeys. A few months after the introduction of the new opsin gene, these monkeys exhibited trichromatic color vision behavior with spectral sensitivity shifted, chromatic discrimination improved, and color perception enriched. An experiment involving gene therapy in humans would require approval from the National Institutes of Health Office of Recombinant DNA Activities (ORDA)/Recombinant DNA Advisory Committee (RAC) and the Food and Drug Administration and this would not be expected to be granted without a long and thorough approval process. However, the fundamental question of whether it is necessary to “cure” color deficiencies is currently the point of debate since the majority of dichromats live a normal life and most are not significantly affected by having the color vision deficiency.
Adaptive optics (AO) retinal imaging system
AO was initially used in astronomy to remove the effects of atmospheric distortion to improve the performance of telescopes and laser communication systems.44 An AO system has three components: (1) a wavefront sensor for ocular aberration measurement; (2) a deformable mirror for aberration correction; and (3) a control system that compares the sensor output and adjusts the deforming mirrors to achieve optimal resolution. This technology was first adopted for retinal imaging in the 1990s by Dr David Williams to reduce ocular aberrations in the eyes.45 After its initial introduction, the AO imaging system was considered to have great scientific and clinical application potential because it had the capability of imaging photoreceptors, the retinal pigment epithelium, retinal blood vessels and, potentially, ganglion cells at a high magnification. For instance, AO made it possible to measure color perception46 or cell responses in the postreceptoral pathways47 associated with tiny flashes of light stimulating a single cone in the eye. For color vision screening, in particular, the AO system can provide high resolution of the cone mosaic and it can show whether a particular type of cone (e.g., L cones) is missing in the retina. Combining this information with genetic studies is potentially informative because AO imaging can provide insights about cone distributions that can be related to the cone opsin genes.48 (See Chapter 5, Advanced imaging technologies, for more details about this topic.)
Rod and cone interactions in color vision
Duplex theory states that rods and cones independently contribute to different aspects of visual perception. However, rods and cones share common neural pathways from the retina to the brain and this provides a neural basis for rod–cone interactions in visual function, including color vision.49 Conventionally, rod vision has been considered to be achromatic. However, numerous psychophysical studies have indicated that rods contribute to color vision at either mesopic50 or even scotopic light levels.51 Psychophysical evidence for rod contributions to color vision comes from measurements of scotopic color contrast,52 photochromatic intervals during the course of dark adaptation following a light bleach,53 chromatic discrimination,54 and color-matching or color appearance methods using unique hue measurement or hue-scaling methods.55,56
Recently, rod contributions to color vision were studied using a four-primary Maxwellian-view photostimulator57 that allowed independent control of rod and cone excitations at the same chromaticity, retinal locus, and light level. This new method has yielded new insights into rod contributions to color vision. Specifically, rods contribute to color percepts in a manner analogous to M-cone signals at all mesopic light levels and analogous to S-cone signals only at low mesopic light levels near cone thresholds.50 Also, the strength of rod contributions is linearly related to rod contrasts.58
References
1. Hood, DC, Finkelstein, MA. Sensitivity to light. In: Boff KR, Kaufman L, Thomas JP, eds. Handbook of perception and human performance, vol I: Sensory processes and perception. New York: John Wiley; 1986:5-1–5-66.
2. Smith, VC, Pokorny, J, Lee, BB, et al. Sequential processing in vision: The interaction of sensitivity regulation and temporal dynamics. Vision Res. 2008;48:2649–2656.
3. Goldberg, SH, Frumkes, TE, Nygaard, RW. Inhibitory influence of unstimulated rods in the human retina: evidence provided by examining cone flicker. Science. 1983;221:180–182.
4. Cao, D, Zele, AJ, Pokorny, J. Dark-adapted rod suppression of cone flicker detection: evaluation of receptoral and postreceptoral interactions. Vis Neurosci. 2006;23:531–537.
5. Sharpe, LT, Stockman, A. Rod pathways: the importance of seeing nothing. Trends Neurosci. 1999;22:497–504.
6. Dacey, DM. Parallel pathways for spectral coding in primate retina. Annu Rev Neurosci. 2000;23:743–775.
7. Lee, BB. Visual pathways and psychophysical channels in the primate. J Physiol. 2011;589.1:41–47.
8. Lee, BB, Smith, VC, Pokorny, J, et al. Rod inputs to macaque ganglion cells. Vision Res. 1997;37:2813–2828.
9. Crook, JD, Davenport, CM, Peterson, BB, et al. Parallel ON and OFF cone bipolar inputs establish spatially coextensive receptive field structure of blue-yellow ganglion cells in primate retina. J Neurosci. 2009;29:8372–8387.
10. Field, GD, Greschner, M, Gauthier, JL, et al. High-sensitivity rod photoreceptor input to the blue-yellow color opponent pathway in macaque retina. Nat Neurosci. 2009;12:1159–1164.
11. Bartlett, NR. Dark adaptation and light adaptation. In: Graham CH, ed. Vision and visual perception. New York: John Wiley; 1965:185–207.
12. Graham, CH. Vision and visual perception. New York: John Wiley; 1965.
13. Shevell, SK, Kingdom, FA. Color in complex scenes. Annu Rev Psychol. 2008;59:143–166.
14. Smith, VC, Pokorny, J. Spectral sensitivity of the foveal cone photopigments between 400 and 500 nm. Vision Res. 1975;15:161–171.
15. MacLeod, DIA, Boynton, RM. Chromaticity diagram showing cone excitation by stimuli of equal luminance. J Opt Soc Am. 1979;69:1183–1185.
16. Boynton, RM, Kambe, N. Chromatic difference steps of moderate size measured along theoretically critical axes. Color Res Appl. 1980;5:13–23.
17. Derrington, AM, Krauskopf, J, Lennie, P. Chromatic mechanisms in lateral geniculate nucleus of macaque. J Physiol (Lond). 1984;357:241–265.
18. Lee, BB, Martin, PR, Valberg, A. Sensitivity of macaque retinal ganglion cells to chromatic and luminance flicker. J Physiol (Lond). 1989;414:223–243.
19. Pokorny, J, Smith, VC. Chromatic discrimination. In: Chalupa LM, Werner JS, eds. The visual neuroscience. Cambridge, MA: MIT Press; 2004:908–923.
20. Pokorny, J, Smith, VC. Wavelength discrimination in the presence of added chromatic fields. J Opt Soc Am. 1970;69:562–569.
21. Wright, WD. The sensitivity of the eye to small colour differences. Proc Phys Soc (Lond). 1941;53:93–112.
22. MacAdam, DL. Visual sensitivities to color differences in daylight. J Opt Soc Am. 1942;32:247–274.
23. Cao, D, Zele, AJ, Smith, VC, et al. S-cone discrimination for stimuli with spatial and temporal chromatic contrast. Vis Neurosci. 2008;25:349–354.
24. Krauskopf, J, Gegenfurtner, K. Color discrimination and adaptation. Vision Res. 1992;32:2165–2175.
25. von Kries, J. Influence of adaptation on the effects produced by luminous stimuli. In: MacAdam DL, ed. Sources of color science. Cambridge, MA: MIT Press, 1905.
26. Shevell SK, Cao D, eds. Chromatic assimilation: evidence for a neural mechanism. Oxford: Oxford University Press, 2003.
27. Neitz, J, Neitz, M. The genetics of normal and defective color vision. Vision Res. 2011;51:633–651.
28. Nathans, J, Piantanida, TP, Eddy, RL, et al. Molecular genetics of inherited variation in human color vision. Science. 1986;232:203–210.
29. Working-Group-41. Procedures for testing color vision, NAS-NRC Committee on Vision. Washington, DC: National Academy Press; 1981.
30. Pokorny, J, Smith, VC, Pinckers, AJLG, et al. Classification of complete and incomplete autosomal recessive achromatopsia. Graefes Arch Clin Exp Ophthalmol. 1982;219:121–130.
31. Nathans, J, Hogness, DS. Isolation and nucleotide sequence of the gene encoding human rhodopsin. Proc Natl Acad Sci USA. 1984;81:4851–4855.
32. Smith, VC, Pokorny, J, Pass, AS. Color-axis determination on the Farnsworth-Munsell 100-hue Test. Am J Ophthalmol. 1985;100:176–182.
33. Pokorny J, Smith VC, Verriest G, et al, eds. Congenital and acquired color vision defects. New York: Grune and Stratton, 1979.
34. Moreland, JD, Kerr, J. Optimization of stimuli for trit-anomaloscopy. Mod Probl Ophthalmol. 1978;19:162–166.
35. Pokorny, J, Smith, VC, Went, LN. Color matching in autosomal dominant tritan defect. J Opt Soc Am. 1981;71:1327–1334.
36. Weitz, CJ, Miyake, Y, Shinzato, K, et al. Human tritanopia associated with two amino acid substitutions in the blue-sensitive opsin. Am J Hum Genet. 1992;50:156.
37. Nathans, J, Davenport, CM, Maumenee, IH, et al. Molecular genetics of human blue cone monochromacy. Science. 1989;245:831–838.
38. Barbur, J, Harlow, A, Plant, G. Insights into the different exploits of colour in the visual cortex. Proc Biol Sci. 1994;258:327–334.
39. Seshadri, J, Christensen, J, Lakshminarayanan, V, et al. Evaluation of the new web-based “Colour Assessment and Diagnosis” test. Optom Vision Sci. 2005;82:882–885.
40. Regan, BC, Reffin, J, Mollon, JD. Luminance noise and the rapid determination of discrimination ellipses in colour deficiency. Vision Res. 1994;34:1279–1299.
41. Melamud, A, Simpson, E, Traboulsi, EI. Introducing a new computer-based test for the clinical evaluation of color discrimination. Am J Ophthalmol. 2006;142:953–960.
42. Mancuso, K, Mauck, MC, Kuchenbecker, JA, et al. A multi-stage color model revisited: implications for a gene therapy cure for red-green colorblindness. Adv Exp Med Biol. 2010;664:631–638.
43. Mancuso, K, Hauswirth, WW, Li, Q, et al. Gene therapy for red-green colour blindness in adult primates. Nature. 2009;461:784–787.
44. Tyson, RK. Principles of adaptive optics. San Diego, CA: Academic Press; 1991.
45. Liang, J, Williams, DR, Miller, DT. Supernormal vision and high-resolution retinal imaging through adaptive optics. J Opt Soc A. 1997;14:2884–2892.
46. Hofer, H, Singer, B, Williams, DR. Different sensations from cones with the same photopigment. J Vis. 2005;5:444–454.
47. Sincich, LC, Zhang, Y, Tiruveedhula, P, et al. Resolving single cone inputs to visual receptive fields. Nat Neurosci. 2009;12:967–969.
48. Williams, DR. Imaging single cells in the living retina. Vision Res. 2011;51:1379–1396.
49. Buck, SL. Rod–cone interaction in human vision. In: Chalupa LM, Werner JS, eds. The visual neuroscience. Cambridge, MA: MIT Press; 2004:863–878.
50. Cao, D, Pokorny, J, Smith, VC. Matching rod percepts with cone stimuli. Vision Res. 2005;45:2119–2128.
51. Pokorny, J, Lutze, M, Cao, D, et al. The color of night: surface color perception under dim illuminations. Vis Neurosci. 2006;23:525–530.
52. Willmer, EN. Low threshold rods and the perception of blue. J Physiol (Lond). 1949;111:17P.
53. Lie, I. Dark adaptation and the photochromatic interval. Doc Ophthalmol. 1963;17:411–510.
54. Stabell, U, Stabell, B. Wavelength discrimination of peripheral cones and its change with rod intrusion. Vision Res. 1977;17:423–426.
55. Buck, SL, Knight, RF, Bechtold, J. Opponent-color models and the influence of rod signals on the loci of unique hues. Vision Res. 2000;40:3333–3344.
56. Volbrecht, VJ, Nerger, JL, Imhoff, SM, et al. Effect of the short-wavelength-sensitive-cone mosaic and rods on the locus of unique green. J Opt Soc Am A. 2000;17:628–634.
57. Pokorny, J, Smithson, H, Quinlan, J. Photostimulator allowing independent control of rods and the three cone types. Vis Neurosci. 2004;21:263–267.
58. Cao, D, Pokorny, J, Smith, VC, et al. Rod contributions to color perception: linear with rod contrast. Vision Res. 2008;48:2586–2592.