Chapter 8 Clinical Electrophysiology
Standard full-field ERG
Stimulus and recording devices
The human ERG recorded at the cornea and elicited by a full-field stimulus is a mass response generated by cells across the entire retina. To obtain reproducible amplitudes and implicit times in the response, the stimulus and background light should be homogeneous and cover the entire retina, so all of the receptors are stimulated or adapted in a relatively homogeneous manner. The full-field, or Ganzfeld, stimulator represents such a stimulus. It consists of a large-diameter (40-cm) hemispheric dome (see Chapter 7, Electrogenesis of the electroretinogram) with a xenon stroboscopic light bulb placed at the top of the dome. This stimulus system has been recommended by the International Society of Clinical Electrophysiology for Vision (ISCEV) Standards Committee1 for use when obtaining clinical ERG recordings internationally.
The ERG is recorded using corneal electrodes, usually referred to surface reference electrodes at the ipsilateral outer canthi or zygomatic fossae. Electrodes in common use2 include the Burian–Allen and the ERG jet, both of which are contact lens electrodes, the gold foil, Dawson–Trick–Litzkow (DTL), and H–K loop electrodes, which are noncontact lens. The representative electrodes are shown in Fig. 8.1.
Stimulus intensity versus ERG responses and components
Scotopic condition
Figure 8.2 shows the full-field ERGs elicited by increasing stimulus intensities from a normal subject after 1 hour of dark adaptation. The ERGs elicited by relatively weak stimulus intensities are shown at the left and those by stronger stimulus are shown at the right. The calibrations for the amplitude and time are different for the weak and strong stimulus ERGs. The maximum stimulus luminance (0 log unit) is 44.2 cd/m2/s.
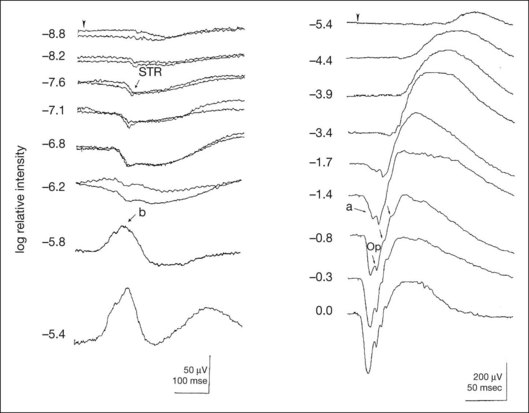
At the left, the scotopic threshold response (STR),3 a cornea-negative wave, is first recorded at –8.2 log units, approximately 0.6 log units higher than psychophysical threshold. The maximum amplitude of STR is approximately 20 µV before it is masked by the developing b-wave. The implicit time of the STR near threshold is approximately 160 ms, and the implicit time decreases as the stimulus intensity increases. The STR originates from retinal neurons that are postsynaptic to the photoreceptors (see Chapter 7, Electrogenesis of the electroretinogram).
As shown fully in Chapter 7, Electrogenesis of the ERG, many studies have shown that the a-wave of the full-field ERGs recorded in the dark is the leading edge of the photoreceptor potential.4 The b-wave originates indirectly from bipolar and Müller cells in the middle layers of the retina.5 The OPs are seen as a series of three or four rhythmic wavelets having almost equal intervals of about 6.5 ms in humans.6 The best experimental evidence indicates that the OPs reflect the activity of feedback synaptic circuits within the retina and represent an inhibitory or modulating effect of amacrine cells on the b-wave.7
Photopic condition
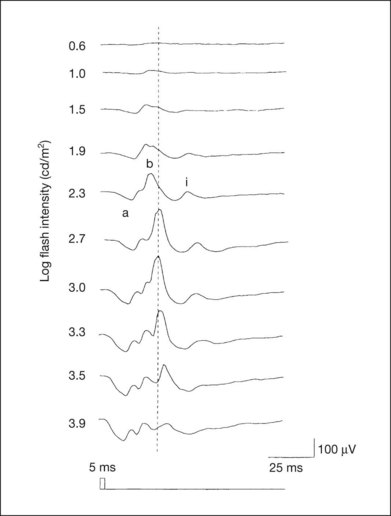
The photopic, short-flash ERGs elicited by increasing stimulus intensities in a normal subject are shown in Fig. 8.3.8 At lower stimulus intensities, the amplitude of the b-wave increases with increasing stimulus until it reaches a maximum at a stimulus intensity of 3.0 log cd/m2. Further increases in the stimulus intensity result in a progressive decrease in the amplitude of the b-wave. Because a plot of the b-wave amplitude as a function of the stimulus intensity has an inverted U shape, this phenomenon has been termed the photopic hill phenomenon.9.
Bright flash mixed rod–cone ERG
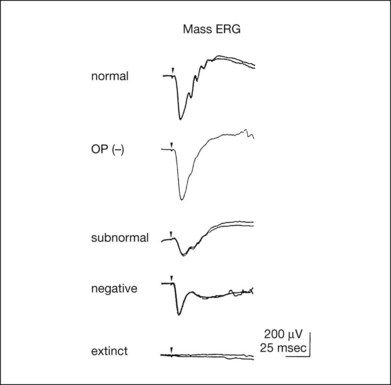
ERG recorded with a bright flash of light after dark adaptation for 30 minutes or longer (0 log unit in Fig. 8.2) shows mixed rod–cone response, which can provide variable information about retinal pathology and is of significant diagnostic value. We have an impression that about 70% of ERG information can be obtained by the evaluation of only the mixed rod–cone ERG. The five different types of mixed rod–cone ERG are shown in Fig. 8.4.
Normal
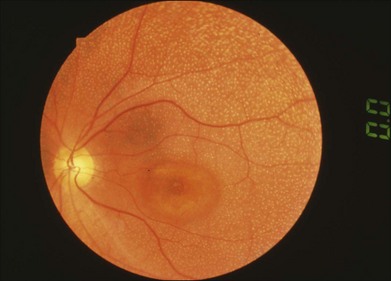
The normal type shows a-wave, b-wave, and OPs. The amplitude of b-wave is always larger than that of a-wave in the regular stimulus intensity range. The normal ERG can be seen in patients with localized macular dysfunction, optic nerve diseases, and central nervous system disease such as amblyopia. Even when the entire retina is ophthalmoscopically abnormal, such as rubella retinopathy or female carrier of ocular albino and choroideremia (Fig. 8.5), the ERG can be essentially normal.
Selectively abnormal oscillatory potentials
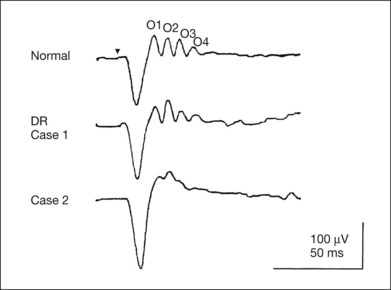
An OP abnormality means either reduction of amplitude or delay of implicit time, or both. A selective OP abnormality is observed in the early stage of diabetic retinopathy10,11 (Fig. 8.6) or mild circulatory disturbance of retina such as central retinal vein occlusion.
Subnormal
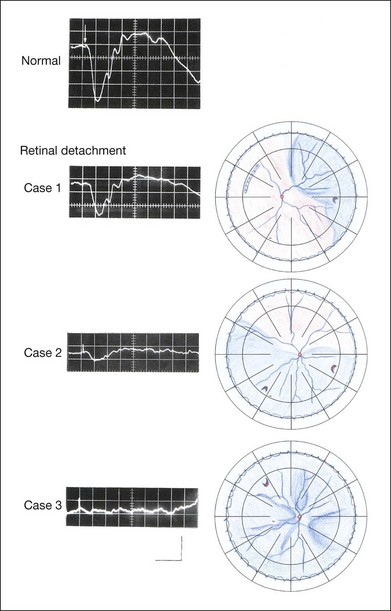
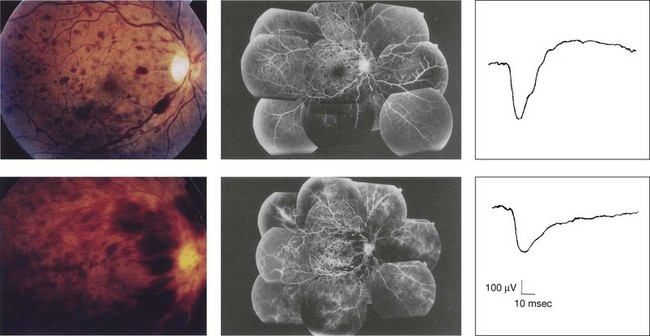
The amplitudes of all components are reduced approximately to the same degree. A reduced a-wave indicates abnormal photoreceptor function. This pattern is seen in patients with localized damage of the photoreceptors, such as partial retinal detachment or sectoral retinal degeneration. The amplitude of the full-field ERG is proportional to the area of functioning retina. This rule is shown when the extent of retinal detachment is compared with the ERG (Fig. 8.7).
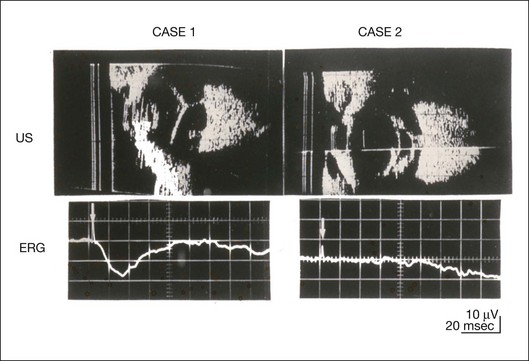
This rule is also shown in eyes with panretinal photocoagulation (PRP) in diabetic retinopathy. Following PRP, the amplitudes of ERG components are reduced by 40–45%, but the b-wave : a-wave (b/a) ratio is not changed significantly.11 When the media is hazy due to vitreous hemorrhage and the fundus is invisible, the presence or absence of retinal detachment is an important evaluation preoperatively. By combining ERG and ultrasonography, the differentiation between totally detached retina and dense vitreous membrane may be possible, as shown in Fig. 8.8. When the ERG is recordable, even if the amplitude is small, the thick membrane in the vitreous cavity is not totally detached retina, but vitreous membrane.
Negative
Prognostic value
Among the acquired retinal diseases, the negative ERG may be seen in severe retinal circulatory disturbance such as central retinal arterial occlusion or proliferative diabetic retinopathy. In central retinal vein occlusion, the ischemic type shows negative ERG more frequently than nonischemic type, indicating that the b/a ratio can be an important index for evaluating the prognosis of central retinal vein occlusion.12,13 Figure 8.9 shows a patient with an initially normal, but later lower, b/a ratio which resulted in negative configuration in ERG.11 The fluorescein angiogram changed from the nonischemic pattern to the ischemic pattern, showing an extensive nonperfusion area accordingly.
When massive vitreous hemorrhage prevents ophthalmoscopic examination of the fundus in patients with proliferative diabetic retinopathy, it makes it difficult to predict the surgical and visual outcome after vitrectomy. In these eyes, the amplitudes of the ERGs may be markedly reduced by various factors: pathological changes induced by the diabetic retinopathy, earlier PRP, and vitreous hemorrhage. As mentioned above, the PRP reduces the ERG amplitude without changing the b/a ratio.11 Because most diabetic patients with vitreous hemorrhage have undergone PRP, it is difficult to arrive at a prognosis of the outcome after vitrectomy using only the amplitudes. The b/a ratio provides more useful information about the visual prognosis after vitrectomy.14 The preoperative mixed rod–cone ERGs were classified into three groups in patients with diabetic retinopathy associated with significant vitreous hemorrhage (Fig. 8.10, left). Group A indicates those with a b/a ratio>1.0 and the OPs are clearly recordable. Group B includes those with a b/a ratio >1.0 but the OPs are absent. Group C comprises those with a b/a ratio <1.0 with absent OPs. Thick proliferative tissues were found at the disc (Fig. 8.11) intraoperatively in 36% of the eyes in group A, 67% in group B, and 90% in group C.14 It was suggested that the fibrous proliferation at the disc may restrict retinal circulation by compressing the central retinal artery.
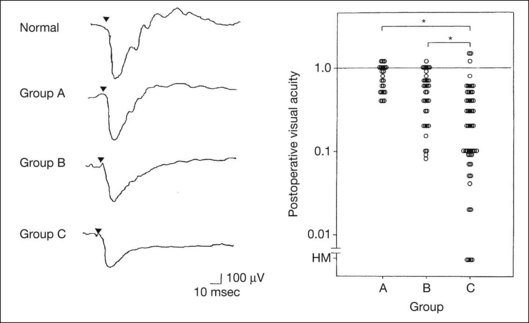
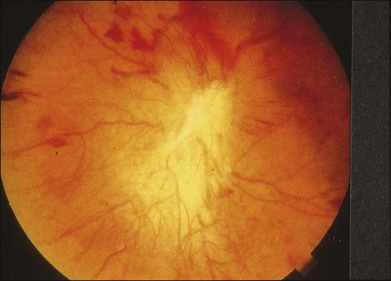
Fig. 8.11 Proliferative tissue on the optic disc in a patient with diabetic retinopathy.
(Reproduced with permission from Miyake Y. Electrodiagnosis of retinal diseases. Tokyo: Springer-Verlag; 2006.)
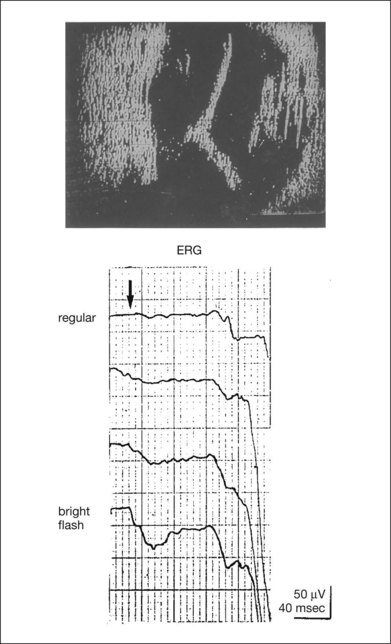
The distribution of the postoperative visual acuity for each group is shown in Fig. 8.10, right.14 The postoperative visual acuity for group C was significantly worse than for group A or group B. The low b/a ratio may indicate more severe ischemic retina, which in turn may account for the relatively good correlation with visual acuity. However, among the patients in group C, there were some whose postoperative visual acuity was good, indicating that a b/a ratio <1.0 is not necessarily a contraindication for vitrectomy. Another important finding is that most patients who have distinct OPs preoperatively have favorable visual acuity after vitrectomy. This observation is important when we discuss the visual prognosis with patients before surgery. The light-filtering effect of a dense vitreous hemorrhage should also be considered when evaluating the preoperative ERG in diabetic patients. Severe vitreous hemorrhage reduces the intensity of the stimulus light reaching the retina, which can increase the b/a ratio (Fig. 8.2). When the vitreous hemorrhage is extremely dense, the intensity of stimulus light may be decreased and the effective stimulus light to evoke ERG may not reach the retina. In such situations, we need a much brighter stimulus than the regular maximum stimulus to evoke ERG. Such an example is shown in Fig. 8.12. In such cases, we have an impression that ERG often has a negative configuration, as shown in this patient.
In the prognostic evaluation of eyes that develop endophthalmitis after intraocular lens implantation, the b/a ratio is also valuable.15 Eyes with early (within 1 week) endophthalmitis associated with a b/a ratio of <1.0 have a worse postoperative prognosis than eyes with late-onset endophthalmitis and/or a b/a ratio of >1.0. These observations are quite important when deciding on the appropriate time to perform vitrectomy for treatment. For example, a patient with endophthalmitis that was detected within 1 week of intraocular lens implantation and with an ERG b/a ratio of <1.0 should undergo vitrectomy urgently. On the other hand, when endophthalmitis develops a relatively long time after surgery and the ERG b/a ratio is >1.0, the timing of the vitrectomy is not as critical. Representative examples15 are shown in Fig. 8.13.
Diagnostic value
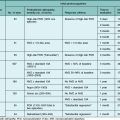
The negative ERG is seen in some hereditary retinal diseases, which provides diagnostic information, particularly when the a-wave amplitude is normal. The representative diseases, where the negative ERG shows the diagnostic value, include complete-type congenital stationary night blindness16 (CSNB: see Fig. 8.20, below), incomplete-type CSNB16 (see Fig. 8.20, below), X-linked juvenile retinoschisis11 (XLRS: see Fig. 8.20), juvenile-onset neuronal ceroid lipofuscinosis,17 and infantile Refsum disease. Since both complete and incomplete CSNB show essentially normal fundi and most patients with CSNB have moderately low visual acuity,16 the negative ERG finding is extremely important to pick up these disorders, differentiating them from other diseases with normal fundi, low visual acuity, and normal ERG, such as psychological eye problems, amblyopia, optic nerve disease, central nervous system disease, or occult macular dystrophy (OMD). The detailed findings separating rod and cone components will be treated later.
When the a-wave amplitude is normal and the b/a ratio is less than 1.0, the selective abnormality of the second-order neuron is indicated. On the other hand, when the amplitude of the a-wave is smaller than normal with the b/a ratio <1.0, there are two interpretations. One is the combined dysfunction of photoreceptor and middle retinal layer. This situation is often observed in patients with retinitis pigmentosa. The other is the ERG showing the photopic hill phenomenon8 (see above). When the rod function is completely gone and the cone function is well preserved, the ERG shows cone ERG even in the dark. In this condition, when the stimulus light intensity is strong, the ERG reveals the photopic hill phenomenon (Fig. 8.3), showing negative configuration with a small a-wave. Such examples are seen in bright flash mixed rod–cone ERG in the dark in Oguchi disease or fundus albipunctatus (FA) (Fig. 8.16).
In acquired diseases, negative ERG may be seen in melanoma-associated retinopathy,18,19 birdshot choroidopathy,20 ocular siderosis, quinine retinopathy, and methanol toxicity. The negative configuration of ERG provides the diagnostic value in these disorders (see Chapters 76, White spot syndromes and related diseases; 77, Autoimmune retinopathies; 89, Drug toxicity of the posterior segment; and 134, Remote effects of cancer of the retina).
Extinct
The extinct ERG is often seen in the advanced stage of rod–cone dystrophy, including retinitis pigmentosa, gyrate atrophy or choroideremia, and total retinal detachment. In retinitis pigmentosa, gyrate atrophy, or choroideremia, even when the macular area is preserved, ERG may become undetectable. Cancer-associated retinopathy,19 an autoimmune retinopathy, may often show extinct ERG and should be differentiated from retinitis pigmentosa.
Isolation of rod and cone components in standardized ERG
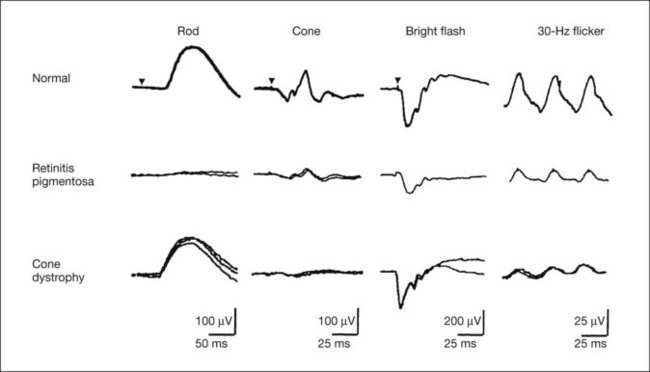
Although the rods outnumber the cones 13 to 1 in the normal human retina, the cone ERG response accounts for 20–25% of the ERG response amplitude. For the purposes of diagnosis, it often becomes necessary for the examiner to evaluate rod and cone activity separately. The full-field ERGs using the ISCEV Standard (see Chapter 7, Electrogenesis of the electroretinogram) in a normal subject are shown in Fig. 8.14.
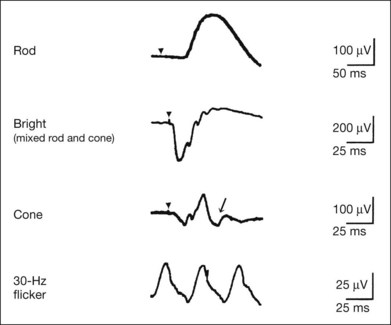
After 30 minutes of dark adaptation, a rod (scotopic) ERG is recorded with a dim flash of light at approximately –3.9 log units in Fig. 8.2. A bright flash (mixed rod–cone) ERG is elicited by a single flash of white light at maximum intensity of log 0 units in Fig. 8.2. Cone and 30-Hz flicker ERG are recorded with a stimulus intensity of 3.3 log units in Fig. 8.3 under the background illumination of 40 cd/m2, which is sufficient to suppress all rod activity. The photopic recordings (cone and 30-Hz flicker ERG) are made after 10 minutes of light adaptation to 40 cd/m2, because the maximum photopic ERG can be obtained when recorded after light adaptation.11 In addition to the conventional ERG components, the photopic negative response (PhNR) was introduced21: this originates from retinal ganglion cells and will be treated more fully later.
Cone photoreceptor dysfunction
The congenital stationary disorder of cone dysfunction is represented by rod monochromacy which is inherited in an autosomal recessive mode. This disorder is characterized in the complete form by complete absence or severely depressed color vision, reduced visual acuity, nystagmus, and photophobia11 (see Chapter 44, Abnormalities of cone and rod function). There is also an incomplete form of this disorder, where color vision and/or visual acuity is not severely affected11 (see Chapter 44). In both forms, the fundus and fluorescein angiograms are normal, and the most characteristic feature in terms of the diagnosis is selective reduction or absence of the photopic components while preserving normal scotopic components of the full-field ERG even in incomplete form (Fig. 8.15). Molecular genetic studies have shown that mutations in the CNGB3 gene encoding the β-subunit of the cone photoreceptor cGMP-gated channel are responsible for rod monochromacy.22
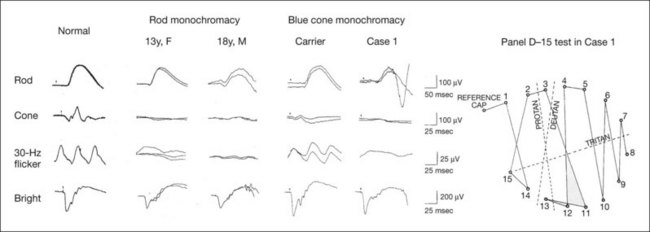
Blue cone monochromacy shares many characteristics with rod monochromacy, except that the hereditary mode is X-linked recessive11 (see Chapter 44, Abnormalities of cone and rod function). The visual acuity is approximately 0.2–0.3, which is slightly better than that of the complete form of rod monochromacy. Unlike rod monochromacy, the blue cone function is selectively preserved. Panel D-15 test shows several crossing lines perpendicular to the tritan axis (Fig. 8.15). The fundus is essentially normal, although in the late stage some atrophic changes may develop in the macula. The molecular genetics study indicated that mutations exist in the red and green opsin in the blue cone monochromacy. The full-field ERGs are similar to those of rod monochromacy, showing nearly normal rod ERGs with absence of the photopic ERG (Fig. 8.15). Although the blue cone ERG is normally present, the amplitude of the normal blue cone ERG is too small to be detected in the regular full-field cone ERG, and the implicit time is too long to follow 30-Hz flicker ERG stimuli (see section on S-cone ERG, below).
Rod photoreceptor dysfunction
Oguchi disease, first reported by Oguchi23 in 1907, is an unusual form of CSNB with autosomal recessive inheritance. It is characterized by a peculiar grayish white discoloration of the fundus. This unusual fundus coloration disappears after a long period of dark adaptation, which is called the Mizuo–Nakamura phenomenon24 (see Chapter 44, Disorders of rod and cone function). Only the rod function is abnormal and is absent after 30 minutes of dark adaptation, but the subjective and electroretinographic rod function may increase after 2–3 hours of dark adaptation.25 Mutations in the gene of arrestin26 or the rhodopsin kinase,27 both of which are rod phototransduction, cause the recessive form of Oguchi disease.
Full-field ERGs (Fig. 8.16) recorded after 30 minutes of dark adaptation show absent rod ERG and essentially normal cone-mediated ERG.25 The mixed rod–cone ERG has a negative configuration with relatively well-preserved OPs. The a-wave amplitude in Oguchi disease is reduced compared to that of normal controls. As mentioned above, this ERG indicates the cone ERG in spite of the fact that the ERG is recorded in the dark and after 30 minutes of dark adaptation, because rod function is absent even under this condition. When the cone ERG is recorded with a bright flash of light, it shows the photopic hill phenomenon, and the ERG configuration is negative with a small a-wave. After 3 hours of dark adaptation, the amplitudes of the a-wave and b-wave of the mixed rod–cone ERGs are larger, but they are still negative in configuration. As the mutated genes indicate, the pathogenesis that only the rod itself is impaired in Oguchi disease is comparable to the normal photopic ERG and negative configuration with small a-wave in mixed rod–cone ERG, but the negative configuration with normal a-wave after a long time of dark adaptation may suggest some additional abnormalities of the bipolar cell function. Electro-oculogram (EOG) is abnormal with low light to dark ratio in most patients with Oguchi disease.25
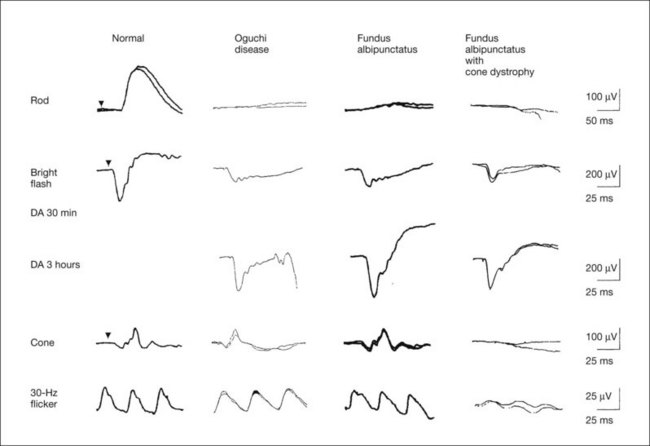
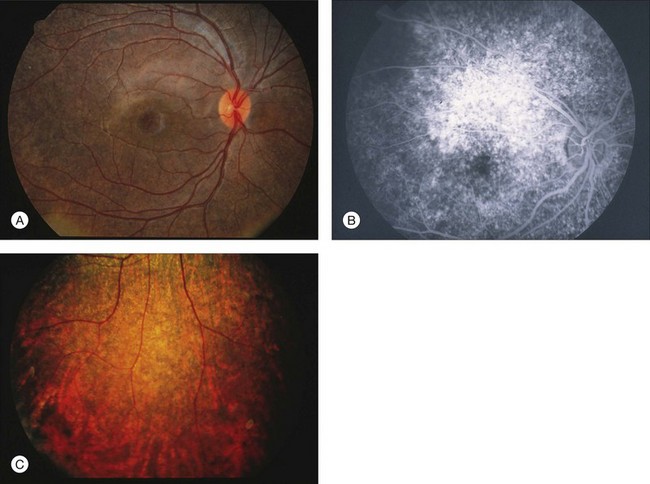
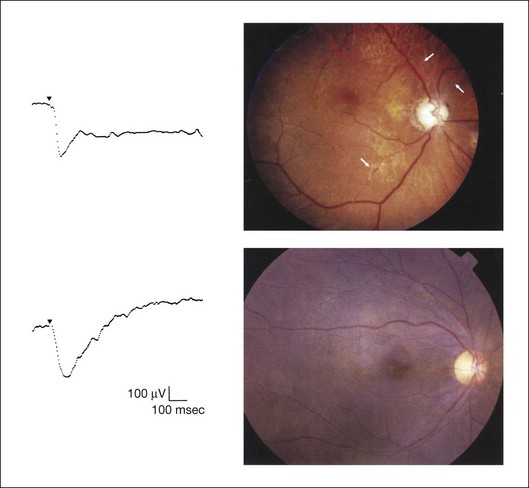
In FA, the rod ERG is absent after 30 minutes of dark adaptation but becomes normal after 3 hours of dark adaptation. The mixed rod–cone ERG after 30 minutes of dark adaptation shows a negative configuration with a small a-wave, just as is seen in the photopic phenomenon of Oguchi disease. However, unlike Oguchi disease, it becomes normal after 3 hours of dark adaptation. About one-third of patients with FA have associated cone dystrophy, often showing bull’s-eye maculopathy (Fig. 8.17). Such patients show extremely abnormal photopic ERGs in addition to the characteristic ERG findings of FA.
(Revised and reproduced with permission from Kondo M, Piao CH, Tanikawa A, et al. Japanese Journal of Ophthalmology 2000;44:20–8.)
The pathogenesis of Oguchi disease has long been believed to exist in the rod bipolar function, as seen in complete CSNB, because reports published a long time ago28 indicated normal a-wave with reduced b-wave (negative ERG) as well as normal EOG. In addition, normal rhodopsin kinetics were shown by rhodopsin densitometry.29 We demonstrated that many patients with Oguchi disease show smaller a-wave than normal and abnormal EOG, suggesting that there is a dysfunction of phototransduction.25 Our hypothesis, obtained from electrophysiological results, was proven true by mutated gene of Oguchi disease.26,27
FA has been considered to be a type of CSNB with autosomal recessive inheritance. The fundus has a characteristic appearance of a large number of discrete, small, round or elliptical yellowish white regions at the level of the retinal pigment epithelium (see Chapter 44, Abnormalities of cone and rod function). The most characteristic property of their visual function is a delay in dark adaptation, which can be detected by the psychologically determined dark adaptation curve, ERGs and EOGs. It requires 2–3 hours to attain the final dark adaptation threshold, the maximum scotopic ERG response, and the normal EOG light rise.11,29–31 Examples of full-field ERGs after 30 minutes of dark adaptation and after 3 hours of dark adaptation in a typical patient with FA are shown in Fig. 8.16. The scotopic (rod) ERG is absent after 30 minutes of dark adaptation but becomes normal after 3 hours of dark adaptation. The mixed rod–cone ERG after 30 minutes of dark adaptation shows a negative configuration with a small a-wave, just as is seen in Oguchi disease. However, unlike Oguchi disease, it becomes normal after 3 hours of dark adaptation. EOG is abnormal when measured in the regular method of 15 minutes of dark adaptation; however it becomes normal when the dark adaptation is prolonged.31 Mutations in the gene encoding 11-cis retinol dehydrogenase (RDH5) cause delayed dark adaptation and FA.32
Although FA has been believed to be a stationary condition, our study indicated that about one-third of patients with FA are progressive, and associated with cone dystrophy.33 Such patients often have bull’s-eye maculopathy (Fig. 8.17). In addition to the characteristic ERG findings of FA, the photopic ERGs are extremely abnormal (Fig. 8.16). All of these patients also showed RDH5 gene mutation.34 The ERG results have changed the disease concept of FA, which had been believed to be a subtype of CSNB.
Rod–cone or cone–rod photoreceptor dystrophy
Full-field ERGs in a typical patient with cone dystrophy and rod–cone dystrophy are shown in Fig. 8.18. Selective abnormalities of the photopic components (cone and 30-Hz flicker ERG) are seen in cone dystrophy and a more severe abnormality in rod than cone function is shown in retinitis pigmentosa as a representative disease of rod–cone dystrophy. At the advanced stage, most patients with cone dystrophy also have abnormal scotopic vision (cone–rod dystrophy) and may sometimes be difficult to differentiate from rod–cone dystrophy, such as retinitis pigmentosa.
Second-order neuron dysfunction
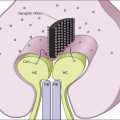
The fundamental differences between rod and cone connections to the bipolar cells are shown in Fig. 8.19.35 The photoreceptors transmit visual information to the bipolar cells, which are the second-order neurons. Rods contact only depolarizing (ON) bipolar cells (DBCs), creating ON visual pathways. On the other hand, cones have more extensive postsynaptic connections. They synapse on to depolarizing DBCs and hyperpolarizing OFF bipolar cells.
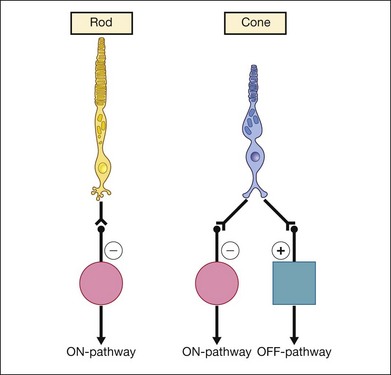
 ), creating ON visual pathways. On the other hand, cones have more extensive postsynaptic connections. They synapse on to depolarizing DBCs and hyperpolarizing OFF bipolar cells (HBCs:
  ).
).Complete and incomplete CSNB were classified as independent clinical entities based mainly on the analysis of full-field ERGs.36 Unlike Oguchi disease and FA, where the responsible pathology lies mainly in the rod itself, complete and incomplete CSNB are caused by the dysfunction of ON or ON–OFF bipolar cells, respectively.35,37 They are the model disorders of bipolar cell dysfunction. EOGs in both diseases are normal.36 It should be noted that all this new information in terms of the classification and pathology of both complete and incomplete CSNB was obtained from detailed analysis of ERG,36,37 and molecular genetics confirmed these ERG findings later.
The hereditary mode of complete CSNB is X-linked recessive or autosomal recessive.36 X-linked complete CSNB has a mutation of the leucine-rich repeat proteoglycan (NYX) gene,38 and autosomal recessive complete CSNB has a mutation of GRM6 gene39 encoding the metabotropic glutamate receptor mGluR6 and transient receptor potential cation channel subfamily member 1 (TRPM1).40 All these proteins are distributed on the postsynaptic ON bipolar cells and are required for the depolarization of the cell. The visual functions and ERGs are essentially the same in patients with these three different gene mutations, which have an almost complete block of ON synaptic transmission from the photoreceptors to the bipolar cells in both rod and cone visual pathways, preserving the OFF pathway intact.11
X-linked incomplete CSNB has a mutation of the calcium channel (CACNA1F) gene.41 Loss of the functional channel impairs the calcium influx into rods and cones that is needed to sustain the tonic release of neurotransmitters from the presynaptic terminals. Therefore it is conceivable that patients with incomplete CSNB have an incomplete defect of the synapses in the ON and OFF bipolar cells in both rod and cone visual pathways.11
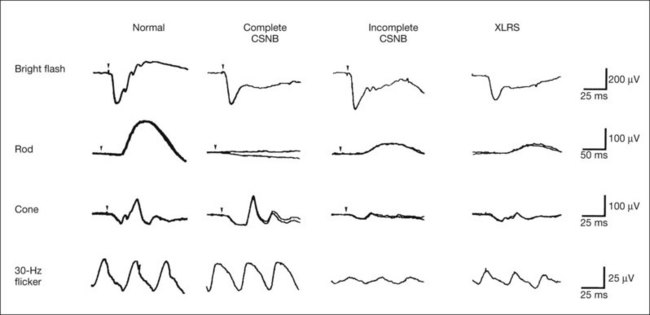
The comparison of full-field ERGs between complete and incomplete CSNB is shown in Fig. 8.20. The mixed rod–cone ERG shows a negative configuration with a normal a-wave in both types, but OPs can be better recorded in the incomplete type than the complete type. The normal a-wave with reduced b-wave suggests that both types of CSNB have a defect not in the rod photoreceptors but in the second-order neurons or their synapses in the rod visual pathway. These findings are comparable to molecular genetics.36–41 Rod ERG is absent in the complete type but present with subnormal amplitude in the incomplete type. Absent rod ERG in complete CSNB and subnormal rod ERG in incomplete CSNB are comparable to the pathology of complete defect (complete CSNB) and incomplete defect (incomplete CSNB) of rod bipolar cell transmission. On the other hand, cone and 30-Hz flicker ERGs appear nearly normal in the complete type except that the a-wave of the cone ERG has a plateau-like bottom (Fig. 8.20). In contrast, the cone and 30-Hz flicker ERGs are extremely reduced in incomplete CSNB, which is highly characteristic and extremely important for the differential diagnosis.
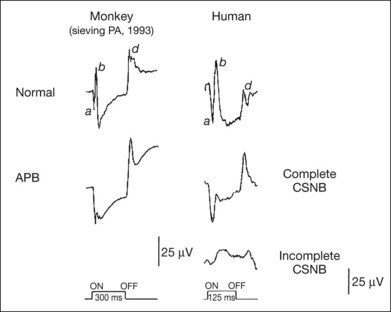
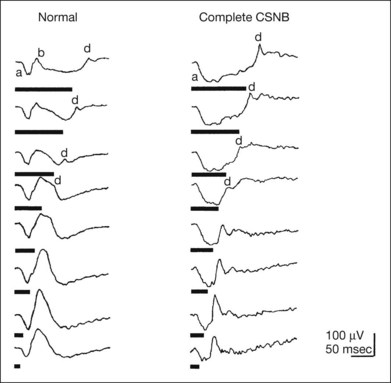
In spite of the complete defect of ON visual pathway, cone and 30-Hz flicker ERG of complete CSNB appear nearly normal. This mechanism can be explained by the analysis of photopic long-flash ERG35,37 as shown in Fig. 8.21. Using photopic ERGs elicited by long-duration square-wave stimuli, the cone ON response generated by depolarizing ON bipolar cells is selectively and severely depressed in patients with complete CSNB; moreover, the waveform is similar to that of monkeys after 2-amino-4-phosphonobutyric acid (APB) is injected into the vitreous to block the synapse between photoreceptors and ON bipolar cells.35 The OFF response, on the other hand, which is generated by hyperpolarizing bipolar cells, is intact in patients with complete CSNB, leading us to hypothesize that the ON function of both the rod and cone visual pathway is completely blocked in eyes with complete CSNB.35,37 The mechanism as to why normal-looking brief-flash cone ERG can be obtained under this condition is shown in Figure 8.22. With long-duration stimuli, the a-waves, b-waves, and d-waves are clearly separated. As the stimulus duration is shortened (brief-flash stimuli), the positive component of the photopic ERG consists mainly of the d-wave. Therefore even when the b-wave, a component of the ON response, is absent (as in complete CSNB), the d-wave replaces the b-wave, and a positive wave is recorded with brief-flash stimuli.11 With incomplete CSNB, on the other hand, the ON and OFF response are both subnormal, suggesting that the ON and OFF systems are incompletely disturbed at the level of the bipolar cells.11,37
XLRS is a vitreoretinal dystrophy that manifests early in life. XLRS is one of the more common causes of juvenile macular degeneration in males. Intraretinal cysts form in the macula and splitting of the retinal layers occurs in the peripheral retina (see Chapter 41, Hereditary vitreoretinal degenerations). Most patients, including young ones, show moderately poor visual acuity that gradually decreases with increasing age. Hypermetropia has been shown to be a frequent accompaniment of this disorder.42 In fact, many patients with XLRS are first diagnosed with hypermetropic amblyopia or heterotropia during infancy.
As mentioned above, mixed rod–cone ERG is of significant diagnostic value because of the negative configuration. The negative ERG is observed even when the retinoschisis is confined to the fovea ophthalmoscopically. The full-field ERG findings (Fig. 8.20) are similar to those of incomplete CSNB, suggesting that both ON and OFF bipolar cell function is mainly impaired in the rod and cone visual pathways. EOG in XLRS is normal.
The schisis occurs in the plane of the nerve fiber and ganglion cell layers of the retina. It has long been suggested that degenerating Müller cells or inner retinal cells may be the primary cause of the pathological changes in XLRS. The XLRS gene was cloned in 1997 and was designated RS1.43 However, the RS1 protein is heavily expressed in inner segments of both rod and cone photoreceptors and is also seen in cells of the inner nuclear layer. There is some discrepancy between the results of full-field ERG and genetic findings. Although the expression of RS1 protein is heavily concentrated in the inner segments of both rods and cones, electroretinographic studies suggest that it does not inherently affect the photoreceptor function of either cell type. And from the above ERG and EOG results, it currently is reasonable to propose that both ON and OFF pathways are defective, although precise subcellular localization has not yet determined whether both depolarizing and hyperpolarizing bipolar cells are involved.44
Focal ERG
In order to record the ERG responses with focal stimuli, there are two methods which have been reported in the past. The conventional focal macular ERG can show a similar waveform as a conventional photopic ERG from the limited area of macula.45 The advantage of this method is that the analysis of ERG components can be done using the same concept as that of full-field photopic ERG. By analyzing several components, layer-by-layer macular function can be evaluated.
Another method is the mfERG technique, which was developed in 1992.46 With this method, focal ERGs can be recorded simultaneously from multiple retinal locations during a single recording session using cross-correlation techniques. Unlike conventional focal macular ERGs, there are still questions about how this method works and what it measures because the technique is relatively new. We have an impression that the layer-by-layer analysis of the macula can be done more precisely using focal macular ERG than with mfERG.
Principle, method, and characteristics
The focal macular ERG is primarily used to evaluate macular function. The full-field ERG is unable to detect small focal lesions or pathogenesis in the retina, and is normal in the presence of macular diseases. In contrast, the full-field ERG may be undetectable when only macular function is preserved, such as in patients with retinitis pigmentosa.11
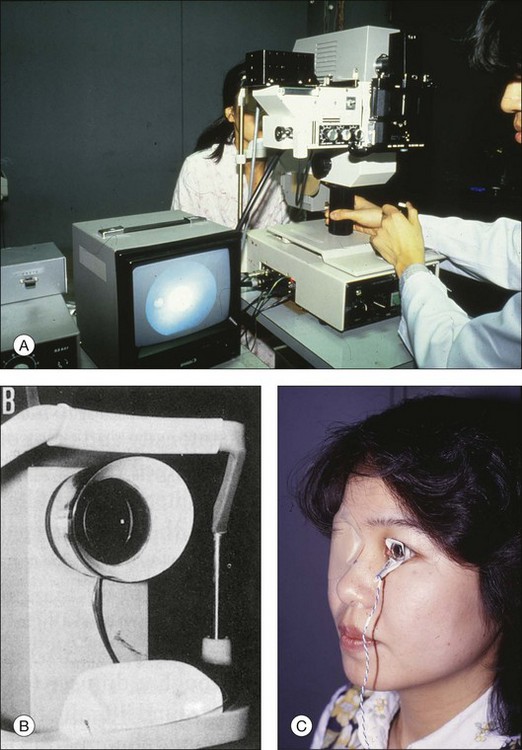
The principle of recording of focal macular ERG includes presenting a small stimulus to the macula and recording the response from the stimulated area by summating the responses using computer. To eliminate contaminating stray light responses, background illumination must be used to depress the sensitivity of the area surrounding the stimulus. By combining the focal stimulus with background illumination properly, focal responses can be recorded. It is also essential to monitor the location of the stimulus on the fundus during the recordings, particularly in eyes with a central scotoma, to be certain that only the fovea is stimulated. An example of a recording system of focal macular ERG is shown in Fig. 8.23. The examiner records the ERGs while monitoring the fundus by the infrared television fundus camera. The optical system of adequate combination of stimulus light and background illumination for focal stimulus is installed in the fundus camera, and the focal macular ERGs can be recorded under the fundus monitor by summating the responses with a computer. Focal macular ERGs recorded from a normal subject demonstrating the various components are shown in Fig. 8.24. All components of photopic ERG can be recorded: they are a-waves, b-waves, OPs, PhNR, ON and OFF components, and 30-Hz flicker responses.11
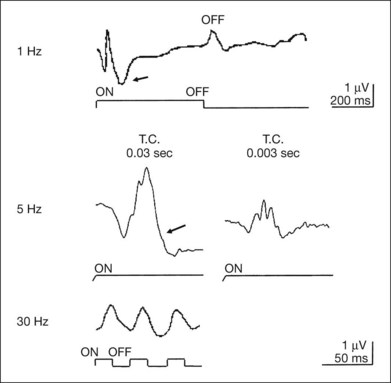
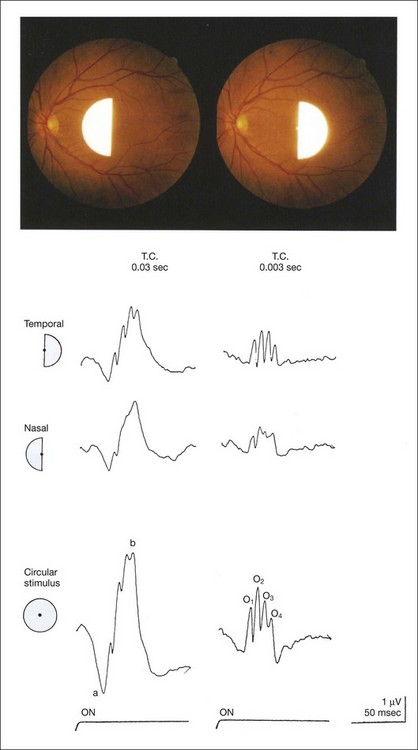
Several important characteristics of focal macular ERG in human were detected, particularly in macular OPs.45 An example is shown in Fig. 8.25, demonstrating nasotemporal asymmetry.47 Semicircular stimuli were used to compare the ERGs elicited by stimulating the temporal and nasal macula. The amplitudes and implicit times of the a-waves and b-waves in the nasal retina are almost identical to those from the temporal retina, whereas the amplitudes of OPs are much larger than in the temporal retina than those in the nasal retina. The amplitude of the focal ERGs recorded with circular stimulus is approximately the same sum as the amplitudes of the temporal and nasal ERGs.
The principle, recording method, and clinical applications of mfERG are described in an ISCEV guideline.48 Readers are also referred to Chapter 7, Electrogenesis of the ERG, where the origin of the mfERG is described in detail.
Clinical applications
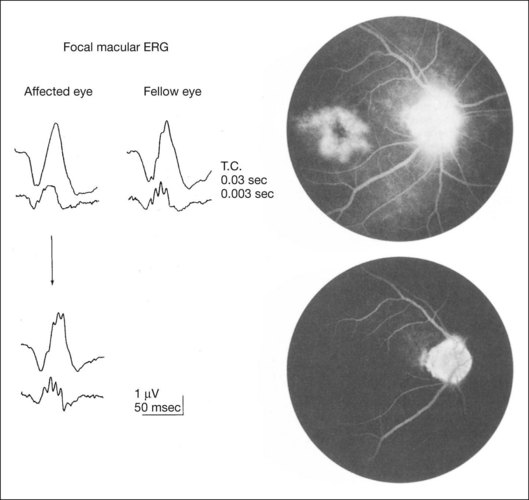
The examples of value of focal ERG are shown here. In focal macular ERG, the macular OPs are the most sensitive indicator in variable macular diseases. The selective reduction of macular OP amplitude is observed in the early stage of macular edema,49 epimacular membrane,50 and convalescent stage of central serous chorioretinopathy.51 The fluorescein angiograms and focal macular ERGs in an eye with pseudophakic cystoid macular edema (CME) and after resolution of CME are illustrated in Fig. 8.26. The OPs of the focal macular ERGs are selectively reduced compared with that of a normal fellow eye. The visual acuity of eye with CME was 0.6. Six months later, the CME resolved spontaneously, and fluorescein angiogram disclosed a normal pattern; the visual acuity improved to 1.2. The focal macular ERGs returned to normal levels, with the amplitude of the OPs comparable to those from the normal fellow eye.51
Occult macular dystrophy (OMD) is one of the most representative disorders where the focal macular ERG or multifocal ERG is a key for diagnosis. OMD was discovered by focal macular ERG in 1989.52 The clinical findings of OMD are progressive decrease of visual acuity, normal fundus and fluorescein angiograms, normal full-field ERGs, but abnormal focal macular ERG and multifocal ERG (Fig. 8.27). Although the fundus appearance and fluorescein angiogram show normal findings in OMD, optical coherence tomography (OCT) may reveal some mild abnormality from its early stage. Whether focal macular ERG or OCT is more sensitive to detect early abnormality is an interesting point of argument. The point is that OMD may not be a rare disease and that many patients with OMD may be misdiagnosed as having several other diseases, such as a psychological eye problem, optic nerve problem, central nervous system problem, or amblyopia.53
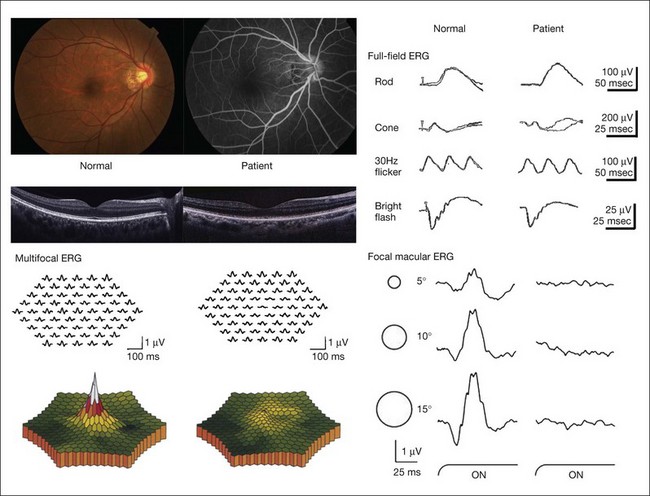
The hereditary mode of OMD is autosomal dominant, although some patients show sporadic mode.52,53 Our genetic studies have detected mutations in retinitis pigmentosa 1-like 1 (RP1L1) gene in autosomal dominant OMD.54 It was demonstrated that RP1L1 plays an essential role in cone function in humans and that disruption of RP1L1 function leads to OMD.
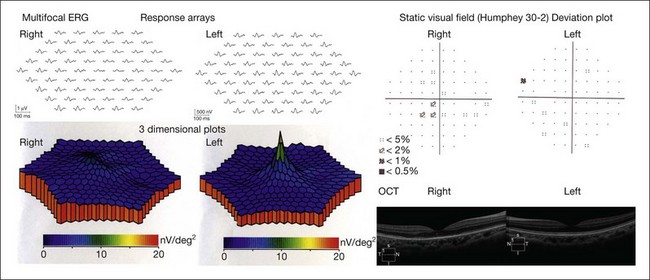
Acute zonal occult outer retinopathy is characterized by an acute zonal loss of one or more large zones of central retinal function in one or both eyes, predominantly in young women.55 Other ocular findings include initially minimum ophthalmoscopic changes, photophobia, and permanent visual field loss, often associated with late development of retinal pigmentary changes and narrowing of the retinal vessels in the affected zones (see Chapter 76, White-spot syndromes and related diseases). Since the full-field ERG may be normal or only slightly abnormal, it is not informative. The responses of mfERG become abnormal in the limited area where visual field loss is present11 (Fig. 8.28).
Other special responses or techniques in ERG
Pattern ERG
Pattern ERG (PERG) is the retinal response to a structured stimulus, such as a reversing black-and-white checkerboard or grating. The standard for PERG recording has been established by the ISCEV.56 While the luminance ERG is evoked by changes in stimulus luminance, the PERG is evoked by changes of stimulus contrast. The PERG is therefore a retinal response that is absent of a net change of stimulus luminance. The generators of the responses are mainly the retinal ganglion cells.57 Thus ganglion cell function can be evaluated by PERG.
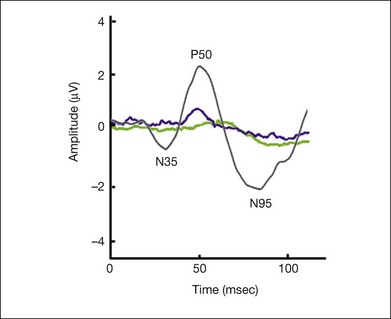
The waveform consists of an initial cornea-positive response, referred to as P50, followed by a cornea-negative response, referred to as N95 (Fig. 8.29). Holder58 reported in his review on PERG in 520 eyes that P50 was reduced with preganglion cell dysfunction but usually spared with optic nerve diseases. On the other hand, N95 loss was the most common abnormality and was reliably associated with optic nerve diseases.
Photopic negative response
PhNR has already been described and is a negative wave in photopic ERG that is evoked following the b-wave (Figs 8.14 and 8.24). The origin of the PhNR is the retinal ganglion cells,21 and this is fully described in Chapter 7, Electrogenesis of the ERG. Significant reduction in PhNR was reported in patients with open angle glaucoma and several other optic neuropathies.21 Moreover, recent analysis of PhNR recorded in focal macular ERG (Fig. 8.24) and mfERG has enabled objective assessment of retinal ganglion cell damage in glaucoma, optic nerve disease, and retinal vascular diseases.59,60 Other studies showed that PhNR can be correlated with retinal sensitivity as well as retinal microstructure such as nerve fiber thickness.61
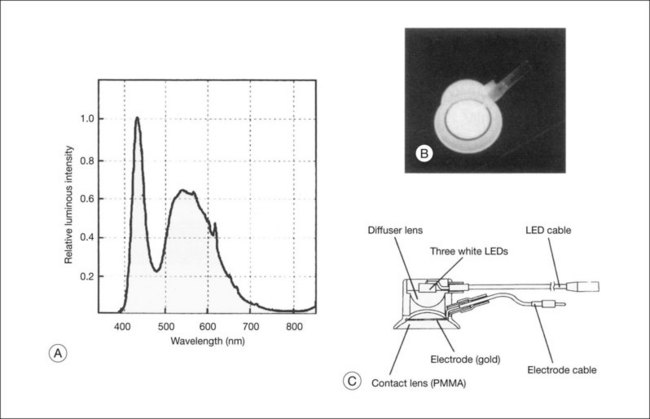
ERG recordings by LED
Light-emitting diodes (LEDs) (Fig. 8.30) have been in the limelight recently as light sources to elicit and record full-field ERG.62 The LEDs are small and inexpensive, and they require low currents to drive them. They can be controlled by a simple electronic circuit to give either a continuous light output or extremely brief flashes over a large range of intensities. The stimulus and recording system using LED can provide not only routine full-field ERG but also some other special usages for clinical ERG, as shown below.
ERG recording under general anesthesia11
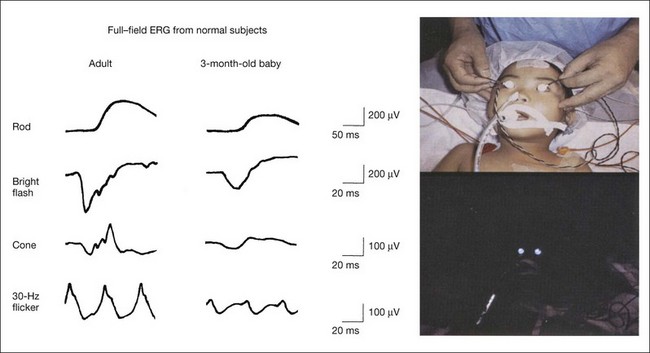
ERG recordings with LED are useful for recording standard ERGs from pediatric patients under general anesthesia. The equipment needed to obtain recordings that correspond to ISCEV standard ERGs is compact and easily portable.63 The ERGs recorded using an LED system on a 3-month-old baby under general anesthesia and a normal adult are compared in Fig. 8.31.
ERG monitoring during eye surgery
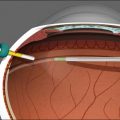
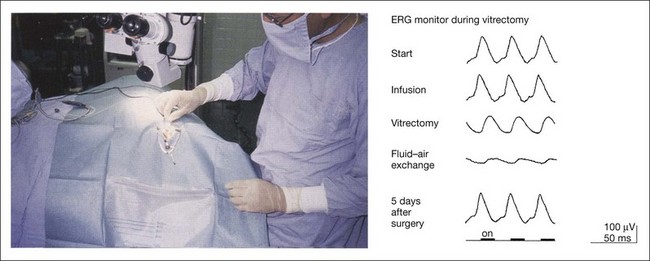
The LED contact lens electrode has been found to be highly suitable for this purpose.64 It is easily sterilized and is used as both a stimulus source and a recording electrode for 30-Hz flicker ERGs during vitreoretinal surgery (Fig. 8.32). An example of ERG monitor during vitrectomy from a patient with epimacular membrane is shown in Fig. 8.32. The ERGs recorded after local anesthesia (start), and after the introduction of the infusion needle into the vitreous cavity (infusion) were not significantly different in regard to amplitude and peak time. However, after vitrectomy, which required 10 minutes, the peak time was delayed and the amplitude decreased (vitrectomy). Additional studies have demonstrated that lowering the intravitreal temperature by applying an infusion solution kept at room temperature can alter the ERG during vitrectomy. Filling the whole vitreous cavity with air after the epimacular membrane was peeled off resulted in a markedly reduced amplitude and delayed peak time (fluid–air exchange). This extreme reduction of ERG following fluid–air or fluid–silicon oil exchange in the vitreous cavity results from reduced electrical conductivity in the vitreous cavity. Five days after surgery, when the air was resolved from the vitreous cavity, the ERG recovered to the postoperative amplitude and peak time.
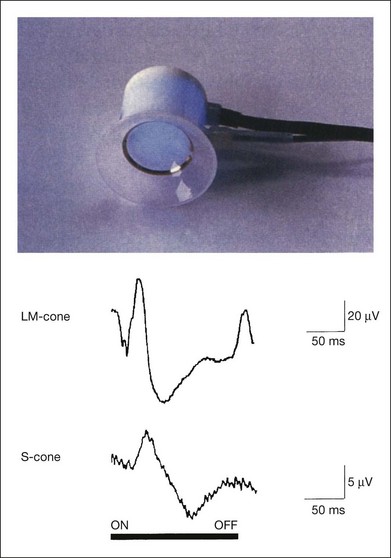
S-Cone ERG
Recording short-wavelength cone (S-cone) ERGs is valuable clinically because it allows us to evaluate the S-cone visual system. S-cone ERGs have been recorded using stimulation with strong blue stimuli on a bright yellow background, which suppresses the middle- and long-wavelength (LM) cone system.65 LEDs emitting blue light can be used in the LED built-in contact lens electrode66 (Fig. 8.33). By using bright yellow background illumination, the S-cone ERGs are recordable and are compared with LM cone ERGs (Fig. 8.33). The amplitude is much smaller and the implicit time is longer than those of the LM cone ERG. The components that reflect the “OFF” visual system (a-waves and d-waves) are essentially absent in S-cone ERGs because, unlike the LM cone system, the S-cone is mainly connected to the “ON” visual system.67
Electro-Oculogram
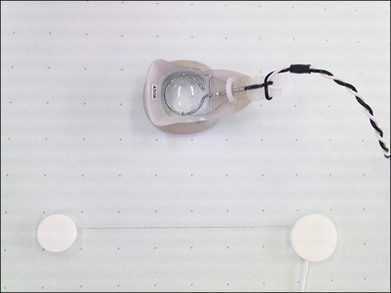
In 1849, Du Bois Reymond68 reported that in the normal eye there is a flow of electrical current, because the cornea is positive with respect to the back of the eye. The source of the voltage is the corneofundal potential. This potential difference is referred to as the standing potential or resting potential of the eye. The EOG is an indirect measure of the amplitude of the standing potential, which changes during dark and light adaptation. To obtain an EOG in humans, electrodes are placed at the inner and outer canthi of the eyes and the patient is asked to look back and forth between a pair of fixation lights (Fig. 8.34). When the cornea moves closer to one of the electrodes, it becomes more positive and the other electrode becomes more negative. The opposite happens when the eyes move to the other side.
The principle and practical use of EOG are described in the ISCEV standard.69 The changes in the amplitude of the EOG in the dark-adapted and light-adapted state of a normal subject are shown in Fig. 8.35. The smaller amplitudes are recorded when the eyes make the saccadic eye movements in the dark (dark trough); the peak amplitude is recorded against a steady light background (light peak). The light peak/dark trough (L/D) ratio is an index (Arden index)70 used to assess retinal function. Generally, a ratio of 1.80 is the lower limit of normal.
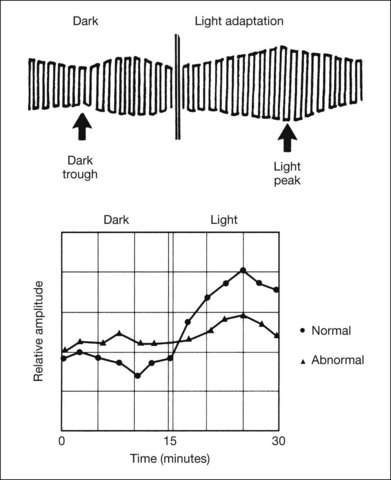
The origin of the retinal standing potential is thought to be in the retinal pigment epithelium. However, the light rise is generated by light stimulation of the photoreceptor–retinal pigment epithelium complex; and it is not detected when certain structures of the middle retinal layer is affected, such as in central retinal arterial occlusion.71
The EOG is generally abnormal in any condition in which the flash ERG is abnormal, except complete or incomplete CSNB.36 The reverse, however, is not true. An abnormal EOG with a normal ERG may be seen in Best disease, pattern dystrophy of the RPE, and dominant drusen. Detailed clinical values of EOG in each disease are described in Chapter 42, Macular dystrophies.
Visual Evoked Potential
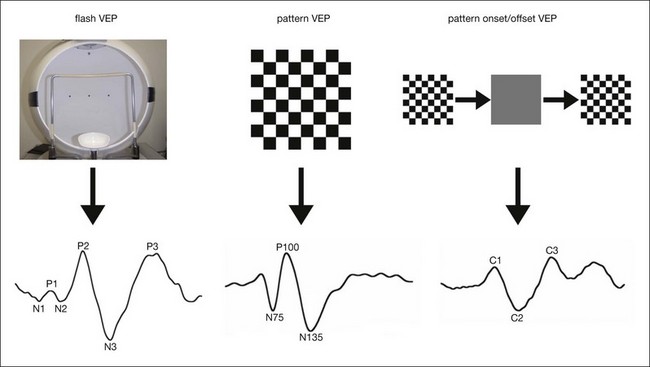
The visual evoked potential (VEP) is the signal of the brain evoked by the visual stimulus. It is recorded, like the electroencephalogram (EEG), at the scalp in the occipital region by surface electrodes. The principle and practical use of clinical VEP are shown in the ISCEV standard.72
The cellular sources of the VEP are poorly understood. VEPs can be recorded under either transient or steady-state stimulus conditions. The transient VEP includes flash VEP, pattern reversal VEP, and pattern onset/offset VEP (Fig. 8.34).
Several important features of the VEP can be stated:
1. The VEP is dominated by the central 20° of retina owing to “cortical magnification.”
2. The VEP is highly variable among individuals, but varies less than 10% bilaterally when responses from the two eyes of single person are compared.
3. VEP abnormality can result from abnormality in the retina, optic nerve, optic tracts, optic radiations, or visual cortex.
Flash VEP is easy to record, so is performed for evaluation of gross visual function in infants, small children, or in persons who are unable to perform PERG because of poor fixation due to poor visual function, nystagmus, or incorporation. Since flash VEP may still be recordable in patients with undetectable ERG, such as retinitis pigmentosa or dense vitreous hemorrhage, simultaneous recordings of flash VEP and ERG may provide useful information73 (Fig. 8.36).
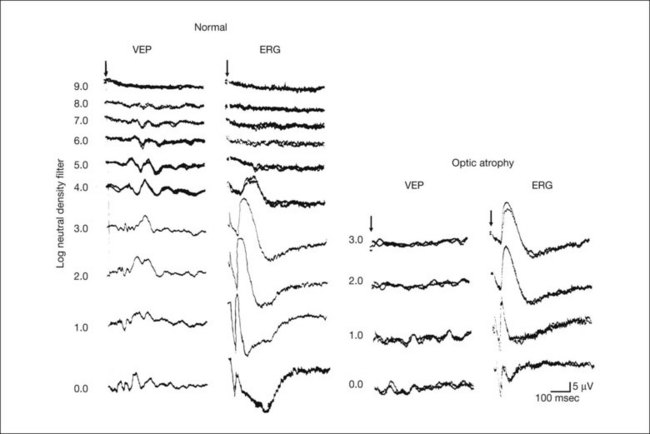
Fig. 8.36 Simultaneous recording of flash visual evoked potential (VEP) and full-field electroretinogram (ERG) with different stimulus intensities in a normal subject and in a patient with optic atrophy. For the recording, a silver disc electrode was placed on the scalp over the visual cortex at Oz according to the International 10/20 system74 for VEP and a Beckman’s electrode was attached to the center of the inferior eyelid. In a normal subject, stimulus threshold for VEP is much lower than that for ERG. In contrast, the stimulus threshold for VEP is higher than that for ERG in a patient with optic atrophy. This can be used to differentiate whether retina or optic nerve is the pathological site in eyes with opaque media. The arrow indicates stimulus onset.
1 Marmor MF, Fulton AB, Holder GE, et al. For the International Society for Clinical Electrophysiology of Vision. ISCEV Standard for full-field clinical electroretinography (2008 update). Doc Ophthalmol. 2009;118:69–77.
2 Gjötterberg M. Electrodes for electroretinography: A comparison of four different types. Arch Ophthalmol. 1986;104:569–570.
3 Sieving PA, Frishman LJ, Steinberg RH. Scotopic threshold response of proximal retina in cat. J Neurophysiol. 1986;56:1049–1061.
4 Brown KT. The electroretinogram: its components and their origins. Vision Res. 1968;8:633–677.
5 Newman EA, Odette LL. Model of electroretinogram b-wave generation: a test of the K+ hypothesis. J Neurophysiol.. 1984;51:164–182.
6 Cobb WA, Morton HB. A new component of the human electroretinogram. J Physiol. 1954;123:36–37.
7 Wachtmeister L, Dowling JE. The oscillatory potentials of the mudpuppy retina. Invest Ophthalmol Vis Sci. 1978;17:1176–1188.
8 Kondo M, Piao CH, Tanikawa A, et al. Amplitude decrease of photopic ERG b-wave at higher stimulus intensities in humans. Jpn J Ophthalmol. 2000;44:20–28.
9 Peachey NS, Alexander KR, Fishman GA, et al. Properties of the human cone system electroretinogram during light adaptation. Appl Optics. 1989;28:1145–1150.
10 Yonemura D, Aoki T, Tsuzuki K. Electroretinogram in diabetic retinopathy. Arch Ophthalmol. 1962;68:19–24.
11 Miyake Y. Electrodiagnosis of retinal diseases. Tokyo: Springer; 2006.
12 Karpe G, Uchermann A. The clinical electroretinogram. VII. The electroretinogram in circulatory disturbances of the retina. Acta Ophthalmol. 1955;33:493–516.
13 Sabates R, Hirose T, McMeel JW. Electroretinography in the prognosis and classification of central retinal vein occlusion. Arch Ophthalmol. 1983;101:232–235.
14 Hiraiwa T, Horio N, Terasaki H, et al. Preoperative electroretinogram and postoperative visual outcome in patients with diabetic vitreous hemorrhage. Jpn J Ophthalmol. 2003;47:307–311.
15 Horio N, Terasaki H, Yamamoto E, et al. Electroretinogram in the diagnosis of endophthalmitis after intraocular lens implantation. Am J Ophthalmol. 2001;132:258–259.
16 Miyake Y, Yagasaki K, Horiguchi M, et al. Congenital stationary night blindness with negative electroretinogram: a new classification. Arch Ophthalmol. 1986;104:1013–1020.
17 Horiguchi M, Miyake Y. Batten disease: deteriorating course of ocular findings. Jpn J Ophthalmol. 1992;36:91–96.
18 Berson EL, Lessell S. Paraneoplastic night blindness with malignant melanoma. Am J Ophthalmol. 1988;106:307–311.
19 Heckenlively JR, Aptsiauri N, Holder GE. Autoimmune retinopathy, CAR and MAR syndromes. In: Heckenlively JR, Arden GB. Principles and practice of clinical electrophysiology of vision. 2nd edn. Cambridge, MA: MIT Press; 2006:691–698.
20 Hirose T, Katsumi O, Pruett RC, et al. Retinal function in birdshot retinochoroidopathy. Acta Ophthalmol. 1991;69:327–337.
21 Viswanathan S, Frishiman LJ, Robson JG, et al. The photopic negative response of the macaque electroretinogram: reduction by experimental glaucoma. Invest Ophthalmol Vis Sci. 1999;40:1124–1136.
22 Kohl S, Baumann B, Broghammer M, et al. Mutatons in the CNGB3 gene encoding the beta-subunit of the cone photoreceptor cGMP-gated channel are responsible for achromatopsia (ACHM3) linked to chromosome 8q21. Hum Mol Genet. 2000;9:2107–2116.
23 Oguchi C. Über die eigenartige Hemeralopie mit diffuser weissgr ä ulicher Verfärbung des Augenhintergrundes. Graefes. Arch Ophthalmol. 1912;81:109–117.
24 Mizuo A. On a new discovery in the dark adaptation in Oguchi’s disease. Acta Soc Ophthalmol Jpn. 1913;17:1854–1859.
25 Miyake Y, Horiguchi M, Suzuki S, et al. Electrophysiological findings in patients with Oguchi’s disease. Jpn J Ophthalmol. 1996;40:511–519.
26 Fucks S, Nakazawa M, Maw M, et al. A homozygous 1-base pair deletion in the arrestin gene is a frequent cause of Oguchi disease in Japanese. Nat Genet. 1995;10:360–362.
27 Yamamoto S, Sipple KC, Berson EL, et al. Defects in the rhodopsin kinase gene in the Oguchi form of stationary night blindness. Nat Genet. 1997;15:175–178.
28 Carr RE, Gouras P. Oguchi’s disease. Arch Ophthalmol. 1965;73:646–656.
29 Carr RE. Congenital stationary night blindness. Trans Am Ophthalmol Soc. 1974;72:448–487.
30 Carr RE, Ripps H, Siegel IM, et al. Rhodopsin and the electrical activity of the retina in congenital night blindness. Invest Ophthalmol. 1966;5:497–507.
31 Yamamoto H, Simon A, Eriksson U, et al. Mutations in the gene encoding 11-cis retinol dehydrogenase cause delayed dark adaptation and fundus albipunctatus. Nat Genet. 1999;22:188–191.
32 Miyake Y, Watanabe I, Asano T, et al. Further studies on EOG in retinitis punctata albescens: effects of change of dark adaptation time on EOG. Folia Ophthalmol Jpn. 1974;25:518–527.
33 Miyake Y, Shiroyama N, Sugita S, et al. Fundus albipunctatus associated with cone dystrophy. Br J Ophthalmol. 1992;76:375–379.
34 Nakamura M, Hotta Y, Tanikawa A, et al. A high association with cone dystrophy in fundus albipunctatus caused by mutations of the RDH5 gene. Invest Ophthalmol Vis Sci. 2000;41:3925–3932.
35 Sieving PA. Photopic ON- and OFF-pathway abnormalities in retinal dytrophies. Trans Am Ophthalmol Soc. 1993;91:701–773.
36 Miyake Y, Yagasaki K, Horiguchi M, et al. Congenital stationary night blindness with negative electroretinogram. A new classification. Arch Ophthalmol. 1986;104:1013–1020.
37 Miyake Y, Yagasaki K, Horiguchi M, et al. On- and off-responses in photopic electroretinogram in complete and incomplete types of congenital stationary night blindness. Jpn J Ophthalmol. 1987;31:81–87.
38 Bech-Hansen NT, Naylor MJ, Maybaum TA, et al. Mutation in NYX, encoding the leucine-rich proteoglycan nyctalopin, cause X-linked complete congenital stationary night blindness. Nat Genet. 2000;26:319–323.
39 Dryja TP, McGee TL, Berson EL, et al. Night blindness and abnormal cone electroretinogram ON responses in patients with mutations in the GRM6 gene encoding mGluR6. Proc Natl Acad Sci USA. 2005;102:4884–4889.
40 Audo I, Kohl S, Leroy BP, et al. TRPM1 is mutated in patients with autosomal-recessive complete congenital stationary night blindness. Am J Hum Genet. 2009;85:720–729.
41 Strom TM, Nyakatura G, Apfelstedt-Sylla E, et al. An L-type calcium-channel gene mutated in incomplete X-linked congenital stationary night blindness. Nat Genet. 1998;19:260–263.
42 Kato K, Miyake Y, Kachi S, et al. Axial length and refractive error in X-linked retinoschisis. Am J Ophthalmol. 2001;131:812–814.
43 Sauer CG, Gehrig A, Warneke-Wittstock R, et al. Positional cloning of the gene associated with X-linked juvenile retinoschisis. Nat Genet. 1997;17:164–170.
44 Sieving PA. Juvenile X-linked retinoschisis. In: Heckenlively JR, Arden GB. Principles and practice of clinical electrophysiology of vision. 2nd edn. Cambridge, MA: MIT Press; 2006:823–827.
45 Miyake Y, Shiroyama N, Ota I, et al. Oscillatory potentials in electroretinograms of the human macular region. Invest Ophthalmol Vis Sci. 1988;29:1631–1635.
46 Sutter EE, Tan D. The field topography of ERG components in man-I. The photopic luminance response. Vision Res. 1992;32:433–446.
47 Miyake Y, Shiroyama N, Horiguchi M, et al. Asymmetry of focal ERG in human macular region. Invest Ophthalmol Vis Sci. 1989;30:1743–1749.
48 Hood DC, Bach M, Brigell M, et al. For the International Society for Clinical Electrophysiology of Vision. ISCEV guidelines for clinical multifocal electroretinography (2007 edition). Doc Ophthalmol. 2008;116:1–11.
49 Miyake Y, Miyake K, Shiroyama N. Classification of aphakic cystoid macular edema with focal macular electroretinograms. Am J Ophthalmol. 1993;116:576–583.
50 Tanikawa A, Horiguchi M, Kondo M, et al. Abnormal focal macular electroretinograms in eyes with idiopathic epimacular membrane. Am J Ophthalmol. 1999;127:559–564.
51 Miyake Y, Shiroyama N, Ota I, et al. Local macular electroretinographic responses in idiopathic central serous chorioretinopathy. Am J Ophthalmol. 1988;106:546–550.
52 Miyake Y, Ichikawa K, Shiose Y, et al. Hereditary macular dystrophy without visible fundus abnormality. Am J Ophthalmol. 1989:292–299.
53 Miyake Y, Horiguchi M, Tomita N, et al. Occult macular dystrophy. Am J Ophthalmol. 1996;122:644–653.
54 Akahori M, Tsunoda K, Miyake Y, et al. Dominant mutations in RP1L1 are responsible for occult macular dystrophy. Am J Hum Genet. 2010;87:424–429.
55 Gass JD. Acute zonal occult outer retinopathy. J Clin Neurol Ophthalmol. 1993;13:79–97.
56 Holder GE, Brigell MG, Hawlina M, et al. For the International Society for Clinical Electrophysiology of Vision. ISCEV standard for clinical pattern electroretinography. (2007 update). Doc Ophthalmol. 2007;114:111–116.
57 Maffei L, Fiorentini A. Electroretinographic responses to alternating gratings before and after section of the optic nerve. Science. 1981;211:953–955.
58 Holder GE. The pattern electroretinogram. In: Heckenlively JR, Arden GB. Principles and practice of clinical electrophysiology of vision. 2nd edn. Cambridge, MA: MIT Press; 2006:341–351.
59 Ogino K, Tsujikawa A, Nakamura H, et al. Focal macular electroretinogram in macular edema secondary to central retinal vein occlusion. Invest Ophthalmol Vis Sci.. 2011;52:3514–3520.
60 Nakamura H, Miyamoto K, Yokota S, et al. Focal macular photopic negative response in patients with optic neuritis. Eye (Lond). 2011;25:358–364.
61 Machida S, Gotoh Y, Toba Y, et al. Correlation between photopic negative response and retinal nerve fiber layer thickness and optic disc topography in glaucomatous eyes. Invest Ophthalmol Vis Sci. 2008;49:2201–2207.
62 Kooijman AC, Damhof A. ERG lens with built-in ganzfeld light source for stimulation and adaptation. Invest Ophthalmol Vis Sci. 1980;19:315–318.
63 Kondo M, Piao CH, Tanikawa A, et al. A contact lens electrode with built-in high intensity white light-emitting diodes. A contact lens electrode with built-in white LEDs. Doc Ophthalmol. 2001;102:1–9.
64 Miyake Y, Yagasaki K, Horiguchi M, et al. Electroretinographic monitoring of retinal function during eye surgery. Arch Ophthalmol. 1991;109:1123–1126.
65 Miyake Y, Yagasaki K, Ichikawa H. Differential diagnosis of congenital tritanopia and dominantly inherited juvenile optic atrophy. Arch Ophthalmol. 1985;103:1496–1501.
66 Horiguchi M, Miyake Y, Kondo M, et al. Blue light-emitting diode built-in contact lens electrode can record human S-cone electroretinogram. Invest Ophthalmol Vis Sci. 1995;36:1730–1732.
67 Kolb H, Lipets LE. The anatomical basis for color vision in the vertebrate retina. In: Gouras P, ed. The perception of colour. London: Macmillan; 1991:128–145.
68 Du Bois Reymond EH. Chapter 3. Von dem ruhen Nervenstrome. Untersuchungen Über Thierische Electricität. Vol. 2. Berlin: G Reimer; 1849. p. 251–288
69 Marmor MF, Brigell MG, McCulloch DL, et al. For the International Society for Clinical Electrophysiology of Vision. ISCEV standard for clinical electro-oculography (2010 update). Doc Ophthalmol. 2011;122:1–7.
70 Arden GB, Barrada A, Kelsey JH. New clinical test of retinal function based upon the standing potential of the eye. Br J Ophthalmol. 1962;46:449–467.
71 Arden GB. Origin and significance of the electro-oculogram. In: Heckenlively JR, Arden GB. Principles and practice of clinical electrophysiology of vision. 2nd edn. Cambridge, MA: MIT Press; 2006:123–138.
72 Odom JV, Bach M, Brigell M, et al. ISCEV standard for clinical visual evoked potentials (2009 update). Doc Ophthalmol.. 2010;120:111–119.
73 Miyake Y, Hirose T, Hara A. Electrophysiologic testing of visual functions for vitrectomy candidates. I. Results in eyes with known fundus diseases. Retina. 1983;3:86–94.
74 American Clinical Neurophysiology Society. Guideline 5: guidelines for standard electrode position nomenclature. J Clin Neurophysiol. 2006;23:107–110. Available at https://www.acns.org/