Clinical Applications of Diagnostic Indocyanine Green Angiography
Introduction
Even in the era of anti-vascular endothelial growth factor (VEGF) intravitreal injections, a therapy for which accurate localization of the choroidal neovascular membrane is not as critical, ICGA, among other imaging techniques, is still extremely useful in clinical practice.1
History
ICGA was developed by Kodak Research Laboratories,2 on request by cardiologists to be used as an indicator of cardiac output which was not influenced by variations in blood oxygen saturation.3,4 Hepatologists subsequently began to use ICGA to evaluate hepatic blood flow5 and hepatocellular function.6
In 1969, Kogure and Choromokos first used ICGA for studying the cerebral circulation in a dog.7 The following year, Kogure et al. reported on intra-arterial ICG absorption of the choroid in monkeys.8 The first human ICG angiogram was of the carotid artery.9 In 1971, Hochheimer modified the system for ICGA by changing the color film which had previously been used to black-and-white infrared film.10
In 1972, Flower and Hochheimer performed the first intravenous ICGA to image the human choroid.11 In the following years, Flower and coworkers evaluated the potential utility of ICGA in the investigation of the normal and pathologic eye.11,12 The relatively poor fluorescence efficiency of the ICG molecule and its limited ability to produce high-resolution images on infrared film initially restricted its angiographic application. The resolution of ICGA was improved in the mid-1980s by Hayashi and de Laey, who developed improved filter combinations with sufficient sensitivity for near-infrared wavelengths.13 They were also instrumental in the transition from still-frame to dynamic imaging by introducing videoangiography.14,15
Although the sensitivity of the initial video camera system was a vast improvement over previous techniques, its inability to study individual images and the potential light toxicity using a 300-W halogen bulb restricted the duration and quality of the technique. In 1989, Destro and Puliafito16 performed ICGA using a system very similar to that described by Hayashi. In the same year, the use of the SLO for ICG videoangiography was introduced by Scheider and Schroedel.17 In 1992, Guyer et al. introduced the use of a 1024 × 1024-line digital imaging system to produce high-resolution ICGA.18 However, this system lacked flash synchronization with the video camera.
Finally, Yannuzzi and coworkers described a 1024-line resolution system, which was synthesized with the appropriate flash synchronization and image storage capability, permitting high-resolution, long-duration ICGA.19
Chemical and pharmacokinetics
ICG is a tricarbocyanine, anionic dye. Its structural formula is 2,2′-indo-6,7,6′,7′-dibenzocarbocyanine sodium salt20 with a molecular weight of 774.96 Da.2 ICG is soluble in highly distilled water,21 even though in protein-free buffer it is difficult to obtain stable and simple ICG solutions, because of the formation of reversible dimers/polymers.2 Binding to albumin or plasma proteins improves the stability of ICG solutions.2 ICG is supplied with a solvent consisting of sterile water at pH 5.5–6.5. The final product contains 5–9.5% sodium iodine,22 to prevent recrystallization.23
ICG absorbs light in the near-infrared region of the spectrum. The maximum absorption is at 790 nm,23 while the maximum emission occurs at approximately 835 nm.24 These optical properties allow penetration through macular pigment, melanin,25 blood, and pigment.
About 98% of ICG is bound to plasma protein, in particular to globulins, such as A1-lipoproteins.22 In pig plasma, lipoprotein HDL3 is the major binding protein.2 ICG is excreted by the liver,5,26 with negligible extrahepatic removal.5,27 The presumed mechanism is active27 and depends on both liver blood flow and hepatocellular function.28 ICG is excreted into the bile without metabolic process or enters the enteropathic circulation,27 through three steps: (1) uptake over the hepatotocyte sinusoidal (basolateral) membrane (Na+-mediated); (2) passage through the cell, with some role of the microfilaments and vesicular transport; and (3) excretion over the canalicular (apical) membrane.2 Rate of ICG disappearance from vascular compartment is 18–24% per minute, and after 20 minutes no more than 4% remains in the plasma.29 Plasma decay curve is initially exponential, then decelerates.26 No peripheral uptake has been described, in kidney,26 lungs, or placenta.30
ICG’s high molecular weight, in combination with the high percentage of dye bound to plasma proteins, reduces the amount of dye that exits from fenestrations in choroid vessels. This feature and its optical properties make ICG suitable for choroidal vascular network visualization. Although it has been reported that ICG can diffuse through the choroid and can accumulate in RPE cells, no dye should remain in the late phases (30–40 minutes) of the angiogram.29
Toxicity
ICG is considered a safe and well-tolerated dye. Its LD50 is 60 mg/kg in mice.20 Constant infusions over a 3-hour period with dosages as high as 50 mg/kg of body weight were well tolerated.27 Subcutaneous extravasation also does not produce significant local effects.26,31 Overall, the side-effect rate is low: 0.15% with mild events (nausea, vomit, sneezing, pruritus), 0.2% with moderate events (urticarial, syncope, pyrexia, nerve palsy), 0.05% with severe events (bronchospasm, laryngospasm, anaphylaxis).31
The mechanism of these various adverse side-effects is uncertain. For some, a dose-dependent pseudoallergic mechanism has been proposed,32 though there does not appear to be correlation with iodide or shellfish intolerance, suggesting that the sodium iodide component is of little significance.22,33 Nevertheless patients with a history of definite iodine allergy should not be given the dye, because of concerns for possible anaphylaxis.31 Caution should also be observed in patients affected by liver diseases29 and kidney diseases, since a 9.3% incidence of adverse reactions has been reported in dialysis patients.22,34
ICG was extensively used as a chromodiagnostic agent in the evaluation of hemodynamic changes during pregnancy.35 Nevertheless there are concerns among ophthalmologists, since the Food and Drug Administration has classified ICG as a pregnancy category C drug, meaning that adequate studies of safety have not been conducted.30
Instrument comparison
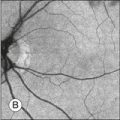
The differences between these instruments are largely related to the acquisition modality (Fig. 2.1). The light source for a digital camera is a white light with an excitation filter (640–780 nm) and a barrier filter (820–900 nm). In an SLO a laser monochromatic light is used to excite (785–790 nm) with a barrier filter at 805 nm. The laser light for an SLO system is moved on the fundus by two rotating mirrors and the image is acquired point by point. For a typical 30° image, this takes approximately 60–200 ms. The presence of a confocal aperture in SLO systems allows selective acquisition of light from a particular tissue layer (from the focal plane), and blocks the light that is coming from the surrounding tissue.36,37 Flash systems, in contrast, do not use a confocal aperture, and thus the fluorescent light returning to the camera will emanate from multiple layers. However, even for clinical confocal SLO ICG systems, the confocal aperture is much larger than one would choose for optimum z-resolution imaging. The reason for this is that fluorescence light from different depth planes (i.e., from the choroid and from the retinal vessel) needs to be imaged simultaneously for many clinical applications.
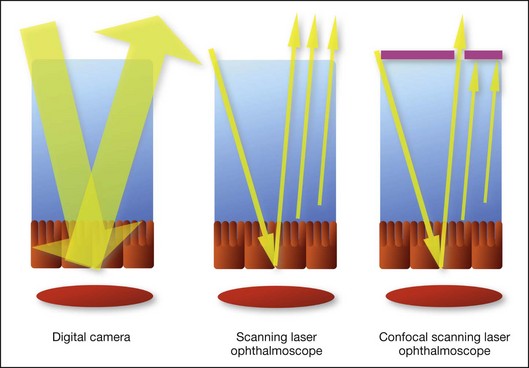
Fig. 2.1 Schematic representation of the differences between digital flash fundus cameras (A), scanning laser ophthalmoscopes (SLO) (B), and confocal SLO instruments (C). In digital flash fundus cameras, white light (with or without excitation/barrier filters) is used. In SLO systems the light source is a monochromatic laser. In SLO confocal systems a pinhole aperture blocks the reflected or fluorescent light from areas outside the focal plane.
These characteristics are important to recognize the different appearance of ICGA images obtained by different instruments (Fig. 2.2). Another difference is the number of images acquired per second. With SLO systems the frame rate may reach 12 images per second, thus permitting dynamic ICGA (Fig. 2.2). With digital fundus cameras the maximum rate is one frame per second.
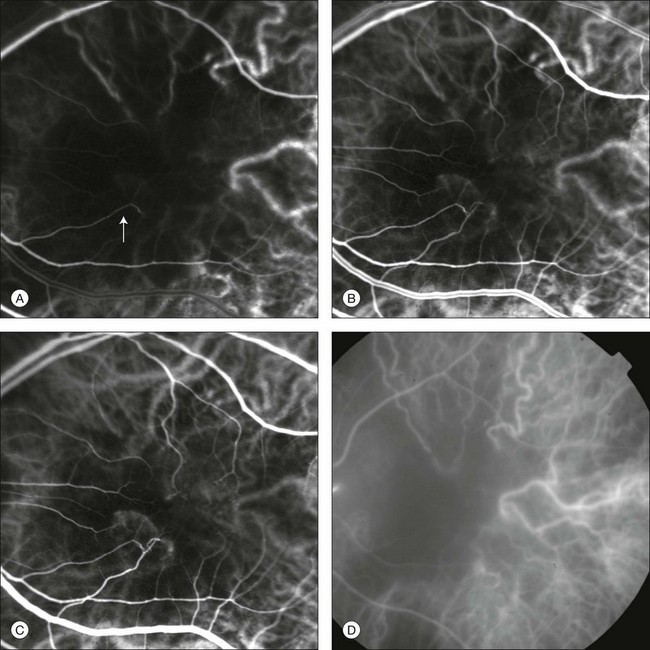
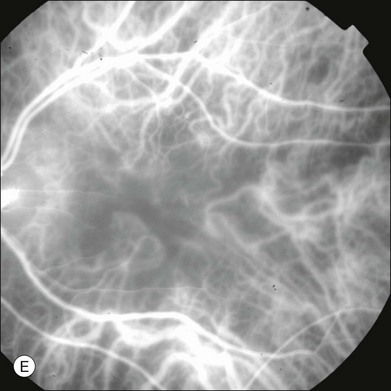
Fig. 2.2 Comparison of dynamic (six frames per second) and conventional indocyanine green angiography of a stage II retinal angiomatous proliferation lesion. A feeding retinal arteriole (A, arrow), filling of the vascular lesion, and a draining retinal vein are all characteristic features visible in the dynamic sequences (A–C). The filling sequence is missed during the first two images captured with a conventional flash fundus camera system (D, E).
Injection technique
The concentration and preparation for intravenous injection of ICG vary with the instrument used. For fundus cameras the standard concentration is 25 mg of ICG dissolved in 5 mL solvent.38 The dosage may be increased to 50 mg in patients with poorly dilated pupils and heavy pigmentation.39 For SLOs the standard dosage is 25 mg of ICG dissolved in 3 mL, and 1 mL of the solution is injected. The solvent may be either saline alone or fluorescein sodium solution at 10–20–25% concentrations, for combined fluorescein and ICGA. Intravenous ICG injection should be rapid and immediately followed by a 5-mL saline flush.
Indocyanine green angiography interpretation
In ICGA, the early filling phase may best be correlated with the filling of different layers of the choroid. The first choroidal vessels to be filled are the ones of the deeper Haller’s layer, followed by the intermediate Sattler’s layer (Fig. 2.3). The choriocapillaris is the last layer to be filled (therefore the sequence progresses from the biggest and outermost to the smallest and innermost vessels). However, the choriocapillaris is typically quite difficult to visualize, since the resolution of the cameras is insufficient to resolve the size of its small lobular morphology. Therefore the choriocapillaris is visualized as a diffuse indistinct haze, more evident in the posterior pole and less evident in the peripheral retina (Fig. 2.3).
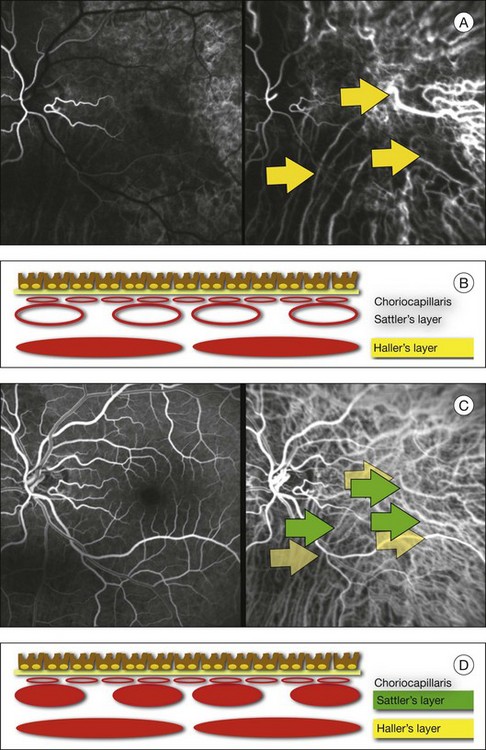
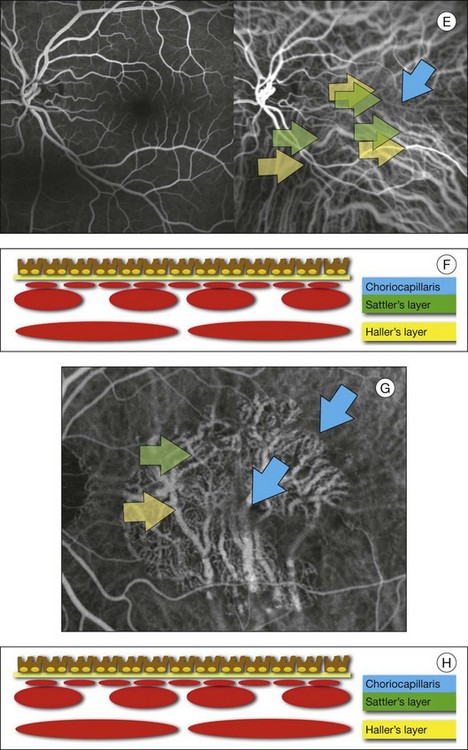
Fig. 2.3 The filling of vessels during an indocyanine green angiogram follows a precise sequence. The first layer to be filled is Haller’s layer (A, B), followed by Sattler’s layer (C, D). After Haller’s layer and Sattler’s layer, the choriocapillaris is filled next (E, F). Simultaneous dynamic fluorescein and indocyanine green angiography (A, C, E) permits the different phases to be resolved. The choriocapillaris may be better appreciated when there are adjacent areas of focal loss, as in the example of geographic atrophy shown in panels (G) and (H).
Choroidal vessels are usually first observed emanating from the posterior ciliary arteries. A well-defined watershed zone is present between the medial and lateral posterior ciliary artery (Fig. 2.4).40 Compared to fluorescein, the watershed zone is more difficult to visualize, since there is less contrast between perfused and nonperfused choroid.
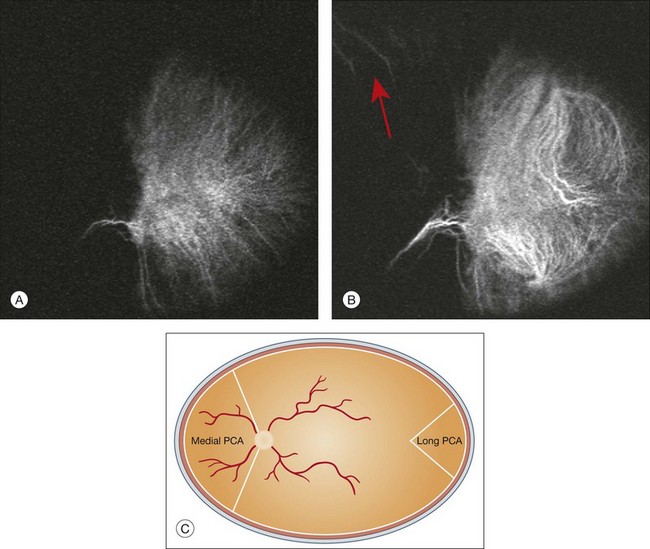
Fig. 2.4 A case of occlusion of the medial long posterior ciliary artery (PCA). (A) Indocyanine green angiography (ICGA) allows one to appreciate the different territories supplied by this artery and the lateral long PCA. (B) Venous phase of ICGA shows the filling of the lateral vortex veins. In the upper left area, the vortex vein is partially filled due to drainage from the iris (B, arrow). (C) Schematic representation of the different vascular territories of the two arteries. (Panel (C) modified with permission from Hayreh SS. Physiological anatomy of the choroidal vascular bed. Int Ophthalmol 1983;6:85–93.)
Choroidal vortex veins are visible in the late phase of ICGA and are usually four in number (Fig. 2.5). They drain the corresponding segment of the iris, ciliary body, and choroid. Sometimes, especially in myopic eyes, a vein may be seen passing from the choroid through the sclera closely adjacent to the optic nerve head and draining into the venous plexus of the pial sheath of the optic nerve (choriovaginal vein) (Fig. 2.5).40
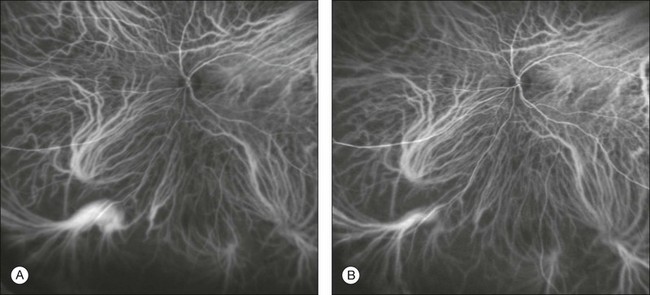
Fig. 2.5 Indocyanine green angiography allows visualization of the four vortex veins (A), and the choriovaginal vessels (B, arrow).
In case of a thin sclera, such as in the setting of a choroidal staphyloma, extrabulbar vessels may be visualized. These can be distinguished from normal choroidal vessels because they pulsate in accordance with the heartbeat. Moreover, they change shape and position with eye movements.41,42
Exudative age-related macular degeneration
Exudative age-related macular degeneration (AMD) is generally classified based upon the axial location of the choroidal neovascularization (CNV). A type 1 CNV is a neovascular membrane that is located under the RPE, whereas a type 2 CNV has passed through the RPE and lies under the neurosensory retina.43 According to the Macular Photocoagulation Study, type 1 CNV is generally considered to correspond to “occult” CNV on fluorescein angiography (as defined by the Macular Photocoagulation Study), and type 2 CNV generally corresponds to “classic” CNV.44,45 More recently, type 3 CNV has been defined to be CNV with a definite intraretinal component.46
The fact that occult CNV accounts for the vast majority of the exudative complications in AMD47 explains in part why ICGA, with its ability to delineate occult CNV, has become part of standard care in exudative AMD for many clinicians.19,48,49 Nonetheless, in peer-reviewed journals, the number of articles published whose title included the terms “indocyanine green angiography (or videoangiography)” decreased between 1995 and 2010.1 One likely explanation might be the advent of anti-VEGF therapy which inaugurated a new era in the management of exudative AMD: it was the first therapy to improve the mean visual acuity of eyes treated with monthly injections of ranibizumab, regardless of whether the CNV lesion was predominantly classic50 or occult.51 Thus, the management of CNV has changed from the use of therapy for which accurate localization of the membrane was crucial (i.e., laser photocoagulation, photodynamic therapy) to the nonspecific intravitreal delivery of active and highly effective biologic drugs. Nonetheless, we would still argue that the gold-standard diagnostic procedure should be the one which best visualizes the disease (CNV) under investigation.
Type 1 choroidal neovascularization
This type of CNV is by definition under the RPE, and corresponds to the occult neovascular network on fluorescein angiography. The Macular Photocoagulation Study recognized two forms of occult CNV: (1) a fibrovascular pigment epithelial detachment (PED); and (2) a late-phase leakage of an undetermined source (LLUS).44 As for the fibrovascular PED, its prevalence may vary from 22% to 50%47–49,52 of occult CNV lesions; dynamic ICGA may delineate the presence of a neovascular network usually located along the edges of the PED49,53,54 (Fig. 2.6). Moreover, dynamic ICGA may reveal a feeder vessel that can be successfully treated with laser photocoagulation, when it is located outside the foveal region55,56 (Fig. 2.7). In case of LLUS, which may represent 36–78% of occult CNV,47,48,52 dynamic ICGA may differentiate an occult form of CNV from retinal angiomatous proliferation (RAP)52 (Fig. 2.8). Considering that one-fourth of patients with an LLUS do have a RAP,52 and that an early diagnosis of these lesions is crucial for the functional prognosis,57 the importance of an ICGA evaluation for these cases becomes readily apparent.
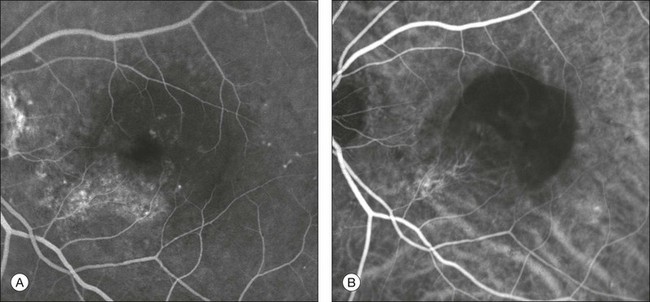
Fig. 2.6 A pigment epithelium detachment (PED) (A, fluorescein angiography) with a well-delineated neovascular network located along the edges of the PED (B, indocyanine green angiography).
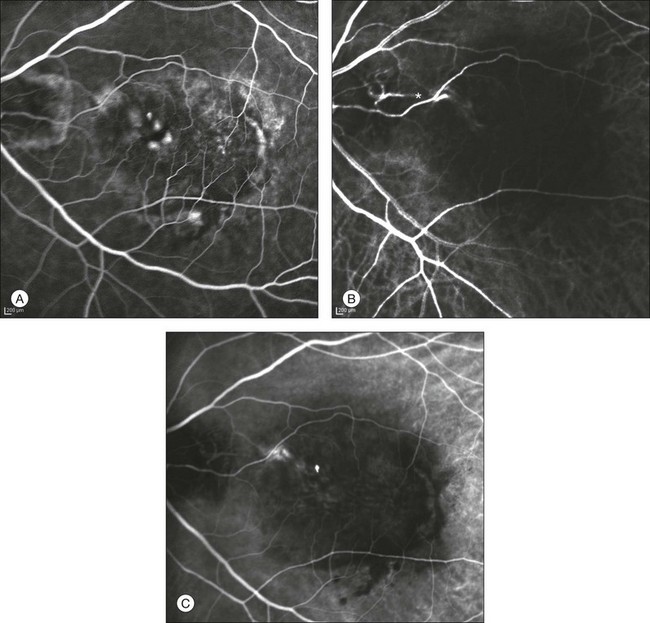
Fig. 2.7 Fibrovascular pigment epithelium detachment (PED). Fluorescein angiography demonstrates occult choroidal neovascularization with PED (A). In the early phases of indocyanine green angiography (ICGA) a feeder vessel originating in the juxtapapillary area is clearly delineated (B, asterisk). Feeder vessel and draining vein are indistinguishable in the late phases of ICGA (C).
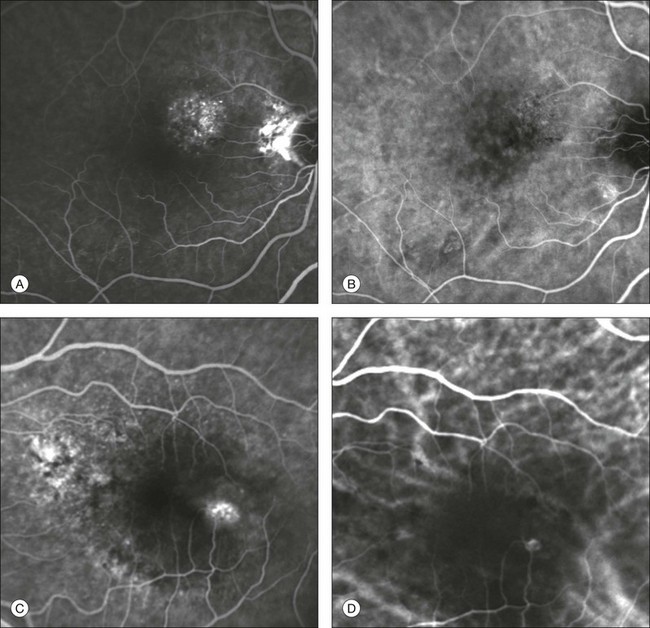
Fig. 2.8 Late leakage of undetermined source (A, C). Indocyanine green angiography may clearly differentiate a subtype of occult choroidal neovascularization (B) from retinal angiomatous proliferation (D).
In conclusion, ICGA faciliates a better and more complete classification of occult CNV subtypes, compared to fluorescein angiography. Of note, Yannuzzi et al.19 found that 39% of lesions classified as poorly demarcated occult lesions by fluorescein angiography were well defined by ICGA.
Type 2 choroidal neovascularization
In classic CNV, ICGA improves visualization of the fine structure of the neovascular network1 (Fig. 2.9), allowing the choroidal and retinal circulation to be distinguished. This high spatial and temporal resolution permits identification of choroidal vessels that feed into the CNV.58 In early phases, ICGA shows a dark rim which corresponds to a whitish ring on infrared imaging,59 and a discrete neovascular network surrounded by a hypocyanescent margin which is more visible after 15 minutes.60 Watzke et al.54 showed that 87% of eyes with classic choroidal neovascular membranes were hypercyanescent with distinct edges.
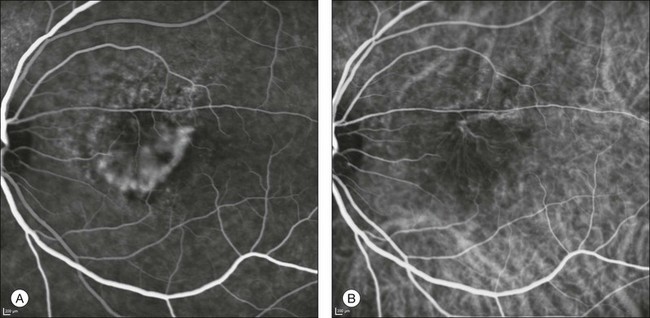
Fig. 2.9 A case of type 2 choroidal neovascularization. In fluorescein angiography image (A), the leakage of the dye from the lesion is evident, and obscures the boundaries of the neovascular network. In indocyanine green angiography (ICGA) (B), the limits of the neovascularization are much more visible. Moreover, ICGA allows the visualization of a central feeder vessel, with a surrounding net of smaller neovessels.
This ability to provide a clear delineation of the neovascular network may confer an important advantage in the era of anti-VEGF therapy. It has been reported that VEGF inhibitors were more effective in controlling immature vessels, whereas a VEGF inhibitor along with a platelet-derived growth factor (PDGF) inhibitor appeared to show a synergistic effect for controlling the growth of mature vessels.61 This is likely because pericyte recruitment is part of the maturation process in blood vessel development. Once the pericyte cell population is well established, the effectiveness of anti-VEGF agents is greatly reduced. PDGF-B is a key requirement for the recruitment of pericytes to the newly formed vessels. Mature, larger choroidal vessels may be readily differentiated from immature choroidal capillaries on ICGA (Fig. 2.10). Thus, in patients with chronic AMD or those who did not benefit from previous treatments with anti-VEGF, ICGA might better delineate a more mature stage of CNV. This has potential implications for therapeutic decision-making.
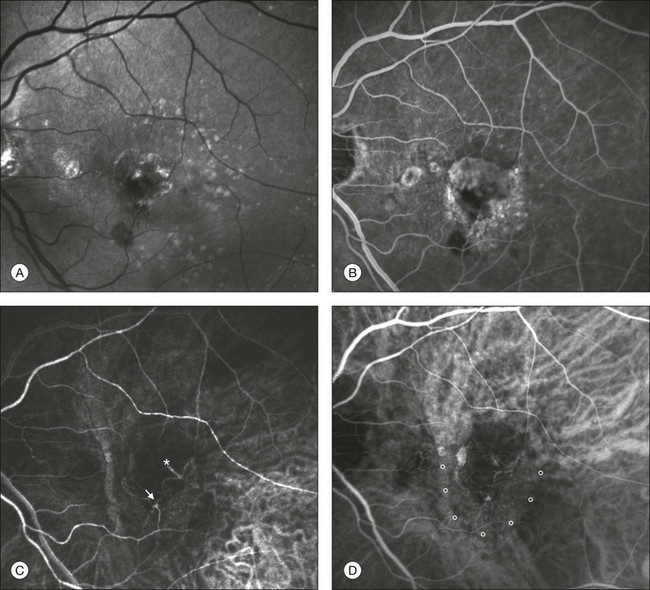
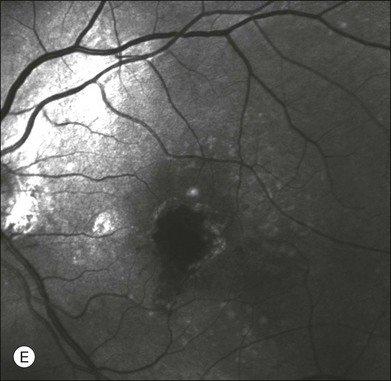
Fig. 2.10 Red-free image showing intraretinal blood within a central atrophic area. A small subretinal hemorrhage is also present inferiorly (A). Corresponding fluorescein angiogram demonstrating late leakage of undetermined source along the inferior edge of the atrophic area (B). Simultaneous early-phase indocyanine green angiography (C) reveals mature, large choroidal vessel (asterisk) feeding the large net of neovascularization along the inferior edge of the central atrophy. A real chorioretinal anastomosis (arrow) is also present. Four minutes after injection (D), the draining choroidal veins are well visualized, as is the neovascular network inferiorly (D, open circles). Red-free image after a 3-month loading phase with monthly ranibizumab (E) shows an increase in size of the central retinal hemorrhage despite anti-vascular endothelial growth factor therapy.
Type 3 choroidal neovascularization
During the past decade, RAP has been labeled with a number of different terms, including “retinal vascular anomalous complex,” “retinal choroidal anastomosis,” “retinal anastomosis to the lesion,” and “chorioretinal anastomosis.” In a comprehensive article on this entity, Yannuzzi et al.62 provided evidence to support the original concept of capillaries arising within the inner half of the retina, or “retinal angiomatous proliferation,” thus suggesting the acronym of RAP as the appropriate descriptor for the disease. Subsequently, Gass et al.63 suggested a possible choroidal origin for these vessels, emanating from occult CNV and developing into an occult chorioretinal anastomosis. The new category, type 3 neovascularization, has been recently proposed46 to harmonize these conflicting theories. Type 3 lesions would encompass the following disease manifestations: (1) focal neovascular proliferation arising from the deep retinal capillary plexus (the original RAP concept); (2) intraretinal neovascular extension from an underlying occult/type I CNV; and (3) de novo breaks in Bruch’s membrane with neovascular infiltration into the retina.
Whatever the origin or initial location might be, our understanding of the importance of RAP as a component of neovascular AMD has been enhanced by ICGA. The fluorescein angiographic study generally shows manifestations of occult CNV, either fibrovascular PED (Fig. 2.11) or LLUS (Fig. 2.12) without a characteristic feature to identify and delineate the angiomatous process in the retina (indistinct zone of staining within and beyond the retina). By contrast, ICGA may clearly delineate the vascular structure of the lesion. When associated with PED, the RAP is usually well within the area of detachment and not at the edges, as is typically the case with CNV which vascularizes a serous PED (so-called notched PED configuration on fluorescein angiography). As previously reported, RAP may be present in up to one-fourth of eyes thought to have occult CNV with LLUS.52 Dynamic ICGA (d-ICGA) has further expanded our capability for an early diagnosis. By definition, a diagnosis of RAP is based upon the temporal evidence of “dye filling of at least one retinal arteriole descending into the deep retinal space to a vascular communication and at least one draining retinal vein.”64 In conventional angiography, images are usually captured at 1 frame per second. This makes it virtually impossible to visualize the progression of the dye through the vascular complex, even though images are taken at very early phases. By contrast, d-ICGA takes up to 12 frames per second and captures the progressive filling of the lesion, allowing detection of very small and recent-onset cases of RAP (Fig. 2.2). The possibility of repeated viewing of the dynamic sequence of progression on ICGA may further increase our chances of an early diagnosis of RAP (Fig. 2.13). In a recent series of RAP diagnosed using d-ICGA,52 the incidence of stage 1 RAP (64.9%) and the mean distance of the lesions from the fovea (682 ± 304 µm) were both consistent with an early-stage disease process, supporting the utility of this imaging procedure.
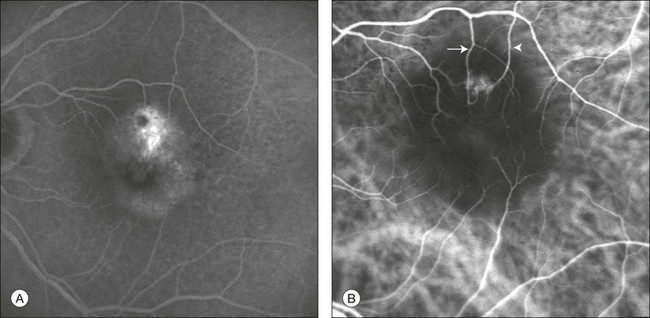
Fig. 2.11 Late-phase fluorescein angiography (A) shows a pigment epithelium detachment (PED) with a “hot spot.” Indocyanine green angiography (B) reveals the presence of retinal angiomatous proliferation overlying the PED. Feeding retinal arteriole (arrow) and draining retinal venule (arrowhead) are clearly visualized.
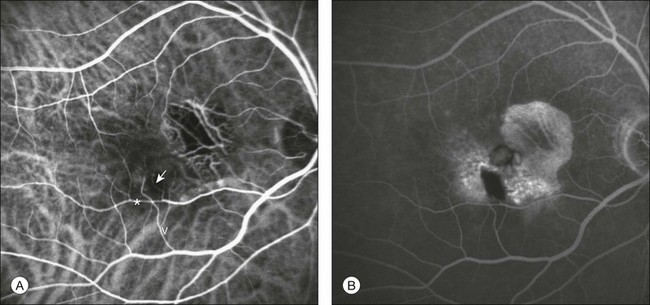
Fig. 2.12 Indocyanine green angiography (A) and fluorescein angiography (B) demonstrating an extrafoveal stage II retinal angiomatous proliferation (RAP). One feeding first-order macular arteriole (arrow) shunts blood flow from the vascular arcade (*) to the RAP and to one draining retinal vein (V). Cystoid macular edema is evident in late fluorescein phases.
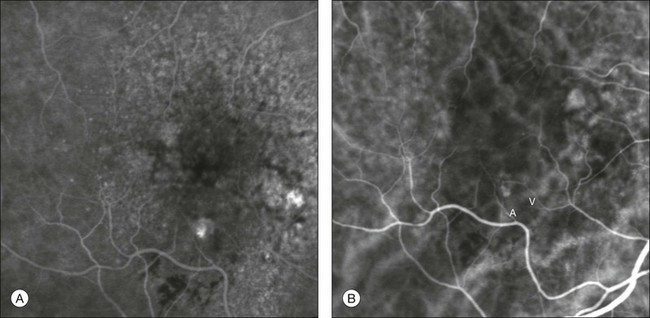
Fig. 2.13 Midphase fluorescein angiography (A) showing a small area of progressive extrafoveal staining at 6 o’clock. Dynamic indocyanine green angiography (B) reveals a well-delineated stage I retinal angiomatous proliferation with a feeding retinal arteriole (A) and a draining retinal vein (V).
Early and accurate diagnosis of RAP is important for at least two reasons. First, RAP lesions are thought to be more aggressive,65 with a treatment response that is likely to diminish with more advanced disease stages.57 Second, recent data from the literature suggest that successful anatomic and functional results with RAP may be achieved more consistently with combined treatments (i.e., intravitreal injection of steroid or anti-VEGF + photodynamic therapy) rather than with intravitreal injection of anti-VEGF therapy alone.66,67 Dynamic ICGA is also extremely useful for monitoring the therapeutic effect: a complete remodeling of the vascular structure may be achieved after successful closure and it is clearly highlighted in d-ICGA (Fig. 2.14).68
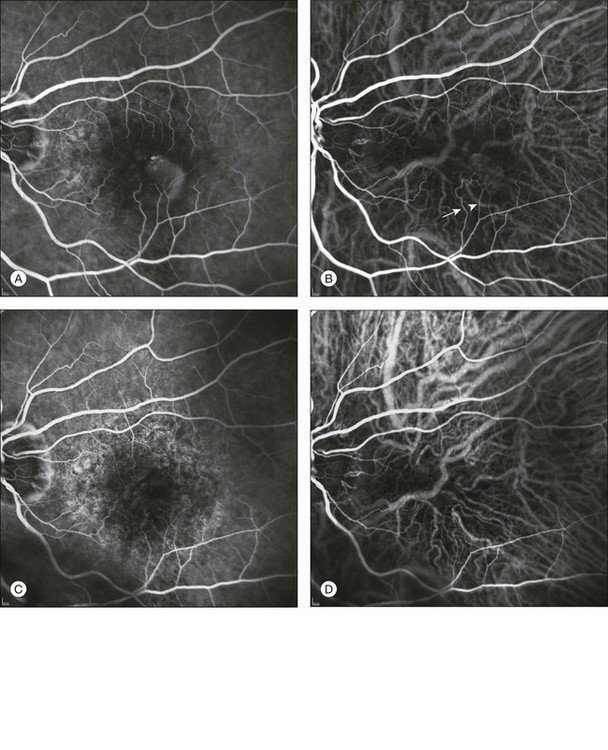
Fig. 2.14 Baseline fluorescein angiography (A) and dynamic indocyanine green angiography (ICGA) (B) shows a stage II extrafoveal retinal angiomatous proliferation (RAP) located inferotemporal to the fovea. One feeding first-order macular arteriole (arrowhead) shunts blood flow from the vascular arcade to the RAP and to the draining retinal vein (arrow). Two months after one combined treatment (intravitreal triamcinolone acetonide + photodynamic therapy), the RAP is no longer detectable by either fluorescein angiography (C) or ICGA (D). There is an evident reduction in the size of both the first-order macular arteriole and the draining retinal vein (barely visible) (C, D).
Polypoidal choroidal vasculopathy
Polypoidal choroidal vasculopathy (PCV) is a primary abnormality of the choroidal circulation characterized by an inner choroidal vascular network of vessels ending in an aneurysmal bulge or outward projection, visible clinically as a reddish-orange, spheroid, polyp-like structure.69 It was first described in the peripapillary area69,70 (Fig. 2.15) but it may affect the macula71 (Fig. 2.16), and also extramacular areas (Fig. 2.17).
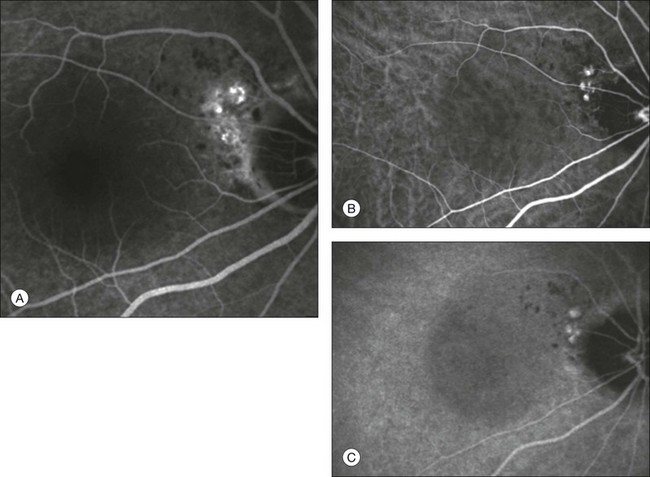
Fig. 2.15 Late-phase fluorescein angiography (A) shows a neurosensory retinal detachment with multiple juxtapapillary “hot spots.” Early (B) and late (C) indocyanine green angiography reveals the presence of juxtapapillary polypoidal choroidal vasculopathy.
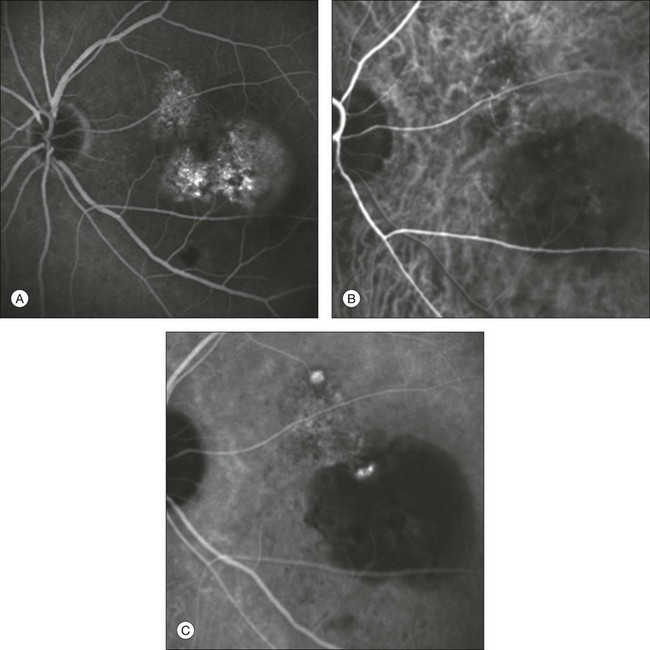
Fig. 2.16 Late-phase fluorescein angiographic image revealing type 1 occult choroidal neovascularization with a subfoveal pigment epithelium detachment (PED) (A). Early (B) and late (C) indocyanine green angiographic frames demonstrate a distinct network of vessels within the macular choroid ending with two hyperfluorescent “polyps.” One of the two is located within the PED.
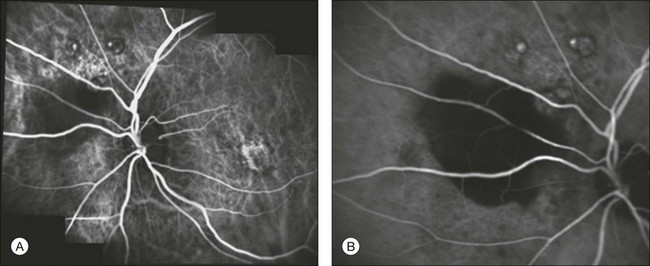
Fig. 2.17 Early (A) and late (B) indocyanine green angiography showing extramacular polypoidal choroidal vasculopathy with a pigment epithelium detachment.
The disorder is associated with multiple, recurrent, serosanguineous detachments of the RPE and neurosensory retina secondary to leakage and bleeding from the peculiar choroidal vascular abnormality. It has been reported that 85% of patients with serosanguineous detachments of the RPE have evidence of PCV.72 ICGA has been used to detect and characterize the PCV abnormality with enhanced sensitivity and specificity.1,71 The early phase of the ICG angiogram shows a distinct network of vessels within the choroid (Fig. 2.16B). In patients with juxtapapillary lesions, the vascular channels may follow a radial, arching pattern. In PCV limited to the macula, a vascular network often arises in the macula and follows an oval distribution pattern.73 Larger choroidal vessels of the PCV network begin to fill before retinal vessels, and PCV network fills also at a slower rate than retinal vessels. Shortly after the network can be identified by the ICG angiogram, small hyperfluorescent “polyps” become visible (Fig. 2.16C). These polypoidal structures correspond to the reddish–orange choroidal excrescence seen clinically. They appear to leak slowly as the surrounding hypofluorescent area becomes increasingly hyperfluorescent. In the later phase of the angiogram there is uniform disappearance of dye (“washout”) from the bulging polypoidal lesions.
PCV is often misdiagnosed or confused with chronic central serous chorioretinopathy (CSC)74,75 and with exudative age-related maculopathy71,76 and may represent a transitional condition between the two pathologies.1 Moreover, the treatment strategies for PCV differ from exudative AMD. The use of anti-VEGF agents is controversial in PCV,1 while verteporfin photodynamic therapy, alone or in combination with bevacizumab,77 as well as selective laser photocoagulation have been shown to be effective treatments.78
Central serous chorioretinopathy
CSC is characterized by multifocal areas of choroidal hyperpermeability on ICGA,79–81 visible in the mid and late phases of the angiogram82 (Fig. 2.18). These areas surround the active RPE leaks but can also be found in areas apparently unaffected by leakage or abnormal fluorescence on fluorescence angiography, even in the fellow eyes.79 Zones of choroidal hyperpermeability tend to persist in cases of severe and chronic CSC83 (Fig. 2.19), and are of value for distinguishing CSC from AMD in older patients with suspected occult neovascularization.80,84
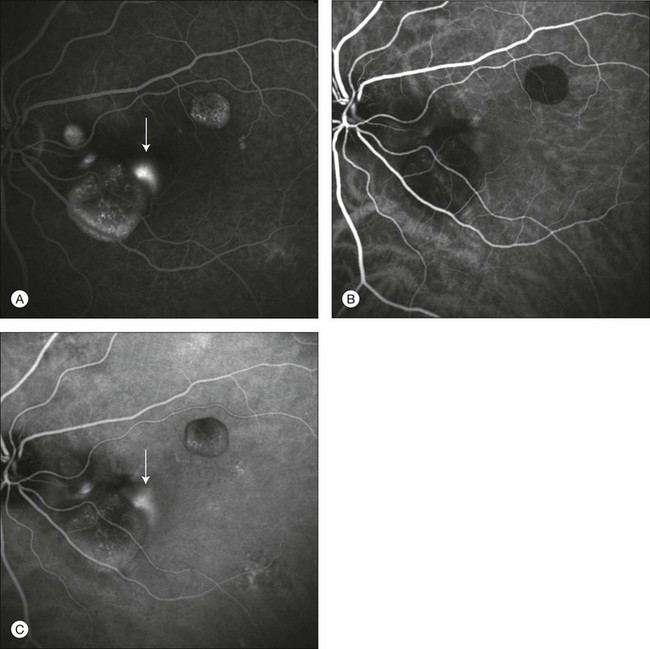
Fig. 2.18 A case of central serous chorioretinopathy. In the fluorescein angiographic image (A) it is possible to visualize three distinct serous detachments of the pigment epithelium, and one point of leakage. Another hyperfluorescent area is visible (arrow), but it is not clear if it corresponds to another point of leakage or represents an additional detachment. Indocyanine green angiographic images (B, C) allow one to distinguish clearly points of leakage as hyperfluorescent areas, with marked leakage in the late phases (C, arrow). The uncertain area noted on fluorescein angiography is another leaky point.
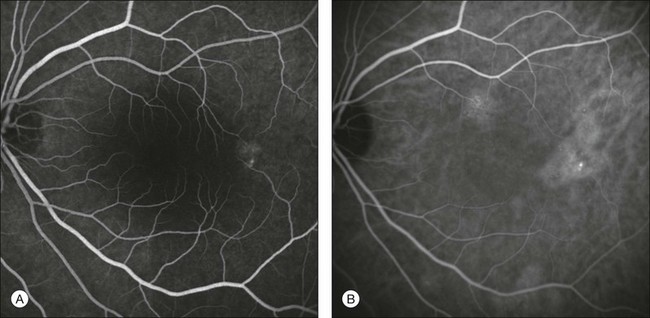
Fig. 2.19 A case of central serous chorioretinopathy. Fluorescein angiographic image (A) shows only an area of pigment epithelium disturbance. Indocyanine green angiography (B) reveals a more extensive alteration of the choriocapillaris, with multiple areas of hyperfluorescence.
Moreover, ICG assessment of the location of these areas of hyperpermeability may be useful when considering treatment with verteporfin photodynamic therapy, using normal80 or half-fluence laser energy.85 The treatment focused on these areas showed rapid reduction of fluid and improvement in visual acuity,80 possibly by leading to hypoperfusion of choriocapillaris and vascular remodeling.86 In these studies, verteporfin photodynamic therapy success rate seemed to be dependent on the degree of hyperpermeability, as the treatment was less effective or had more frequent recurrence of CSC in eyes without intense hyperfluorescence.87
Other findings in CSC using ICGA include multiple “occult” serous PED,79 punctate hyperfluorescent spots,88 delays in arterial filling of the choroidal arteries and choriocapillaris,89,90 and venous congestion.90 ICGA is also useful in differentiating CSC from PCV.75
Choroidal tumors
Circumscribed choroidal hemangiomas are benign hamartomas that typically present from the second to fourth decade of life.91 They usually occur sporadically in the absence of systemic disease. Histopathology reveals that the tumor is composed by vascular channels lined with endothelium. It involves the full thickness of the choroid with secondary changes of the overlying RPE and the retina.92 Although commonly asymptomatic, choroidal hemangiomas can be associated with exudative retinal detachment resulting in reduced visual function, metamorphopsia, and photopsia.
On ophthalmoscopic examination, a circumscribed choroidal hemangioma appears as an orange choroidal mass with indistinct margins that blend with the surrounding choroid. They are frequently located in the macular region of the posterior pole, and are not usually thicker than 6 mm.93 Surrounding subretinal fluid leading to exudative retinal detachment with macular involvement is common in symptomatic cases. Retinal hard exudates are minimal or absent.
Angiographic studies such as fluorescein and ICG can be helpful in establishing the diagnosis and differentiating these benign lesions from other tumors, namely amelanotic malignant melanoma and choroidal metastases. Fluorescein angiography demonstrates a hyperfluorescent mass with a fine lacy vascular network of intrinsic vessels in the early choroidal filling phase. The hyperfluorescence increases throughout the angiogram, and there is variable leakage in late views94 (Fig. 2.20A, B). ICGA is the most useful study for demonstrating the intrinsic vascular pattern of circumscribed choroidal hemangioma.95 The advantage of ICG dye over sodium fluorescein dye is that it diffuses much more slowly out of fenestrated small choroidal vessels than does sodium fluorescein. Within 30 seconds of injection of the ICG dye, the tumor’s intrinsic vascular pattern becomes apparent. By 1 minute, choroidal hemangiomas completely fill with the dye, showing brilliant hyperfluorescence. This 1-minute stage of intense hyperfluorescence seen with choroidal hemangiomas is brighter than any other tumor, and is very suggestive of the diagnosis. In the following phases (6–10 minutes), the hyperfluorescence can persist or begin to wane (Fig. 2.20C-E). In the late phases of the ICG angiogram (30 minutes), a washout effect with reduction of the initial hyperfluorescence is observed secondary to the outflow of dye from the hemangioma (Fig. 2.20F).95 The low-resistance, high-flow properties of the tumor allow rapid flow of the dye into and out of the tumor. The resulting final effect is that the tumor empties sooner than the normal surrounding choroid and thus appears hypofluorescent in comparison. This washout sign is very helpful in differentiating choroidal hemangiomas from amelanotic malignant melanoma and choroidal metastases.
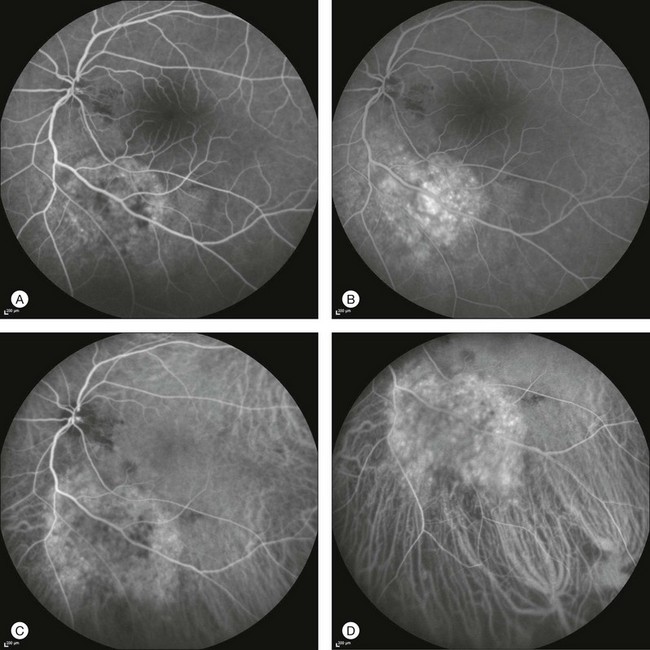
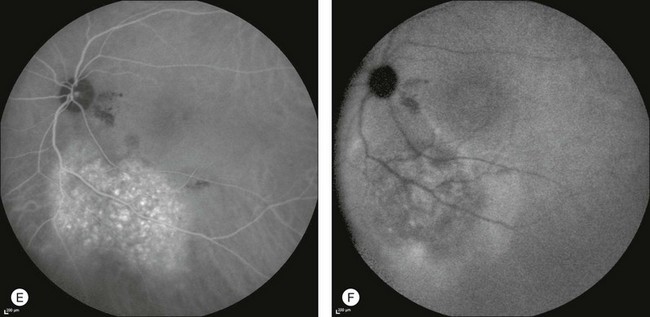
Fig. 2.20 Fluorescein angiography demonstrating a hyperfluorescent mass along the inferior vascular arcade (A). The hyperfluorescence increases progressively throughout the angiogram with variable leakage in late views (B). Early-phase indocyanine green angiography (ICGA) (49 seconds) revealing a fine lacy vascular network of intrinsic vessels (C). Increasing hyperfluorescence is detected after injection: (D) at 2 minutes. Increasing hyperfluorescence after injection: (E) at 5 minutes. Of note, the margins of the tumor appear scalloped. (F) Late-phase ICGA study demonstrating hypofluorescence within the tumor (washout effect). A halo of minimal hyperfluorescence surrounds the tumor. This may result from staining of the retinal pigment epithelium or leakage of indocyanine green into the subneurosensory retinal space.
Choroidal melanoma
ICGA findings in uveal melanoma are variable.96 No study revealed any pathognomonic sign with ICGA to identify choroidal melanoma.23,97
Nevertheless ICGA was found to be capable of identifying tumor vessels (Fig. 2.21)98,99 which are usually irregularly tortuous, with anarchic branching,97 dilated with a parallel course,98 and characterized by vasculogenic mimicry patterns.100 ICGA was demonstrated to be superior to fluorescein angiography in detecting both tumor borders and vasculature.97,101
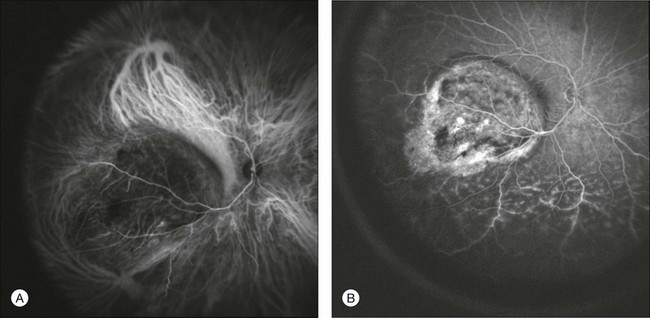
Fig. 2.21 A case of choroidal melanoma. Indocyanine green angiography (A) allows visualization of the tumor’s intrinsic vasculature with irregular tortuosity and anarchic branching. Note the strong fluorescence within the large choroidal vessels around the lesion, a possible sign of increased flow due to the presence of the tumor. Melanoma-intrinsic vessels are leaky by fluorescein angiography (B), and therefore they cannot be identified with this diagnostic tool. In fluorescein angiographic images (B), in the inferior quadrant it is possible to visualize damage to retinal vessels with associated exudative detachment.
Mueller et al. found that different patterns of the microcirculation within the tumor may be useful in the prognosis of the disease.101 The evidence of microcirculation patterns characterized by networks and a parallel course with cross-linking may be associated with a higher risk of metastatic disease.101 Other studies reported the possible role of ICGA in evaluating the outcome of brachytherapy,102 proton beam irradiation,103 and transpupillary thermotherapy.104
Peripheral exudative hemorrhagic chorioretinopathy
Peripheral exudative hemorrhagic chorioretinopathy (PEHCR) is a bilateral peripheral exudative hemorrhagic retinal degenerative process of the eye.105,106 The condition is characterized by blood in the subretinal or subretinal pigment epithelial space. PEHCR is most often found in older Caucasian patients and may simulate a vitreous hemorrhage with suspicion of underlying retinal detachment or break, intraocular inflammatory process, retinal artery macroaneurysm, or choroidal melanoma.105 In fact, PEHCR often appears as a visible intraocular elevated mass with a mean basal dimension of 10 mm and a mean thickness of 3 mm, consistent with the size of a small to medium-sized melanoma.106 The lesion is most often located temporally (77%) between the equator and the ora serrata (89%) and involves one (46%) or two (46%) quadrants.106 In comparison, eyes with uveal melanoma show tumor location in the macula (5%), between the macula and the equator (78%), and between the equator and the ora serrata (17%).106
Many eyes with PEHCR have features of macular or extramacular (peripheral) degeneration such as drusen, RPE alterations, or CNV.106 The majority of PEHCR lesions spontaneously resolve, leaving RPE atrophy, hyperplasia, and fibrosis. These features imply a bilateral generalized aging process within the eye and are consistent with the degenerative nature of the disease. Although almost half of patients may be asymptomatic, a decrease in visual acuity related to PEHCR may occur in up to 20% of cases.106 Both for this reason and for the fact that the acute hemorrhagic form is typically mistaken for melanoma, PEHCR deserves an early and proper clinical diagnosis. Fluorescein angiography is of little help because choroidal neovascular lesions are visible in only 3% of cases.106 This is due to the blockage of choroidal fluorescence related to subretinal hemorrhage, sub-RPE hemorrhage, or RPE hyperplasia. Diffuse peripheral changes consistent with variable degrees of RPE hyperplasia or atrophy are also common fluorescein angiographic features.
By contrast, ICGA may clearly delineate the choroidal neovascular process, which is often located at the edges of the blood pool, even in the far periphery. Photodynamic therapy or laser photocoagulation applied to the choroidal new vessels may further accelerate the reabsorption of subretinal blood with decreased risk of subsequent visual acuity loss (Figs 2.22 and 2.23).
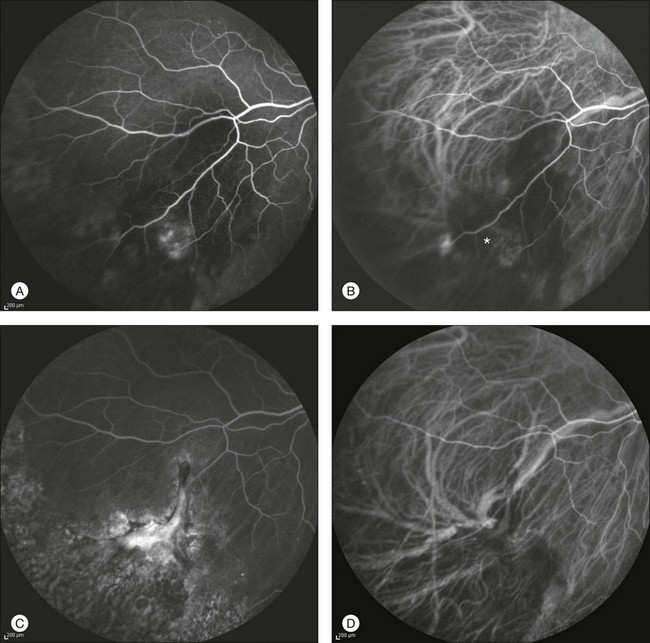
Fig. 2.22 A case of a midperipheral inferotemporal subretinal hemorrhage. Midphase fluorescein angiography showing a hyperfluorescent leaking spot within the hemorrhage (A). Note the diffuse peripheral changes consistent with variable degrees of retinal pigment epithelial hyperplasia or atrophy. Indocyanine green (ICG) angiography 31 seconds after injection (B): the choroidal neovascularization (CNV) is clearly outlined (asterisk). Six months after laser photocoagulation of the CNV: fluorescein (C) and ICG (D) angiographies reveal fibrosis of the CNV with late staining and no leakage.
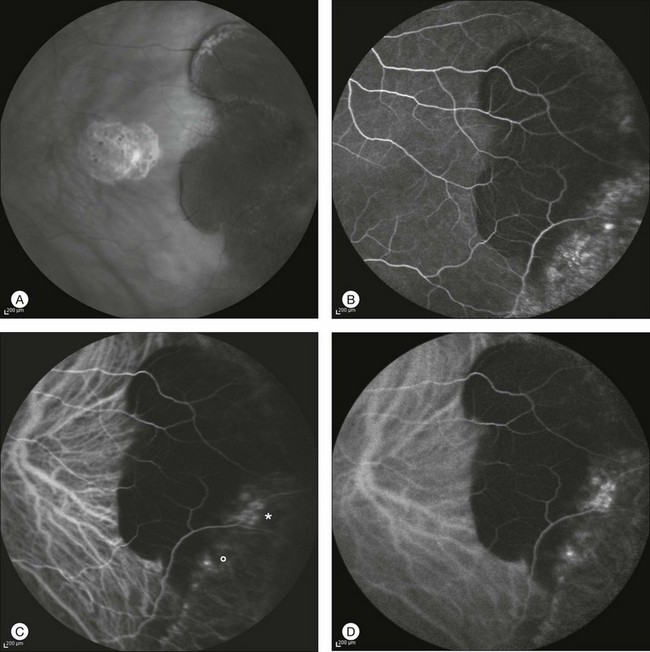
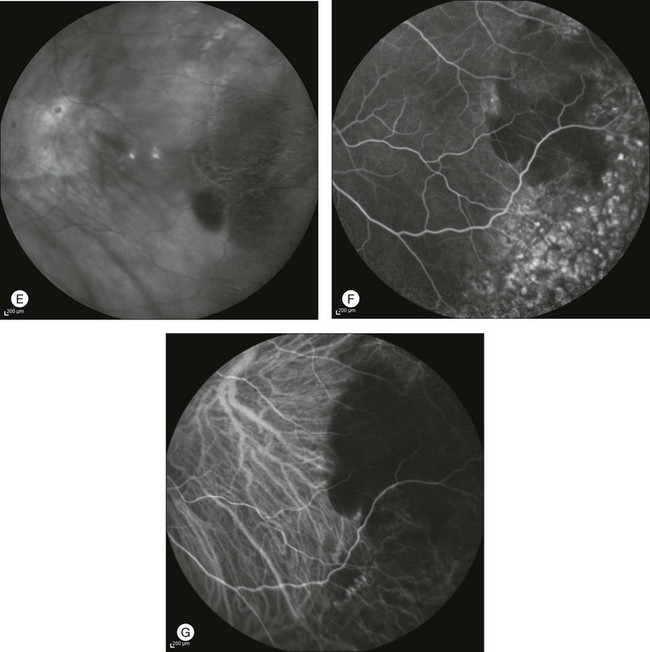
Fig. 2.23 Infrared image of a peripheral temporal subretinal hemorrhage (A). Midphase fluorescein angiography showing diffuse peripheral changes consistent with variable degrees of retinal pigment epithelium hyperplasia or atrophy. Typical features of choroidal neovascularization (CNV) are absent (B). Corresponding indocyanine green (ICG) angiography 2 minutes after injection (C): CNV is clearly visible (asterisk) while a second choroidal new vessel is suspected (circle). Six minutes after injection, ICG angiography shows progressive leakage from both areas (D). Infrared image 3 months after photodynamic therapy applied to the two leaking spots: the reabsorption of the subretinal hemorrhage is almost complete (E). Corresponding fluorescein (F) and ICG (G) angiograms reveal persistent obliteration of CNV with no late leakage.
Varix of the vortex vein ampulla
Varix of the vortex vein ampulla is a rare, benign, asymptomatic condition, which may be confused with a choroidal nevus or melanoma.107 The choroidal veins drain into an average of four vortex veins, which exit the globe through scleral canals.108 About half of the vortex veins show dilatations of varying sizes and shapes, and are referred to as vortex vein ampullae. The varix of the vortex vein ampulla is an unusually large dilatation of the vortex vein. The cause remains unclear. The gaze-dependent dynamic nature of the lesion suggested gaze-evoked kinking of the extrascleral vortex vein or narrowing of the scleral canal to be considered as the possible cause.109 The varix may also be enlarged by factors that increase ocular venous pressure, like Valsalva maneuver, head-down positioning, and jugular vein compression.109 Biomicroscopically, the lesion appears as a smooth red–brown elevation in the equatorial region, usually in the nasal quadrants.107 It is usually a single lesion but may be bilateral.109 A proper diagnosis may be achieved by pressure on the globe that readily collapses the varix (Fig. 2.24).109 ICGA96,107,110 is particularly useful because it demonstrates the relationship of the varix to the choroidal vasculature and also allows visualization of the pressure and gaze-dependent changes. Relatively early maximum fluorescence and a homogeneous filling pattern may further help differentiate the varix from other choroidal masses.107
Choroidal inflammation and white-dot syndrome
Multiple evanescent white-dot syndrome
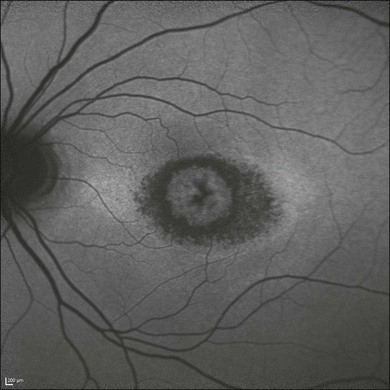
Multiple evanescent white-dot syndrome is a unilateral acute disease that affects young women, presenting with a transient, self-limiting visual loss. The disease involves the choroid and the outer retina.111,112 ICGA shows a pattern of multiple hypofluorescent areas at the posterior pole and peripheral retina. These spots become visible in the mid to late phases, range in size between 50 and 1000 µm,112 and are more apparent in ICGA images than by fundus examination and fluorescein angiography1,112 (Fig. 2.25). In addition, ICGA may show hypofluorescence surrounding the disc area.111 The hypofluorescent spots disappear at the recovery stage of the disease, and sometimes are more persistent with ICGA.113
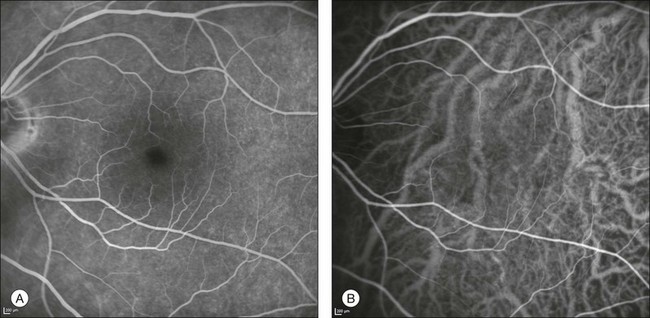
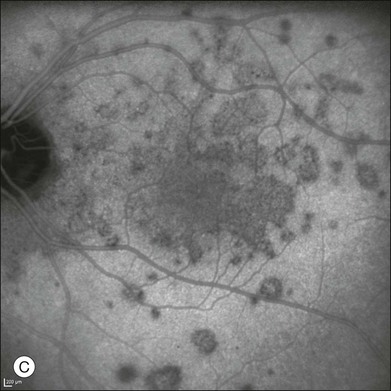
Fig. 2.25 A case of multiple evanescent white-dot syndrome. Late phases of the fluorescein angiogram reveal only mild alterations at the level of the outer retina and retinal pigment epithelium (A). Early phases of the indocyanine green angiogram (B) begin to reveal areas of hypofluorescence. Areas of hypofluorescence become much more evident in the mid to late phases of the angiogram (C).
Multifocal choroiditis
In multifocal choroiditis the white lesions are visualized as hypofluorescent spots in ICGA images. These lesions may be followed up with ICGA both in the natural course of the pathology and in the response to treatment with oral prednisone.114 A reduction in size and number of hypofluorescent spots is observed after successful treatment. Other findings visible on ICGA are hyperfluorescent spots, which usually do not correspond with the hyperfluorescent foci seen on fluorescein angiography, and a large hypofluorescent area surrounding the optic nerve.
Birdshot chorioretinopathy
This disease is characterized by deep cream-colored dots scattered diffusely throughout both fundi. The lesions appear as round-oval, hypofluorescent, symmetric dots on ICGA.115 These lesions are typically not seen on fluorescein angiography, and therefore ICGA may detect birdshot lesions more rapidly.116 Other findings on ICGA include diffuse ICG hyperfluorescence predominantly found in the posterior pole in the late phase of angiography, and an alteration of the vascular pattern of the choroid with choroidal vessels appearing fuzzy and indistinct in the intermediate phase of angiography.115 In the chronic phase of the disease the hypofluorescent dots persist in the late phases of the angiogram and correspond to RPE atrophy or choroidal granulomas.1,117
Acute multifocal placoid pigment epitheliopathy
ICG of acute posterior multifocal placoid pigment epitheliopathy (AMPPE) shows areas of hypofluorescence in both early and late phases that correlate with the placoid lesions. These lesions may be caused by choroidal hypoperfusion, secondary to occlusive vasculitis,118 and ICGA often shows partial or complete resolution throughout the timecourse of the disease.119 New, active and healed, inactive lesions in AMPPE can both be imaged and differentiated using ICGA.120
Serpiginous choroidopathy
ICG allows better staging and identification of active lesions in serpiginous chorioretinopathy.121 The active phase of the pathology is characterized by hypofluorescent areas with poorly defined margins (Fig. 2.26). These findings can predict the active lesions observed by fluorescein angiography. The presence of late hyperfluorescence in ICG images represents a sign of choroidal hyperpermeability and may be associated with a more aggressive evolution of the disease. The healed lesions appear hypofluorescent with well-defined margins. The atrophy of the RPE and choriocapillaris allows better identification of large and medium-sized choroidal vessels.
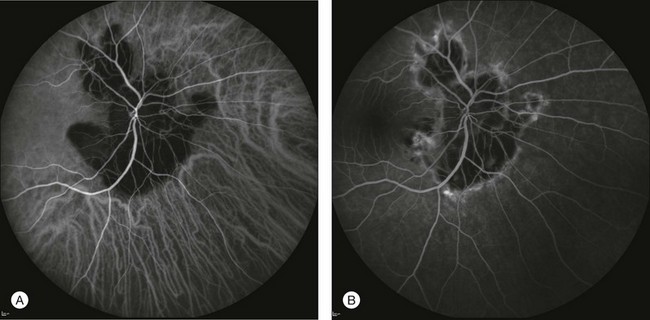
Fig. 2.26 A case of serpiginous chorioretinopathy. The lesion observed by indocyanine green angiography (A) occupies a greater extent than is evident on fluorescein angiography (B). This may indicate a progression of the pathology that can be anticipated or predicted using indocyanine green angiography.
Punctate inner chorioretinopathy
The subretinal lesions observed in punctate inner chorioretinopathy are visualized by ICG as hypofluorescent areas throughout all the phases of the angiogram.122 These areas may correspond to localized choroidal hypoperfusion,123 and are greater in number compared to fluorescein angiography.124 Another finding in ICG images is the presence of hyperfluorescent points situated close to the vessel wall, representing a possible sign of vasculitis.123
Acute zonal occult outer retinopathy
In acute zonal occult outer retinopathy, ICGA shows a variety of patterns of presentations. Spaide reported that the peripapillary drusenoid material blocks the choroidal fluorescence in ICG and therefore the involved areas appear hypofluorescent.125 The secondary atrophy of the choriocapillaris produces hypofluorescence as well, which does not affect the fluorescence from the underlying larger choroidal vessels.125 In some cases, though, ICG may show an increase in fluorescence from the affected areas, due to the lack of photoreceptor outer segments and the minor blocking effect from this layer (Fig. 2.27).
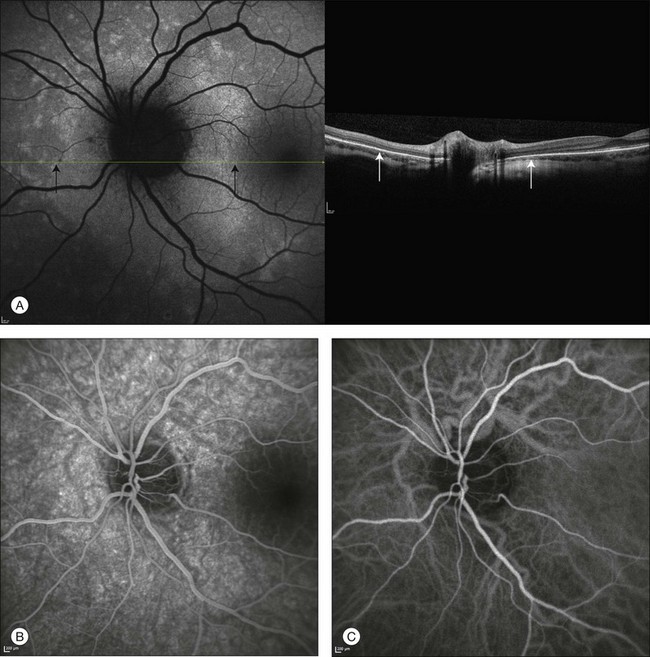
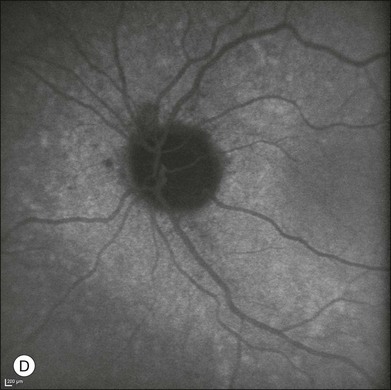
Fig. 2.27 A case of acute zonal occult outer retinopathy. Autofluorescence shows the typical features of this disorder, with hyperautofluorescent areas around the optic disc (A). Simultaneous spectral-domain optical coherence tomography suggests that these areas (black arrows) correspond to zones with loss of the outer segments of the photoreceptors (white arrows), thus resulting in less blockage of the autofluorescence originating from the retinal pigment epithelium. Fluorescein angiography shows increased fluorescence corresponding to these areas (B). Early phase of indocyanine green angiography (C) does not reveal alterations. The late phase of the angiogram (D) allows the affected areas to be distinguished by increased fluorescence.
References
1. Cohen, SY, Dubois, L, Quentel, G, et al. Is indocyanine green angiography still relevant? Retina. 2011;31:209–221.
2. Ott, P. Hepatic elimination of indocyanine green with special reference to distribution kinetics and the influence of plasma protein binding. Pharmacol Toxicol. 1998;83(Suppl 2):1–48.
3. Fox, IJ, Brooker, LG, Heseltine, DW, et al. A tricarbocyanine dye for continuous recording of dilution curves in whole blood independent of variations in blood oxygen saturation. Proc. Staff Meet Mayo Clin. 1957;32:478–484.
4. Fox, IJ, Wood, EH. Applications of dilution curves recorded from the right side of the heart or venous circulation with the aid of a new indicator dye. Proc. Staff Meet Mayo Clin. 1957;32:541–550.
5. Caesar, J, Shaldon, S, Chiandussi, L, et al. The use of indocyanine green in the measurement of hepatic blood flow and as a test of hepatic function. Clin Sci. 1961;21:43–57.
6. Hunton, DB, Bollman, JL, Hoffman, HN. Studies of hepatic function with indocyanine green. Gastroenterology. 1960;39:713–724.
7. Kogure, K, Choromokos, E. Infrared absorption angiography. J Appl Physiol. 1969;26:154–157.
8. Kogure, K, David, NJ, Yamanouchi, U, et al. Infrared absorption angiography of the fundus circulation. Arch Ophthalmol. 1970;83:209–214.
9. Choromokos, E, Kogure, K, David, NJ. Infrared absorption angiography. J Biol Photogr Assoc. 1969;37:100–104.
10. Hochheimer, BF. Angiography of the retina with indocyanine green. Arch Ophthalmol. 1971;86:564–565.
11. Flower, RW, Hochheimer, BF. Clinical infrared absorption angiography of the choroid. Am J Ophthalmol. 1972;73:458–459.
12. Hyvarinen, L, Flower, RW. Indocyanine green fluorescence angiography. Acta Ophthalmol (Copenh). 1980;58:528–538.
13. Hayashi, K, de Laey, JJ. Indocyanine green angiography of submacular choroidal vessels in the human eye. Ophthalmologica. 1985;190:20–29.
14. Hayashi, K, Hasegawa, Y, Tokoro, T. Indocyanine green angiography of central serous chorioretinopathy. Int Ophthalmol. 1986;9:37–41.
15. Hasegawa, Y, Hayashi, K, Tokoro, T, et al. [Clinical use of indocyanine green angiography in the diagnosis of choroidal neovascular diseases.]. Fortschr Ophthalmol. 1988;85:410–412.
16. Destro, M, Puliafito, CA. Indocyanine green videoangiography of choroidal neovascularization. Ophthalmology. 1989;96:846–853.
17. Scheider, A, Schroedel, C. High resolution indocyanine green angiography with a scanning laser ophthalmoscope. Am J Ophthalmol. 1989;108:458–459.
18. Guyer, DR, Puliafito, CA, Mones, JM, et al. Digital indocyanine-green angiography in chorioretinal disorders. Ophthalmology. 1992;99:287–291.
19. Yannuzzi, LA, Slakter, JS, Sorenson, JA, et al. Digital indocyanine green videoangiography and choroidal neovascularization. Retina. 1992;12:191–223.
20. Lutty, GA. The acute intravenous toxicity of biological stains, dyes, and other fluorescent substances. Toxicol Appl Pharmacol. 1978;44:225–249.
21. Tripp, MR, Cohen, GM, Gerasch, DA, et al. Effect of protein and electrolyte on the spectral stabilization of concentrated solutions of indocyanine green. Proc Soc Exp Biol Med. 1973;143:879–883.
22. Benya, R, Quintana, J, Brundage, B. Adverse reactions to indocyanine green: a case report and a review of the literature. Cathet Cardiovasc Diagn. 1989;17:231–233.
23. Bischoff, PM, Flower, RW. Ten years experience with choroidal angiography using indocyanine green dye: a new routine examination or an epilogue? Doc Ophthalmol. 1985;60:235–291.
24. Flower, RW, Hochheimer, BF. Indocyanine green dye fluorescence and infrared absorption choroidal angiography performed simultaneously with fluorescein angiography. Johns Hopkins Med J. 1976;138:33–42.
25. Geeraets, WJ, Berry, ER. Ocular spectral characteristics as related to hazards from lasers and other light sources. Am J Ophthalmol. 1968;66:15–20.
26. Cherrick, GR, Stein, SW, Leevy, CM, et al. Indocyanine green: observations on its physical properties, plasma decay, and hepatic extraction. J Clin Invest. 1960;39:592–600.
27. Leevy, CM, Bender, J. Physiology of dye extraction by the liver: comparative studies of sulfobromophtthalein and indocyanine green. Ann N Y Acad Sci. 1963;111:161–176.
28. Stehr, A, Ploner, F, Traeger, K, et al. Plasma disappearance of indocyanine green: a marker for excretory liver function? Intens Care Med. 2005;31:1719–1722.
29. Costa, DL, Huang, SJ, Orlock, DA, et al. Retinal-choroidal indocyanine green dye clearance and liver dysfunction. Retina. 2003;23:557–561.
30. Fineman, MS, Maguire, JI, Fineman, SW, et al. Safety of indocyanine green angiography during pregnancy: a survey of the retina, macula, and vitreous societies. Arch Ophthalmol. 2001;119:353–355.
31. Hope-Ross, M, Yannuzzi, LA, Gragoudas, ES, et al. Adverse reactions due to indocyanine green. Ophthalmology. 1994;101:529–533.
32. Speich, R, Saesseli, B, Hoffmann, U, et al. Anaphylactoid reactions after indocyanine-green administration. Ann Intern Med. 1988;109:345–346.
33. Michie, DD, Wombolt, DG, Carretta, RF, et al. Adverse reactions associated with the administration of a tricarbocyanine dye (Cardio-Green) to uremic patients. J Allergy Clin Immunol. 1971;48:235–239.
34. Iseki, K, Onoyama, K, Fujimi, S, et al. Shock caused by indocyanine green dye in chronic hemodialysis patients. Clin Nephrol. 1980;14:210.
35. Robson, SC, Mutch, E, Boys, RJ, et al. Apparent liver blood flow during pregnancy: a serial study using indocyanine green clearance. Br J Obstet Gynaecol. 1990;97:720–724.
36. Flower, RW, Csaky, KG, Murphy, RP. Disparity between fundus camera and scanning laser ophthalmoscope indocyanine green imaging of retinal pigment epithelium detachments. Retina. 1998;18:260–268.
37. Wolf, S, Wald, KJ, Elsner, AE, et al. Indocyanine green choroidal videoangiography: a comparison of imaging analysis with the scanning laser ophthalmoscope and the fundus camera. Retina. 1993;13:266–269.
38. Stanga, PE, Lim, JI, Hamilton, P. Indocyanine green angiography in chorioretinal diseases: indications and interpretation: an evidence-based update. Ophthalmology. 2003;110:15–21.
39. Yannuzzi, LA, Flower, RW, Slakter, JS. Indocyanine green angiography. St Louis: Mosby Year Book; 1997.
40. Hayreh, SS. Physiological anatomy of the choroidal vascular bed. Int Ophthalmol. 1983;6:85–93.
41. Mutoh, T, Sakurai, M, Tamai, M. Indocyanine green fundus angiography of retrobulbar vasculature. Arch Ophthalmol. 1995;113:631–633.
42. Ohno-Matsui, K, Morishima, N, Ito, M, et al. Indocyanine green angiography of retrobulbar vascular structures in severe myopia. Am J Ophthalmol. 1997;123:494–505.
43. Gass, JD. Biomicroscopic and histopathologic considerations regarding the feasibility of surgical excision of subfoveal neovascular membranes. Am J Ophthalmol. 1994;118:285–298.
44. Macular Photocoagulation Study Group. Subfoveal neovascular lesions in age-related macular degeneration. Guidelines for evaluation and treatment in the macular photocoagulation study. Arch Ophthalmol. 1991;109:1242–1257.
45. Sadda, SR, Liakopoulos, S, Keane, PA, et al. Relationship between angiographic and optical coherence tomographic (OCT) parameters for quantifying choroidal neovascular lesions. Graefes Arch Clin Exp Ophthalmol. 2010;248:175–184.
46. Freund, KB, Ho, IV, Barbazetto, IA, et al. Type 3 neovascularization: the expanded spectrum of retinal angiomatous proliferation. Retina. 2008;28:201–211.
47. Olsen, TW, Feng, X, Kasper, TJ, et al. Fluorescein angiographic lesion type frequency in neovascular age-related macular degeneration. Ophthalmology. 2004;111:250–255.
48. Guyer, DR, Yannuzzi, LA, Slakter, JS, et al. Classification of choroidal neovascularization by digital indocyanine green videoangiography. Ophthalmology. 1996;103:2054–2060.
49. Yannuzzi, LA, Hope-Ross, M, Slakter, JS, et al. Analysis of vascularized pigment epithelial detachments using indocyanine green videoangiography. Retina. 1994;14:99–113.
50. Brown, DM, Kaiser, PK, Michels, M, et al. Ranibizumab versus verteporfin for neovascular age-related macular degeneration. N Engl J Med. 2006;355:1432–1444.
51. Rosenfeld, PJ, Brown, DM, Heier, JS, et al. Ranibizumab for neovascular age-related macular degeneration. N Engl J Med. 2006;355:1419–1431.
52. Massacesi, AL, Sacchi, L, Bergamini, F, et al. The prevalence of retinal angiomatous proliferation in age-related macular degeneration with occult choroidal neovascularization. Graefes Arch Clin Exp Ophthalmol. 2008;246:89–92.
53. Lim, JI, Aaberg, TM, Capone, AJ, et al. Indocyanine green angiography-guided photocoagulation of choroidal neovascularization associated with retinal pigment epithelial detachment. Am J Ophthalmol. 1997;123:524–532.
54. Watzke, RC, Klein, ML, Hiner, CJ, et al. A comparison of stereoscopic fluorescein angiography with indocyanine green videoangiography in age-related macular degeneration. Ophthalmology. 2000;107:1601–1606.
55. Shiraga, F, Ojima, Y, Matsuo, T, et al. Feeder vessel photocoagulation of subfoveal choroidal neovascularization secondary to age-related macular degeneration. Ophthalmology. 1998;105:662–669.
56. Staurenghi, G, Orzalesi, N, La Capria, A, et al. Laser treatment of feeder vessels in subfoveal choroidal neovascular membranes: a revisitation using dynamic indocyanine green angiography. Ophthalmology. 1998;105:2297–2305.
57. Bottoni, F, Massacesi, A, Cigada, M, et al. Treatment of retinal angiomatous proliferation in age-related macular degeneration: a series of 104 cases of retinal angiomatous proliferation. Arch Ophthalmol. 2005;123:1644–1650.
58. Flower, RW. Optimizing treatment of choroidal neovascularization feeder vessels associated with age-related macular degeneration. Am J Ophthalmol. 2002;134:228–239.
59. Semoun, O, Guigui, B, Tick, S, et al. Infrared features of classic choroidal neovascularisation in exudative age-related macular degeneration. Br J Ophthalmol. 2009;93:182–185.
60. Schmidt-Erfurth, U, Kriechbaum, K, Oldag, A. Three-dimensional angiography of classic and occult lesion types in choroidal neovascularization. Invest Ophthalmol Vis Sci. 2007;48:1751–1760.
61. Hlushchuk, R, Baum, O, Gruber, G, et al. The synergistic action of a VEGF-receptor tyrosine-kinase inhibitor and a sensitizing PDGF-receptor blocker depends upon the stage of vascular maturation. Microcirculation. 2007;14:813–825.
62. Yannuzzi, LA, Negrao, S, Iida, T, et al. Retinal angiomatous proliferation in age-related macular degeneration. Retina. 2001;21:416–434.
63. Gass, JD, Agarwal, A, Lavina, AM, et al. Focal inner retinal hemorrhages in patients with drusen: an early sign of occult choroidal neovascularization and chorioretinal anastomosis. Retina. 2003;23:741–751.
64. Hartnett, ME, Weiter, JJ, Staurenghi, G, et al. Deep retinal vascular anomalous complexes in advanced age-related macular degeneration. Ophthalmology. 1996;103:2042–2053.
65. Viola, F, Massacesi, A, Orzalesi, N, et al. Retinal angiomatous proliferation: natural history and progression of visual loss. Retina. 2009;29:732–739.
66. Rouvas, AA, Papakostas, TD, Vavvas, D, et al. Intravitreal ranibizumab, intravitreal ranibizumab with PDT, and intravitreal triamcinolone with PDT for the treatment of retinal angiomatous proliferation: a prospective study. Retina. 2009;29:536–544.
67. Saito, M, Shiragami, C, Shiraga, F, et al. Comparison of intravitreal triamcinolone acetonide with photodynamic therapy and intravitreal bevacizumab with photodynamic therapy for retinal angiomatous proliferation. Am J Ophthalmol. 2010;149:472–481.
68. Bottoni, F, Romano, M, Massacesi, A, et al. Remodeling of the vascular channels in retinal angiomatous proliferations treated with intravitreal triamcinolone acetonide and photodynamic therapy. Graefes Arch Clin Exp Ophthalmol. 2006;244:1528–1533.
69. Yannuzzi, LA, Sorenson, J, Spaide, RF, et al. Idiopathic polypoidal choroidal vasculopathy (IPCV). Retina. 1990;10:1–8.
70. Spaide, RF, Yannuzzi, LA, Slakter, JS, et al. Indocyanine green videoangiography of idiopathic polypoidal choroidal vasculopathy. Retina. 1995;15:100–110.
71. Yannuzzi, LA, Wong, DW, Sforzolini, BS, et al. Polypoidal choroidal vasculopathy and neovascularized age-related macular degeneration. Arch Ophthalmol. 1999;117:1503–1510.
72. Ahuja, RM, Stanga, PE, Vingerling, JR, et al. Polypoidal choroidal vasculopathy in exudative and haemorrhagic pigment epithelial detachments. Br J Ophthalmol. 2000;84:479–484.
73. Ciardella, AP, Donsoff, IM, Huang, SJ, et al. Polypoidal choroidal vasculopathy. Surv Ophthalmol. 2004;49:25–37.
74. Ahuja, RM, Downes, SM, Stanga, PE, et al. Polypoidal choroidal vasculopathy and central serous chorioretinopathy. Ophthalmology. 2001;108:1009–1010.
75. Yannuzzi, LA, Freund, KB, Goldbaum, M, et al. Polypoidal choroidal vasculopathy masquerading as central serous chorioretinopathy. Ophthalmology. 2000;107:767–777.
76. Maruko, I, Iida, T, Saito, M, et al. Combined cases of polypoidal choroidal vasculopathy and typical age-related macular degeneration. Graefes Arch Clin Exp Ophthalmol. 2010;248:361–368.
77. Lai, TY, Chan, WM, Liu, DT, et al. Intravitreal bevacizumab (Avastin) with or without photodynamic therapy for the treatment of polypoidal choroidal vasculopathy. Br J Ophthalmol. 2008;92:661–666.
78. Eandi, CM, Ober, MD, Freund, KB, et al. Selective photodynamic therapy for neovascular age-related macular degeneration with polypoidal choroidal neovascularization. Retina. 2007;27:825–831.
79. Guyer, DR, Yannuzzi, LA, Slakter, JS, et al. Digital indocyanine green videoangiography of central serous chorioretinopathy. Arch Ophthalmol. 1994;112:1057–1062.
80. Yannuzzi, LA, Slakter, JS, Gross, NE, et al. Indocyanine green angiography-guided photodynamic therapy for treatment of chronic central serous chorioretinopathy: a pilot study. Retina. 2003;23:288–298.
81. Piccolino, FC, Borgia, L. Central serous chorioretinopathy and indocyanine green angiography. Retina. 1994;14:231–242.
82. Spaide, RF, Hall, L, Haas, A, et al. Indocyanine green videoangiography of older patients with central serous chorioretinopathy. Retina. 1996;16:203–213.
83. Shiraki, K, Moriwaki, M, Matsumoto, M, et al. Long-term follow-up of severe central serous chorioretinopathy using indocyanine green angiography. Int Ophthalmol. 1997;21:245–253.
84. Lafaut, BA, Salati, C, Priem, H, et al. Indocyanine green angiography is of value for the diagnosis of chronic central serous chorioretinopathy in elderly patients. Graefes Arch Clin Exp Ophthalmol. 1998;236:513–521.
85. Reibaldi, M, Cardascia, N, Longo, A, et al. Standard-fluence versus low-fluence photodynamic therapy in chronic central serous chorioretinopathy: a nonrandomized clinical trial. Am J Ophthalmol. 2010;149:307–315.
86. Chan, WM, Lam, DS, Lai, TY, et al. Choroidal vascular remodelling in central serous chorioretinopathy after indocyanine green guided photodynamic therapy with verteporfin: a novel treatment at the primary disease level. Br J Ophthalmol. 2003;87:1453–1458.
87. Inoue, R, Sawa, M, Tsujikawa, M, et al. Association between the efficacy of photodynamic therapy and indocyanine green angiography findings for central serous chorioretinopathy. Am J Ophthalmol. 2010;149:441–446.
88. Tsujikawa, A, Ojima, Y, Yamashiro, K, et al. Punctate hyperfluorescent spots associated with central serous chorioretinopathy as seen on indocyanine green angiography. Retina. 2010;30:801–809.
89. Kitaya, N, Nagaoka, T, Hikichi, T, et al. Features of abnormal choroidal circulation in central serous chorioretinopathy. Br J Ophthalmol. 2003;87:709–712.
90. Prunte, C, Flammer, J. Choroidal capillary and venous congestion in central serous chorioretinopathy. Am J Ophthalmol. 1996;121:26–34.
91. Anand, R, Augsburger, JJ, Shields, JA. Circumscribed choroidal hemangiomas. Arch Ophthalmol. 1989;107:1338–1342.
92. Shields, CL, Honavar, SG, Shields, JA, et al. Circumscribed choroidal hemangioma: clinical manifestations and factors predictive of visual outcome in 200 consecutive cases. Ophthalmology. 2001;108:2237–2248.
93. Witschel, H, Font, RL. Hemangioma of the choroid. A clinicopathologic study of 71 cases and a review of the literature. Surv Ophthalmol. 1976;20:415–431.
94. Singh, AD, Kaiser, PK, Sears, JE. Choroidal hemangioma. Ophthalmol Clin North Am. 2005;18:151–161.
95. Arevalo, JF, Shields, CL, Shields, JA, et al. Circumscribed choroidal hemangioma: characteristic features with indocyanine green videoangiography. Ophthalmology. 2000;107:344–350.
96. Shields, CL, Shields, JA, De Potter, P. Patterns of indocyanine green videoangiography of choroidal tumours. Br J Ophthalmol. 1995;79:237–245.
97. Sallet, G, Amoaku, WM, Lafaut, BA, et al. Indocyanine green angiography of choroidal tumors. Graefes Arch Clin Exp Ophthalmol. 1995;233:677–689.
98. Andersen, MV, Scherfig, E, Prause, JU. Differential diagnosis of choroidal melanomas and nevi using scanning laser ophthalmoscopical indocyanine green angiography. Acta Ophthalmol Scand. 1995;73:453–456.
99. Mueller, AJ, Bartsch, DU, Folberg, R, et al. Imaging the microvasculature of choroidal melanomas with confocal indocyanine green scanning laser ophthalmoscopy. Arch Ophthalmol. 1998;116:31–39.
100. Frenkel, S, Barzel, I, Levy, J, et al. Demonstrating circulation in vasculogenic mimicry patterns of uveal melanoma by confocal indocyanine green angiography. Eye (Lond). 2008;22:948–952.
101. Mueller, AJ, Freeman, WR, Schaller, UC, et al. Complex microcirculation patterns detected by confocal indocyanine green angiography predict time to growth of small choroidal melanocytic tumors: MuSIC Report II. Ophthalmology. 2002;109:2207–2214.
102. Schaller, UC, Mueller, AJ, Bartsch, DU, et al. Choroidal melanoma microcirculation with confocal indocyanine green angiography before and 1 year after radiation brachytherapy. Retina. 2000;20:627–632.
103. Krause, L, Bechrakis, NE, Heinrich, S, et al. Indocyanine green angiography and fluorescein angiography of malignant choroidal melanomas following proton beam irradiation. Graefes Arch Clin Exp Ophthalmol. 2005;243:545–550.
104. Midena, E, Pilotto, E, de Belvis, V, et al. Choroidal vascular changes after transpupillary thermotherapy for choroidal melanoma. Ophthalmology. 2003;110:2216–2222.
105. Annesley, WHJ. Peripheral exudative hemorrhagic chorioretinopathy. Trans Am Ophthalmol Soc. 1980;78:321–364.
106. Shields, CL, Salazar, PF, Mashayekhi, A, et al. Peripheral exudative hemorrhagic chorioretinopathy simulating choroidal melanoma in 173 eyes. Ophthalmology. 2009;116:529–535.
107. Gunduz, K, Shields, CL, Shields, JA. Varix of the vortex vein ampulla simulating choroidal melanoma: report of four cases. Retina. 1998;18:343–347.
108. Rutnin, U. Fundus appearance in normal eyes. I. The choroid. Am J Ophthalmol. 1967;64:821–839.
109. Osher, RH, Abrams, GW, Yarian, D, et al. Varix of the vortex ampulla. Am J Ophthalmol. 1981;92:653–660.
110. Singh, AD, De Potter, P, Shields, CL, et al. Indocyanine green angiography and ultrasonography of a varix of vortex vein. Arch Ophthalmol. 1993;111:1283–1284.
111. Gross, NE, Yannuzzi, LA, Freund, KB, et al. Multiple evanescent white dot syndrome. Arch Ophthalmol. 2006;124:493–500.
112. Dell’omo, R, Wong, R, Marino, M, et al. Relationship between different fluorescein and indocyanine green angiography features in multiple evanescent white dot syndrome. Br J Ophthalmol. 2010;94:59–63.
113. Tsukamoto, E, Yamada, T, Kadoi, C, et al. Hypofluorescent spots on indocyanine green angiography at the recovery stage in multiple evanescent white dot syndrome. Ophthalmologica. 1999;213:336–338.
114. Slakter, JS, Giovannini, A, Yannuzzi, LA, et al. Indocyanine green angiography of multifocal choroiditis. Ophthalmology. 1997;104:1813–1819.
115. Fardeau, C, Herbort, CP, Kullmann, N, et al. Indocyanine green angiography in birdshot chorioretinopathy. Ophthalmology. 1999;106:1928–1934.
116. Howe, LJ, Stanford, MR, Graham, EM, et al. Choroidal abnormalities in birdshot chorioretinopathy: an indocyanine green angiography study. Eye (Lond). 1997;11:554–559.
117. Trinh, L, Bodaghi, B, Fardeau, C, et al. Clinical features, treatment methods, and evolution of birdshot chorioretinopathy in 5 different families. Am J Ophthalmol. 2009;147:1042–1047.
118. Park, D, Schatz, H, McDonald, HR, et al. Indocyanine green angiography of acute multifocal posterior placoid pigment epitheliopathy. Ophthalmology. 1995;102:1877–1883.
119. Howe, LJ, Woon, H, Graham, EM, et al. Choroidal hypoperfusion in acute posterior multifocal placoid pigment epitheliopathy. An indocyanine green angiography study. Ophthalmology. 1995;102:790–798.
120. Schneider, U, Inhoffen, W, Gelisken, F. Indocyanine green angiography in a case of unilateral recurrent posterior acute multifocal placoid pigment epitheliopathy. Acta Ophthalmol Scand. 2003;81:72–75.
121. Giovannini, A, Mariotti, C, Ripa, E, et al. Indocyanine green angiographic findings in serpiginous choroidopathy. Br J Ophthalmol. 1996;80:536–540.
122. Amer, R, Lois, N. Punctate inner choroidopathy. Surv Ophthalmol. 2011;56:36–53.
123. Tiffin, PA, Maini, R, Roxburgh, ST, et al. Indocyanine green angiography in a case of punctate inner choroidopathy. Br J Ophthalmol. 1996;80:90–91.
124. Levy, J, Shneck, M, Klemperer, I, et al. Punctate inner choroidopathy: resolution after oral steroid treatment and review of the literature. Can J Ophthalmol. 2005;40:605–608.
125. Spaide, RF. Collateral damage in acute zonal occult outer retinopathy. Am J Ophthalmol. 2004;138:887–889.