16 Central Nervous System Monitoring
Nearly half of the 1 million patients undergoing cardiac surgery each year worldwide will likely experience persistent cognitive decline.1 The direct annual cost to U.S. insurers for brain injury from just one type of cardiac surgery, myocardial revascularization, is estimated at $4 billion.2 Furthermore, the same processes that injure the central nervous system (CNS) also appear to cause dysfunction of other vital organs. Thus, there are enormous clinical and economic incentives to improve CNS protection during cardiac surgery.
Technical developments have begun to alter this perception. First, CNS injuries still occur despite reductions in aortic manipulation with the new approaches to coronary artery bypass and aortic surgery.3 Second, neurophysiologic studies have implicated hypoperfusion and dysoxygenation as major causative factors in CNS injury4,5 (Box 16-1). Because these functional disturbances are often detectable and correctable, there is an impetus to examine the role of neurophysiologic monitoring in CNS protection (see Chapter 36).
Electroencephalography
EEG monitoring for ischemia detection has been performed since the first CPB procedures, but this long experience is not broad.6 In contrast with its widespread use during carotid endarterectomy, EEG monitoring for cardiac surgery is performed primarily in academic centers or those specializing in pediatric surgery. Limited use appears to have several causes.
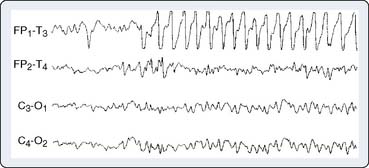
Second, the traditional diagnostic approach to EEG analysis depended on complex pattern recognition of 16-channel analog waveforms to identify focal ischemic changes.7 This analytic format necessitated extensive training and constant vigilance. As a result, cardiac surgery EEG monitoring directly by anesthesia providers has often been viewed as impractical. However, Craft et al8 and Edmonds et al9 have shown that a four-channel recording, which included bilateral activity from both the anterior and posterior circulation, was effective in identifying focal ischemia. In addition, computerized processing of EEG signals provides simplified trend displays that have helped to overcome many of the earlier complexities.
Third, EEG analysis during cardiac surgery was often confounded by anesthetics, hypothermia, and roller-pump artifacts.10 Fortunately, these technical problems have now been overcome in the following ways: (1) elimination or replacement of the troublesome roller pumps with centrifugal pumps, (2) routine use of mild hypothermic or normothermic bypass, and (3) adoption of fast-track anesthesia protocols that avoid marked EEG suppression.

Physiologic Basis of Electroencephalography
EEG-directed interventions designed to correct cerebral hypoperfusion during cardiac surgery require an appreciation of the underlying neurophysiologic substrate. Scalp-recorded EEG signals reflect the temporal and spatial summation of long-lasting (10 to 100 milliseconds) postsynaptic potentials that arise from columnar cortical pyramidal neurons (Figure 16-1). These potentials are produced by dipoles distributed over soma-dendritic surfaces. Pyramidal neurons have a long, vertically oriented, apical dendrite and shorter basal dendrites radiating from the soma base. Near-synchronous excitation (or inhibition) of neighboring dendritic membranes produces large-amplitude spatially summating vertical dipoles, whereas radial current layers are generated in the somatic region. Simultaneous current generation in the two regions may appear to be self-canceling at distant surface electrodes. In addition, traditional EEG depicts only voltage change, not absolute voltage. Thus, sustained high-frequency neuronal activity may result in a large but nonvarying surface voltage deviation that would be invisible to the conventional EEG. These important EEG characteristics should be appreciated when interpreting low-amplitude signals; they do not necessarily indicate synaptic quiescence.
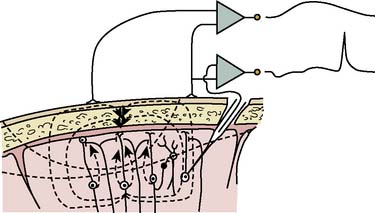
Figure 16-1 Production of electroencephalographic (EEG) waves.
(Modified from Fisch BJ: EEG primer, 3rd ed. New York: Elsevier, 1999, p 6.)
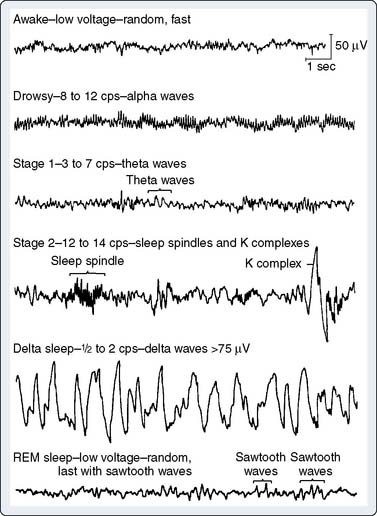
EEG rhythms represent regularly recurring waveforms of similar shape and duration. These signal oscillations depend on the synchronous excitation of a neuronal population. The descriptive nature of conventional EEG characterizes the oscillations (measured in cycles per second [cps] or Hertz [Hz]) as sinusoids that were classified according to their amplitude and frequency. The terminology used to describe the frequency bands of the most common oscillatory patterns is illustrated (Figure 16-2). In addition, a high-frequency (25 to 55 Hz) gamma band is recognized (Box 16-2).
| Delta | 0.5 to 2 Hz |
| Theta | 3 to 7 Hz |
| Alpha | 8 to 12 Hz |
| Beta | 13 to 24 Hz |
| Gamma | 25 to 55 Hz |
EEG oscillatory patterns are functional manifestations of specific intraneuronal networks. The extent of cortical processing among neighboring neuronal columns influences the extent of scalp-recorded EEG waveform synchronization and is not necessarily dependent on the subcortically mediated arousal level. At a high level of cortical processing, each neuronal palisade may function in relative independence. The resultant EEG signal will be of low amplitude, representing the distance-weighted average of many desynchronized micropotentials. The large number of small potentials is reflected in an EEG pattern characterized by a high dominant frequency (13- to 24-Hz beta waves). Such a pattern may be seen during very different vigilance states, such as awake, mentally alert (see Figure 16-2, top trace) versus rapid eye movement (REM; i.e., dream) sleep (see Figure 16-2, bottom trace). Partial cortical columnar synchronization develops with a reduction in information processing, resulting in higher amplitude and lower frequency EEG oscillations associated with a relaxed, drowsy state (see Figure 16-2; 8- to 12-Hz alpha rhythm). Progressive suppression is associated with lower frequency 3- to 7-Hz theta waves. Minimal processing leads to the very-high-amplitude, low-frequency hypersynchronous 0.5- to 2-Hz delta waves seen during the low vigilance states of deep coma, deepest sleep, hypoxia, ischemia, and some forms of surgical anesthesia.
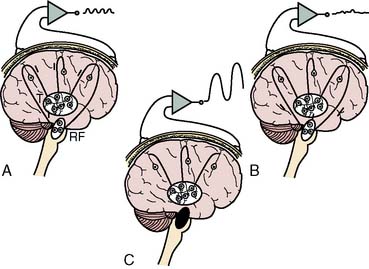
Synchronization of cortical columns is influenced by subcortical structures, including the thalamus (Figure 16-3) and reticular activating system (Figure 16-4). Reticular inhibition can block the passage of sensory information to the cortex that is routed through thalamic relays. This state of functional deafferentation results in unconsciousness, an essential component of both natural sleep and surgical anesthesia.11 However, the individual components of a modern balanced anesthetic technique may differentially affect the separate control mechanisms for sensory processing and vigilance. Thus, an EEG pattern suggestive of a low vigilance state (i.e., surgical hypnosis) does not necessarily guarantee the absence of subcortical (i.e., unconscious) sensory perception (i.e., reflexive response to painful stimuli).12 Furthermore, because the neuronal basis for the EEG is primarily of cortical origin, it is not surprising that many univariate (i.e., single-variable) EEG amplitude or frequency descriptors are only weakly correlated with clinical measures of anesthetic effect or developing pathology involving primarily or exclusively subcortical structures.
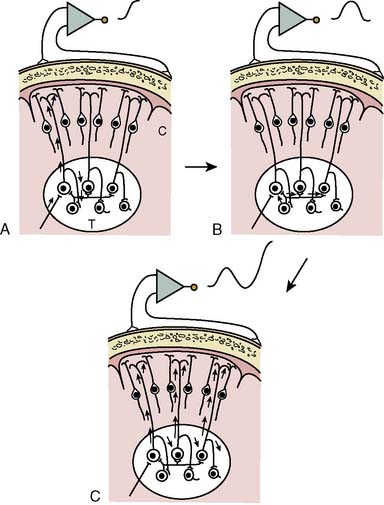
Figure 16-3 Steps involved in the production of rhythmic electroencephalographic (EEG) activity.
(Modified from Fisch BJ: EEG primer, 3rd ed. New York: Elsevier, 1999, p 10.)

Practical Considerations of Electroencephalographic Recording and Signal Processing
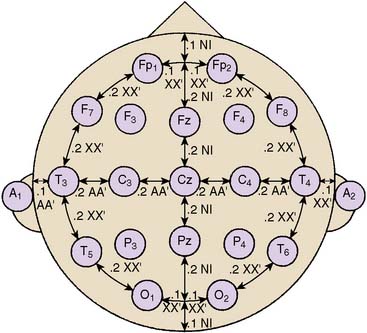
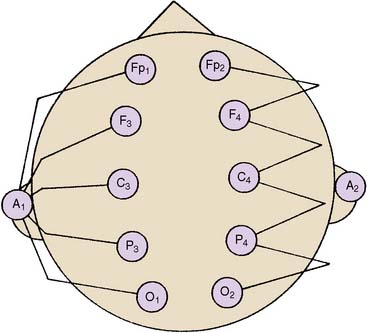
Standardized electrode placement is based on the International 10-20 System (Figure 16-5). It permits uniform spacing of electrodes, independent of head circumference, in scalp regions known to correlate with specific areas of cerebral cortex. Four anatomic landmarks are used: the nasion, inion, and preauricular points. Electrodes are located at 10% or 20% segments of the distance between two of these landmarks. The alphanumeric label for each site uses an initial uppercase letter to signify the skull region (i.e., frontal, central, temporal, parietal, occipital, auricular, and mastoid). Second and sometimes third letters, in lowercase, further delineate position (e.g., “p” represents frontal pole, whereas “z” indicates zero or midline). Subscript numbers represent left (odd) or right (even) and specific hemispheric location, with the lowest numbers closest to midline. The prime notation (′) is used to signify specialized locations designed for certain evoked potential applications (e.g., C3′ and C4′ represent 2 cm posterior to C3 and C4, directly over upper limb sensory cortex).
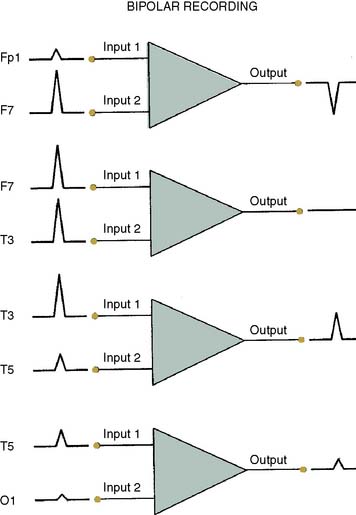
The differential amplifiers used in EEG recording measure the voltage difference between two inputs. By convention, a negative voltage at input 1 relative to input 2 results in an upward deflection of the tracing. With a referential arrangement (montage) of recording channel selections (Figure 16-6, left), the input 2 connections from a series of channels are connected to a single electrode, whereas input 1 electrode connections all differ. Alternatively, in bipolar recordings, a common reference is not used (see Figure 16-6, right).
Although an array of scalp electrodes theoretically permits many possible montages to be used, the capability to quickly change montage varies greatly among different EEG monitors. This ability to quickly change recording montage may be important in the detection and characterization of both focal and diffuse abnormalities. With a referential montage (Figure 16-7), the transient will be distorted if the reference lies within the transient electric field. Alternatively, with a bipolar montage, the potential may actually disappear because of in-phase cancellation.
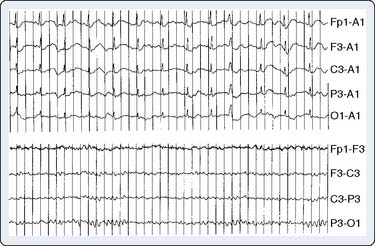
Montage choice also influences susceptibility to artifact. For example, millivolt ECG potentials may contaminate the thousand-fold smaller EEG signal. Contamination is often problematic with an ear or mastoid reference montage but may be invisible with an anterior- to-posterior bipolar montage (Figure 16-8). The extreme lateral placement of ear or mastoid references maximizes contamination by the perpendicularly oriented high-voltage dipole generated by the heart.

Display of Electroencephalographic Information
Time-Domain Analysis
Traditional display of the EEG is a graph of biopotential voltage (y-axis) as a function of time and, consequently, is described as a time-domain process. The objective of a diagnostic EEG is to identify the most likely cause of a detected abnormality at one moment in time. Typically, a diagnostic EEG is obtained under controlled conditions, using precisely defined protocols. Recorded EEG appearance is visually compared with reference patterns. Interpretation is based on recognition of unique waveform patterns that are pathognomonic for specific clinical conditions.13 In contrast, the goal of EEG monitoring is to identify clinically important change from an individualized baseline. Unlike diagnostic EEG interpretation, monitoring requires immediate assessment of continuously fluctuating signals in an electronically hostile, complex, and poorly controlled recording environment. Therefore, of necessity, interpretation relies less on pattern recognition and more on statistical characterization of change. Simple numerical descriptors thus may appropriately form an integral part of EEG monitoring.
Both EEG diagnostic and monitoring interpretations are based, in part, on the “Law of the EEG” (Box 16-3). It states that amplitude and dominant frequency are inversely related. As described earlier, synchronously generated postsynaptic potentials may produce large-amplitude biopotentials. However, long membrane time constants limit the number of changes that may occur per second (e.g., high amplitude, low frequency). Conversely, summation of spatially distributed asynchronous potentials results in EEG signals of low amplitude but relatively high frequency. Thus, the inverse relation between amplitude and frequency generally is maintained during unchanging cerebral metabolic states. Parallel increases in both may occur in some hypermetabolic states such as seizure activity, whereas decreases may be seen in hypometabolic states such as hypothermia. In the absence of these influences, simultaneous decreases in both amplitude and frequency may indicate ischemia or anoxia (Figure 16-9), whereas a parallel increase may be artifact (Figure 16-10).
BOX 16-3 Law of the Electroencephalogram
Time-domain analysis of traditional electroencephalography uses linear amplitude voltage and time scales. The amplitude range of EEG signals is quite large (several hundred microvolts), and univariate statistical measures of its central tendency and dispersion may contain clinically useful information.14 Furthermore, amplitude variation may present clinically significant changes in reactivity that can be obscured by frequency-domain analysis.15 Advances in the technology of EEG amplitude integration have prompted a resurgent interest in this attractively simple approach, particularly in pediatrics.16
Frequency-Domain Analysis
An alternative method, frequency-domain analysis, is exemplified by the prismatic decomposition of white light into its component frequencies (i.e., color spectrum). As the basis of spectral analysis, the Fourier theorem states that a periodic function can be represented, in part, by a sinusoid at the fundamental frequency and an infinite series of integer multiples (i.e., harmonics). The Fourier function at a specific frequency equals the amplitude and phase angle of the associated sinusoid. Graphs of amplitude and phase angle as functions of frequency are called Fourier spectra (i.e., spectral analysis). The EEG amplitude spectral scale (Figure 16-11) squares voltage values to eliminate troublesome negative values. Squaring changes the unit of amplitude measure from microvolts to either picowatts (pW) or nanowatts (nW). However, a power amplitude scale tends to overemphasize large-amplitude changes. Clinically important changes in lower amplitude components that are readily discernible in the linearly scaled unprocessed EEG waveform may become invisible in power spectral displays.
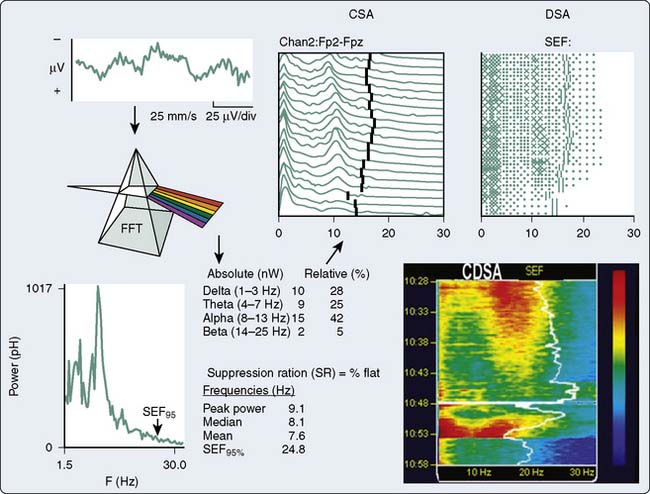
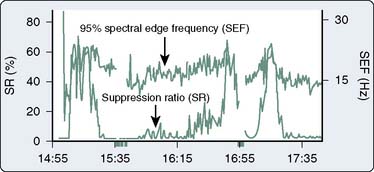
The most widely used univariate frequency descriptors (Box 16-4) are (1) peak power frequency (the single frequency of the spectrum that contains the highest amplitude), (2) median power frequency (frequency below which 50% of the spectral power occurs), (3) mean spectral frequency (sum of power contained at each frequency of the spectrum times its frequency divided by the total power), (4) spectral edge frequency (SEF; frequency below which a predetermined fraction, usually 95%, of the spectral power occurs), and (5) suppression ratio (SR; percentage of flatline EEG contained within sampled epochs). The performance of two descriptors in characterizing clinically important EEG changes is compared (Figure 16-12). Note that at anesthetic induction, the large transient decrease in SEF and reciprocal SR increase. However, later transient SR increases signifying marked EEG suppression were not detected by SEF, apparently because of low-level radiofrequency contamination.
Pronk17 evaluated computer-processed univariate descriptors of EEG changes occurring before, during, and after CPB. Mean spectral frequency alone was sufficient to adequately describe all EEG changes except those occurring at very low amplitudes. Addition of a single-amplitude factor improved agreement with visual interpretation to 90%. Further factor addition did not improve agreement.
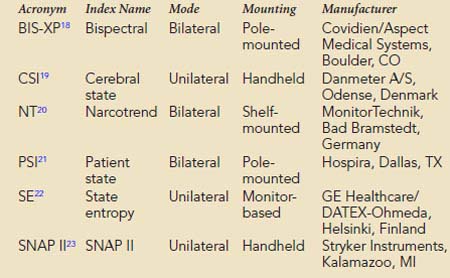
Multivariate (i.e., composed of several variables) descriptors have been developed to improve simple numeric characterization of clinically important EEG changes. With this approach, algorithms are used to generate a single number that represents the pattern of amplitude-frequency-phase relations occurring in a single epoch. Several commercially available monitors provide unitless numbers that have been transformed to arbitrary (i.e., 0 to 100) scales. Each monitor provides a different probability estimate of patient response to verbal instruction. Current monitors designed for use by anesthesia providers are listed in Box 16-5. BIS-XP, NT, PSI, and SNAP II are rule-based proprietary indices empirically derived from patient data. In contrast, CSI uses a fuzzy logic-based algorithm, whereas state entropy (SE) applies standard entropy equations to EEG analysis. Each product is designed to require the use of proprietary self-adhesive forehead sensors. Collectively, these products are now in widespread use as objective measures of hypnotic effect.
BOX 16-5 Commercial Multivariate Quantitative Electroencephalographic Descriptors of Hypnotic Effect
These hypnotic indices appear to provide clinically useful information. However, their fundamental differences may result in distinctly unique performances. Close agreement among these measures should not be expected. Thus, it is inappropriate and unjustified to apply clinical evidence of improved outcome obtained with one of these measures to a competing index. To date, adequately powered, prospective, randomized evidence of a statistically significant (i.e., 82%) reduction in risk for intraoperative awareness in adult noncardiac surgery has been achieved only with BIS-XP.24 A recent meta-analysis review of the extensive peer-reviewed BIS literature concluded that “BIS could reduce the incidence of perioperative recall in surgical patients with high risk of awareness.”25 In addition, the review authors opined that anesthesia guided by BIS monitoring could decrease anesthetic consumption and enhance recovery from relatively deep anesthesia. These findings suggest that prevention of intraoperative awareness may represent only the tip of the iceberg of potential clinical and economic benefit to be derived from routine quantitative EEG perioperative monitoring.
Scalp-recorded cerebral biopotentials are complex physiologic signals representing the algebraic summation of voltage changes produced from cortical synaptic activity (i.e., EEG), upper facial muscle activity (i.e., facial electromyogram [fEMG]), and eye movement (i.e., electro-oculogram [EOG]). During consciousness and light sedation, high-frequency gamma power (i.e., 25 to 55 Hz) is a mixture of EEG and subcortically influenced facial electromyogram. Muscle activity makes a larger contribution because of the closer proximity of signal generators to the recording electrodes. Hypnotics and analgesics typically suppress both cerebral and muscle activities, resulting in reduced gamma power. Because the upper facial muscles are relatively insensitive to moderate neuromuscular blockade, they may remain reactive to noxious stimuli.26 Nociception results in sudden gamma power increase, independent of activity in the lower frequency classical EEG bands.
In addition to the quantitative EEG numeric indices, many monitors also display pseudo-three-dimensional plots of successive power spectra as a function of time. This frequency-domain approach was originated by Joy27 and popularized by Bickford, who coined the term compressed spectral array (CSA).28 Popularity stems, in part, from enormous data compression. For example, the essential information contained in a 4-hour traditional EEG recording consuming more than 1000 pages of unprocessed waveforms can be displayed in CSA format on a single page.
With CSA (see Figure 16-11), successive power spectra of brief (2- to 60-second) EEG epochs are displayed as smoothed histograms of amplitude as a function of frequency. Spectral compression is achieved by partially overlaying successive spectra, with time represented on the z-axis. Hidden-line suppression improves clarity by avoiding overlap of successive traces. Although the display is esthetically attractive, it has limitations. The extent of data loss caused by spectral overlapping depends on the nonstandard axial rotation that varies among EEG monitors. More important, epoch duration and the frequency with which each is measured (i.e., update rate) may critically affect the presentation of clinically important change. For example, there are three distinctly different burst-suppression CSA patterns: high-amplitude bursts, flat line, or a combination of the two.29
Fleming and Smith30 designed an alternative to the CSA display to reduce data loss. Density-modulated spectral array (DSA) uses a two-dimensional monochrome dot matrix plot of time as a function of frequency (see Figure 16-11). The density of dots indicates the amplitude at a particular time-frequency intersection (e.g., an intense large spot indicates high amplitude). Clinically significant shifts in frequency may be detected earlier and more easily than with CSA. However, the resolution of amplitude changes is reduced. Therefore, the color density-modulated spectral array (CDSA) has been developed to enhance amplitude resolution (see Figure 16-11). The CSA, DSA, and CDSA displays are not well-suited for the detection of nonstationary or transient phenomena like burst-suppression or epileptiform activity.
In summary, a quick assessment of EEG change in either the time or frequency domain focuses on the following: (1) maximal peak-to-peak amplitude, (2) relation of maximal amplitude to dominant frequency, (3) amplitude and frequency variability, and (4) new or growing asymmetry between homotopic (i.e., same position on each cerebral hemisphere) EEG derivations. These objectives are generally best achieved through the viewing of both unprocessed and processed displays with a clear understanding of the characteristics and limitations of each (Box 16-6).

Electroencephalography for Injury Prevention during Cardiac Surgery
Since 2005, a great deal of new information has become available on the rationale for perioperative EEG monitoring. The American Society of Neurophysiologic Monitoring has just published its EEG practice guideline.31 It describes the technical features and limitations of current EEG monitors and the available approaches to injury prevention. In addition, a new compendium has described the process of EEG monitoring in detail,32,33 and special journal issues have been devoted specifically to cardiac surgery applications.34,35
The physiologic basis for EEG monitoring is the normally tight coupling among cerebral cortical synaptic activity, metabolism, and blood flow. Such coupling is necessary because of the large energy requirements of interneuronal communication. Indeed, at least 60% of neuronal oxygen and glucose is consumed in the processes of synaptic and axonal transmission, whereas the remainder is used to maintain cellular integrity. Neurons rapidly adjust their signaling capabilities to conserve vital energy stores. Even a slight new imbalance between supply and consumption of energy substrates is manifested by altered synaptic activity. The EEG provides a sensitive measure of this synaptic change and represents an early warning of developing injury. Identification and correction of the physiologic imbalance may then avert serious injury. It must be emphasized that EEG alterations signify imbalance, not necessarily injury. For example, using functional brain imaging with fluorodeoxyglucose, Alkire36 demonstrated EEG relative alpha power to be linearly related to cerebral metabolism during propofol and isoflurane anesthesia. In this case, the synaptic depression manifested by the reduction in high-frequency activity signified anesthetic effect, not ischemia.
Furthermore, because clinically apparent neurologic injury often involves subcortical circuits and structures invisible to the EEG, an expectation of perfect agreement between specific EEG change and neurologic outcome is unwarranted. Imbalance in neuronal homeostasis may lead to either enhanced or diminished excitability. The majority of cortical neurons are small interneurons involved with maintenance of inhibitory tone. Their limited capacity for ionic buffering and energy storage makes them especially susceptible to imbalance. Early signs of energy deficiency may paradoxically result in EEG signs of excitation caused by disinhibition.37 Conversely, with inadequate analgesia, intense sensory stimuli may result in a paradoxically depressed EEG activity resembling ischemia38 (Box 16-7).
Objective Measurement of Hypnotic Effect
Recording the transition from wakefulness to unresponsiveness permits detection of unusual sensitivity or resistance to general anesthetics (Figure 16-13). Such information is vital during fast-track anesthesia protocols to avoid excessive or inadequate anesthesia. Although no available neurophysiologic monitoring modality is an infallible predictor of anesthetic inadequacy, characteristic changes in the EEG frequency pattern provide an easily recognized warning of potential patient awareness. EEG detection of excessive or inadequate hypnosis during cardiac surgery may be aided by the multivariate EEG descriptors.
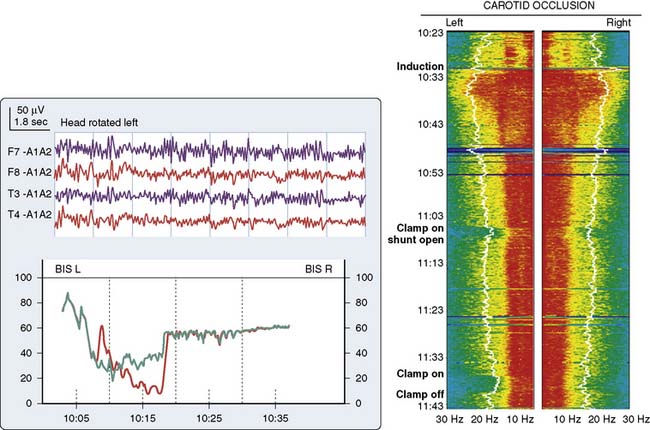
Head Position
Because of the diffuse nature of atherosclerotic vascular disease, many elderly patients are at increased risk for positional focal or regional cerebral ischemia that may occur before incision. Head rotation for surgical positioning or insertion of a pulmonary artery catheter may compress a vital carotid or vertebral artery. Such ischemia is generally identified by marked depression in the affected frontotemporal EEG derivation (see Figure 16-13).
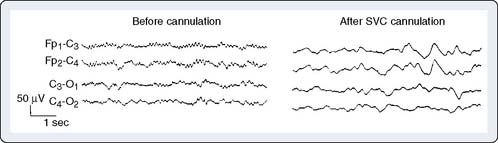
Vascular Obstruction and Flow Misdirection
Manipulation or torsion of the aorta or vena cava may result in regional or global cerebral ischemia. During CPB, the aortic cannula can misdirect either cardiac or pump flow away from one or more head vessels while leaving the radial artery pressure unaltered. Alternatively, a malpositioned venous cannula may impair return from the head without noticeable change in central venous pressure or return flow to the venous reservoir.39 Resulting intracranial hypertension leads to ischemic depression of the EEG (Figure 16-14).
Hemodilution
Hemodilution is used to improve vital organ perfusion by reducing viscosity. However, it may cause inadequate delivery of oxygenated hemoglobin to a high-demand brain, even though hematocrit and systemic venous oxygen saturation are within normal limits.40 EEG deterioration may thus serve as an objective indicator for transfusion.
Hypocarbia and Hypercarbia
Cerebral arteries normally constrict in response to decreased carbon dioxide tension or hydrogen ion concentration. With reactive arteries, hypocarbia may lead to cerebral ischemia because flow is reduced 4%/mm Hg [CO2]. In this circumstance, return to normocarbia can markedly improve cerebral perfusion.41 Conversely, hypercarbia may steal blood from the dilated vessels of an already underperfused region, resulting in focal EEG slowing. This circumstance may be exacerbated by the use of volatile anesthetics causing cerebral vasodilation.
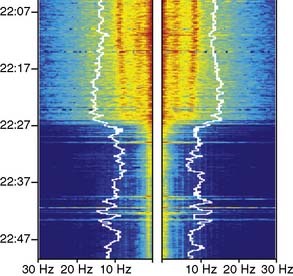
Cooling
During cardiac surgery requiring deep hypothermic circulatory arrest, the EEG provides an effective method for assessing the effects of cooling. Optimal brain temperature may be viewed as a balance between decreased cerebral oxygen consumption and increased risk for coagulopathy. Actual brain temperature cannot be measured directly and appears to be influenced by many variables including the rate of cooling, as well as acid-base and anesthetic management. The EEG is often used to assess the functional consequences of brain cooling because a flat line pattern signifies cortical synaptic quiescence. The wide interpatient variation in flat line temperature is the rationale for EEG guidance of the cooling process.34 Alternative use of a fixed temperature criterion increases the risks for both excessive and inadequate brain cooling.
As nasopharyngeal or tympanic temperature decreases (Figure 16-15), there is a gradual loss of absolute spectral power across all frequency bands.34 Although the reversible decreases in absolute spectral band power are quite large, computing these changes as relative spectral band power minimizes them suggesting that initial brain cooling exerts a similar decrease in spectral power across all frequency bands and cortical regions.42 Cooling below 28°C leads to progressive slowing of the residual EEG until the EEG waveform becomes a flat line.
Rewarming
After circulatory arrest, the EEG documents the recovery of synaptic function during rewarming. However, rapid rewarming may result in cerebral ischemia because of cold-triggered vasoparesis, which uncouples cerebral blood flow and metabolism. In this case, rewarming-induced increase in metabolic demand may outpace the lagging delivery of essential nutrients.43 This situation is indicated by a loss of EEG high-frequency activity accompanying the increase in cranial temperature. Although the practice is controversial, administration of a metabolic suppressant drug such as propofol, dosed to EEG burst suppression, may facilitate balancing cerebral perfusion with metabolic demand.44
Myocardial Revascularization without Extracorporeal Support
Avoidance of CPB during myocardial revascularization may protect patients from the many potential hazards of this nonphysiologic insult.45 EEG stability during beating-heart coronary revascularization is often observed, despite transient hypotension and bradycardia. Nevertheless, some surgeons believe that neuromonitoring is mandatory because the combination of controlled hypotension and vascular torsion can suddenly disrupt cerebral perfusion. In the absence of the neuroprotective effects of mild hypothermia, even relatively brief episodes of cerebral ischemia may result in injury.
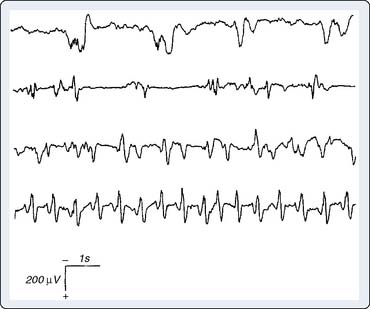
Seizure Detection
Certain anesthetics and adjuvants such as etomidate, sevoflurane, and the opioid analgesics may produce seizure-like EEG activity, although the clinical manifestations may be obscured by neuromuscular blockade (Figure 16-16).46–48 The consequences of this anesthetic-induced seizure-like activity have not been established in adults. However, seizures may be deleterious to the developing brain. Bellinger et al49 showed that perioperative EEG seizure activity in infant cardiac surgery patients was associated with a 10-point decline in expected IQ when subsequently measured in the patients’ fifth year after surgery (Box 16-8).
Auditory-evoked potentials
Important new literature on the intraoperative use of auditory-evoked potentials (AEPs) includes the publication of a professional society practice guideline,50 a neuromonitoring textbook,51 and a special journal issue on cardiac surgery neuromonitoring.52
Acoustic stimuli trigger a neural response integrated by a synchronized neuronal depolarization that travels from the auditory nerve to the cerebral cortex. Scalp-recorded signals, obtained from electrodes located at the vertex and earlobe, contain both the AEPs and other unrelated EEG and EMG activity. Extraction of the relatively low-amplitude AEPs from the larger amplitude background activity requires signal-averaging techniques.52 Because the AEP character remains constant for each stimulus repetition, averaging of many repetitions suppresses the inconstant background. For the AEP sensory stimulus, acoustic clicks are the most commonly used.52 These broadband signals are generated by unidirectional rectangular short pulses (40 to 500 microseconds) with frequency spectra below 10 KHz.
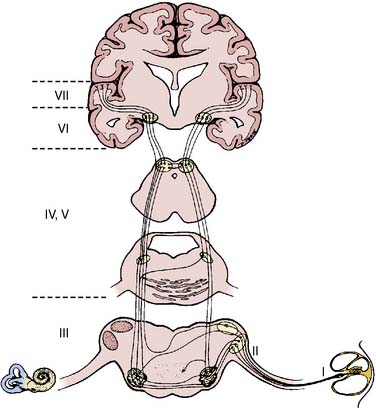
The AEPs comprise a series of biopotentials generated at all levels of the auditory system in response to an acoustic stimulus (Figure 16-17). A dozen peaks have been identified within the first 100 milliseconds after stimulus onset using scalp electrodes.52 Each peak is described by its poststimulus latency and peak-to-peak amplitude. AEPs are commonly classified as early or middle-latency potentials.52 Figure 16-18 is a schematic representation of the AEPs most commonly used for surgical monitoring. Early AEPs are generated from the auditory nerve and the brainstem and include a series of wavelets recorded within the first 10 milliseconds poststimulus. These evoked responses have been designated brainstem auditory-evoked potentials (BAEPs). Seven waves (I to VII) characterize the adult BAEP. Peaks I and II are generally thought to originate from the distal and proximal parts of the eighth nerve, and peak III arises from the cochlear nucleus. Peak IV sources include the superior olivary complex, cochlear nucleus, and nucleus of the lateral lemniscus. Peak V contributors seem to include both the lateral lemniscus and inferior colliculus. Peak VI and VII origins are not well defined but may arise from the medial geniculate body and the acoustic radiations. BAEPs are useful in assessing brainstem and subcortical function during surgery, in part because of their relative resistance to the suppressant effects of most anesthetics.53
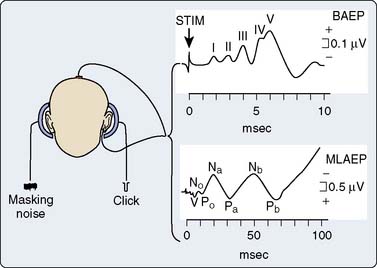
The middle-latency auditory-evoked potentials (MLAEPs), with poststimulus latencies between 10 and 100 milliseconds, are generated in the midbrain and primary auditory cortex.52 In an awake adult subject, the MLAEPs usually consist of three main peaks: Na, Pa, and Nb, with respective latencies near 15, 28, and 40 milliseconds (see Figure 16-18). Children under general anesthesia commonly display the trimodal configuration of the adult MLAEP waveform (Na, Pa, Nb waves), although neonates may exhibit only a small Pa wave.54 Many agents with hypnotic effects prolong the latency and suppress the amplitude of Pa and Nb in a concentration-dependent manner.55 It appears that the latency and amplitude changes allow reliable detection of consciousness and nociception during cardiac surgery.55 In addition, parallel monitoring of MLAEP and quantitative EEG descriptors (i.e., BIS) may permit distinction between the hypnotic and antinociceptive anesthetic components.55 This approach has also been used successfully in pediatric cardiac surgery patients to objectively assess postoperative sedation.56
Amplitude and latency from each of the primary MLAEP components have been integrated into a proprietary autoregressive linear function (A-Line; Danmeter A/S, Odense, Denmark) to facilitate continuous perioperative monitoring.57 Subsequently, this metric was expanded to the A-Line Autoregressive Index (AAI), which included the quantitative EEG descriptors percentage burst suppression and β ratio (i.e., percentage of total EEG power contained in the high-frequency β frequency band).58
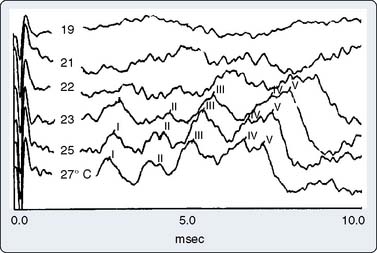
Part of the benefit of AEPs to cardiac surgery derives from their temperature sensitivity because cooling slows both axonal conduction and synaptic transmission. During cooling, the BAEP wave V Q10 (ratio of two values separated by 10°C) is 2.2.59 A decrease of tympanic or nasopharyngeal temperature from 35°C to 25°C doubles wave V latency. Further cooling will eventually suppress waves III to V completely, signifying the virtual elimination of synaptic transmission within the brainstem auditory circuits. BAEPs document complete deep hypothermic electrocerebral silence before temporary circulatory arrest.59
The critical protective action of hypothermia on the brain cannot be accurately assessed by thermometry because of marked individual differences in thermal compartmentation throughout the body.60 Even within the brain, cooling technique (e.g., rapid vs. slow, alpha-stat vs. pH-stat acid-base balance, α-adrenergic blockade vs. none) may result in substantial thermal inhomogeneity within the cerebrum.59–61 Therefore, hypothermia-induced electrocortical silence (i.e., flat EEG) does not necessarily indicate cessation of synaptic activity within deep brain structures. The high metabolic rates of some of these structures (e.g., basal ganglia and inferior colliculus) render them particularly vulnerable to ischemic injury.61 EEG quiescence plus a loss of BAEP waves III to V (Figure 16-19) ensure thorough cooling of the brain core. This approach appears to offer an optimal neuroprotective environment during temporary cessation of cerebral perfusion (Box 16-9).

Somatosensory-Evoked Potentials
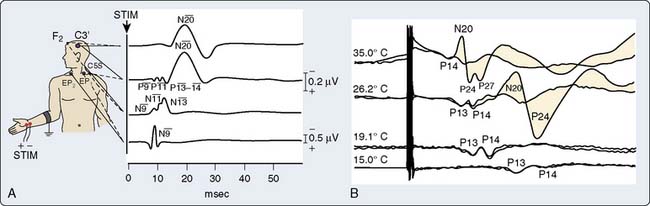
Somatosensory-evoked potentials (SSEPs) are briefly addressed here, in part, because of recent developments including: (1) a professional society surgical monitoring practice guideline,62 (2) neuromonitoring textbook descriptions,63–65 and (3) a special journal issue devoted to cardiac surgery neuromonitoring.66 Like AEPs, SSEPs provide an objective measure of ascending sensory pathway function. Figure 16-20A illustrates the key neural structures involved in a prominent upper limb sensory pathway suitable for cardiac surgery neuromonitoring.
Peripheral Nerve Injury Detection
During cardiothoracic or vascular surgery, improper patient positioning or sternal retraction can lead to injury, respectively, of the ulnar nerve67 and brachial plexus.68 Unfortunately, the standard recording electrode configuration illustrated in Figure 16-20A does not permit distinction of ulnar injury from plexopathy.66 For this purpose, additional recording sites above the elbow or adjacent to the axilla should be used.66 Lorenzini and Poterack69 proposed SSEP noteworthy change criteria that appear to minimize the incidence of false-positive and false-negative responses. In the absence of marked body temperature change, these criteria are either a 60% amplitude reduction or 10% latency increase in the peripheral nerve components of the SSEP response.
Cerebral Ischemia Detection
In contrast with the typically robust subcortical N13 response, during cardiac or vascular surgery many factors other than ischemia may influence the SSEP N20 cortical response. These include anesthetic effects, body temperature, acid-base management, arterial blood oxygen-carrying capacity and blood pulsatility.70 Therefore, traditional criteria for new cortical SSEP abnormality (Figure 16-21) long-established for other types of surgery (50% amplitude reduction and 20% increase in N13-N20 interpeak latency)64 may result in an unacceptably high incidence of false-positive results. To overcome this problem, Astarci et al71 proposed a more rigorous criterion of total N20 loss. A recent SSEP study during carotid endarterectomy supports this approach.72
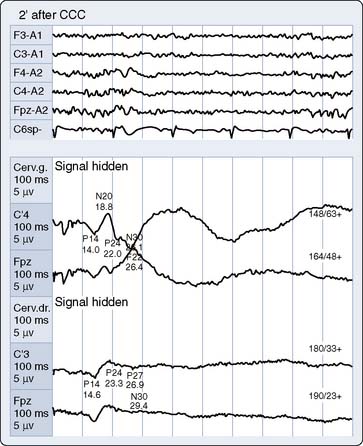
Brain Thermometer
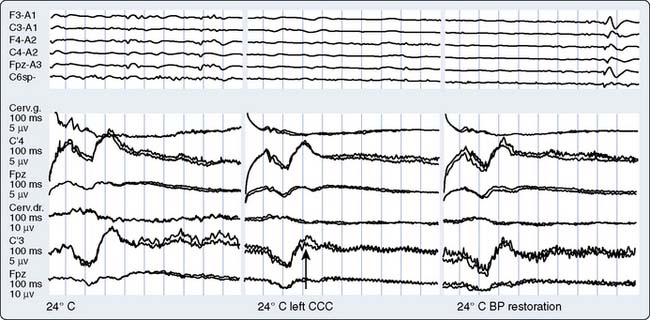
Cooling prolongs SSEP peak and interpeak latencies and suppresses amplitude of predominantly the cortical response (see Figure 16-20B). However, because subcortical SSEP responses involve far fewer synapses than EEG, they often persist when cortical neuronal activity is totally cold-suppressed. Thus, detection of cerebral ischemia via SSEP can be achieved during EEG quiescence (Figure 16-22). In addition, the differential effect of cooling on the cortical and subcortical SSEP components can be used to identify the patient-specific nasopharyngeal or tympanic temperature suitable for the optimal cooling strategy for hypothermic brain protection.66 For example, Guérit et al73 found that there were no neurologic complications in a group of patients who underwent deep hypothermic circulatory arrest guided by abolition of the subcortical SSEP response. In contrast, patients who exhibited SSEP loss because of non–temperature-related causes experienced postoperative neurologic sequelae.

Motor-Evoked Potentials
The U.S. Food and Drug Administration recently cleared transcranial high-intensity electric stimulators for clinical use. By relying on the delivery of a rapid stimulus pulse train, it is now possible to continuously monitor the integrity of descending motor pathways using transcranial electric motor-evoked potentials (MEPs).74–77 The most frequent application of this emerging monitoring modality for cardiothoracic surgery currently is during open surgical or endovascular repair of the descending aorta.78,79 There remains a critical need for improved spinal cord protection because, even with modern cord preservation techniques, the 16% infarction rate during type I and II aneurysm repairs in patients without potential benefit of MEP monitoring remains disturbingly high.80
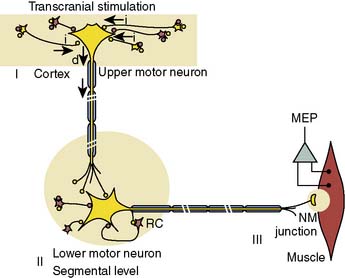
The neurophysiologic basis for the MEP is illustrated in Figure 16-23. Individual high-intensity transcranial stimuli depolarize cortical motor neurons directly in the axon hillock region or indirectly via activation of interneurons. Synaptic transmission of individual impulses to segmental α-motor neurons lowers the postsynaptic membrane potential but is often insufficient to initiate cell firing. Instead, this goal is achieved through use of a pulse train that triggers lower motor neuron discharge via temporal summation of individual subthreshold responses.
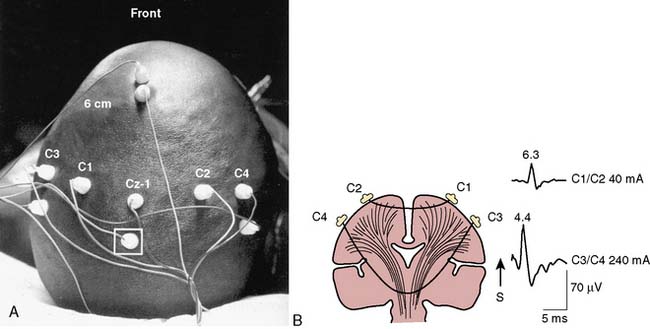
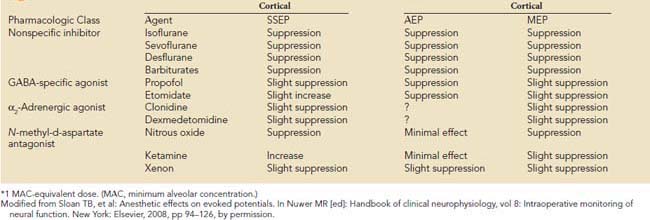
Precise placement of subdermal stimulating electrodes (Figure 16-24A) is important because of its influence on motor pathway activation. The transcranial electric current generated from closely spaced electrodes depolarizes a discrete cortical region that may control only a restricted muscle group. In contrast, current produced using wide electrode separation bypasses the anesthetic-susceptible cortical neurons. This results in direct depolarization of descending motor tracts that affect both upper and lower limb muscles (see Figure 16-24B). Even though lower limb MEPs are necessary to document the functional integrity of motor pathways in the thoracolumbar spinal cord, upper limb recording is also important. The upper limb responses identify generalized MEP suppression. Its causes include anesthetic-induced synaptic inhibition, hypocapnia, and hypothermia, as well as position-related ischemia involving cerebral and/or upper limb motor pathways (Figure 16-25). The effects of anesthetics on evoked potentials are summarized in Box 16-10. In additional to these generalized effects, it also should be appreciated that volatile anesthetics suppress both cortical and spinal cord motor neurons. Thus, their use should be avoided or minimized during attempted MEP monitoring.81
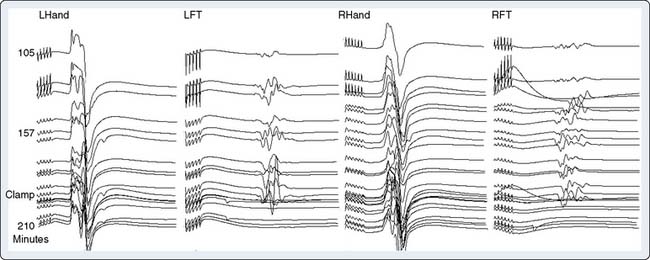
BOX 16-10 Anesthetic* Effects on Sensory- and Motor-Evoked Responses
Modified from Sloan TB, et al: Anesthetic effects on evoked potentials. In Nuwer MR [ed]: Handbook of clinical neurophysiology, vol 8: Intraoperative monitoring of neural function. New York: Elsevier, 2008, pp 94–126, by permission.
In contrast with AEP and SSEP, the large amplitude of MEP EMG responses obviates the need for signal averaging. However, the inherent variability of these individual responses (see Figure 16-25) means that precise measurement of peak amplitude and latency are more difficult to achieve than with the more stable averaged sensory-evoked potentials. Nevertheless, Kawanishi et al82 found 100% sensitivity and 98% specificity for MEP detection of motor pathway dysfunction. Their criterion for noteworthy change was a persistent 25% peak-to-peak amplitude decline. Correct interpretation of MEP amplitude change requires precise monitoring and control of neuromuscular blockade. Information on the extent of neuromuscular blockade obtained from evoked EMG train-of-four responses in both upper and lower limb muscles bilaterally helps guide relaxant administration and detects limb ischemia.83
Although MEP monitoring is technically challenging and places additional burdens on anesthesia providers, the effort seems worthwhile. Even though large-sample, prospective, randomized outcome studies are lacking, there are many small-sample prospective or retrospective studies demonstrating benefit. For example, Etz et al84 obtained an impressively low 2% neurodeficit incidence in 100 descending aorta surgical repairs, 73% of which were high-risk Crawford type I or II aneurysms. Current opinion on the value of MEP monitoring for this application is reflected by MacDonald and Dong’s79 recent review, which states: “There is now strong evidence that … MEP monitoring positively impacts descending aortic aneurysm surgery outcome when used to guide aggressive intervention.”
Transcranial doppler ultrasound

Ultrasound Technology
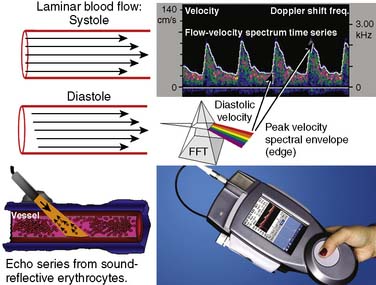
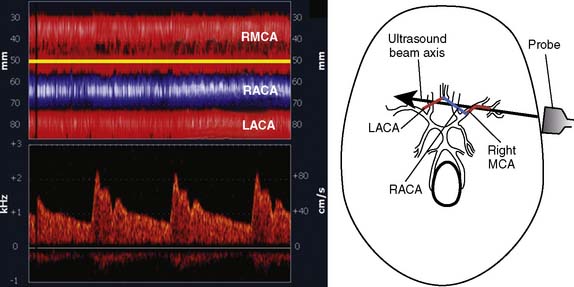
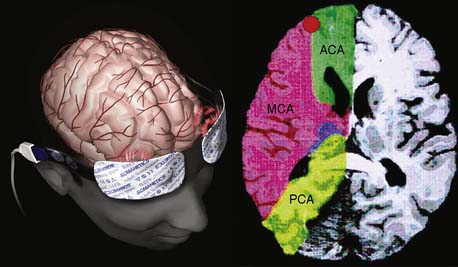
Ultrasonic probes of a clinical TCD sonograph contain an electrically activated piezoelectric crystal that transmits low-power 1- to 2-MHz acoustic vibrations (i.e., insonation) through the thinnest portion of temporal bone (i.e., acoustic window) into brain tissue. Blood constituents (predominantly erythrocytes), contained in large arteries and veins, reflect these ultrasonic waves back to the probe, which also serves as a receiver. Because of laminar blood flow, erythrocytes traveling in the central region of a large blood vessel move with greater velocity than those near the vessel wall (Figure 16-26). Thus, within each vascular segment (i.e., sample volume), a series of echoes associated with varying velocities is created. The frequency differences between the insonation signal and each echo in the series are proportional to the associated velocity, and this velocity is determined from the Doppler equation (see Figure 16-26). Although several large intracranial arteries may be insonated through the temporal window, the middle cerebral artery is generally monitored during cardiac surgery because it carries approximately 40% of the hemispheric blood flow.
Pulsed-Wave Spectral Display
Pulsed-wave Doppler samples the ultrasonic echoes at a user-selected distance (i.e., single gate) below the scalp. The frequency composition of these Doppler-shifted echoes is analyzed by Fourier analysis, the same technique used to quantify EEG frequency patterns (see Figure 16-26). The analysis produces a momentary amplitude spectrum displayed as a function of blood flow velocity (e.g., Doppler-shift frequency). This relation is mapped as one vertical strip in the spectrogram display (see Figure 16-26, upper right). Amplitude at each frequency is expressed as log change (i.e., dB) from the background composed of random echoes. The momentary analysis is repeated 100 times a second to produce a scrolling spectrogram of time-related changes in flow velocity.
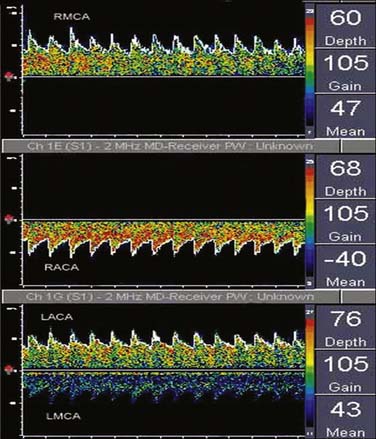
Signal amplitude at each frequency shift–time intersection is indicated by monochromatic dot density or color coding. The maximum velocity, the upper edge (envelope) of the velocity spectrum (analogous to the EEG SEF), represents the maximum Doppler shift (erythrocyte velocity) in the vessel center. Peak systolic and end-diastolic velocities are derived from this spectral edge. Intensity-weighted mean velocity is calculated by weighted averaging of the intensity of all Doppler spectral signals in a vessel cross section. Sampling echoes at multiple loci (multigating) produces spectrograms for each of the different probe-to-sample site distances (Figure 16-27).
Power M-Mode Doppler Display
An alternative method for processing pulsed-wave Doppler echoes is nonspectral power M-mode Doppler (PMD; Figure 16-28). Unlike the series of spectra generated with multigating, PMD creates one image with each depth represented by a plot of signal amplitude (i.e., power) and depth as functions of time. A color scale signifies flow direction (red is flow directed toward the probe; blue is flow away from the probe), whereas color intensity is directly related to signal power.
Embolus Detection
Erythrocytes (approximately 5 million/mL) are the most acoustically reflective, nonpathologic blood elements (i.e., high acoustic impedance). However, gaseous and particulate emboli are better reflectors of sound than erythrocytes. The presence of high-intensity transient signals (HITSs) within either the PMD or spectral TCD display may signify the presence of an embolus.85,86 Because a gaseous or particulate embolus cannot simultaneously appear at all distances from the probe, either PMD or a multigated spectral display may be used to distinguish them from acoustic artifact (tapping on the ultrasonic probe produces a high-intensity transient acoustic artifact at all distances).
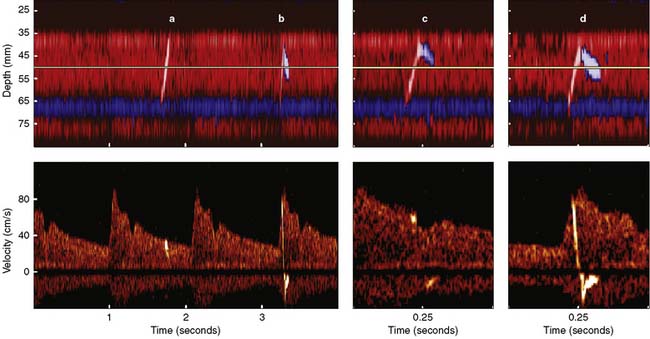
Figure 16-29 illustrates the appearance of HITSs in the two TCD display formats. The bottom spectral displays are generated from a small vascular segment at a distance of 50 ± 3 mm (6-mm sample volume) from the probe surface. The midpoint of the spectral sample is indicated on the top PMD displays as a light horizontal line at a 50-mm depth. An embolic track labeled “a” is a single embolus that is shown in the top PMD display moving toward the probe (i.e., decreasing distance from the probe face over time). Embolic tracks “b” and “d” display the characteristic “lambda” acoustic signature in the spectral display. The PMD shows that this pattern is due to embolus direction reversal within the spectral sample volume. The true behavior of the spectrally paradoxical track “c” (start and end points of the single acoustic signature are not connected) becomes clear in the PMD view. Track “c” direction reversal is invisible on the spectral display because it occurs outside the sampling region. Currently available spectral or PMD TCD monitors can determine neither the size nor composition of emboliform material responsible for HITSs. TCD devices designed for surgical monitoring typically provide a semiquantitative estimate of aggregate HITSs, irrespective of their origin (Box 16-11).
Intervention Threshold
Because erythrocyte velocity and flow may be differentially influenced by vessel diameter,87 blood viscosity,88,89 and pH,89 as well as temperature,89 TCD does not provide a reliable measure of cerebral blood flow. However, in the absence of hemodilution, change in TCD velocity does correlate closely with change in blood flow.87 Sudden large changes in velocity or direction are readily detected by continuous TCD monitoring. The clinical significance of velocity changes has been assessed in conscious patients during implantable cardioverter-defibrillator and tilt-table testing.90,91 In both circumstances, clinical evidence of cerebral hypoperfusion was accompanied by a mean velocity decline of greater than 60% and absent diastolic velocity. During nonpulsatile CPB, the ischemia threshold appears to be an 80% decrease below the preincision baseline.92
In general, reduction of flow velocity indicating severe ischemia is associated with profound depression of EEG activity.92 However, with adequate leptomeningeal collateral flow, cerebral function may remain unchanged in the presence of a severely decreased or absent middle cerebral artery flow velocity.93 Together, these findings form the rationale for a TCD-based intervention threshold. During cardiac surgery, mean velocity reductions of greater than 80% or velocity loss during diastole suggest clinically significant cerebral hypoperfusion.

Clinical Basis for Intervention
Before Cardiopulmonary Bypass
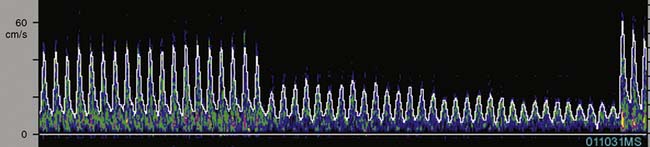
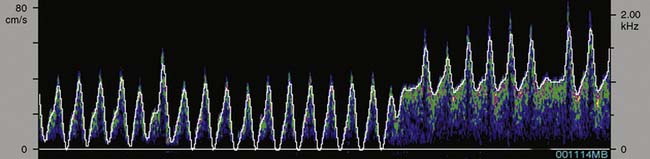
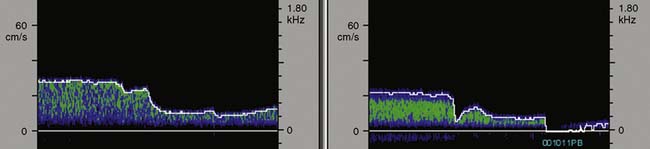
TCD provides cerebral hemodynamic information for the timely detection and correction of perfusion abnormalities that may occur before the onset of CPB. Vascular torsion during neck extension or axial head rotation may result in regional cerebral hypoperfusion detectable by TCD.94 Cerebral blood flow obstruction may also be detected by TCD during endovascular repair of aortic dissection.95 Excessive hyperventilation may result in inadvertent cerebral ischemia because blood flow declines by 4%/mm Hg Paco2 in normally reactive cerebral arteries.87 Cerebral dysautoregulation is often seen in hypertensive and diabetic patients.96 This abnormality may result in pressure-dependent brain perfusion and place the patient at risk for ischemic brain injury during even moderate hypotension. TCD may be used to identify pressure dependency and facilitate appropriate individualization of acceptable perfusion pressure.97 In addition, TCD has been used to identify the optimal aortic cannulation site.98 For example, Mullges et al99 observed that the mean aggregate middle cerebral artery embolic load was significantly lower with a distal arch cannulation compared with the traditional ascending aorta site. These results are consistent with the studies using epiaortic ultrasound. Detection of malpositioned aortic or superior vena caval perfusion cannula is rapidly achieved with TCD monitoring.100 In the former case, the malposition results in a sudden profound decrease in the peak systolic velocity (Figure 16-30), whereas in the latter, diastolic velocity is compromised (Figure 16-31).
During Cardiopulmonary Bypass
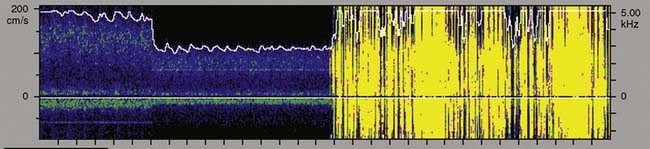
TCD is the only available method to continuously assess changes in cerebral hemodynamics associated with CPB. Despite the confounding influences of hemodilution, altered acid-base management, and cooling on absolute flow velocity, TCD nevertheless indicates the presence and direction of cerebral blood flow. A sudden large decrease, increase, or asymmetry indicates, respectively, inadvertent occlusion of a great vessel, hyperperfusion of a single cranial artery, or misdirection of aortic cannula flow (Figure 16-32).
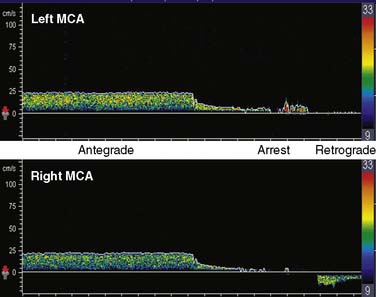
During surgical repair of the aortic arch, TCD documents cerebral artery flow direction during attempts at supplemental retrograde (Figure 16-33) or antegrade (Figure 16-34) cerebral perfusion during systemic circulatory arrest.101,102 Because peak velocity changes in large basal cerebral arteries are directly related to peak flow changes, TCD may aid in the determination of safe upper and lower limits for pump flow and perfusion pressure.103 Deep cooling and circulatory arrest may produce a transient cerebral vasoparesis and result in uncoupling of cerebral blood flow and metabolism.102 TCD identifies this phenomenon as an unchanging flow velocity during rewarming. Emboli detection by TCD can improve surgical and perfusion technique, as well as facilitate correction of technical problems such as an air leak104–106 (see Figure 16-34 and Box 16-12).

Transcranial Doppler Clinical Benefit
A practice guideline for TCD perioperative monitoring has just been jointly published by the American Society of Neurophysiologic Monitoring and the American Society of Neuroimaging.107 In addition, evidenced-based medicine now supports the use of TCD monitoring during cardiovascular surgery.108,109 For example, the results of a randomized, prospective investigation demonstrated that TCD monitoring during acute aortic dissection repair reduced the incidence of transient neurologic deficit from 52% to 15%. This reduction was achieved, in part, through TCD-directed changes in perfusion cannula placement (29% of cases) and adjustments in the management of retrograde cerebral perfusion (79% of cases).110 Prospective studies have also demonstrated the clinical utility of direct cerebral perfusion measurement. Although vasoconstrictors reliably increase arterial blood pressure, they may not alter cerebral perfusion pressure.111 Similarly, nitrate vasodilators typically reduce arterial blood pressure, whereas cerebral perfusion pressure may remain unaltered87 or may actually increase.111 In the absence of cerebral perfusion monitoring, blood pressure management can easily result in adverse consequences to the brain.
Jugular bulb oximetry
The normal Sjvo2 range is widely assumed to be between 60% and 70%.112 However, a recent study using radiographically confirmed catheter placement observed a much wider 45% to 70% range in healthy subjects.113 Furthermore, the 95% confidence interval of the low threshold was 37% to 53%. Thus, some healthy individuals had Sjvo2 values less than 35%.
There are two major limitations of the technology. First, Sjvo2 represents a global measure of venous drainage from unspecified cranial compartments. Because cerebral and extracranial venous anatomy are notoriously varied, clinical interpretation of measured change is a major challenge. The difficulty is exemplified by the study of Mutch et al,114 who used both Sjvo2 and T2*-weighted magnetic resonance imaging to measure oxyhemoglobin and deoxyhemoglobin in a porcine model of CPB. Imaging demonstrated substantial hypoxic regions within the cerebral parenchyma that were invisible to the global jugular oxygen saturation measurement. Second, accurate measurement using jugular oximetry requires continuous adequate flow past the catheter. Low- or no-flow states such as profound hypoperfusion or complete ischemia render Sjvo2 unreliable.115 Despite these limitations, the global measure of brain oxygen balance has been used successfully as a transfusion trigger116 and to document the deleterious effect of even modest cerebral hyperthermia.117 In addition, Sjvo2 monitoring determined that, compared with traditional myocardial revascularization, the “off-pump” procedure was associated with a two-fold increase in the incidence of noteworthy oxygen desaturation.118
Cerebral oximetry

Near-Infrared Technology
Because the human skull is translucent to infrared light, intracranial intravascular regional hemoglobin oxygen saturation (rSo2) may be measured noninvasively with transcranial near-infrared spectroscopy (NIRS). An infrared light source contained in a self-adhesive patch affixed to glabrous skin of the scalp transmits photons through underlying tissues to the outer layers of the cerebral cortex. Adjacent sensors separate photons reflected from the skin, muscle, skull, and dura from those of the brain tissue (Figure 16-35). NIRS measures all hemoglobin, pulsatile and nonpulsatile, in a mixed microvascular bed composed of gas-exchanging vessels with a diameter less than 100 μm.119 The measurement is thought to reflect approximately 75% venous blood.119 This ratio remains nearly constant in normoxia, hypoxia, and hypocapnia.119 Cerebral oximetry appears to both reliably quantify change from an individualized baseline and offer an objective measure of regional hypoperfusion.120,121 Unlike pulse and jugular bulb oximetry, respectively, cerebral oximetry may be used during nonpulsatile CPB and circulatory arrest.
Similar to TCD monitoring, cerebral oximetry is primarily used to quantify change. Substantial NIRS intersubject baseline variability precludes establishment of an absolute threshold value for tissue ischemia.122 An adverse shift in oxygen supply-demand balance is indicated by a decreasing oxyhemoglobin fraction. The clinical significance of the decline has been determined in conscious patients during G-force studies with high-speed centrifugation, implantable cardioverter/defibrillator testing, tilt-table testing, carotid artery occlusion, and intracranial artery balloon occlusion.91,92,123,124 In each setting, a decline of greater than 20% was associated with syncope or signs of focal cerebral ischemia. The magnitude and duration of cerebral dysoxygenation are associated with hospital cost-driver increase, as well as the incidence and severity of adverse clinical outcome.125–136
The first commercial device to receive FDA clearance for continuous measurement of rSo2 was the single-channel INVOS 3100 cerebral oximeter (Somanetics Corporation, Troy, MI). The latest model 5100 is a four-channel device that is cleared for continuous measurement of cerebral and somatic tissue oxygenation in patients larger than 2.5 kg. It uses two wavelengths of infrared light generated by broad bandwidth light-emitting diodes. Some investigators have expressed theoretical concern that the fixed 25:75 arterial/venous oxygen saturation ratio used by the INVOS device does not accurately represent the inevitable fluctuations in the actual arterial-venous volume relation.137,138 However, experimental data demonstrate that rSo2 is insensitive to substantial change in this ratio.139,140 Through a process termed spatial resolution, INVOS uses multipoint extracranial and intracranial measurements to suppress the influences of extracranial hemoglobin absorption and intersubject variation in intracranial photon scatter. Independent studies have shown that the source of the resultant rSo2 metric is approximately 85% intracranial119 (Figure 16-36, left panel).
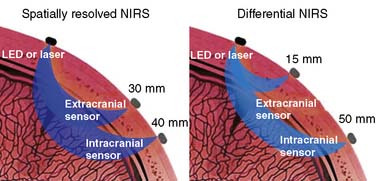
Figure 16-36 The mean photon path traveling through the adult cranium from an infrared source to sensors on neighboring scalp is banana shaped. With spatially resolved near-infrared spectroscopy (NIRS), both sensors are sufficiently distant from the light source to ensure that the mean photon paths of both signals pass intracranially (left). Two-point extracranial and intracranial measurement permits suppression of both the extracranial signal and interpatient variance in intracranial photon scatter. The resultant cerebral oxygen saturation measurement appears to be about 85% intracranial.119 In contrast, differential NIRS uses a sensor placed very near the light source to record exclusively extracranial signal and another more distant sensor for intracranial measurement (right). Single-point subtraction suppresses extracranial signal but not intersubject variation in photon scatter. This second goal is claimed to be achieved through the use of additional wavelengths of infrared light.141 LED, light-emitting diode.
(Left, Courtesy of Somanetics Corporation, Troy, MI.)
Three other cerebral oximeters have recently received FDA clearance. The CAS Medical (Branford, CT) Fore-Sight also uses two infrared sensors.141 The proximal sensor is positioned very near the light source to detect exclusively extracranial photon migration. Photons detected by the distal sensor arise from both extracranial and intracranial tissues (see Figure 16-36, right panel). Cerebral saturation is determined from the proximal-distal differential signal. Although this approach appears to suppress extracranial contamination, the single-point intracranial measurement may be influenced by individual variations in intracranial photon scatter. The manufacturer claims that photon scatter variation is mitigated by the use of four narrow-bandwidth laser-generated infrared wavelengths. There are as yet no peer-reviewed articles to substantiate this claim or that compare Fore-Sight performance with other cerebral oximeters, but several abstracts are available.142,143
Nonin (Minneapolis, MN) manufactures the EquanOX 7600 cerebral oximeter. It relies on dual light-emitting diode light sources and three wavelengths of infrared light. Infrared light source-sensor separation appears to be similar to the Somanetics INVOS 5100. Currently, only one abstract is available that describes device performance.144
Most articles describing clinical experience with FDA-cleared tissue oximetry have used the Somanetics rSo2 metric. Unless otherwise indicated, subsequent discussion refers to the use of this saturation measure. Until more information becomes available, it would be imprudent to assume that tissue oxygen saturation values obtained with one brand of tissue oximeter are interchangeable with those from another.145 Objective performance comparison is difficult because of the lack of a universally accepted direct reference standard measure of regional brain oxygen saturation.

Technologic Limitations
The technical limitations of cerebral oximetry primarily involve factors that influence photon migration. Sensor placement is currently limited to glabrous skin (e.g., forehead) lateral to the midline. Such placement prevents monitoring the critical posterior watershed at the juncture of the anterior, middle, and posterior cerebral arteries (see Figure 16-35). Dark hair and the follicles of dark hair absorb near-infrared light and can substantially reduce the signal-to-noise ratio. Thus, de Letter et al,146 using a parietotemporal placement in head-shaved neurosurgical patients, failed to obtain saturation values in 18% of their patients. Weak signals may also result from hematoma or sensor placement over a venous sinus.147 In either case, the large hemoglobin volume acts as a photon sink. Conversely, recording failures may arise from excessively large signals, such as those produced by a skull defect.148

Validation
The rSo2 value has been validated from arterial and jugular bulb oxygen saturation measurements in pediatric and adult subjects.149,150 In these studies, hypoxemia involving cerebral tissue proximate to the sensors was consistently detected by this technology. Except during ischemia and CPB, Sjvo2 and rSo2 generally correlate in the midrange saturation, although discrepancies may appear at the extremes.151 The validity of rSo2 also has been assessed by comparison with direct microprobe measurement of brain tissue oxygen partial pressure (tPo2). Reasonable agreement between these two measures has been found in neurosurgical patients.152,153

Controversies
As with most new technologies, the emergence of cerebral and regional tissue oximetry has spawned controversy. Fortunately, a recent series of Pro and Con articles has addressed the major clinical concerns.138,154–156 These issues are discussed later in the Intervention Rationale section.
Perhaps the most puzzling controversy involves the unqualified insistence by skeptics that multiple positive, large-scale prospective, randomized outcome trials must precede routine use of regional tissue oximetry during cardiac and major vascular surgery.122,138,154 Such insistence is eminently reasonable for monitoring modalities that (1) pose a risk of injury; (2) are very expensive; or (3) have a difficult learning curve or require extensive, specialized training. Because regional tissue oximetry meets none of these criteria, the reason for this insistence is less clear.
The pulse oximetry precedent seems relevant to this controversy. In 1989, the American Society of Anesthesiologists House of Delegates mandated that pulse oximetry be used in every surgery involving general or regional anesthesia. The goal of the mandate was to reduce the probable risk of rare injury. No large-scale prospective, randomized trial preceded the mandate. Interestingly, the later trial involving more than 20,000 patients failed to detect an improved outcome in the pulse oximeter cohort.157 In the accompanying editorial, Eichhorn158 justified the earlier pulse oximeter mandate on the sensible grounds that “it is reasonable to be influenced and accept more indirect indications when considering the complex multivariate epidemiologic investigations dealing with anesthetic outcome.”
Recently, Vohra et al159 applied Eichhorn’s reasoning to their conclusion of a 488-article cardiac surgery cerebral oximetry literature review. They stated, “Clinical benefit and lack of use-associated risk of injury at a modest expense support the use of rSo2 monitoring routinely in patients undergoing cardiac surgery.” Estimates of the extent of rSo2 monitoring made in 2007 indicate that the technology is utilized in two thirds of pediatric126 and one third of adult125 U.S. cardiac centers. On the basis of these adoption rates and now-extensive evidence of rSo2 clinical benefit including three positive prospective, randomized trials,129–131 Murkin128 suggests that the controversy has evolved to “standard of care for routine CPB vs. evolving standard for selective cerebral perfusion.”

Normative Values
Kishi et al160 examined surgical patient demographic influences on rSo2. The measure appeared to be independent of weight, height, head size, or sex, although it was negatively correlated with age and positively correlated with hemoglobin concentration. Values were also affected as the sensor was moved laterally from the recommended position above the eye. In contrast, it is worth considering that the apparent age influence on rSo2 may reflect advancing pathology in older patients.
Development of local physiologic norms is a common practice in neurophysiology units. Following this practice, in 1000 elective adult cardiac surgery patients (age range, 21 to 91; female sex, 32%), this author has determined a preprocedure rSo2 value of 67 ± 10 scale units.139 This value is significantly less than the 71 ± 6 previously reported for healthy volunteers (age range, 20 to 36).150 The mean and median left-right difference for the cardiac surgery patients was zero, and only 5% of the differences were greater than 10. Only 5% of the rSo2 baseline values were less than 50 or above 80. Thus, from a statistical perspective, a preinduction baseline rSo2 value in adult elective cardiac surgery patients is abnormal if it is either outside the range of 50 to 80 or there is a right-left difference of greater than 10%. Normative data obtained with a differential spectrometer in 33 adult cardiac patients resulted in a similar mean saturation of 70% ± 4%.143 The smaller variance is a likely result of the small sample size.

Intervention Threshold
Brain rSo2 values less than or equal to 50 scale units appear to represent an increased risk for hypoxic injury.134,136,161–165 In addition, numerous studies have observed clinical signs of cerebral hypoxia or adverse outcome, or both, after rSo2 declines more than 20% below baseline.123–133,166–170 Recently, a detailed cardiac surgery intervention algorithm based on this criterion has been proposed by Denault et al.171 Current intervention strategy incorporates both concepts (Box 16-13). Thus, for most patients with awake baseline rSo2 values greater than 50, intervention is triggered with a decline of more than 20%. Alternatively, for individuals with a baseline of 50 or less, the objective is to maintain this abnormally low value throughout the perioperative period, using the tactics described in the Denault algorithm. With rSo2 asymmetry, each cerebral hemisphere is managed independently. In this circumstance, the 20% criterion applies to a hemispheric baseline rSo2 greater than 50, whereas the baseline maintenance criterion applies to hemispheric values of 50 or less. This approach to rSo2 asymmetry is consistent with radiographic studies demonstrating a high incidence of clinically silent intracranial vascular disease before adult cardiac surgery.172,173

Intervention Rationale
Baseline rSo2
Surgical cerebral oximetric monitoring should be initiated immediately after patient entry to the operating room. Self-adhesive patches containing the infrared light source with shallow (proximate) and deep (distant) sensors are fixed on the forehead on both sides of the midline. The initial objective is the establishment of a reference baseline before preoxygenation and anesthetic induction (Figure 16-37).
A high cerebral metabolic demand for oxygen may result in abnormally low rSo2 values despite normal pulse oximetry readings. For example, the cerebral oximeter detected oxygen imbalance during high-altitude trekking that was unrecognized by pulse oximetry.174 Similarly, patients in heart failure often have preoperative baseline values far below the normative range.175–178 Abnormally high rSo2 values may signify a silent infarction because injured or dead neurons consume little oxygen. Abnormal (>10 scale units) right-left rSo2 may be caused by unrecognized carotid or intracranial arterial stenosis, intracranial space-occupying lesion, old infarction, skull defect, or extracranial sources such as a hemangioma, sinusitis, or artifactual interference from an infrared-emitting device.179–182 An asymmetry or abnormal rSo2 baseline, high or low, alerts the operative team to the increased potential for cerebral oxygen imbalance during surgical challenge.
Developing rSo2 Asymmetry
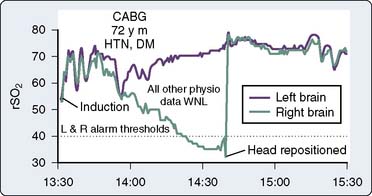
A new asymmetry, signifying cerebral dysoxygenation, may develop quickly during anesthetic induction, pulmonary artery catheter insertion, or final patient positioning. During head positioning, an asymmetric rSo2 decrease warns of developing regional cerebral hypoperfusion that otherwise may remain unrecognized.139,155,183 Axial head rotation displaces the lateral mass of the contralateral atlas forward behind the internal carotid artery, just below its entrance into the carotid canal at the skull base. If this process is prolonged or if the artery is adherent to adjacent tissue, it can be compressed from behind, resulting in decreased flow.184–186 Furthermore, volatile anesthetics may interfere with the regulatory mechanisms that normally maintain effective cerebral perfusion bilaterally during head rotation in conscious patients.187
The cerebral oximeter has detected potentially catastrophic cerebral desaturation because of great vessel torsion during cardiac manipulation.188–192 Desaturation often appears to be the result of compromised venous return. Particularly in pediatric cardiac operations and in myocardial revascularization without CPB, cardiac manipulation may produce sudden large rSo2 decreases without any appreciable change in mean arterial pressure (MAP) or arterial oxygen saturation.
Numerous reports have described rSo2 detection of perfusion cannulae malposition193–195 or regional malperfusion development during surgery involving the aortic arch or great vessels.194–204 Malperfusion-related cerebral ischemia may be identified by EEG or SSEP, but these signals are susceptible to compromise by electrocautery, deep anesthesia, and hypothermia.205 Similarly, TCD signals are susceptible to radiofrequency, acoustic, and movement artifact. Cerebral oximetry is also used during extracorporeal membrane oxygenation to detect regional deficiencies in brain perfusion associated with carotid cannulation.206
rSo2 Responsiveness to CO2
Induction of anesthesia and its attendant apnea during tracheal intubation often transiently alter the brain oxygen supply-demand relation. Hypnotic agents may transiently suppress cerebral metabolism more than blood flow; resulting relative hyperperfusion leads to an rSo2 increase.207 With normally reactive cerebral arterioles, ventilation disruption and CO2 accumulation during tracheal intubation further increase rSo2 as a result of the increased delivery of hyperoxygenated blood to a metabolically suppressed brain. Under these circumstances, even mild hypercapnia augments cerebral perfusion and oxygenation through local vasodilation.208–211 Several investigators have demonstrated an rSo2 increase (see Figure 16-37) associated with hypercapnia.139,140,150,171
Absence of rSo2 increase with increasing arterial CO2 tension suggests impairment of both CO2 reactivity and cerebral autoregulation. Asymmetry warns of a potential vasculopathy (e.g., intracranial stenosis or silent infarction) and may prompt alterations in anesthetic and perfusion management to maintain cerebral perfusion in both hemispheres.211
Acid-base management during CPB remains controversial, particularly during deep cooling. Some propose that the greater CO2 tension afforded by pH-stat acid-base management results in fewer neurologic complications.212 Vijay et al213 observed that during adult near- normothermic myocardial revascularization, vasopressor-induced perfusion pressure increases alone were sometimes inadequate to correct decreased rSo2 occurring during CPB. In this situation, judiciously applied permissive hypercapnia often was effective in restoring rSo2 to baseline.
Despite these seeming benefits, hypercapnia has potentially deleterious effects. Hypercapnia-induced cardiac output and heart rate also increase myocardial oxygen demand, whereas cerebral vasodilation may exacerbate preexisting intracranial hypertension. Cerebral oximetry provides a convenient method to document appropriate bihemispheric CO2 reactivity. In addition, continuous measurement of brain oxygen saturation permits CO2 titration to achieve optimal tissue perfusion at the lowest risk.214–216
rSo2 as a Transfusion Trigger
Two important determinants of tissue oxygenation are hemoglobin availability and plasma volume.217,218 Madl et al219 examined the relation between hemoglobin and rSo2 in patients with septic shock. If a low hemoglobin (<8.5 mg/dL) was associated with an rSo2 less than the normative range (i.e., <60%), transfusion consistently increased both variables. However, transfusion had no effect on rSo2 values greater than 65%. Blas et al220 described profound desaturation accompanying hemodilution with all other physiologic measures within normal limits. Brain saturation responded immediately to 2 units of packed red cells in this patient with bilateral carotid artery occlusions.
Due to the apparent association between rSo2 and hemoglobin, transient brain oxygen desaturation is to be expected at the onset of CPB because the pump prime solution briefly displaces hemoglobin in the cerebral circulation. Vijay et al221 demonstrated that the magnitude of this transient desaturation was related directly to the volume of crystalloid prime. Use of a blood prime in the arterial limb of the perfusion circuit appears to eliminate the transient rSo2 decline accompanying CPB onset.222 The hemoglobin influence on rSo2 is the basis for use of cerebral oximetry as both a transfusion trigger223 and a strategy to reduce or completely avoid administration of homologous blood.224,225
rSo2 and Blood Volume
Tissue oximetry has been used to visualize the effect of volume expansion on cerebral perfusion during tilt-table diagnostic testing for syncope.226 An rSo2 sensor was placed on the gastrocnemius muscle to measure upright tilt-induced desaturation resulting from lower limb venous pooling. In susceptible patients, extensive pooling resulted in cerebral dysoxygenation and syncope. Crystalloid volume expansion reduced lower limb hemoglobin sequestration and prevented syncope. This same concept may be applied to cardiac surgery. Vasopressor ineffectiveness in the correction of an rSo2 decline may indicate compromised microcirculatory gas exchange because of hypovolemia. In this circumstance, low rSo2 values often respond to volume augmentation.
rSo2 and Autoregulation
Numerous studies have concluded that cerebral autoregulation remains intact during cardiac operations, both before and during CPB. Although this conclusion may be correct for large groups of patients, it does not necessarily apply to each individual. Cerebral oximetry can identify the lower limit of autoregulation, the point at which brain blood flow and tissue oxygenation become pressure dependent.139,227 The independence of MAP and cerebral oxygen saturation establishes intact cerebral autoregulation.228,229
Figure 16-38 illustrates the use of rSo2 measurement in the determination of the lower autoregulatory limit. The rSo2-versus-MAP relation in the top graph depicts intact autoregulation. The rSo2 values remain independent of MAP over a wide pressure range. The bottom graph, generated later the same day in the same operating room by the same surgical team, depicts dysautoregulation because rSo2 declines each time MAP declines to less than 80 mm Hg. Examination of MAP-rSo2 relations from a large series of cardiac operations resulted in two findings.230 First, the lower limit of autoregulation varies widely among patients, from a MAP of less than 40 to more than 100 mm Hg. Second, a substantial proportion of cardiac patients do not, in fact, maintain autoregulation throughout the entirety of the operation. These observations illustrate the potential benefit of continuously monitoring the adequacy of cerebral perfusion during cardiovascular surgery.
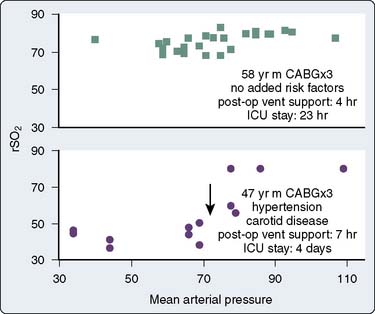
Vasoactive drugs may have distinctly different effects on cerebral and systemic perfusion. These disparate pharmacologic actions further confound cerebral perfusion estimates on the basis of systemic blood pressure. Both vasodilators and vasoconstrictors may disrupt the expected brain blood flow-systemic blood pressure relation. Vasodilator nitrates may increase cerebral rSo2 whereas systemic blood pressure is unchanged or declines.231,232 Conversely, vasoconstrictors may increase cerebral rSo2 only when MAP is below the lower limit of autoregulation.233
rSo2 and Brain Temperature
Temperature has important effects on tissue oxygenation.234 Because standard temperature monitoring during CPB does not accurately characterize the efficacy of brain cooling, cerebral oximetry may facilitate management of hypothermic neuroprotection.235–238 In theory, temperature with CPB and alpha-stat acid-base management results in a linear decrease in cerebral blood flow and an exponential decline in metabolic rate.239 Consequently, predicted “luxury” flow should ensure adequate cerebral oxygenation during cooling. However, Daubeney et al151 demonstrated that other variables were also involved in the maintenance of adequate tissue oxygenation during deep hypothermia in pediatric patients. The rSo2 at a 20°C target cooling temperature varied inversely with the cooling rate by the equation: rSo2 = −20.5 (cooling rate, °C/min) + 97.4. In addition, they found that the rate of desaturation during total circulatory arrest was a function of the nasopharyngeal temperature at arrest onset, described by the equation: desaturation rate = 0.19 (nasopharyngeal temp, °C) − 2.5. At 20°C, the mean desaturation rate was 0.25% min, although decay was not linear. At temperatures slightly greater than 20°C (21°C to 26°C), desaturation rate increased nearly 10-fold (2.0%/min). In normothermic infants, transient disruption of cerebral perfusion resulted in another 10-fold increase (i.e., ≈︀20% min) in the rate of desaturation.240 The desaturation rates in hypothermic pediatric patients are somewhat less than those reported in adults.215,216,238,241
Deep hypothermia may also produce transient cerebral vasoparesis.239,242 Consequently, rewarming may result in desaturation as the temperature-induced increase in cerebral metabolism is unsupported by adequate flow increase. Daubeney et al188 described an inverse relation between rSo2 and nasopharyngeal temperature during rewarming in pediatric patients, given by the equation: rSo2 = −2.9 (nasopharyngeal temp) + 148. Liu et al207 observed similar cerebral desaturation during rewarming in adult cardiac surgery patients. Small perfusion deficits decreased rSo2 as oxygen extraction is increased to meet rising demand. When the oxygen extractive capacity is exceeded, functional compromise will be manifested by EEG or evoked potential abnormalities.243
rSo2 Guides Supplemental Cerebral Perfusion
Several studies have demonstrated that rSo2-guided retrograde cerebral perfusion may extend the “safe time” for hypothermic circulatory arrest during adult aortic arch reconstruction.101,244,245 Blas et al220 reported on the use of cerebral oximetry for detection of a superior vena cava cannula malposition during retrograde cerebral perfusion.
Higami et al246 found rapid desaturation with total circulatory arrest, slow continual desaturation with retrograde cerebral perfusion, and no desaturation with supplemental antegrade cerebral perfusion (Figure 16-39). There was a high incidence of neurologic deficit in patients whose saturation declined more than 30% below the conscious baseline. Subsequently, many studies have found cerebral oximetry to be a useful guide for the management of regional low-flow perfusion and selective antegrade cerebral perfusion.247–259
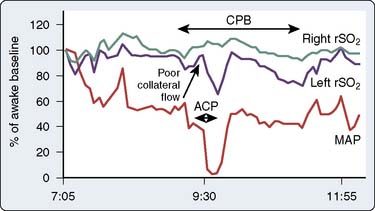
rSo2 Improves Systemic Hypoxemia Detection
The high oxygen demand of the brain means that signs of developing hypoxemia may first appear in regional cerebral measurements. Several reports have noted rSo2 to decline earlier than Spo2 at the onset of hypoxia.260,261 Furthermore, continuous cerebral rSo2 monitoring has provided the first indication of impaired oxygen delivery during nonpulsatile CPB.262,263
rSo2 Facilitates Regional Tissue Hypoxia Detection
In 2004, Edmonds et al264 reported on simultaneous brain and perivertebral rSo2 monitoring during thoracoabdominal aneurysm repair. Desaturation occurring below the level of the aortic cross-clamp was interpreted as hypoperfusion within the extensive vertebrovenous plexus.265 This preliminary observation was subsequently confirmed in a laboratory investigation using human adult-size swine266 and a clinical study in pediatric aortic coarctation repair.267 Now many reports document the value of multisite tissue oximetry.268–276 Hepatic, perirenal, and splanchnic tissue perfusion have been successfully assessed in neonates, whereas limb perfusion monitoring has been achieved in both pediatric and adult cardiac surgery and intensive care patients. Harel et al277 used strain-gauge and radionuclide plethysmography to validate the latter application of tissue oximetry.
rSo2 and Anesthetic Adequacy
Another important determinant of tissue oxygenation is pain-induced stress.278 With inadequate hypnosis or analgesia, pain-induced stress may result in cerebral oxygen consumption exceeding delivery and decreasing rSo2. Hypnosis and analgesia monitoring by EEG and facial electromyogram can facilitate the prompt identification and correction of this source of cerebral dysoxygenation (Box 16-14).
Until recently, the inability to integrate neuromonitoring information from different modalities (Box 16-15) into a unified display has inhibited clinical studies using a multimodality approach in cardiac surgery. As a result, currently only three outcome studies have examined the impact of multimodality neuromonitoring using a combination of EEG, TCD, and cerebral oximetry. The study involving pediatric cardiac patients noted significant reductions in both neurologic complications and hospital cost in the neuromonitored cohort.279 Both adult cardiac surgery studies280,281 found a 2.7-day reduction in length of stay associated with multimodality neuromonitoring. Edmonds’s280 study also noted an 11% reduction in hospital expenses. In addition to the substantial reductions in hospital stay, charges, and neurologic complications, the results suggested possible benefit to other vital organ systems. This finding is not unexpected because the same processes that injure the brain may also injure other organs.131,140 Future studies of neuromonitoring efficacy should not overlook these important accessory benefits. In addition, Lozano and Mossad282 reviewed studies of neuromonitoring during pediatric cardiac surgery and showed that the monitoring was associated with enhanced outcomes (see Box 16-15).
| Modality | Function |
|---|---|
| Electroencephalography | Cortical synaptic activity |
| Brainstem auditory-evoked potentials | Cochlear, auditory nerve, and brainstem auditory pathway function |
| Middle-latency auditory- evoked potentials function | Subcortical-cortical afferent auditory pathway |
| Somatosensory-evoked potentials | Peripheral nerve, spinal cord, and brain somatosensory afferent pathway function |
| Transcranial motor-evoked potentials | Cortical, subcortical, spinal cord, and peripheral nerve efferent motor pathway function |
| Transcranial Doppler ultrasonography | Cerebral blood flow change and emboli detection |
| Tissue oximetry | Regional tissue oxygen balance |
The recent technologic developments address this limitation. New analysis and display systems (Figures 16-40A and B) can integrate multimodality neurophysiologic information, additional physiologic signals from anesthesia or critical care monitors, and information from ventilators, infusion pumps, and so forth into single, unified displays.
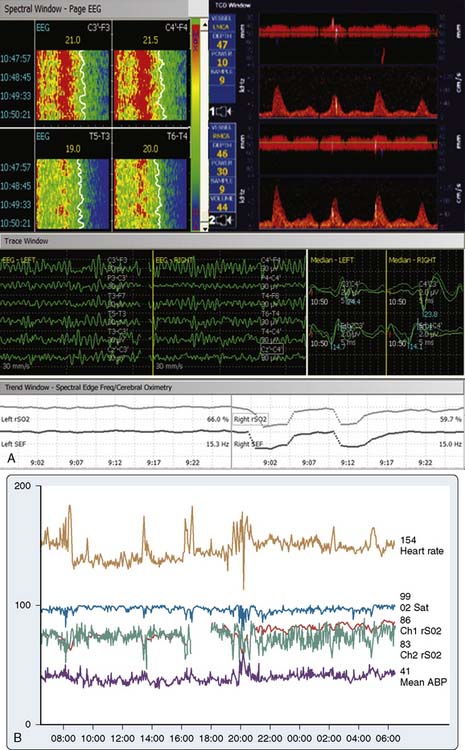
1 Newman M.F., Kirchner J.L., Phillips-Bute B., et al. Longitudinal assessment of neurocognitive function after coronary artery bypass surgery. N Engl J Med. 2001;344:395.
2 Roach G.W., Kanchuger M., Mangano C.M., et al. Adverse cerebral outcomes after coronary bypass surgery. N Engl J Med. 1996;335:1857.
3 Kilo J., Dzerny M., Gorlitzer M., et al. Cardiopulmonary bypass affects cognitive brain function after coronary artery bypass grafting. Ann Thorac Surg. 2001;72:1926.
4 Edmonds H.L.Jr, Rodriguez R.A., Audenaert S.M., et al. The role of neuromonitoring in cardiovascular surgery. J Cardiothorac Vasc Anesth. 1996;10:15.
5 Edmonds H.L.Jr. Detection and treatment of cerebral hypoxia are key to avoiding intraoperative brain injuries. J Clin Monit Comput. 2000;16:69.
6 Theye R.A., Patrick R.T., Kirklin J.W. The electroencephalogram in patients undergoing open intracardiac operations with the aid of extracorporeal circulation. J Thorac Surg. 1957;34:709.
7 Blume W.T., Sharbrough F.W., EEG monitoring during carotid endarterectomy and open heart surgery, ed 4, Niedermeyer E., Lopes Da Silva F., editors. Electroencephalography; 1999. Lippincott Williams & Wilkins. Philadelphia; 797-808
8 Craft R.M., Losasso T.J., Perkins W.J., et al. EEG monitoring or cerebral ischemia during carotid endarterectomy: How much is enough? Anesthesiology. 1994;81(3A):A214. (abstract)
9 Edmonds H.L.Jr, Sehic A., Gruenthal M. Comparison of 2-, 4- and 16-channel EEG for detection of cerebral ischemia. Anesthesiology. 2002;97(3A):A-305. (abstract)
10 Levy W.J. Monitoring of the electroencephalogram during cardiopulmonary bypass. Know when to say when. Anesthesiology. 1992;76:876.
11 Timofeev I., Contreras D., Steriade M. Synaptic responsiveness of cortical and thalamic neurons during various phases of slow sleep oscillation in cat. J Neurophysiol (Lond). 1996;494:265.
12 Stockard J., Bickford R.G., The neurophysiology of anaesthesia; Gordon E., editor; A basis and practice of neuroanaesthesia; 1975. Excerpta Medica: Amsterdam; 3-46
13 Sharbrough F.W., Nonspecific abnormal EEG patterns. ed 4., Niedermeyer E., Lopes da Silva F., editors, Electroencephalography; 1999. Lippincott Williams & Wilkins. Philadelphia; 215-234
14 Goldstein L. Psychotropic drug-induced EEG changes as revealed by the amplitude integration method. Mod Probl Pharmacopsychiatr. 1974;8:131.
15 Prior P.M., Maynard D.E., Sheaff P.C., et al. Monitoring cerebral function: Clinical experience with a new device for continuous recording of electrical activity of the brain. Br Med J. 1971;2:215.
16 Hellström-Westas L., de Vries L.D., Rosén I. An atlas of amplitude-integrated EEGs in the newborn. Boca Raton, FL: Parthenon, 2003.
17 Pronk R.A.F. EEG processing in cardiac surgery. Utrecht: Institute of Medical Physics TNO, 1982.
18 Rampil I. EEG processing and the bispectral index. Anesthesiology. 1998;89:815.
19 Hoymork S.C., Hval K., Jensen E.W., et al. Can the cerebral state monitor replace the bispectral index in monitoring hypnotic effect during propofol/remifentanil anaesthesia? Acta Anaesthesiol Scand. 2007;51:210.
20 Russell I.F. The Narcotrend ‘depth of anaesthesia’ monitor cannot reliably detect consciousness during general anaesthesia: An investigation using the isolated forearm technique. Br J Anaesth. 2006;96:346.
21 Drover D., Ortega H. Patient state index. Best Pract Res Clin Anaesth. 2006;20:121.
22 Viertiö-Oja H., Maja V., Särkelä M., et al. Description of the Entropy™ algorithm as applied in the Datex-Omeda S/5™ Entropy Module. Acta Anaesthesiol Scand. 2004;48:154.
23 Wong C.A., Fragen R.J., Fitzgerald P., et al. A comparison of the SNAP II and BIS XP indices during sevoflurane and nitrous oxide anaesthesia at 1 and 1.5 MAC and at awakening. Br J Anaesth. 2006;97:181.
24 Myles P.S., Leslie K., McNeil J., et al. Bispectral index monitoring to prevent awareness during anaesthesia. The B-Aware randomized controlled trial. Lancet. 2004;363:1757.
25 Punjasawadwong Y., Boonjeungmonkol N., Phongchiewboon A. Bispectral index for improving anaesthetic delivery and postoperative recovery. Cochrane Database Syst Rev. 4, 2007. CD003843
26 Paloheimo M. Quantitative surface electromyography (qEMG): Applications in anaesthesiology and critical care. Acta Anaesthesiol Scand Suppl. 1990;93:1.
27 Joy R.M. Spectral analysis of long EEG samples for comparative purposes. Neuropharmacology. 1971;10:471. (abstract)
28 Myers R.R., Stockard J.J., Fleming N.I., et al. The use of on-line telephonic computer analysis of the EEG in anaesthesia. Br J Anaesth. 1973;45:664.
29 Pichylmayr I., Lips U. EEG monitoring in anesthesiology and intensive care. Neuropsychobiology. 1983;10:239.
30 Fleming R.A., Smith N.T. An inexpensive device for analyzing and monitoring the electroencephalogram. Anesthesiology. 1979;50:456.
31 Isley M.R., Edmonds H.L.Jr, Stecker M. Guidelines for intraoperative neuromonitoring using raw (analog or digital waveforms) and quantitative electroencephalography: A position statement by the American Society of Neurophysiological Monitoring. J Clin Monit Comput. 2009;23:369-390.
32 Van Huffelen A.C. Electroencephalography used in monitoring neural function during surgery. In: Nuwer M.R., editor. Handbook of clinical neurophysiology, vol 8. New York: Elsevier; 2008:128-140. Intraoperative monitoring of neural function
33 Jäntti V., Sloan T.B. EEG and anesthetic effects. In: Nuwer M.R., editor. Handbook of clinical neurophysiology, vol 8. New York: Elsevier; 2008:94-127. Intraoperative monitoring of neural function
34 Gugino L.D., Aglio L.S., Yli-Hankala A. Monitoring the electroencephalogram during bypass procedures. Semin Cardiothorac Vasc Anesth. 2004;8:61.
35 Williams G.D., Ramamoorthy C. Brain monitoring and protection during pediatric cardiac surgery. Semin Cardiothorac Vasc Anesth. 2007;11:23.
36 Alkire M.T. Quantitative EEG correlation with brain glucose metabolic rate during anesthesia in volunteers. Anesthesiology. 1998;89:323.
37 Gusev E.I., Fedin Al, Erokhin O.Y., et al. Compressed spectral analysis of the EEG in patients with acute cerebrovascular disturbance. Neurosci Behav Physiol. 1985;15:144.
38 Oda Y., Tanaka K., Matsuura T., et al. Nitrous oxide induced paradoxical electroencephalographic changes after tracheal intubation during isoflurane and sevoflurane anesthesia. Anesth Analg. 2006;102:1094.
39 Rodriguez R.A., Cornel G., Semelhago L., et al. Cerebral effects in superior vena caval obstruction: The role of brain monitoring. Ann Thorac Surg. 1997;64:1820.
40 Orth V.H., Rehm M., Thiel M., et al. First clinical implications of perioperative red cell volume measurement with a nonradioactive marker. Anesth Analg. 1998;87:1234.
41 Hanel F., von Knobelsdorff G., Werner C., et al. Hypercapnia prevents jugular bulb desaturation during rewarming from hypothermic cardiopulmonary bypass. Anesthesiology. 1998;89:19.
42 Gugino L.D., Chabot R.J., Aglio L.S., et al. QEEG changes during cardiopulmonary bypass: Relationship to postoperative neuropsychological function. Clin Electroencephalogr. 1999;30:53.
43 Croughwell N.D., Newman M.F., Blumenthal J.A., et al. Jugular bulb saturation and cognitive dysfunction after cardiopulmonary bypass. Ann Thorac Surg. 1994;58:1702.
44 Ederberg S., Westerlind A., Houltz E., et al. The effects of propofol on cerebral blood flow velocity and cerebral oxygen extraction during cardiopulmonary bypass. Anesth Analg. 1998;86:1201.
45 BhaskerRao B., VanHimbergen D., Edmonds H.L.Jr, et al. Evidence for improved cerebral function after minimally invasive bypass surgery. J Card Surg. 1998;13:27.
46 Reddy R.V., Moorthy S.S., Dierdorf S.F., et al. Excitatory effects and electroencephalographic correlation of etomidate, thiopental, methohexital and propofol. Anesth Analg. 1993;77:1008.
47 Yli-Hankala A., Vakkuri A., Sarkela M., et al. Epileptiform EEG during induction of anesthesia with sevoflurane mask. Anesthesiology. 1999;91:1596.
48 Kearse L.A.Jr, Koski G., Husain M.V., et al. Epileptiform activity during opioid anesthesia. Electroencephalogr Clin Neurophysiol. 1993;87:374.
49 Bellinger D.C., Wypij D., Kuban K.C., et al. Developmental and neurological status of children at 4 years of age after heart surgery with hypothermic circulatory arrest or low-flow cardiopulmonary bypass. Circulation. 1999;100:526.
50 Martin W.H., Stecker M.M. ASNM position statement: Intraoperative monitoring of auditory-evoked potentials. J Clin Monit Comput. 2008;22:75.
51 Legatt A.D. BAEPs in surgery. In: Nuwer M.R., editor. Handbook of clinical neurophysiology, vol 8. New York: Elsevier; 2008:334-349. Intraoperative monitoring of neural function
52 Rodriguez R.A. Human auditory evoked potentials in the assessment of brain function during major cardiovascular surgery. Semin Cardiothorac Vasc Anesth. 2004;8:85.
53 Thornton C. Evoked potentials in anaesthesia. Eur J Anaesth. 1991;8:89.
54 Kraus N., Smith D.I., Reed N.L. Auditory middle latency responses in children: Effects of age and diagnostic category. Electroencephalogr Clin Neurophysiol. 1985;62:343.
55 Musialowicz T., Niskanen M., Yppärilä-Wolters H., et al. Auditory-evoked potentials in bispectral index-guided anaesthesia for cardiac surgery. Eur J Anaesth. 2007;24:571.
56 Lamas A., Lópex-Herce J., Sancho L., et al. Assessment of the level of sedation in children after cardiac surgery. Ann Thorac Surg. 2009;88:144.
57 Struys M., Jensen E.W., Smith W., et al. Performance of the ARX-derived auditory evoked potential index as an indicator of anesthetic depth. Anesthesiology. 2002;96:803.
58 Bonhomme V., Llabres V., Dewandre P.-Y., et al. Combined use of bispectral index and A-Line autoregressive index to assess the anti-nociceptive component of balanced anesthesia during lumbar arthrodesis. Br J Anaesth. 2006;93:353.
59 Rodriguez R.A., Audenaert S.M., Austin E.H. Auditory evoked responses in children during hypothermic cardiopulmonary bypass. J Clin Neurophysiol. 1995;12:168.
60 Stone J.G., Young W.L., Smith C.R., et al. Do standard monitoring sites reflect true brain temperature when profound hypothermia is rapidly induced and reversed? Anesthesiology. 1995;82:344.
61 Duebener L.F., Hagino I., Sakamoto T., et al. Effects of pH management during deep hypothermic bypass on cerebral microcirculation: Alpha-stat versus pH-stat. Circulation. 106(12 Suppl I), 2002. I–103
62 Toleikis J.R. Intraoperative monitoring using somatosensory evoked potentials: A position statement by the American Society of Neurophysiological Monitoring. J Clin Monit Comput. 2005;19:241.
63 Nuwer M.R., Packwood J.W. Somatosensory evoked potential monitoring with scalp and cervical recording. In: Nuwer M.R., editor. Handbook of clinical neurophysiology, vol 8. New York: Elsevier; 2008:180-189. Intraoperative monitoring of neural function
64 Guérit J.-M. Intraoperative monitoring during carotid endarterectomy. In: Nuwer M.R., editor. Handbook of clinical neurophysiology, vol 8. New York: Elsevier; 2008:776-790. Intraoperative monitoring of neural function
65 Guérit J.-M. Intraoperative monitoring during cardiac surgery. In: Nuwer M.R., editor. Handbook of clinical neurophysiology, vol 8. New York: Elsevier; 2008:829-839. Intraoperative monitoring of neural function
66 Stecker M.M. Evoked potentials during cardiac and major vascular operations. Semin Cardiothorac Vasc Anesth. 2004;8:101.
67 Cassells C.D., Lindsey R.W., Ebersole J., et al. Ulnar neuropathy after median sternotomy. Clin Orthop Relat Res. 1993;291:259.
68 Seal D., Galaton J., Coupland S.G., et al. Somatosensory evoked potential monitoring during cardiac surgery: An examination of brachial plexus dysfunction. J Cardiothorac Vasc Anesth. 1997;11:187.
69 Lorenzini N.A., Poterack K.A. Somatosensory evoked potentials are not a sensitive indicator of potential positioning injury in the prone patient. J Clin Monit Comput. 1996;12:171.
70 Ostry S., Stejskal L., Kramer F., et al. Hypercapnia impact on vascular and neuronal reactivity. Zent Neurochir. 2007;68:59.
71 Astarci P., Guérit J-M, Robert A., et al. Stump pressure and somatosensory evoked potentials for predicting the use of shunt during carotid surgery. Ann Vasc Surg. 2007;21:312.
72 Moritz S., Kasprzak P., Arit M., et al. A comparison of transcranial Doppler sonography, near-infrared spectroscopy, stump pressure and somatosensory evoked potentials. Anesthesiology. 2007;107:563.
73 Guérit J.M., Verhelst R., Rubay J., et al. The use of somatosensory evoked potentials to determine the optimal degree of hypothermia during circulatory arrest. J Card Surg. 1994;9:596.
74 Journee H.L. Motor EP physiology, risks and specific anesthetic effects. In: Nuwer M.R., editor. Handbook of clinical neurophysiology, vol 8. New York: Elsevier; 2008:218-234. Intraoperative monitoring of neural function
75 Deletis V., Sala F. Corticospinal tract monitoring with D- and I-waves from the spinal cord and muscle MEPs from limb muscles. In: Nuwer M.R., editor. Handbook of clinical neurophysiology, vol 8. New York: Elsevier; 2008:235-251. Intraoperative monitoring of neural function
76 Burke D. Recording MEPs to transcranial electrical stimulation and SEPs to peripheral nerve stimulation simultaneously from the spinal cord. In: Nuwer M.R., editor. Handbook of clinical neurophysiology, vol 8. New York: Elsevier; 2008:252-259. Intraoperative monitoring of neural function
77 Mendiratta A., Emerson R.G. Transcranial electrical MEP with muscle recording. In: Nuwer M.R., editor. Handbook of clinical neurophysiology, vol 8. New York: Elsevier; 2008:260-272. Intraoperative monitoring of neural function
78 Sloan T.B. Electrophysiologic monitoring during surgery to repair the thoracoabdominal aorta. Semin Cardiothorac Vasc Anesth. 2004;8:113.
79 MacDonald D.B., Dong C.C.J. Spinal cord monitoring during descending aortic procedures. In: Nuwer M.R., editor. Handbook of clinical neurophysiology, vol 8. New York: Elsevier; 2008:815-828. Intraoperative monitoring of neural function
80 Webb T.H., Williams G.M. Thoracoabdominal aneurysm repair. Cardiovasc Surg. 1999;7:573.
81 Chen Z. The effects of isoflurane and propofol on intraoperative neurophysiologic monitoring during spinal surgery. J Clin Monit Comput. 2004;18:303-308.
82 Kawanishi Y., Munakata H., Matsumori M., et al. Usefulness of transcranial motor evoked potentials during thoracoabdominal aortic surgery. Ann Thorac Surg. 2007;83:456.
83 Sloan T.B., Jäntti V. Anesthetic effects on evoked potentials. In: Nuwer M.R., editor. Handbook of clinical neurophysiology, vol 8. New York: Elsevier; 2008:94-126. Intraoperative monitoring of neural function
84 Etz C.D., Halstead J.C., Spielvogel D., et al. Thoracic and thoracoabdominal aneurysm repair: Is reimplantation of spinal cord arteries a waste of time? Ann Thorac Surg. 2006;82:1670.
85 Georgiadis D., Siebler M. Detection of microembolic signals with transcranial Doppler ultrasound. Front Neurol Neurosci. 2006;21:194-205.
86 Nitzöld A., Khattab A., Eggers J. Microemboli in aortic valve replacement. Exp Rev Cardiovasc Therap. 2006;4:853.
87 Zuj K.A., Greaves D.K., Hughson R.L. WISE-2005: Reduced cerebral blood flow velocity with nitroglycerin—comparison with common carotid artery blood flow. J Gravit Physiol. 2007;14:P65.
88 Rudolph J.L., Sorond F.A., Pochay V.E., et al. Cerebral hemodynamics during coronary artery bypass graft surgery: The effect of carotid stenosis. Ultrasound Med Biol. 2009;35:1235.
89 Polito A., Ricci Z., Di Chiara L., et al. Cerebral blood flow during cardiopulmonary bypass in pediatric cardiac surgery: The role of transcranial Doppler—a systematic review of the literature. Cardiovasc Ultrasound. 2006;4:47.
90 Singer I., Edmonds H.L.Jr. Changes in cerebral perfusion during third-generation implantable cardioverter-defibrillator testing. Am Heart J. 1994;127:1052.
91 Edmonds H.L.Jr, Singer I., Sehic A., et al. Multimodality neuromonitoring for neurocardiology. J Interv Cardiol. 1998;11:197.
92 Edmonds H.L.Jr. Protective effect of neuromonitoring during cardiac surgery. Ann N Y Acad Sci. 2005;1053:12.
93 McCarthy R.J., McCabe A.E., Walker R., et al. The value of transcranial Doppler in predicting cerebral ischaemia during carotid endarterectomy. Eur J Vasc Endovasc Surg. 2001;21:408.
94 Chuang W.C., Short J.H., McKinney A.M., et al. Reversible left hemisphere ischemia secondary to carotid compression in Eagle Syndrome: Surgical and CT angiographic correlation. Am J Neuroradiol. 2007;28:143.
95 Khoynezhad A., Kruse M.J., Donayre C.E., et al. Use of transcranial Doppler ultrasound in endovascular repair of a Type B aortic dissection. Ann Thorac Surg. 2008;86:289.
96 Petrica L., Petrica M., Vlad A., et al. Cerebrovascular reactivity is impaired in patients with non-insulin-dependent diabetes mellitus and microangiopathy. Wien Klin Wochenschrift. 2007;119:365.
97 Panerai R. Transcranial Doppler for evaluation of cerebral autoregulation. Clin Autonom Res. 2009;19:197.
98 Borger M.A., Taylor R.L., Weisel R.D., et al. Decreased cerebral emboli during distal aortic arch cannulation: A randomized clinical trial. J Thorac Cardiovasc Surg. 1999;118:740.
99 Mullges W., Franke D., Reents W., et al. Brain microembolic counts during extracorporeal circulation depend on aortic cannula position. Ultrasound Med Biol. 2001;27:933.
100 Rodriguez R.A., Cornel G., Semelhago L., et al. Cerebral effects in superior vena caval cannula obstruction: The role of brain monitoring. Ann Thorac Surg. 1997;64:1820.
101 Ganzel B.L., Edmonds H.L.Jr, Pank J.R., et al. Neurophysiological monitoring to assure delivery of retrograde cerebral perfusion. J Thorac Cardiovasc Surg. 1997;113:748.
102 Gugino L.D., Aglio L.S., Edmonds H.L.Jr. Neurophysiological monitoring in vascular surgery. Bailliere’s Clin Anaesth. 2000;14:17.
103 Jones T.J., Deal D.D., Vernon J.C., et al. How effective are cardiopulmonary bypass circuits at removing gaseous microemboli? J Extra Corpor Technol. 2002;34:151.
104 Yeh T.J.Jr, Austin E.H.III, Sehic A., et al. Role of neuromonitoring in the detection and correction of cerebral air embolism. J Thorac Cardiovasc Surg. 2003;126:589.
105 Edmonds H.L.Jr. Emboli and renal dysfunction in CABG patients. J Cardiothorac Vasc Anesth. 2004;18:545. (editorial)
106 Shen Q., Stuart J., Venkatesh B., et al. Interobserver variability of the transcranial Doppler ultrasound technique. Impact of lack of practice on the accuracy of measurement. J Clin Monit Comput. 1999;15:179.
107. Edmonds H.L.Jr, Isley M.R., Sloan T., et al. American Society of Neurophysiologic Monitoring (ASNM) & American Society of Neuroimaging (ASN) joint guidelines for transcranial Doppler (TCD) ultrasonic monitoring. J Neuroimaging. 2010:1552-6569. (in press). DOI:10.1111j 00471
108 Doblar D.D. Intraoperative transcranial ultrasonic monitoring for cardiac and vascular surgery. Semin Cardiothorac Vasc Anesth. 2010;8:127.
109 Edmonds H.L.Jr. Monitoring of cerebral perfusion with transcranial Doppler ultrasound. In: Nuwer M.R., editor. Handbook of clinical neurophysiology, vol 8. New York: Elsevier; 2008:909-923. Intraoperative monitoring of neural function
110 Estrera A.L., Garami Z., Miller C.C.III, et al. Cerebral monitoring with transcranial Doppler ultrasonography improves neurologic outcome during repairs of acute type A aortic dissection. J Thorac Cardiovasc Surg. 2005;129:277.
111 Moppett I.K., Sherman R.W., Wild M.J., et al. Effects of norepinephrine and glyceryl trinitrate on cerebral haemodynamics: Transcranial Doppler study in health volunteers. Br J Anaesth. 2008;100:240.
112 Bhatia A., Gupta A.K. Neuromonitoring in the intensive care unit. II. Cerebral oxygenation monitoring and microdialysis. Intensive Care Med. 2007;19:97.
113 Chieregato A., Calzolari F., Frasforini G., et al. Normal jugular bulb saturation. J Neurol Neurosurg Psychiatry. 2003;74:784.
114 Mutch W.A.C., Ryner L.N., Kozlowski P., et al. Cerebral hypoxia during cardiopulmonary bypass: A magnetic resonance imaging study. Ann Thorac Surg. 1997;64:695.
115 deVries J.W., Visser G.H., Bakker P.F.A. Neuromonitoring in defibrillation threshold testing. A comparison between near-infrared spectroscopy and jugular bulb oximetry. J Clin Monit Comput. 1997;13:303.
116 Vallet B. Physiologic transfusion triggers. Best Pract Res Clin Anaesth. 2007;21:173.
117 Shaaban A.M., Harmer M., Kirkham F. Cardiopulmonary bypass temperature and brain function. Anaesth. 2005;60:365.
118 Diephuis J.C., Moons K.G., Nierich A.N., et al. Jugular bulb desaturation during coronary artery surgery: A comparison of off-pump and on-pump procedures. Br J Anaesth. 2005;94:715.
119 Ferari M., Mottola L., Quaresima V. Principles, techniques and limitations of near-infrared spectroscopy. Can J Appl Physiol. 2004;29:463.
120 Kurth C.D., Steven J.M., Benaron D., et al. Near-infrared monitoring of the cerebral circulation. J Clin Monit Comput. 1993;9:163.
121 Stingele R., Schnippering H., Keller E., et al. Transcranial oximetry using fast near-infrared spectroscopy can detect failure of collateral blood supply in humans. Comp Biochem Physiol A Mol Integr Physiol. 2003;134:534.
122 Hirsch J.C., Charpie J.R., Ohye R.G., et al. Near-infrared spectroscopy: What we know and what we need to know—a systematic review of the congenital heart disease literature. J Thorac Caradiovasc Surg. 2009;137:154.
123 Chelette T.L., Albery W.B., Esken R.L., et al. Female exposure to high G: Performance of simulated flight after 24 hours of sleep deprivation. Aviat Space Environ Med. 1998;69:862.
124 Mortiz S., Kasprzak P., Arlt M., et al. Accuracy of cerebral monitoring in detecting cerebral ischemia during carotid endarterectomy. Anesthesiology. 2007;107:563.
125 Griepp R.B. Panel discussion: Session II—aortic arch. Ann Thorac Surg. 2007;83:S824.
126 Wernovsky G., Ghanayem N., Ohye R.C., et al. Hypoplastic left heart syndrome: Consensus and controversies in 2007. Cardiol Young. 2007;17:75.
127 Goldman S.M., Sutter F.P., Wertan M.A.C., et al. Outcome improvement and cost reduction in an increasingly morbid cardiac surgery population. Semin Cardiothorac Vasc Anesth. 2006;10:171.
128 Murkin J.M. NIRS: A standard of care for CPB vs. an evolving standard for selective cerebral perfusion? J Extra Corpor Technol. 2009;41:P11.
129 Casati A., Fanelli G., Pietropaoli P., et al. Continuous monitoring of cerebral oxygen saturation in elderly patients undergoing major abdominal surgery minimizes brain exposure to potential hypoxia. Anesth Analg. 2005;101:740.
130 Baker R.A., Knight J.L. The OXICAB Trial: Cerebral oximetry in adult cardiac surgical patients. J Extra Corpor Technol. 2006;8:77. (abstract)
131 Murkin J.M., Adams S.J., Novick R.J., et al. Monitoring brain oxygen saturation during coronary bypass surgery: A randomized, prospective study. Anesth Analg. 2007;104:51.
132 Schön J., Serien V., Hanke T., et al. Cerebral oxygen saturation monitoring in on-pump cardiac surgery—a 1 year experience. Appl Cardiopulm Pathophysiol. 2009;13:243.
133 Heringlake M., Serien V., Heinze H., et al. Cerebral oxygenation monitoring in patients undergoing deep hypothermic circulatory arrest for cardiothoracic surgery. Appl Cardiopulm Pathophysiol. 2007;11:45.
134 Hong S.W., Shim J.K., Choi Y.S., et al. Prediction of cognitive dysfunction and patients’ outcome following valvular heart surgery and the role of cerebral oximetry. Eur J Cardiothorac Surg. 2008;33:560.
135 Schön J., Serien V., Heinze H., et al. Association between cerebral desaturation and an increased risk of stroke in patients undergoing deep hypothermic circulatory arrest for cardiothoracic surgery. Appl Cardiopulm Pathphysiol. 2009;13:201.
136 Slater J.P., Guarino T., Stack J., et al. Cerebral oxygen desaturation predicts cognitive decline and longer hospital stay after cardiac surgery. Ann Thorac Surg. 2009;87:36.
137 Pattinson K.T.S., Imray C.H.E., Wright A.D. What does cerebral oximetry measure? Br J Anaesth. 2005;94:863.
138 Davies L.K., Janelle G.M. Con: All cardiac surgical patients should have intraoperative cerebral oxygenation monitoring. J Cardiothorac Vasc Anesth. 2006;20:450.
139 Edmonds H.L.Jr, Ganzel B.L., Austin E.H.3rd. Cerebral oximetry for cardiac and vascular surgery. Semin Cardiothorac Vasc Anesth. 2004;8:147.
140 Murkin J.M., Arango M. Near-infrared spectroscopy as an index of brain and tissue oxygenation. Br J Anaesth. 2009;103(BJA/PGA Suppl):i3.
141 Fischer G.W. Recent advances in application of cerebral oximetry in adult cardiovascular surgery. Semin Cardiothorac Vasc Anesth. 2008;12:60.
142 MacLeod D.B., Ikeda K., Keifer J., et al. Validation of the CAS adult cerebral oximeter during hypoxia in healthy volunteers. Anesth Analg. 2006;102:S162. (abstract)
143 MacLeod D.B., Ideda K., Vacchiano C. Simultaneous comparison of FORE-SIGHT & INVOS cerebral oximeters to jugular bulb and arterial co-oximetry measures in healthy volunteers. Anesth Analg. 2009;108:SCA56. (abstract)
144 MacLeod D.B., Ikeda K., Vacchiano C. Validation of the Nonin’s dual emitter cerebral oximeter during oxygen desaturation in healthy adults. Anesthesiology. 2009;111:A1021. (abstract)
145 Gagnon R.E., Macnab A.J., Gagnon F.A., et al. Comparison of two spatially resolved NIRS oxygenation indices. J Clin Monit Comput. 2002;17:385.
146 de Letter J., Sie H.T., Moll F., et al. Transcranial cerebral oximetry during carotid endarterectomy: Agreement between frontal and lateral probe measurements as compared with an electroencephalogram. Cardiovasc Surg. 1998;6:373.
147 Gopinath S.P., Robertson C.S., Grossman R.G., et al. Near-infrared spectroscopic localization of intracranial hematomas. J Neurosurg. 1993;79:43.
148 Sehic A., Thomas M.H. Cerebral oximetry during carotid endarterectomy: Signal failure resulting from large frontal sinus defect. J Cardiothorac Vasc Anesth. 2000;13:444.
149 Pigula F.A., Siewers R.D., Nemoto E. Hypothermic cardiopulmonary bypass alters oxygen/glucose uptake in the pediatric brain. J Thorac Cardiovasc Surg. 2001;121:366.
150 Kim M.B., Ward D.S., Cartwright C.R. Estimation of jugular venous O2 saturation from cerebral oximetry or arterial O2 saturation during isocapnic hypoxia. J Clin Monit. 2000;16:191.
151 Daubeney P.E., Pilkington S.N., Janke E. Cerebral oxygenation measured by near-infrared spectroscopy: Comparison with jugular bulb oximetry. Ann Thorac Surg. 1996;61:930.
152 Holzschuh M., Woertgen C., Metz C. Dynamic changes of cerebral oxygenation measured by brain tissue oxygen pressure and near-infrared spectroscopy. Neurol Res. 1997;19:246.
153 Brawanski A., Faltermeier R., Rothoerl R.D. Comparison of near-infrared spectroscopy and tissue Po2 time series in patients after head injury and aneurysmal subarachnoid hemorrhage. J Cereb Blood Flow Metab. 2002;22:605.
154 Muehlschlegel S., Lobato E.G. Con: All cardiac surgical patients should have intraoperative cerebral oxygenation monitoring. J Cardiothorac Vasc Anesth. 2006;20:613.
155 Edmonds H.L.Jr. Pro: All cardiac surgical patients should have intraoperative cerebral oxygenation monitoring. J Cardiothorac Vasc Anesth. 2006;20:445.
156 Hoffman G.M. Pro: Near-infrared spectroscopy should be used for all cardiopulmonary bypass. J Cardiothorac Vasc Anesth. 2006;20:606.
157 Moller J.T., Johannessen N.W., Espersen K., et al. Randomized evaluation of pulse oximetry in 20,802 patients. II. Perioperative events and postoperative complications. Anesthesiology. 1993;78:445.
158 Eichhorn J.H. Pulse oximetry as a standard of practice in anesthesia. Anesthesiology. 1993;78:423. (editorial)
159 Vohra H.A., Modi A., Ohri S.K. Does use of intra-operative cerebral regional oxygen saturation monitoring during cardiac surgery lead to improved clinical outcomes? Interact Cardiovasc Thorac Surg. 2009;9:318.
160 Kishi K., Kawaguchi M., Yoshitani K. Influence of patient variables and sensor location on regional cerebral oxygen saturation measured by INVOS 4100 near-infrared spectrometer. J Neurosurg Anesth. 2003;15:302.
161 Cho H., Nemoto E., Yonas H. Cerebral monitoring by means of oximetry and somatosensory evoked potentials during carotid endarterectomy. J Neurosurg. 1998;89:533.
162 Monk T.G., Reno K.A., Olsen B.S., et al. Postoperative cognitive dysfunction is associated with cerebral oxygen desaturations. Anesthesiology. 2000;93:A167. (abstract)
163 Bhasker Rao B., Van Himbergen D., Jaber S., et al. Evidence for improved cerebral function after minimally invasive bypass surgery. J Cardiac Surg. 1998;13:27.
164 Yao F.S.F., Tseng C.C., Trifiletti R.R., et al. Low preoperative cerebral oxygen saturation is associated with postoperative frontal lobe and cognitive dysfunction and prolonged ICU and hospital stays. Anesth Analg. 2000;90:SCA30. (abstract)
165 Edmonds H.L.Jr, Austin E.H.3rd, Seremet V., et al. Cost-benefit analysis of neuromonitoring for pediatric cardiac surgery. Anesth Analg. 1997;84:SCA22. (abstract)
166 Singer I., Dawn B., Edmonds H.L.Jr. Syncope is predicted by neuromonitoring in patients with ICDs. PACE Pacing Clin Electrocardiol. 1998;21(pt II):216.
167 Rodriguez-Nuñez A., Couceiro J., Alonso C. Cerebral oxygenation in children with syncope during head-upright tilt test. Pediatr Cardiol. 1997;18:406.
168 Tripp L.D., Chelette T., Savul S. Female exposure to high G: Effects of simulated combat sorties on cerebral and arterial O2 saturation. Aviat Space Environ Med. 1998;69:869.
169 Roberts K.W., Crnkowic A.P., Linneman L.J. Near-infrared spectroscopy detects critical cerebral hypoxia during carotid endarterectomy in awake patients. Anesthesiology. 1998;89(3A):A934. (abstract)
170 Samra S.K., Dy E.A., Welch K. Evaluation of a cerebral oximeter as a monitor of cerebral ischemia during carotid endarterectomy. Anesthesiology. 2000;93:964.
171 Denault A., Deschamps A., Murkin J.M. A proposed algorithm for the intraoperative use of cerebral near-infrared spectroscopy. Semin Cardiothorac Vasc Anesth. 2007;11:274.
172 Hall R.A., Fordyce D.J., Lee M.E., et al. Brain SPECT imaging and neuropsychological testing in coronary artery bypass patients. Ann Thorac Surg. 1999;68:2082.
173 Nakamura Y., Kawachi K., Imagawa H., et al. The prevalence and severity of cerebrovascular disease in patients undergoing cardiovascular surgery. Ann Thorac Cardiovasc Surg. 2004;10:81.
174 Hadolt I., Litscher G. Noninvasive assessment of cerebral oxygenation during high altitude trekking in the Nepal Himalayas (2850-5600 m). Neurol Res. 2003;25:183.
175 Madsen P.L., Nielsen H.B., Christiansen P. Well-being and cerebral oxygen saturation during acute heart failure in humans. Clin Physiol. 2000;20:158.
176 Paquet C., Deschamps A., Denault A.Y., et al. Baseline regional cerebral oxygen saturation correlates with left ventricular systolic and diastolic function. J Cardiothorac Vasc Anesth. 2008;22:840.
177 Skhirtladze K., Birkenberg B., Mora B., et al. Cerebral desaturation during cardiac arrest: Its relation to arrest duration and left ventricular pump function. Crit Care Med. 2009;37:471.
178 Fenton K.N., Freeman K., Glogowski K., et al. The significance of baseline cerebral oxygen saturation in children undergoing congenital heart surgery. Am J Surg. 2005;190:260.
179 Konishi A., Kikuchi K. Significance of regional cerebral oxygen saturation (rSo2) during open heart surgery. J Clin Anesth Jpn. 1995;19:1759.
180 Nemoto E., Yonas H., Kassam A. Clinical experience with cerebral oximetry in stroke and cardiac arrest. Crit Care Med. 2000;28:1052.
181 Sehic A., Thomas M.H. Cerebral oximetry during carotid endarterectomy: Signal failure resulting from large frontal sinus defect. J Cardiothorac Vasc Anesth. 2000;13:244.
182 Bar-Yosef S., Sanders E.G., Grocott H.P. Asymmetric cerebral near-infrared oximetric measurements during cardiac surgery. J Cardiothorac Vasc Anesth. 2003;17:773.
183 Fuchs G., Schwarz G., Kulier A. The influence of positioning on spectroscopic measurements of brain oxygenation. J Neurosurg Anesthesiol. 2000;12:75.
184 Boldrey E., Maass L., Miller E.R. Role of atlantoid compression in etiology of internal carotid thrombosis. J Neurosurg. 1956;13:127.
185 Hardesty W.H., Roberts S., Toole J.F. Studies of carotid artery blood flow in man. N Engl J Med. 1960;263:944.
186 Toole J.F., Tucker S.H. Influence of head position upon cerebral circulation. Arch Neurol. 1960;2:616.
187 Lanier W.L. Cerebral perfusion: Err on the side of caution. Anesthesia Patient Safety Foundation Newsletter. 2009;24:1.
188 Daubeney P.E.F., Smith D.C., Pilkington S.N. Cerebral oxygenation during paediatric cardiac surgery: Identification of vulnerable periods using near-infrared spectroscopy. Eur J Cardiothorac Surg. 1998;13:370.
189 Aavramides E.J., Murkin J.M. The effect of surgical dislocation of the heart on cerebral blood flow in the presence of a single, two-state venous cannula during cardiopulmonary bypass. Can J Anaesth. 1996;43:A36. (abstract)
190 Paton B., Pearcy W.C., Swan H. The importance of the electroencephalogram during cardiac surgery with particular reference to superior vena caval obstruction. Surg Gynecol Obstet. 1960;111:197.
191 Sakamoto T., Duebener L.F., Laussen P.C., et al. Cerebral ischemia caused by obstructed superior vena cava cannula is detected by near-infrared spectroscopy. J Cardiothorac Vasc Anesth. 2004;18:293.
192 Han S-H, Kim C-S, Lim C., et al. Obstruction of the superior vena cava cannula detected by desaturation of the cerebral oximeter. J Cardiothorac Vasc Anesth. 2005;19:420.
193 Gottlieb E.A., Frazer C.D.Jr, Andropoulos D.B., et al. Bilateral monitoring of cerebral oxygen saturation results in recognition of aortic cannula malposition during pediatric congenital heart surgery. Paediatr Anaesth. 2006;16:787.
194 Scholl F.G., Webb D., Christian K., et al. Rapid diagnosis of cannula migration by cerebral oximetry in neonatal arch repair. Ann Thorac Surg. 2006;82:325.
195 Tirotta C.F. Near-infrared spectroscopy for real-time cerebral/somatic oxygen monitoring. Pediatr Anesth. 2006;19:4.
196 Fukada J., Morishita K., Kawaharada N. Isolated cerebral perfusion for intraoperative cerebral malperfusion in type A aortic dissection. Ann Thorac Surg. 2003;75:266.
197 Joshi R.K., Motta P., Horibe M., et al. Monitoring cerebral oxygenation in a pediatric patient undergoing surgery for vascular ring. Paediatr Anaesth. 2006;16:178.
198 Polito A., Ricci Z., DiChiara L., et al. Bilateral cerebral near-infrared spectroscopy monitoring during surgery for neonatal coarctation of the aorta. Paediatr Anaesth. 2007;17:906.
199 Schwartz J.M., Vricella L.A., Jeffries M.A., et al. Cerebral oximetry guides treatment during Blalock-Taussig shunt procedure. J Cardiothorac Vasc Anesth. 2007;22:95.
200 Farouk A., Karimi M., Henderson M., et al. Cerebral regional oxygenation during aortic coarctation repair in pediatric population. Eur J Cardiothorac Surg. 2008;3:26.
201 Sakaguchi G., Komiya T., Tamura N., et al. Cerebral malperfusion in acute type A dissection: Direct innominate artery cannulation. J Thorac Cardiovasc Surg. 2005;129:1190.
202 Totaro P., Argano V. Innovative technique to treat acute cerebral and peripheral malperfusion during type A aortic dissection repair. Interact Cardiovasc Thorac Surg. 2008;7:133.
203 Khaladj N., Shrestha M., Peterss S., et al. Ascending aortic cannulation in acute aortic dissection type A: the Hannover experience. Eur J Cardiothorac Surg. 2008;34:792.
204 Yamashiro S., Kuniyoski Y., Arakaki K., et al. Intraoperative retrograde type I aortic dissection in a patient with chronic type IIIb dissecting aneurysm. Interact Cardiovasc Thorac Surg. 2009;8:283.
205 Borst H.C., Laas J., Heinemann M. Type A aortic dissection: Diagnosis and management of malperfusion phenomena. Semin Thorac Cardiovasc Surg. 1991;3:238.
206 DuPlessis A.J. Near-infrared spectroscopy for the in vivo study of cerebral hemodynamics and oxygenation. Curr Opin Pediatr. 1995;7:632-639.
207 Liu R., Sun D., Hang Y., et al. Evaluation of cerebral oxygen balance by cerebral oximeter and transcranial Doppler during hypothermic cardiopulmonary bypass. Anesthesiology. 1998;89:A309. (abstract)
208 Kontos H. Regulation of cerebral circulation. Ann Rev Physiol. 1989;43:397.
209 Mandai K., Seuyoshi K., Fukunaga R., et al. Evaluation of cerebral vasoreactivity by three-dimensional time-of-flight magnetic resonance angiography. Stroke. 1994;25:1897.
210 Hosada K. Comparison of conventional region of interest and statistical mapping method in brain single-photon emission computed tomography for prediction of hyperperfusion after carotid endarterectomy. Neurosurgery. 2005;57:32.
211 Last D., de Bazelaire C., Alsop D.C., et al. Global and regional effects of Type 2 diabetes on brain tissue volumes and cerebral vasoreactivity. Diabetes Care. 2007;30:1193.
212 Du Plessis A.J., Jonas R.A., Wypij D. Perioperative effects of alpha-stat versus pH-stat strategies for deep hypothermic cardiopulmonary bypass in infants. J Thorac Cardiovasc Surg. 1997;114:991.
213 Vijay V., McCusker K., Stasko A., et al. Cerebral oximetry-directed permissive hypercapnia enhances cerebral perfusion during CPB for heart failure surgery. Heart Surg Forum. 2003;6:205.
214 Hoffman G.M. Neurologic monitoring on cardiopulmonary bypass: What are we obligated to do? Ann Thorac Surg. 2006;81:S2373.
215 Baraka A., Naufal M., El-Khatib M. Cerebral oximetry during deep hypothermic circulatory arrest. J Cardiothorac Vasc Anesth. 2007;22:173.
216 Tobias J.D., Russo P., Russo J. Changes in near-infrared spectroscopy during deep hypothermic circulatory arrest. Ann Card Anaesth. 2009;12:17.
217 Gosain A., Rabin J., Reymond J.P. Tissue oxygen tension and other indicators of blood loss or organ perfusion during graded hemorrhage. Surgery. 1991;109:523.
218 Arkilic C.F., Akça O., Taguchi M. Temperature monitoring and management during neuraxial anesthesia: An observational study. Anesth Analg. 2000;91:662.
219 Madl C., Eisenhuber E., Kramer L., et al. Impact of different hemoglobin levels on regional cerebral oxygen saturation, cerebral extraction of oxygen and sensory evoked potentials in septic shock. Crit Care Med. 1997;25(Suppl):4.
220 Blas M., Sulek C., Martin T. Use of near-infrared spectroscopy to monitor cerebral oxygenation during coronary artery bypass surgery in a patient with bilateral internal carotid artery occlusion. J Cardiothorac Vasc Anesth. 1999;6:732.
221 Vijay V., McCusker K., Stasko A., et al. Cerebral oximetry-based comparison of cerebral perfusion with standard versus condensed extracorporeal circuits in adult cardiac surgery. Heart Surg Forum. 2003;6:201.
222 McCusker K., Chalafant A., de Foe G., et al. Influence of hematocrit and pump prime on cerebral oxygen saturation in on-pump revascularization. Perfusion. 2006;21:149.
223 Torella F., Haynes S.L., McCollum C.N. Cerebral and peripheral oxygen saturation during red cell transfusion. J Surg Res. 2003;110:217.
224 Miyhaji K., Kohira S., Miyamoto T., et al. Pediatric cardiac surgery without homologous blood transfusion, using a miniaturized bypass system in infants with lower body weight. J Thorac Cardiovasc Surg. 2007;134:284.
225 Ging A.L., St. Onge J.R., Fitgerald D.C., et al. Bloodless cardiac surgery and the pediatric patient: A case study. Perfusion. 2008;23:131.
226 Villafane J., Edmonds H.L.Jr. Volume expansion prevents tilt-induced syncope. Cardiol Young. 2001;11(Suppl 1):1168. (abstract)
227 Olsen K.S., Svendsen B., Larsen F.S. Validation of transcranial near-infrared spectroscopy for evaluation of cerebral blood flow autoregulation. J Neurosurg Anesthesiol. 1996;8:280.
228 Jalowiecki P., Plóro A., Dzlurdzlk P. Regional cerebral oxygenation monitoring in children undergoing elective scoliosis surgery with controlled urapidil-induced hypotension. Med Sci Monit. 1998;4:987.
229 Brady K.M., Lee J.K., Kibler K.K., et al. Continuous time-domain analysis of cerebrovascular autoregulation using near-infrared spectroscopy. Stroke. 2007;38:2818.
230 Edmonds H.L.Jr, Thomas M.H., Ganzel B.L., et al. Effect of volatile anesthetics on cerebral autoregulation during cardiopulmonary bypass. Anesthesiology. 2001;95:A306. (abstract)
231 Aron J.H., Fink G.W., Swartz M.F., et al. Cerebral oxygen desaturation after cardiopulmonary bypass in a patient with Raynaud’s phenomenon detected by near-infrared cerebral oximetry. Anesth Analg. 2007;104:1034.
232 Piquette D., Deschamps A., Bélisle S., et al. Effect of intravenous nitroglycerin on cerebral saturation in high-risk cardiac surgery. Can J Anesth. 2007;54:718.
233 Yao F-SF, Ho C-YA, Tseng C-CA, et al. The divergent effects of phenylephrine on cerebral oxygen saturation. Anesthesiology. 2002;96:A157. (abstract)
234 Plattner O., Semsroth M., Sessler D.I. Lack of nonshivering thermogenesis in infants anesthetized with fentanyl and propofol. Anesthesiology. 1997;86:772.
235 Kern F.H., Jonas R.A., Mayer J.E. Temperature monitoring during CPB in infants: Does it predict efficient brain cooling? Ann Thorac Surg. 1992;54:749.
236 Wardle S.P., Yoxall C.W., Weindling A.M. Cerebral oxygenation during cardiopulmonary bypass. Arch Dis Child. 1998;78:26.
237 Baraka A., Naufal M., El-Khatib M. Correlation between cerebral and mixed venous oxygen saturation during moderate versus tepid hypothermic hemodiluted cardiopulmonary bypass. J Cardiothorac Vasc Anesth. 2006;20:819.
238 Leyvi G., Bello R., Wasnick J., et al. Assessment of cerebral oxygen balance during deep hypothermic circulatory arrest by continuous jugular bulb venous saturation and near-infrared spectroscopy. J Cardiothorac Vasc Anesth. 2006;20:826.
239 Greeley W.J., Kern F.H., Mault J.R. Mechanisms of injury and methods of protection of the brain during cardiac surgery in neonates and infants. Cardiol Young. 1993;3:317.
240 deVries J.W., Hoorntje T., Bakker P.F.A. Cerebral oxygen saturation monitoring in an infant undergoing ICD implantation. J Cardiothorac Vasc Anesth. 1998;12:442.
241 Dullenkopf A., Frey B., Baenziger O. Measurement of cerebral oxygenation in anaesthetized children using the INVOS 5100 cerebral oximeter. Pediatr Anaesth. 2003;13:384.
242 Manecke G.R., Nieman J.D., Phillips P. Deep hypothermia alters the vascular response to thiopental. Anesthesiology. 2002;96(3A):A169. (abstract)
243 Jones T.H., Morawetz R.B., Crowell R.M. Threshold of focal cerebral ischemia in awake monkeys. J Neurosurg. 1981;54:773.
244 Deeb G.M., Jenkins E., Bolling S.F. Retrograde cerebral perfusion during hypothermic circulatory arrest reduces neurologic morbidity. J Thorac Cardiovasc Surg. 1995;109:259.
245 Estrera A.L., Miller C.C., Lee T.-Y., et al. Ascending and transverse aortic arch repair. Circulation. 2008;118:S160.
246 Higami T., Kozawa S., Asada T. Retrograde cerebral perfusion versus selective cerebral perfusion as evaluated by cerebral oxygen saturation during aortic arch reconstruction. Ann Thorac Surg. 1999;67:1091.
247 Pigula F.A., Nemoto E.M., Griffith B.P. Regional low-flow perfusion provides cerebral circulatory support during neonatal aortic arch reconstruction. J Thorac Cardiovasc Surg. 2000;199:331.
248 Hofer A., Haizinger B., Geiselseder G., et al. Monitoring of selective antegrade cerebral perfusion using near-infrared spectroscopy in neonatal aortic arch surgery. Eur J Anaesth. 2005;22:293.
249 Olsson C., Thelin S. Antegrade cerebral perfusion with a simplified technique: Unilateral versus bilateral perfusion. Ann Thorac Surg. 2006;81:868.
250 Olsson C., Thelin S. Regional cerebral saturation monitoring with near-infrared spectroscopy during selective antegrade cerebral perfusion: Diagnostic performance and relationship to postoperative stroke. J Thorac Cardiovasc Surg. 2006;131:371.
251 Cheng H.-W., Chang H.-H., Chen Y.-J., et al. Clinical value of application of cerebral oximetry in total replacement of the aortic arch and concomitant vessels. Acta Anaesthesiol Taiwan. 2008;46:178.
252 De Paulis R., Salica A., Maselli D., et al. Initial experience of an arterial shunt for bilateral antegrade cerebral perfusion during hypothermic circulatory arrest. Ann Thorac Surg. 2008;85:624.
253 Fraser C.D., Andropoulos D.B. Principles of antegrade cerebral perfusion during arch reconstruction in newborns/infants. Semin Thorac Cardiovasc Surg Pediatr Card Surg Annu. 2008;11:61.
254 Göbölös L., Philipp A., Foltan M., et al. Surgical management for Stanford type A aortic dissection: Direct cannulation of real lumen at the level of the Botallo’s ligament by Seldinger technique. Interact Cardiovasc Thorac Surg. 2008;7:107.
255 Kouchoukos N.T., Masetti P., Mauney M.C., et al. One-stage repair of extensive chronic aortic dissection using the arch-first technique and bilateral anterior thoracotomy. Ann Thorac Surg. 2008;86:1502.
256 Osborne-Bossert C., Fitzgerald D., Speir A., et al. Delivery of antegrade cerebral perfusion during descending aortic reconstruction: A case report. Perfusion. 2008;23:135.
257 Rubio A., Hakami L., Münch F., et al. Noninvasive control of adequate cerebral oxygenation during low-flow antegrade selective cerebral perfusion on adults and infants in the aortic arch surgery. J Card Surg. 2008;23:474.
258 Thompson B., Tsui S.S.L., Dunning J., et al. Pulmonary endarterectomy is possible and effective without the use of complete circulatory arrest—the UK experience in over 150 patients. Eur J Cardiothorac Surg. 2008;33:157.
259 Salazar J., Coleman R., Griffith S., et al. Brain preservation with selective cerebral perfusion for operations requiring circulatory arrest: Protection at 25° C is similar to 18° C with shorter operating times. Eur J Cardiothorac Surg. 2009;36:524.
260 Tobias J.D. Cerebral oximetry monitoring provides early warning of hypercyanotic spells in an infant with Tetralogy of Fallot. J Intensive Care Med. 2007;22:118.
261 Tobias J.D. Cerebral oximetry monitoring with near-infrared spectroscopy detects alterations in oxygenation before pulse oximetry. J Intensive Care Med. 2008;23:384.
262 Prabhune A., Sehic A., Spence P.A., et al. Cerebral oximetry provides early warning of oxygen delivery failure during cardiopulmonary bypass. J Cardiothorac Vasc Anesth. 2002;16:204.
263 Webb D.P., Deegan R.J., Greelish J.P., et al. Oxygenation failure during cardiopulmonary bypass prompts new safety algorithm and training initiative. J Extra Corpor Technol. 2007;39:188.
264 Edmonds H.L.Jr, Ganzel B.L. Spinal oximetry for ischemia detection during thoracoabdominal aneurysm repair. Anesth Analg. 2004;98:SCA72. (abstract)
265 Tobinick E. The cerebrospinal venous system: Anatomy, physiology, and clinical implications. MedGenMed. 2006;8:53.
266 LeMaire S.A., Ochoa L.N., Conklin L.D., et al. Transcutaneous near-infrared spectroscopy for detection of regional spinal ischemia during intercostal artery ligation: Preliminary experimental results. J Thorac Cardiovasc Surg. 2006;132:1150.
267 Berens R.J., Stuth E.A., Robertson F.A., et al. Near-infrared spectroscopy monitoring during pediatric aortic coarctation repair. Pediatr Anaesth. 2006;16:777.
268 Ing R.J., Fischer S., Shipton S., et al. Regional cerebral oxygenation monitoring—intraoperative management in a patient with severe left ventricular dysfunction. S Afr Med J. 2006;96:1266.
269 Meier S.D., Eble B.K., Stapleton G.E., et al. Mesenteric oxyhemoglobin desaturation improves with patent ductus arteriosus ligation. J Perinatol. 2006;26:562.
270 Felix D., Munro H.M., DeCampli W.M. Near-infrared spectroscopy used to detect preoperative aortic obstruction. Paediatr Anaesth. 2007;17:598.
271 Rossi M., Tirotta C.F., Lagueruela R.G., et al. Diminished Blalock-Taussig shunt flow detected by cerebral oximetry. Paediatr Anaesth. 2007;17:72.
272 Chakravarti S., Srivastava S., Mittnacht A.J.C. Near-infrared spectroscopy (NIRS) in children. Semin Cardiothorac Vasc Anesth. 2008;12:70.
273 Li J., Zhang G., Holtby H., et al. Carbon dioxide—a complex gas in a complex circulation: Its effects on systemic hemodynamics and oxygen transport, cerebra, and splanchnic circulation in neonates after the Norwood procedure. J Thorac Cardiovasc Surg. 2008;136:1207.
274 Tamariz-Gruz O., Palacios-Macedo A., Bouchan-Ramirez Y., et al. Post-operative heart failure management. Report from a case that consisted of correcting the Taussig-Bing disease using an arterial switch. Emphasis on the use of pediatric levosimendan and neural splanchnic monitoring. Revista Mexicana de Anesthes. 2008;31:20.
275 Horvath R., Shore S., Schultz S.E., et al. Cerebral and somatic oxygen saturation decrease after delayed sternal closure in children after cardiac surgery. J Thorac Cardiovasc Surg. 2010;139:894-900.
276 White M.C., Edgell D., Li J., et al. The relationship between cerebral and somatic oxygenation and superior and inferior vena cava flow, arterial oxygenation and pressure in infants during cardiopulmonary bypass. Anaesthesia. 2009;64:251.
277 Harel F., Denault A., Ngo Q., et al. Near-infrared spectroscopy to monitor peripheral blood flow perfusion. J Clin Monit Comp. 2008;22:37.
278 Akça O., Melischek M., Scheck T. Postoperative pain and subcutaneous oxygen tension. Lancet. 1999;354:41.
279 Austin E.H.3rd, Edmonds H.L.Jr, Seremet V., et al. Benefit of neuromonitoring for pediatric cardiac surgery. J Thorac Cardiovasc Surg. 1997;114:707.
280 Edmonds H.L.Jr. Protective effect of neuromonitoring during cardiac surgery. Ann N Y Acad Sci. 2005;1053:12.
281 Laschinger J., Razumovsky A.Y., Stierer K.A., et al. Cardiac surgery: Value of neuromonitoring. Heart Surg Forum. 2003;6:204.
282 Lozano S., Mossad E. Cerebral function monitors during pediatric cardiac surgery: Can they make a difference? J Cardiothorac Vasc Anesth. 2004;18:645.