CARRIAGE OF GASES BY THE BLOOD AND ACID/BASE BALANCE
Introduction


Chemical oxidation can be by the addition of O2 or by the removal of hydrogen (as H+, a proton), and the latter is the mechanism used in the mitochondria. This removal of hydrogen cannot continue indefinitely, as a build-up of H+ would stop the reaction, so the hydrogen is combined with O2 to form water, as in Equation 8.1. This removal of hydrogen leaves behind the elements of CO2 from the glucose. This simplistic description explains why the oxidative metabolism of our mitochondria, which keeps our cells alive, requires O2 and produces CO2 and water.
Oxygen moves into our cells and CO2 moves out by the process of diffusion. In Chapter 6 we learned that there must be a difference in concentration of the diffusing substance for overall diffusion to take place. Outside the cell must have a higher concentration of O2 and a lower concentration of CO2 than inside the cell. High concentrations of O2 and low concentrations of CO2 are the conditions found in the air around us and, to a lesser extent, in the alveolar air. It is the business of the circulation to bring these conditions close to the individual cells.
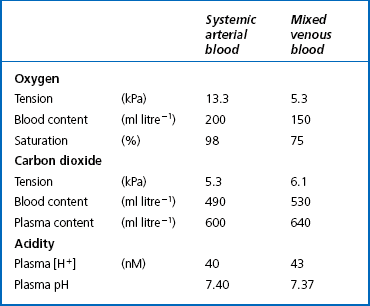
This exchange of gases between the cells and blood at our tissues is a repeat of the exchange between air and blood at the lungs, and results in the differences in composition between venous and arterial blood shown in Table 8.1. Although the RBCs play an important role in this carriage and exchange (carrying the majority of O2 and processing CO2 at both lungs and tissues), the gases must first enter into simple solution in the plasma before being carried or processed by the RBCs.
Oxygen transport
Haemoglobin (Hb)
While exercising vigorously we may need up to 3 L of O2 per minute. This implies that if O2 was only carried to the tissues in simple solution we would need a blood flow of 1000 L min−1 to supply our bodies with O2. Olympic athletes can increase the output of their hearts to about 30 L min−1 which you can see is still several hundred times too little to supply their tissues with O2. The answer to this problem is that, like all other vertebrates, we have evolved a carrier molecule in the blood which picks up and then releases a great deal of O2. In us this molecule is haemoglobin (Hb).
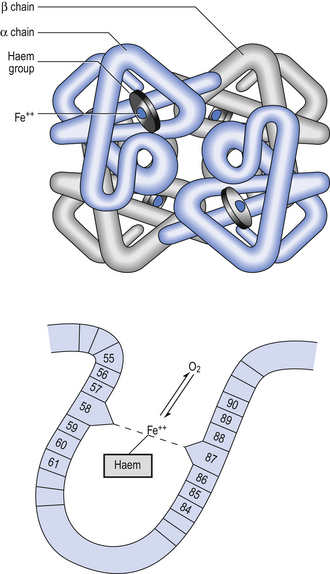
Haemoglobin has remarkable O2-carrying properties which are related to its molecular structure (Fig. 8.1).
Oxygen combination with haemoglobin
This reversible reaction can be summarized as follows:

which will be driven to the right (to HbO2) by increased Po2 and to the left by low Po2. The Hb of this equation is deoxyhaemoglobin – often, and incorrectly, referred to as ‘reduced haemoglobin’, despite the fact that the Hb is not chemically reduced. The HbO2 in this equation is oxyhaemoglobin, and by the same token that Hb is not chemically
oxidized, the combination between Hb and O2 is oxygenation, a much looser combination than oxidation.Each of the four haem groups of the Hb molecule represents a site for combination with O2. It might be more correct to consider each haemoglobin molecule as Hb4, with which association or dissociation with O2 takes place in four steps, in which case Equation 8.3 should be written:
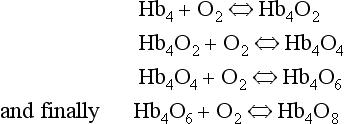
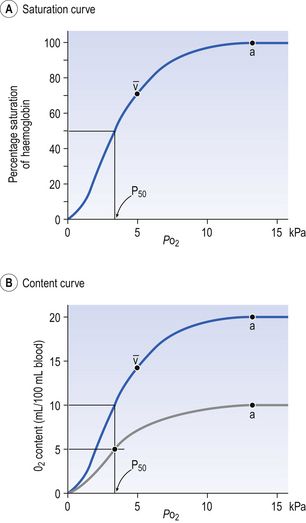
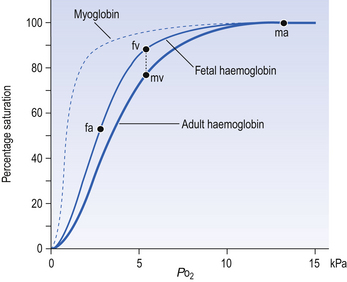
The haem and the globin of each molecule are held in a fixed relationship to each other by links (salt bridges) between the polypeptide chains. In each of the steps in Equation 8.4, when a molecule of O2 binds to the iron atom in each haem the molecular shape is distorted, making the attachment of the next O2 molecule easier. This distortion is called an allosteric effect and, together with the fact that there are only four ‘hooks’ for O2 per molecule, explains the sigmoid shape of the graph obtained when we plot percentage saturation of Hb by O2 against Po2 (Fig. 8.2). This S-shaped curve is called the oxyhaemoglobin dissociation curve, and it is so important to our understanding of the transport of O2 that a description of how it is obtained is well worthwhile.
 ). Note that the slope of the curve is very different at these two points.
Obtaining a dissociation curve
If you take, say, five test tubes of blood and expose each of them to a different partial pressure of O2 (say 0, 2, 4, 8, 16 kPa O2, as in Fig. 8.2), in each tube a different percentage of haemoglobin will be converted to oxyhaemoglobin, depending on the partial pressure it has been exposed to. Each sample will have a different colour because oxyhaemoglobin is brighter red than haemoglobin (arterial blood is red; venous blood is purple). An instrument called a spectrophotometer can use this colour to measure what percentage of the Hb has been converted to HbO2, and so we can plot a graph of percentage saturation (percentage of the O2-carrying ‘hooks’ occupied) against the Po2 to which that particular sample of blood was exposed (Fig. 8.2A). We have talked about each Hb molecule having four hooks, each of which can carry one O2 molecule. This might suggest that blood can only be 25% (one hook), 50% (two hooks) 75% (three hooks occupied) or 100% (four hooks). This is true for each individual molecule, but would ignore the fact that even a drop of blood contains millions of Hb molecules, any one of which can be carrying from zero to four O2 molecules.
Properties of the oxyhaemoglobin dissociation curve
• Oxygen tension (Po2; kPa). We have met this term before, but revision of its meaning might be useful. Oxygen tension is sometimes called the partial pressure of O2 in solution. The difference in Po2 between two sites determines the rate and direction of diffusion of O2. This is because the partial pressures correspond to the concentrations in solution (Henry’s Law). Thus dissolved O2 will diffuse down its concentration (partial pressure) gradient. The Po2 of active skeletal muscle may be as low as 1 kPa. Arterial blood supplying that muscle has a Po2 of about 13 kPa, and this large pressure difference ‘pushes’ O2 strongly into the tissues.
• Haemoglobin content (Hb, g L−1). It is Hb that has the ‘hooks’ that carry the O2. The number of ‘hooks’ determines the maximum O2-carrying capacity per mL of blood. If blood has only 50% (say) of the normal amount of Hb (it is anaemic), it will only have 50% of the normal number of ‘hooks’, and even when fully saturated with O2 it will only be able to carry 100 mL rather than 200 mL of O2.
• Haemoglobin saturation (%). This is the percentage of the total number of ‘hooks’ that are in fact occupied. It is nothing to do with the number of ‘hooks’ present. The number present may be increased (polycythaemia), normal or reduced (anaemia). Measurement of Hb saturation is technically simple using the spectrophotometer as described (Obtaining a dissociation curve, p. 102) and gives useful information for clinical assessment as 100% saturation of arterial blood implies the lungs are doing a good job of gas exchange. However, other measurements, particularly Po2 and Hb content, are necessary to provide a complete picture.
Students sometimes find it helpful to think of saturation as the ‘appetite’ haemoglobin has for O2. If haemoglobin finds itself in a Po2 where its saturation should be high (say 10 kPa in Fig. 8.2) it is ‘hungry’ and will readily accept O2 until it is appropriately saturated, ‘full’. At low Po2 (say 2 kPa in Fig. 8.2) it is not so hungry; in fact, it is overstuffed for these conditions and vomits off its excess oxygen.
• Oxygen content (mL L−1). We have seen (‘Haemoglobin content’, above) that the amount of oxygen in a litre of arterial blood is limited by the amount of Hb it contains. It also depends on the Po2 of the air in the lungs driving O2 into the blood. This underlies the difference between ‘saturation’ and ‘content’, which is very important to understand. An analogy that might help is to consider the RBC as a cloakroom used to store coats. The number of coats (O2 molecules) that can be stored depends on the number of hooks (Hb molecules) present. The number that are actually stored (O2 content), up to the theoretical maximum when all hooks are occupied (100% saturation), depends on the size of the cloakroom (amount of Hb) and the pressure from customers wishing to leave their coats (Po2).
The shape of the curve (Fig. 8.2)
The oxyhaemoglobin dissociation curve (Fig. 8.2) can express the relationship between Po2 and saturation, which is independent of blood Hb content, or Po2 and O2 content which is not. In terms of content the curve is displaced downwards in anaemia (where Hb content is low).
Whether expressing the relationship between Po2 and saturation or content, the curves in Figure 8.2 have the same characteristic shape, which has an important influence on function. The major function of Hb is to load with O2 at the lungs and unload at the tissues. This function is carried out at the flat loading region at the top of the curve and at the steep unloading region. The difference in slope of the curve at these two points has the following consequences:
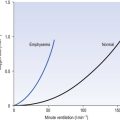
• Loading region (used at the lungs). Above about 10 kPa Hb cannot take up much more O2: it is saturated, because most of the molecules of Hb are carrying their full complement of four O2 molecules and this number cannot be exceeded however high the Po2. Alveolar ventilation can decrease by up to 25% or increase indefinitely without affecting O2 content significantly. O2 tension varies, however. The evolutionary advantage of this is that normal activities such as talking, sighing, coughing, etc. do not greatly alter the amount of O2 per litre of blood leaving the lungs for the tissues.
• Unloading region (used at the tissues). Blood in the capillaries of active tissues finds itself in an environment of low Po2. Oxygen diffuses from blood to tissues, and even a small fall in blood Po2 causes a large unloading of O2, i.e. the blood is working on the steep part of the HbO2 dissociation curve. If it stays in the tissue long enough blood Po2 will equilibrate with tissue Po2. If the blood is anaemic (low Hb content), however, removal of even a small amount of O2 causes a large fall in Po2 because there is little O2 in the blood to begin with. A situation is quickly reached where there is little possibility of further supply to the tissues and a reduced Po2 to drive it in. Thus anaemia can cause tissue hypoxia even though arterial blood has normal Po2 and Hb saturation.
Displacement of the oxyhaemoglobin dissociation curve (Fig. 8.3)
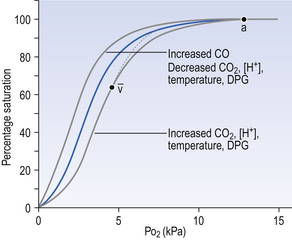
We have seen (Fig. 8.2) that abnormal amounts of Hb in the blood will displace the O2 content curve vertically but will not affect the saturation curve. We will now look at factors that displace the curve horizontally and the way in which this improves the supply of O2 to the tissues.
• Hydrogen ion concentration. Increased [H+] (decreased pH, increased acidity) displaces the curve to the right (Fig. 8.3). This Bohr shift is due to H+ acting on the Hb molecule to decrease its affinity for O2. This does not affect the loading region of the curve because it is horizontal, and so movement to left or right does not produce a change in saturation.
1. Take a vertical line at some Po2 on the steep part of the curve, say 4 kPa in Figure 8.3. If the curve moves to the right the saturation appropriate for that Po2 will fall. The Hb has less ‘appetite’ for O2 and it ‘vomits off’ the excess (see Haemoglobin saturation, p. 104, above). This is clearly an advantage, liberating O2 to diffuse down the concentration gradient to the tissues.
2. What is not so immediately obvious but equally important is revealed if you take a horizontal line, at, say 50% saturation. When the curve moves to the right the Po2 appropriate for that saturation increases! This increases the partial pressure gradient driving O2 into the tissues.
• Carbon dioxide. In addition to its acid properties, which are dealt with above, CO2 reacts with Hb to form carbamino Hb. This also moves the curve to the right. If hypercapnia (increased Pco2) persists for several hours, with chronic acidosis, red cell 2,3,diphosphoglycerate (DPG, see below) is decreased, shifting the curve back to the left.
• Temperature. A decrease in temperature shifts the curve to the left. Blood therefore gives up its O2 less readily in cold tissues, and blood leaving them may be well oxygenated because of this effect. Also, cold will reduce the metabolic demand for O2. For this reason, children playing in the snow have pink ears and noses when their vasoconstricted skin might have been expected to turn blue. This effect is not very important in the lungs because the air in them is so well warmed. It is important, however, in patients made hypothermic during open heart surgery. In these patients, even if arterial Po2 is low the Hb is relatively well saturated and the patient does not look hypoxic.
• 2,3-Diphosphoglycerate (DPG). In most cells under anaerobic conditions 1,3-diphosphoglycerate (1,3-DPG) is converted to 3-phosphoglycerate, with the release of energy which is stored in the form of adenosine triphosphate (ATP).
In red cells, however, 1,3-DPG is converted to 2,3-DPG without the release of energy (Fig. 8.4), an apparently pointless metabolic reaction.
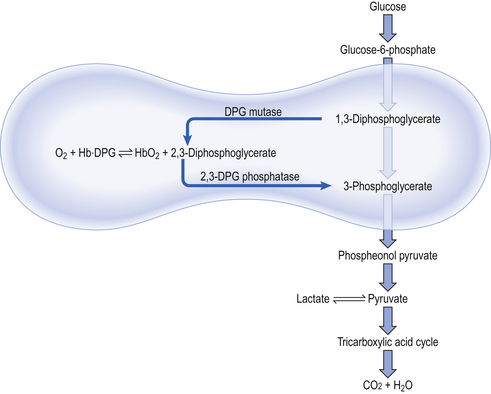
1. in chronic hypoxia of disease, or residence at high altitude, when DPG is increased, releasing O2 in hypoxic tissues
2. during prolonged exercise, when again DPG increases
3. when blood is stored, as in blood banks, and DPG decreases. This blood will not give up its oxygen so easily, a disadvantage to patients receiving transfusions
4. red cells containing abnormal haemoglobins, as in sickle cell anaemia, or patients with enzyme abnormalities, may have abnormal levels of DPG.
Cyanosis
Clinicians are often alerted to reduced blood O2 content by cyanosis, a bluish tinge to the skin. This arises because the colour of blood depends on the Hb content, and the proportions of this that are in the oxygenated (red) or deoxygenated (purple) state. In normal blood the appearance of cyanosis corresponds to about 70% saturation and a Po2 of 5 kPa: this means the blood contains 50 g L−1 deoxygenated haemoglobin, which gives cyanosed skin its blue colour. If the patient is anaemic there is not sufficient Hb to produce this effect, and anaemic patients can be severely hypoxic without cyanosis. On the other hand, polycythaemic patients, with excess Hb, may be cyanosed with little hypoxia.
Myoglobin
Myoglobin is found in muscle and, in part, gives muscle its red colour. Unlike haemoglobin, with its four chains carrying oxygen, myoglobin consists of one molecule of haem and one polypeptide chain. Its dissociation curve is to the left of Hb (Fig. 8.5), so it readily takes up O2 from Hb in capillary blood. Myoglobin may act as a small store of O2 available during anaerobic conditions. This would be useful during the contraction of muscle, particularly heart muscle, because contraction cuts off blood flow. This effect is very limited in the case of sustained contraction of skeletal muscle because the oxygen stored in myoglobin is depleted in a few seconds.
Fetal haemoglobin
The human fetus, dependent on its mother for O2, is always threatened with hypoxia. To alleviate this threat, fetal haemoglobin has a high affinity for O2 and this facilitates transfer from mother to fetus. Fetal Hb has two γ-polypeptide chains in place of the β chains of adult Hb, and inside red cells fetal Hb has a greater affinity for O2 than does adult Hb (Fig. 8.5). Fetal blood in the uterine/placental circulation takes up O2 mainly because its Po2 is lower than that of the maternal uterine arterial blood. In addition, inspection of Figure 8.5 will show that, because its dissociation curve is to the left of the maternal one, at most Po2 fetal blood is more saturated – ‘hungry’ for O2. The transfer of O2 from mother to fetus is aided by a further mechanism produced by the unloading of CO2 in the other direction, from fetus to mother. We have seen above (Displacement of the oxyhaemoglobin curve, p. 105) that the acidic effects of CO2 cause the release of O2 from oxyhaemoglobin. The effect of the transfer of CO2 from fetus to mother first moves the fetal dissociation curve to the left (CO2 is leaving this blood), and then the same CO2 moves the mother’s dissociation curve to the right (CO2 is being added to this blood). The overall effect of this double Bohr shift is to widen the gap between the two dissociation curves, shifting the balance of transfer to the fetus. The mechanisms that make fetal haemoglobin so efficient at obtaining O2 from the mother also make it less efficient at releasing it at the fetal tissues. This results in a degree of hypoxia, which the fetal tissues are better able to withstand than those of the adult. Furthermore, because fetal Hb is more acid than adult Hb it is less able to carry CO2, and so the fetus tends toward acidosis.
Abnormal haemoglobins
• Carboxyhaemoglobin (HbCO). Carbon monoxide (CO) binds to Hb 250 times more strongly than does O2 and competes with it for sites on Hb to form HbCO. This means that as there is 21% O2 in air it only takes 0.1% CO to ‘compete’ on equal terms for the O2-carrying sites on Hb and results in arterial blood having 50% HbO2 and 50% HbCO, which is useless to the tissues. This is equivalent to being 50% anaemic. For this low concentration of CO to come into equilibrium with the blood takes over an hour, but once there the CO takes equally long to be cleared from the blood. Ventilation with 100% O2 will speed the elimination of CO because the high Po2 displaces the CO more efficiently than atmospheric Po2.
When domestic gas was made from coal it contained a large amount of CO as does the untreated exhaust of petrol engines. These fumes were at one time popular methods of suicide. Since the advent of natural gas, which does not contain CO, and catalytic converters for cars which change CO to CO2, these methods have ceased to be available. The cherry-red colour of HbCO gives patients poisoned by CO a deceptively pink and healthy appearance.
• Methaemoglobin (Met-Hb). Methaemoglobin is formed by the oxidation of the ferrous atom of Hb into the ferric form. This can occur because of a congenital defect or as a result of oxidizing poisons, such as nitrites. The Met-Hb cannot combine with O2. The methaemoglobin reductase found in red blood cells slowly converts Met-Hb back into Hb.
• Genetically abnormal haemoglobins. More than 100 different types of human Hb have been discovered, with variants of the peptide patterns in the four polypeptide chains. Some of these Hbs have abnormal dissociation curves because the Hb itself is changed, or because the changes lead to changes in the red cell, such as abnormal DPG content. Abnormalities of Hb may change the shape of the red cell and make it more fragile, as in sickle cell disease.
Dissolved oxygen: do we really need Hb and why keep it in red cells?
Having Hb isolated from the plasma by packaging it in red cells has the following advantages:
1. The presence of DPG displaces the dissociation curve to the right and so aids the unloading of O2 at active tissues.
2. If the 150 g L−1 Hb were free in plasma it would raise the viscosity to intolerable values, and colloid osmotic pressure would also increase considerably. The viscosity effect would be particularly important in capillaries, where containing the Hb in red cells gives blood an anomalously low viscosity (the Fahraeus–Lindqvist effect).
3. Hb molecules are just small enough to escape from the blood through the glomeruli of the kidneys and thus be lost in the urine.
4. There are enzyme systems in the red cells which help prevent Hb breakdown. For example, methaemoglobin reductase converts ferric methaemoglobin back to ferrous haemoglobin.
5. Carbonic andhydrase is restricted to the red cells and is crucial in the role of red cells in CO2 transport.
However, by Henry’s Law the amount dissolved can be increased by increasing the pressure (unlike the amount attached to Hb, which reaches a maximum at atmospheric pressure). If a subject breathes pure oxygen the alveolar and arterial Po2 increases over sixfold, and the amount of O2 in solution rises to 20 mL per litre of blood. Table 8.1 illustrates the important point that we do not extract all the oxygen present in arterial blood. Mixed venous blood is still 75% saturated with O2, and there is an arteriovenous content difference of 50 mL O2 per litre of blood. If a subject breathes pure O2 at 3 atmospheres pressure he can theoretically obtain sufficient O2 from that dissolved in plasma, and Hb is not necessary as an O2 transporter.
Readers interested in even wilder speculation on the importance of Hb might consider an alternative system of supplying our tissues with O2 simply by increasing the flow of Hb free plasma carrying O2 in solution – and speculate what we would look like having cardiovascular systems 60 times larger than they are.
Carbon dioxide transport
 ) is accelerated, and the bicarbonate so formed is stored largely in the plasma. At the lungs the whole process is reversed, releasing CO2 to the alveolar air. Carbon dioxide in the blood is found in simple solution, in the form of
  and combined with the amino groups of proteins. Very small amounts of carbonic acid (H2CO3) and carbonate ion (
 ) are also present.
Carbon dioxide in plasma
Plasma water reacts with CO2 to form  and H+:

Like any chain reaction the overall speed of this reaction is determined by its slowest step.
In plasma the first stage of this reaction is slow, taking 100 s to reach 90% equilibrium at body temperature (this impediment is relieved within the RBC, as we will see below). One of the products of reaction 8.5 is H+ (a proton), and to prevent unacceptable increases in acidity [H+] this has to be buffered. A chemical buffer is a substance that accepts or releases H+ and so minimizes changes in [H+].
The H+ formed in Equation 8.5 is buffered by plasma proteins which take up or release H+.
The amino groups of plasma proteins themselves carry CO2 in the form of carbamino compounds:

and this H+ has to be buffered.
Carbon dioxide in whole blood
The first part of the reaction described by Equation 8.5 ( ) is normally slow, and the second part of the equation (
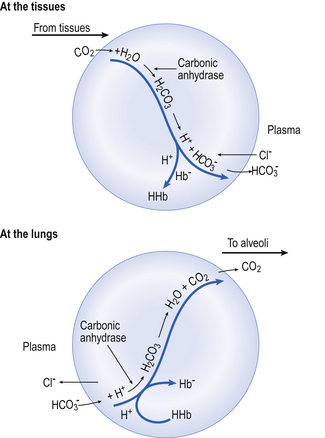
 ) rather limited in plasma. Adding even small quantities of CO2 to whole blood will therefore increase plasma Pco2 appreciably, and as this occurs at the tissues CO2 will diffuse into the red blood cells (Fig. 8.6).
 .
.Reaction 8.5 also occurs inside the red cells, but with important differences. The presence of the enzyme carbonic anhydrase, not found in plasma, accelerates the normally slow formation of H2CO3 from CO2 and H2O. Thus in the red cell reaction 8.5 goes quickly to the right, increasing [H+] and [ ]. These ions are quickly removed, allowing the reaction to continue moving to the right. [H+] is mopped up by Hb and
  diffuses out of the cell into the plasma down its concentration gradient. The
  ions carry a negative charge out of the cell and, to maintain electrical neutrality in the cell, chloride ions (Cl−) move in. This exchange of ions is called the chloride shift (Fig. 8.6). If this did not occur
  would be held in the red cell by its negative charge, reaction 8.5 would be blocked by the build-up of
  and less CO2 could be converted to
  . The proteins involved in reaction 8.6 include, most importantly, haemoglobin, which has a three times greater affinity for CO2 and is present at four times a greater concentration than plasma proteins in blood. Carbaminohaemoglobin is formed by the combination of CO2 and Hb at the tissues (Equation 8.7). This is a special case of the reaction represented by Equation 8.6:

It releases CO2 very readily at the lungs, and the first 30% of the total CO2 released at the lungs is from this source (Fig. 8.7).
The H+ formed in the red cells is buffered by Hb, and because deoxygenated Hb is a weaker acid than HbO2 it has more sites available to accept H+ (protons). It therefore absorbs more H+ and reaction 8.7 shifts to the right. In other words, the release of O2 from HbO2 into active tissues allows the Hb to take up and carry more CO2 for the same Pco2. This effect of deoxygenation increasing the ability of blood to carry CO2 is called the Haldane effect, and should be considered along with the Bohr effect (p. 105), when the beauty of the interaction of these two effects in augmenting the transport of the two most important respiratory gases will be appreciated.
Gas exchange at the lungs
At the lungs the processes taking place at the tissues are reversed (Fig. 8.6). As CO2 is blown off, reactions 8.5, 8.6 and 8.7 move to the left and the chloride shift is reversed. The oxygenation of Hb aids the release of CO2 from the red cells into the plasma and alveoli. It should be remembered that, as with O2 moving in the opposite direction, although the amount in simple solution in plasma water is small, before CO2 can move from red cell to air it must enter into solution in plasma.
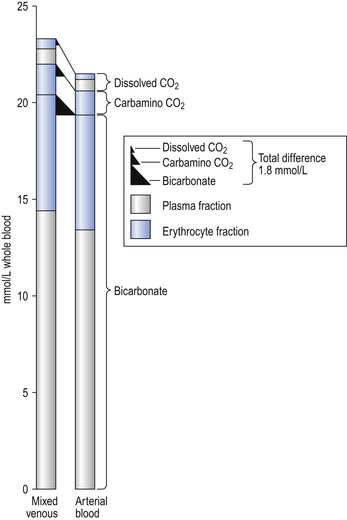
The quantities of transported carbon dioxide
The quantities of the forms of CO2 carried in venous blood are shown in Figure 8.7 and Table 8.1. Although the total amount of CO2 carried in the red cells is much less than that carried in the plasma, the chemical reactions of CO2 in the red cells and the buffering of H+ produced are much greater than in the plasma. The red cells act like factories, processing CO2 and producing  to be stored in the plasma. Thus the exchange of CO2 at lungs and tissues depends more on the processing power of the red blood cells than the plasma content. This is clearly demonstrated by inhibiting carbonic anhydrase in the red cells with a suitable drug. Carbon dioxide entering the blood is then only slowly converted to
  and the amounts of CO2 in solution and as plasma carbamino compounds build up, causing acidosis.
The dissociation curve for carbon dioxide
The relationship between Pco2 and the concentration of CO2 in whole blood is shown in Figure 8.8. This plot is similar to that for oxygen (Fig. 8.2), except that for CO2 we cannot plot saturation against partial pressure because in the case of CO2 there is no carrier molecule (Hb in the case of O2) to be saturated.
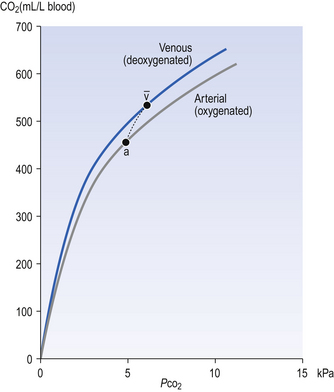
The relationship between Pco2 and total CO2 in blood is approximately linear over the physiological range of Pco2s: from mixed venous (6.1 kPa) to arterial blood (5.3 kPa). Oxyhaemoglobin has a weaker affinity for CO2 than has deoxygenated haemoglobin. This means that oxygenation of blood causes the curve to be displaced to the right (the Haldane shift). Also HbO2 is a stronger acid than deoxygenated Hb and releases H+, which drives reactions 8.5, 8.6 and 8.7 to the left with the formation of free CO2. The Haldane shift results in the ‘functional’ CO2 dissociation curve (the normal range of blood Pco2 over which we function) being steeper than would be expected, because it joins points a and  on Figure 8.8. We have seen for oxygen that a steep curve improves unloading, and as a result of this shift at any Pco2 blood loads and unloads extra CO2 when it is unloading or loading with O2. Because the quantity of Hb in a sample of blood is fixed, the O2 capacity of that blood is also fixed. Because the CO2 dissociation curve cannot be saturated, the CO2 content of our blood is much more variable, even in health, than its O2 content.
Case 8.1 Carriage of gases by the blood and acid/base balance: 5
Interpretation of arterial blood gases
The analysis of blood gas tensions, usually in arterial blood, provides key information about a patient’s respiratory system. Generally a blood gas analyzer measures the partial pressures of oxygen and carbon dioxide in the blood as well as its pH. From these measurements the machine then calculates other values such as actual and standard bicarbonate concentrations and the base excess. An example of blood gas results from a patient without respiratory disease is given below, with normal ranges for the measured variables:
| Normal range | ||
| pH | 7.1 | (7.35–7.45) |
| [H+] | 40 nmol.l−1 | (36–44) |
| Pco2 | 5.3 kPa | (4.4–6.0) |
| Po2 | 12.4 kPa | (12.0–14.0) |
| HCO3 act | 24 mmol.l−1 | |
| HCO3 std | 24 mmol.l−1 | |
| Base excess | 0.1 mmol.l−1 |
1. Is the patient’s oxygenation adequate?
2. Does the patient have an acidaemia or an alkalaemia?
3. Does the patient have a respiratory acidosis or alkalosis?
Is the patient’s oxygenation adequate?
This question can be answered knowing the patient’s Po2 and inspired oxygen concentration. Knowing the Po2 alone is not enough: a patient with a Po2 of 11 kPa breathing room air clearly has better gas exchange than a patient with a Po2 of 12 kPa breathing 60% of oxygen.
Does the patient have a metabolic acidosis or alkalosis?
This question is answered by looking at either the standard bicarbonate or the base excess. A low standard bicarbonate indicates a metabolic acidosis whereas a raised standard bicarbonate indicates a metabolic alkalosis. Similarly, a large negative base excess indicates a metabolic acidosis and a large positive base excess indicates a metabolic alkalosis.
These principles are best illustrated by a few examples:
| Normal range | ||
| pH | 7.26 | (7.35–7.45) |
| [H+] | 55.6 nmol.l−1 | (36–44) |
| Pco2 | 8.84 kPa | (4.4–6.0) |
| Po2 | 7.66 kPa | (12.0–14.0) |
| HCO3 act | 28.7 mmol.l−1 | |
| HCO3 std | 24.1 mmol.l−1 | |
| Base excess | −0.3 mmol.l−1 | (+2.0–−2.0) |
1. There is impaired oxygenation – this patient’s Po2 is low, particularly given the fact that she is breathing 35% oxygen.
2. The pH of the patient’s plasma is low and the [H+] is high – she is acidaemic.
3. There is a respiratory acidosis – the Pco2 is high.
4. There is neither a metabolic acidosis or alkalosis – standard bicarbonate and base excess are both normal.
| Normal range | ||
| pH | 7.40 | (7.35–7.45) |
| [H+] | 40.0 nmol.l−1 | (36–44) |
| Pco2 | 6.43 kPa | (4.4–6.0) |
| Po2 | 9.5 kPa | (12.0–14.0) |
| HCO3 act | 29.1 .l−1 | |
| HCO3 std | 27.6 mmol.l−1 | |
| Base excess | +3.5 mmol.l−1 | (+2.0–−2.0) |
1. The patient’s oxygenation has improved, although it is still abnormal.
2. The patient’s blood is at a normal pH and [H+].
3. The patient still has a respiratory acidosis (high Pco2) although this has improved.
4. The patient has a metabolic alkalosis (high standard bicarbonate, positive base excess).
• CO2 is an acid product of metabolism which must be removed, it is a major determinant of blood pH.
• In solution CO2 forms carbonic acid H2CO3 which dissociates into H+ and  .
.
• CO2 is mainly transported in the plasma as  which is first formed in the red corpuscles.
• Just as the change in levels of CO2 in the blood between lungs and tissues improves the carriage of O2 so the changes in levels of O2 improves the carriage of CO2.
• The dissociation curve for CO2 from the blood is almost a straight line, quite different from the S-shape for O2.
Acid–base balance
A little chemistry
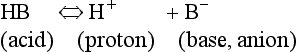


Metabolic acids can be categorized as volatile acids (which are removed in gaseous form, and of which the only one of interest to us is carbonic acid, removed as CO2 by the lungs) and fixed or non-volatile acids, which are removed by the kidneys, in particular as sulphate and phosphoric acid. As the normal pH of urine is about 6.0 (acidic) the body is producing an excess of acid over that removed by respiration, although the acid load removed by the lungs is about four times greater than that removed by the kidneys. The lungs do not, of course, ‘excrete’ acid: they excrete CO2, which as you can see from Equation 8.5 is in equilibrium with H+ in the plasma. The [H+] determines pH, and it doesn’t matter where the H+ comes from or in what form it is removed: every H+ is equivalent to every other. When acids such as lactic acid are added to the blood they add H+, which displaces Equation 8.5 to the left, forming CO2 and water. Water is harmless and diffuses away; removal of CO2 by the lungs allows reaction 8.5 to continue moving to the left, removing H+ and limiting the acidosis.
When you consider the relative amounts of acid disposed of by the lungs and by the kidneys you will understand why some respiratory physiologists dismiss the kidneys as mere minor extensions of the lungs.
 the least important. In terms of purely chemical buffering, the cells of our bodies, with their high protein content, are by far the most important chemical buffer, but as we will see shortly this system is finite, whereas the mechanisms that have evolved for the respiratory system have an almost infinite capacity. We will see that the cell system is like a non-rechargeable battery: once used it is finished, but the system involving respiration is rechargeable and is used over and over again. To explain how this system works we can consider it in isolation, but in clinical situations the interactions between the three buffer compartments (blood, interstitial fluid, intracellular fluid) are of great importance.
 by the kidneys.
Blood buffering
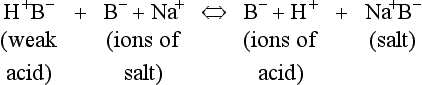
The addition of a strong acid such as H+Cl− will shift the equilibrium further to the left because of the strong affinity of B− for the added H+. Thus the potential increase in H+ is minimized. The added Cl− associates with Na+ to form neutral Na+Cl−.
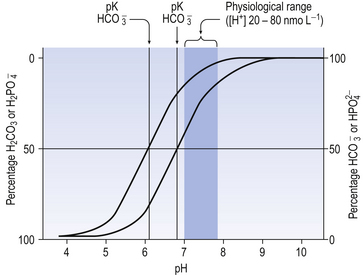
pK of a buffer
From Equation 8.9 you can see that the source of the ions on the left side is the acid, and on the right side the salt. For this buffer to work most efficiently at reducing changes of pH in either direction there should be equal amounts of acid or salt. If there is already a lot of acid in the buffer system it can resist the effects of added base very well, but cannot deal with the addition of more acid. If there is a lot of salt then the buffer system can deal with acid but not base. So, in the ideal state for resisting changes of pH in either direction, the system is ‘in the middle’, with the buffer salt and the acid both half dissociated; the pH at which a buffer system is in this ideal state is called its pK. Normal plasma has a pH of 7.40, and a buffer system with a pK of this value will be at its most powerful in the blood. Figure 8.9 illustrates the performance of the buffer systems for phosphate and  . It would seem that the
  system, with its pK far from plasma pH, would be a poor buffer in the body, but it has other attributes that make it perhaps the most important buffer we have, and we will consider these a little later. The main buffers in the blood are bicarbonate, proteins – in particular haemoglobin – and phosphate.
Proteins as buffers
Plasma proteins and haemoglobin constitute the major chemical blood buffers of added acid (we will see shortly that another system which does not rely solely on chemical means is at least as important). Haemoglobin is more important than plasma protein, because molecule for molecule it is a more efficient buffer, and also because there is more of it (150 g L−1 for Hb, compared to 40 g L−1 plasma protein). Buffering action is based on Equation 8.6, where the protein can be haemoglobin or plasma protein.
Phosphates as buffers
The phosphate buffer system illustrated in Figure 8.9 is made up of the acidic (H2PO4) and basic (NaHPO4) forms of phosphoric acid and its salts, respectively. In plasma, phosphate buffers are not very important because the concentrations of the radicals involved are small. In the kidney, however, the system is particularly important in regulating the excretion of H+. At pH 7.4 urine contains four parts of basic to one part of acidic phosphate. If more acid is excreted and the pH of the urine is reduced to 5.8, say, then the ratio of acidic to basic phosphate becomes 10:1. Phosphates may form a more important buffer system inside the cells than in plasma or interstitial fluid.
Bicarbonate as a buffer
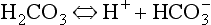
At the beginning of this section on CO2 transport we saw that:
Carbonic acid is formed when CO2 dissolves in water:

Carbonic acid is a weak acid which dissociates:
The Law of Mass Action describes the equilibrium of reversible reactions, such as Equation 8.7, as follows:
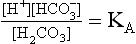
where KA is the dissociation constant for H2CO3.
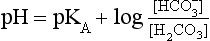
Equation 8.12 can be converted to a special equation relating CO2,  and pH in the blood: The Henderson–Hasselbalch Equation, as follows:
pH is the negative logarithm of [H+] so, taking logs of both sides of Equation 8.12 and transposing, we get:


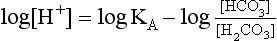
pH and pKA are the negative logarithms of [H+] and KA, respectively.
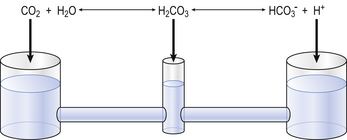
The problem with using this equation to calculate blood pH, or if we know pH blood [ ], is that there is so little [H2CO3] in blood that it is very difficult to measure. However, this very small quantity means that the addition of H+ to whole blood shifts the reaction rapidly and almost completely to the left. Like water added to a container in Figure 8.10, H+ added on the right is soon mostly shared with container CO2 on the left, with very little being retained in the small container H2CO3 in the middle.
At equilibrium, which is reached very rapidly because of carbonic anhydrase in the red cells, [CO2] = 809[H2CO3]. Thus Equation 8.16 can be written:
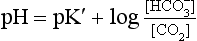
(pKA has changed to pK′ because we have changed from considering [H2CO3] to considering [CO2]).
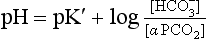
where α is the solubility of CO2 in plasma per kPa Pco2 at body temperature (0.23 mmol kPa−1 L−1). Expressing the equation this way has the advantage that Pco2 is easy to measure in blood with a ‘CO2 electrode’.

 ] being 20 times greater than [CO2]. You can see from the equation that every molecule of CO2 involved forms not only a
  but also an H+, and so this is not buffering of CO2.
 (base), but the effect of adding one H+ to a concentration of 40 mol/L hydrogen ion is much greater than adding one
  to 26 mmol/L bicarbonate ion.
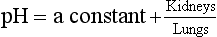
 to the kidneys it ‘enlists their aid’ in controlling the levels of these substances and hence pH.
 : both work to maintain the
  ratio at 20:1. Although not a buffer system in the chemical sense of the word, the kidney–
  – lung combination is a more powerful controller of blood pH than excellent chemical buffers such as Hb. The ability of Hb to deal with excess acid or base is limited by the amount of Hb present. When that is ‘used up’ that is the end of its buffering. The kidneys and lungs, on the other hand, can deal with an almost infinite excess of acid or base because they simply pass them to the outside.
We must therefore modify the dismissive remarks about the kidneys as ‘mere minor extensions of the lungs’ (A little chemistry, p. 113) and admit them as full partners in the regulation of the  ratio and therefore of pH. Indeed, the Henderson–Hasselbalch equation (Equation 8.16) has been qualitatively rewritten (Gilman and Brazeau, 1953) as follows:
Calculation and illustration of acid–base status
 ] or Pco2) is known the third can be calculated. Furthermore, theoretically it allows calculation of what would happen if one of the three variables were changed. For example, if CO2 were added to the blood, pH and/or [
 ] must change in a clearly defined way. Knowing the values of the three variables allows an accurate assessment of the acid–base status of the blood to be made. For example, normal arterial blood has a pH of 7.40 and pK = 6.10, and because
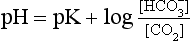
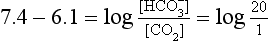
 ]/CO2 ratio can be calculated. In patients with acid–base abnormalities the Henderson–Hasselbalch equation can be applied to discover the source of the abnormality. Many automated systems for analysing arterial blood now carry out these calculations to provide this information.
 ] is known as the Davenport diagram.
The problem with displaying the Henderson–Hasselbalch relationship graphically on a page is that you have to display three variables on a two-dimensional surface. The Davenport diagram gets round this by displaying Pco2 as a series of isobars (lines consisting of points of equal partial pressure) plotted against plasma [ ] and pH, laid out along axes as in a conventional graph (Fig. 8.11).
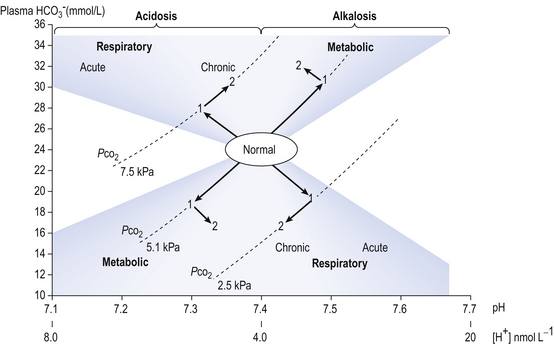
 ] under normal conditions, and during acidosis and alkalosis.
Disturbances in the normal acid–base situation may be acidosis or alkalosis and result from:
• Respiratory malfunction, where ventilation is too great (respiratory alkalosis) or too little (respiratory acidosis)
• Metabolic malfunction, where excess acid is ingested or generated (metabolic acidosis) or acid is lost from the body, perhaps by vomiting gastric contents (metabolic alkalosis). The acute changes (1) and the chronic compensatory changes (2) that take place primarily to restore pH to normal are shown in Figure 8.11.
Clinical measurements
In the clinical situation [H+] and Pco2 are measured in arterial blood samples in an instrument known reasonably enough as a blood gas analyser which consists of a series of ion-sensitive electrodes. The blood samples are usually taken from the brachial or radial artery into a syringe containing an anticoagulant (heparin). It is important to exclude air from the sample, as the partial pressures between blood and air will equilibrate. If the sample is to be kept for any length of time before analysis it should be stored in ice to arrest metabolism of white cells.
• Standard bicarbonate, which is the [ ] expected if the arterial blood sample were equilibrated to a normal Pco2 of 5.3 kPa, and
• Base excess, which is the amount of acid (or base, in the case of a base deficit) which has to be added to the blood (which is first restored to a physiological Pco2 to remove any respiratory component), to restore the pH to normal. Base excess is therefore zero in normal situations, and is represented in the pathological situation by the broken line in Figure 8.11.