[level-membership-for-critical-care-medicine-category]
Cardiovascular Anatomy and Physiology
Anatomy
Macroscopic Structure
Structures of the Heart
The heart is situated in the anterior thoracic cavity, just behind the sternum (Fig. 12-1). Several important structures, including the esophagus, the aorta, the vena cava, and the vertebral column, are located behind the heart. The position of the heart within the chest cavity is such that the chambers normally described as “right” and “left” are, in fact, anterior and posterior.1 The right ventricle constitutes the majority of the anterior surface (closest to the chest wall) and also the inferior surface (directly above the diaphragm). The left ventricle makes up the anterolateral (front and side) and posterior surfaces. The base of the heart is superior (atrial and great vessel level), and the tip (apex) is inferior (ventricular level), above the diaphragm. The base of the heart includes not only the superior portion of the heart itself but also the roots of the aorta, the vena cava, and pulmonary vessels.
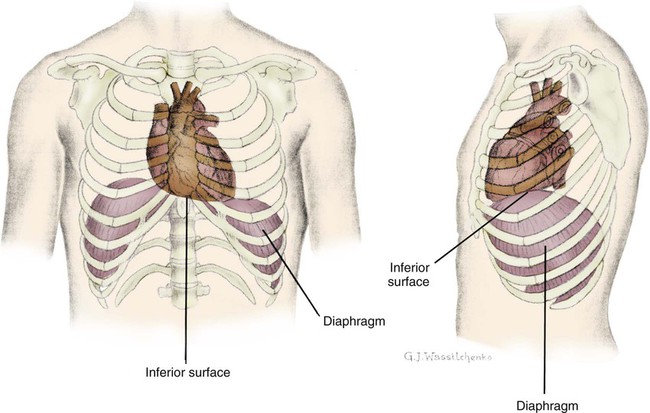
The increasing use of thoracic computed tomography in critical care has highlighted the anatomic inaccuracy of the terms right ventricle and left ventricle because these terms do not relate to the position of the heart in the chest when described in the standard anatomic position (i.e., upright and facing the observer).1–3 Despite discussion of these differences, the impetus to change the traditional nomenclature is lacking.
Layers of the Heart
Pericardium.
The heart and the origins of the great vessels are surrounded and enclosed by the pericardium. The outermost fibrous pericardium is a thick envelope that is tough and inelastic. Ligaments anchor the outer pericardium to the diaphragm and the great vessels such that the heart is maintained in a fixed position within the thoracic cavity. The pericardium also provides a physical barrier to infection. Inside the fibrous layer is an inner, double-walled membrane described as the serous pericardium.4 The two layers are labeled “parietal” and “visceral.” The parietal pericardium adheres to the tough, outer pericardium. The visceral pericardium is flexible, adheres directly to the heart, and folds with the surface contours of the heart. The pericardial cavity is the potential space between the visceral and parietal layers.4,5 The space between these two layers normally contains a small amount of pericardial fluid, which is secreted, resorbed, and serves as a lubricant between the layers so that the heart can move without friction.5 The fibrous, outer pericardial sac is noncompliant and unable to adapt to rapid increases in pericardial fluid.5 For example, blood can collect in this sac in cardiac tamponade, or serum can collect in pericardial effusion. If the fluid collection in the sac impinges on ventricular filling, ventricular ejection, or coronary artery perfusion, removal of the excess pericardial fluid may be necessary, a procedure known as pericardiocentesis.5 The phrenic nerve provides sensory fibers to the pericardium. The pain that accompanies pericardial effusion and cardiac tamponade is sensed via phrenic nerve innervation.5
Epicardial Fat.
In adults, a layer of adipose tissue is typically present beneath the visceral pericardium and may surround the heart. This epicardial fat accumulates along the routes of the major coronary arteries and veins. Autopsy data indicate that epicardial fat increases until age 20 to 40 years, but thereafter, the quantity does not depend on age.6 Epicardial fat covers 80% of the surface of the heart and constitutes about 20% of the total weight of the heart, with the largest quantity positioned over the right ventricle.6 If a person is overweight or obese with a large quantity of visceral and subcutaneous adipose tissue, usually more epicardial fat is present.7 Because obesity is endemic in modern society, epicardial fat is receiving more attention. Epicardial fat is hypothesized to increase the risk of coronary artery disease (CAD) because it contains smaller adipocytes compared with other fat deposits, has a different fatty acid composition, and has a higher protein content. This composition facilitates the infiltration of free fatty acids and adipokines into coronary arteries.8 The fibrous, outer pericardium does not contain any fat deposits.
Myocardium.
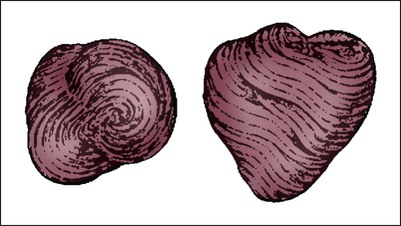
The next layer of the heart is the myocardium, a thick, muscular layer. This layer includes all of the atrial and ventricular muscle fibers necessary for contraction. The fibers of the myocardium do not have the same thickness throughout the ventricular walls. The left ventricle is much thicker than the right ventricle or the atria. The fibers are organized in such a manner that the force of contraction is most efficient in ejecting blood toward the outflow tracts in a wringing motion from the apex toward the base (Fig. 12-2).9 The myocardium is the muscle that is damaged by a “heart attack” or transmural myocardial infarction (MI).
Cardiac Chambers
The human heart has four chambers: the left and right atria and the left and right ventricles. The atria are thin-walled and normally low-pressure chambers. They function to receive blood from the vena cavae and pulmonary arteries and to pump blood into their respective ventricles. Atrial contraction, also known as atrial kick, contributes approximately 20% of blood flow to ventricular filling; the other 80% occurs passively during diastole. The ventricles are the primary pumping chambers of the heart. The healthy left ventricle is about 10 to 13 mm thick, and the interior chamber appears round in cross-section.10 The healthy right ventricle is approximately 3 mm thick, appears to have a triangular shape when viewed from the side, and has a crescent shape when viewed in cross-section (Fig. 12-3). The right ventricle pumps blood into the low-pressured pulmonary circulation, which has a normal mean pressure of approximately 15 mm Hg. The left ventricle must generate tremendous force to eject blood into the aorta (normal mean pressure of approximately 100 mm Hg). Because of left ventricular wall thickness and the large force it must generate, the left ventricle is considered the major pump of the heart. When the left ventricular muscle is damaged from cardiomyopathy or infarction, the effective pumping pressure is diminished, leading to increased left atrial pressure, pulmonary vasculature congestion, and ultimately, systemic venous congestion.
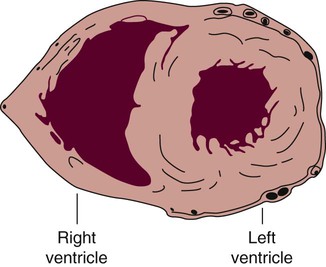
The right ventricle forms the greater part of the anterior surface of the heart, and the wall of the left ventricle is three times as thick as the wall of the right ventricle. (From Quaal S. Comprehensive Intraaortic Balloon Pumping. 2nd ed. St. Louis, MO: Mosby; 1993.)
Cardiac Valves
Cardiac valves are composed of flexible, fibrous tissue. A normal valve has the translucent appearance of a rose petal. The valve structure allows blood to flow in only one direction. The opening and closing of the valves depends on the relative pressure gradients on either side of the valve. The four cardiac valves lie in an oblique plane of collagen described as the fibrous skeleton. Four adjacent rings of connective tissue contain and support the cardiac valves (Fig. 12-4).
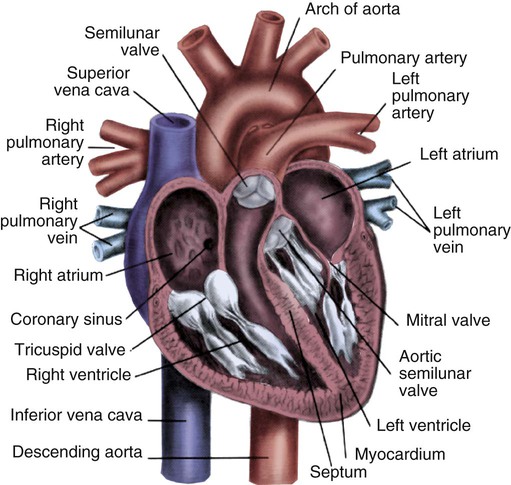
Note the position of the four cardiac valves. (From Thompson JM, et al. Mosby’s Clinical Nursing. 5th ed. St. Louis, MO: Mosby; 2002.)
Atrioventricular Valves.
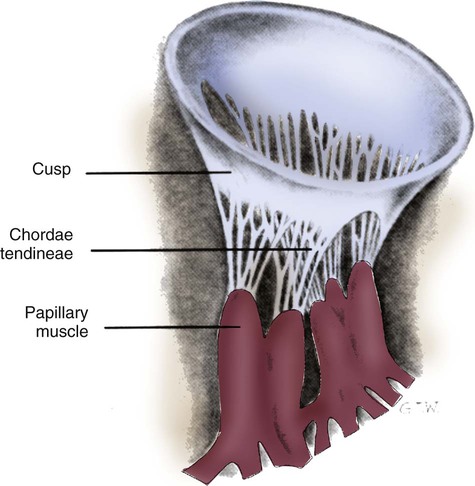
The two atrioventricular (AV) valves are named for their location between the atria and the ventricles. These are the tricuspid valve on the right and the mitral valve on the left. The mitral valve is described as having two leaflets, although the “leaflets” are a continuous, noninterrupted structure.11 The AV valves are open during ventricular diastole (filling) and prevent backflow of blood into the atria during ventricular systole (contraction). The chordae tendineae and papillary muscles, which attach to the tricuspid and mitral valves, give the valves stability and prevent valve leaflet eversion during systole (Fig. 12-5). Papillary muscles arise from the ventricular myocardium and derive their blood supply from the coronary arteries. Each papillary muscle gives rise to approximately 4 to 10 main chordae tendineae, which divide into increasingly finer cords as they approach and attach to the valve leaflets. The chordae tendineae are fibrous, avascular structures covered by a thin layer of endocardium. Dysfunction of the chordae tendineae or of a papillary muscle may cause incomplete closure of an AV valve, which results in backflow of blood into the atrium. Degenerative disease of the valve leaflets is another cause of regurgitation of blood into the atrium.12 Valvular regurgitation produces a murmur that can be auscultated with a stethoscope.
Semilunar Valves.
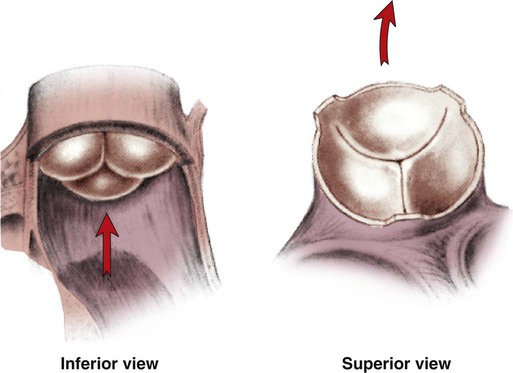
The semilunar valves are pulmonic and aortic valves. Each valve has three cuplike leaflets (Fig. 12-6). These valves separate the ventricles from their respective outflow arteries (Table 12-1). During ventricular systole (contraction), semilunar valves open, allowing blood to flow out of the ventricles. As systole ends and the pressure in the outflow arteries exceeds that of the ventricles, the semilunar valves close, preventing blood regurgitation back into the ventricles. In most individuals, the aortic valve has three leaflets. In less than 1% of the population, it is bicuspid (a two-leaflet valve), which increases susceptibility to aortic valve failure over time.13,14 Aortic valve dysfunction, from any cause, not only affects the valve leaflets but also pathologically alters the shape of the left ventricle.
TABLE 12-1
CARDIAC VALVES AND THEIR LOCATIONS
| VALVE | TYPE | SITUATED BETWEEN |
| Tricuspid | Atrioventricular | Right atrium and right ventricle |
| Pulmonic | Semilunar | Right ventricle and pulmonary artery |
| Mitral | Atrioventricular | Left atrium and left ventricle |
| Aortic | Semilunar | Left ventricle and aorta |
Conduction System
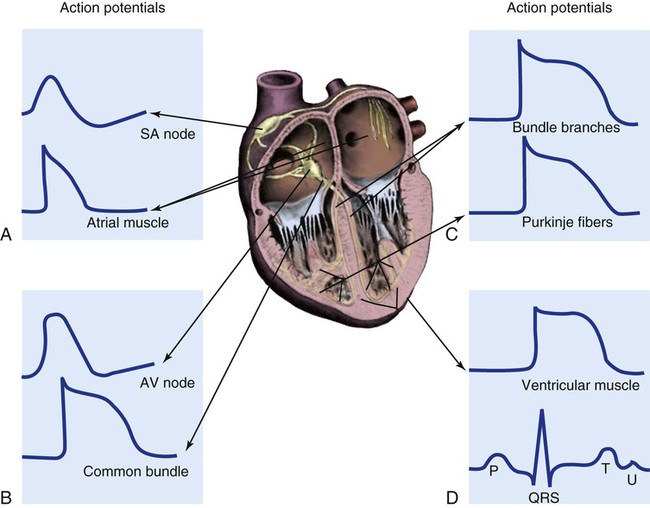
To analyze electrical activity within the heart, it is helpful to understand the three main areas of impulse propagation and conduction: 1) the sinoatrial (SA) node, 2) the AV node, and 3) the conduction fibers within the ventricle, specifically the bundle of His, the bundle branches, and the Purkinje fibers.15
Sinoatrial Node.
The SA node is considered the natural pacemaker of the heart because it has the highest degree of automaticity, producing the fastest intrinsic heart rate (Table 12-2). The node is a spindle-shaped structure located near the entrance of the superior vena cava, on the posterior aspect of the right atrium. Some normal variability in the position and shape of the node exists. The SA node is supplied from the right coronary system in 63% of people and from the left coronary system in 37%.16 The SA node contains two types of cells, the specialized pacemaker cells found in the node center and the border zone cells. Both cell types have inherent pacemaker properties (they automatically depolarize 60 to 100 times per minute). The cells in the nodal center are responsible for the pace making of the heart, whereas the intrinsic depolarization capability of the fibers in the border zone is depressed by surrounding atrial tissue.
TABLE 12-2
INTRINSIC PACEMAKER RATES OF CARDIAC CONDUCTION TISSUE
| LOCATION | RATE (BEATS/MIN) |
| Sinoatrial (SA) node | 60-100 |
| Atrioventricular (AV) node | 40-60 |
| Purkinje fibers | 15-40 |
Once the center nodal cells depolarize, the impulse is conducted through the nodal border zone toward the atrium. Atrial depolarization occurs cell to cell. Some anatomists postulate that specialized conduction pathways exit the SA node (Fig. 12-7A). These internodal pathways are directed to the AV node.17 An intra-atrial conduction pathway, known as Bachmann’s bundle, travels from the right atrium to the left atrium.18,19
Atrioventricular Node.
The AV node is located posteriorly on the right side of the interatrial septum, on the floor of the right atrium.20 The AV node receives its blood supply from the first posterior septal branch of the right (90%) or left (10%) coronary artery.16 Because the atria and ventricles are separated by nonconductive tissue, electrical impulses initiated in the atria are conducted to the ventricles only via the AV node. The AV node performs four essential functions to support cardiac conduction:
1. The AV node delays the conduction impulse from the atria (0.8 to 1.2 seconds) to provide time for the ventricles to fill during diastole.
2. The AV node controls the number of impulses that are transmitted from the atria to the ventricles. This prevents rapid irregular atrial heart rhythms from destabilizing the ventricular rhythm.
3. The AV node acts as a backup pacemaker if the faster SA node fails. Normally, the intrinsic AV nodal rate is slower than the SA nodal rate (see Table 12-2). When an impulse from the SA node arrives at the AV node, AV nodal tissue becomes depolarized, and the AV nodal pacemaker timing is reset (see Fig. 12-7B). This prevents the AV node from initiating its own pacemaker impulse that would compete with the SA node.
4. The AV node can conduct retrograde (backward) impulses through the node. If the SA and AV pacemaker cells fail to fire, an electrical impulse may be initiated in the ventricles and conducted backward via the AV node. Retrograde conduction time is usually longer than antegrade (forward) conduction.
Bundle of His, Bundle Branches, and Purkinje Fibers.
Electrical impulses are conducted in the ventricles through the bundle of His, the bundle branches, and the Purkinje fibers (see Fig. 12-7C). These structures run through the subendocardium, down the right side of the interventricular septum. About 12 mm from the AV node, the bundle of His divides into the right and left bundle branches. The right bundle branch continues down the right side of the interventricular septum toward the right apex. The left bundle branch is thicker than the right and takes off from the bundle of His at an almost right angle. It traverses the septum to the subendocardial surface of the left interventricular wall, where it divides into a thin anterior branch and a thick posterior branch. Functionally, when one of the left branches is blocked, it is referred to as a hemiblock. All of the bundle branches are subject to conduction defects (bundle branch blocks) that give rise to characteristic changes in the 12-lead electrocardiogram (ECG).
The right bundle branch and the two divisions of the left bundle branch eventually divide into the Purkinje fibers, which have the fastest conduction velocity of all heart tissue. Purkinje fibers divide many times, terminating in the subendocardial surface of both ventricles. This is followed by ventricular muscle depolarization (see Fig. 12-7D).
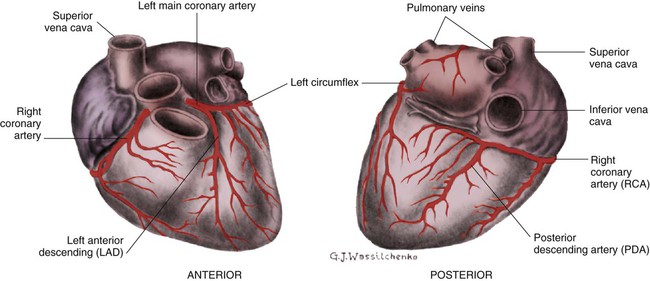
Coronary Blood Supply
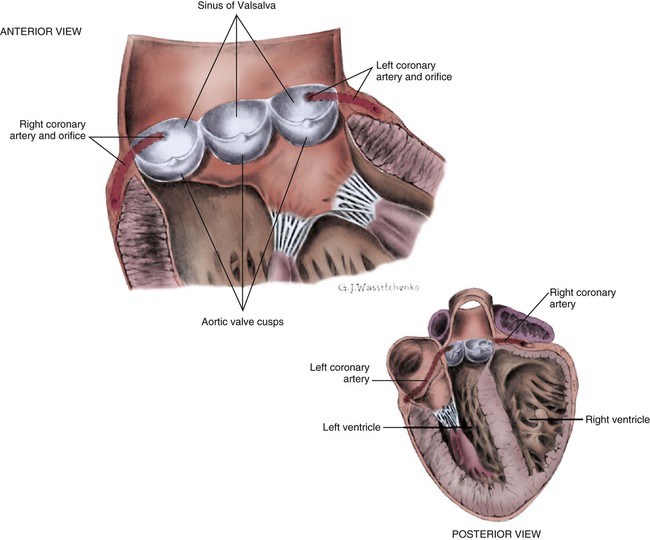
The coronary circulation consists of those vessels that supply the heart structures with oxygenated blood (coronary arteries) and then return the blood to the general circulation (coronary veins). The right and left coronary arteries arise at the base of the aorta, immediately above the aortic valve (Fig. 12-8).21 They then traverse the outside of the heart, above the epicardium, in the natural grooves (sulci) between the chambers. To perfuse the thick heart muscle, branches from these main arteries arise at acute angles, penetrating the muscular wall and eventually feeding the endocardium (Fig. 12-9).21
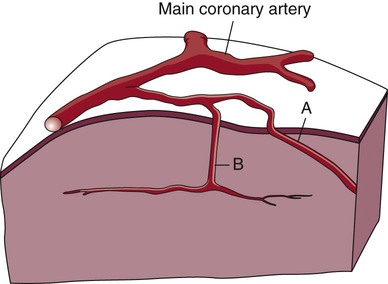
A, Epicardial arteries arise at acute angles from main coronary vessels to supply the epicardial surface of the heart. B, Smaller vessels branch at oblique angles from main coronary vessels that penetrate deeper into the myocardium and endocardium (intramural arteries). (Redrawn from Quaal S. Comprehensive Intraaortic Balloon Pumping. 2nd ed. St. Louis, MO: Mosby; 1993.)
The right coronary artery (RCA) serves the right atrium and the right ventricle in most people. In 63% of the population, the sinus node artery, which supplies the SA node, arises from the RCA.16 The AV node is supplied via the RCA in 90% of the population.16 The term dominant coronary artery is used to describe the artery that supplies the posterior part of the heart. In most people, the RCA is dominant, supplying the posterior cardiac wall.21
The left coronary artery is a short but important artery that divides into two large arteries—the left anterior descending (LAD) and the circumflex (Cx) arteries. These vessels serve the left atrium and most of the left ventricle (Fig. 12-10). The LAD artery travels in the sulcus over the anterior intraventricular septum. Septal perforator branches branch off at right angles to provide blood supply to the intraventricular septum.21
Coronary Veins.
The cardiac (coronary) veins, which carry deoxygenated blood, are adjacent to the paths of the coronary arteries, with one significant difference. The coronary veins ultimately join together to become the coronary sinus (the largest cardiac vein), which primarily empties into the back of the right atrium. The coronary venous blood then mixes with the systemic venous blood in the right atrium.22
Physiologic Cardiac Shunts.
An example of an abnormal, or pathologic, intracardiac shunt is an opening in the ventricular septum, between the left and right sides of the heart. In the ventricle, this septal opening, called a ventricular septal defect (VSD), allows mixing of blood from both ventricles. The clinical impact depends on the size of the intracardiac shunt. A VSD is a congenital opening between the ventricles; a ventricular septal rupture (VSR) can occur as a complication of a large anterior-wall MI, as shown in Figure 15-15.
Major Cardiac Vessels
Aorta
The aorta is the largest artery in the body. It carries oxygenated blood from the left ventricle to the rest of the body. The aorta is separated from the left ventricle by the aortic valve. Just above the aortic valve are two small openings that represent the origins of the right and left coronary arterial systems (see Fig. 12-8). These opening are known by several names, including the coronary ostia and the sinus of Valsalva.
Pulmonary Veins
The four pulmonary veins return oxygenated blood from the lungs to the left atrium. These are the only veins in the body that carry oxygenated blood. The veins drain into the back wall of the left atrium (see Fig. 12-10). No valves inhibit the flow of blood into the left atrium. Blood flow is accomplished by simple hydrostatic pressure gradients. The pressure must be lower in the left atrium than in the pulmonary circulation for flow to occur in a forward direction.
Systemic Circulation
Arterial System.
Arteries are constructed of three layers (Fig. 12-11): 1) The adventitia, the outermost layer, is composed largely of a connective tissue coat to provide strength and shape to the vessel; 2) the media, or muscular middle layer, is made up of smooth muscle and elastic tissue. The muscular layer changes the lumen diameter when necessary; and 3) the innermost layer, or intima, consists of a thin lining of endothelium and a small amount of elastic tissue. The smooth endothelial lining decreases resistance to blood flow and minimizes opportunity for platelet aggregation.
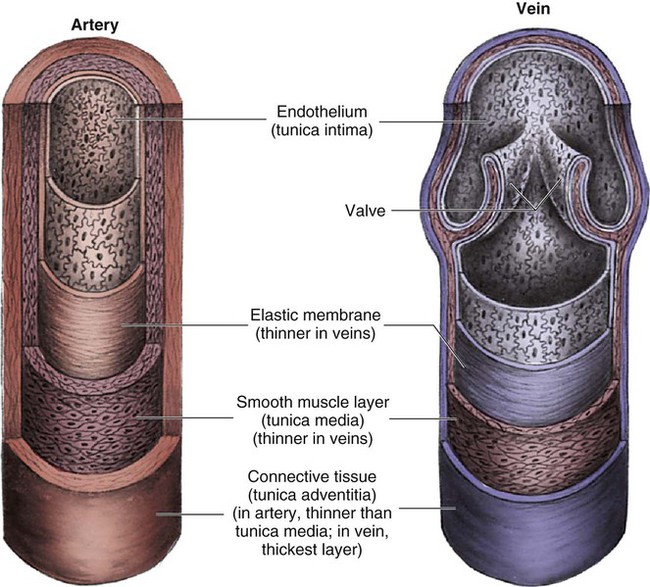
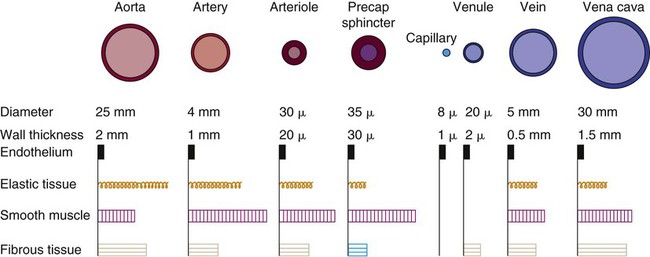
The intimal and the adventitial layers remain relatively constant in the vascular system, whereas the elastin and smooth muscle in the media vary in proportion, depending on the size and type of the vessel. The aorta contains the greatest amount of elastic tissue. This is necessary because of the sudden shifts in pressure created by the left ventricle. The arterioles, or smaller arteries, and precapillary sphincters have more smooth muscle than do the larger arteries and aorta because they function to change the luminal diameter when regulating blood pressure and blood flow to tissues (Fig. 12-12).
Blood Flow and Blood Pressure.
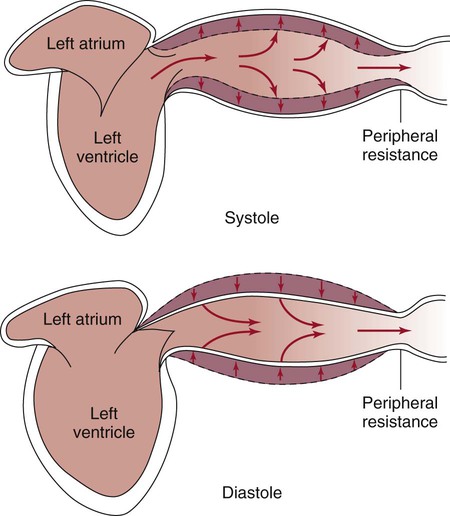
The pulsatile nature of arterial flow is caused by intermittent cardiac ejection and the stretch of the ascending aorta. The pressure wave initiated by left ventricular ejection (Fig. 12-13) travels considerably faster than does blood itself. When an examiner palpates a pulse, it is the propagation of the pressure wave that is perceived.
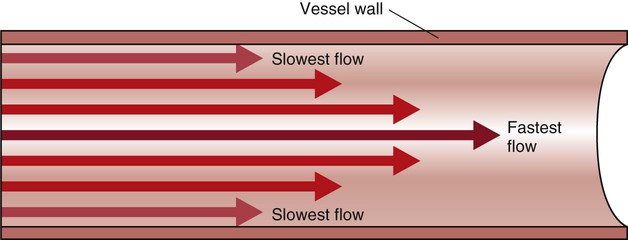
In the normal arterial system, blood flow is described as laminar, or streamlined, because the fluid moves in one direction. However, differences exist in the linear velocities within a blood vessel. The layer of blood immediately adjacent to the vessel wall moves relatively slowly because of the friction created as it comes in contact with the motionless vessel wall. In contrast, the more central blood in the lumen travels more rapidly (Fig. 12-14).
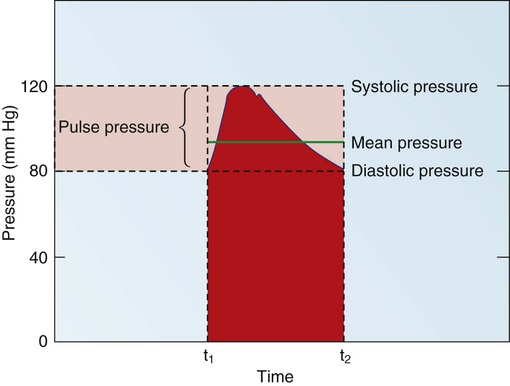
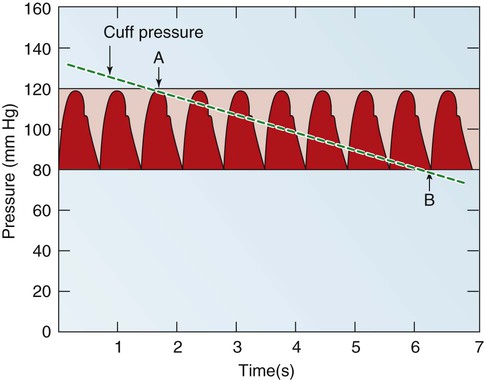
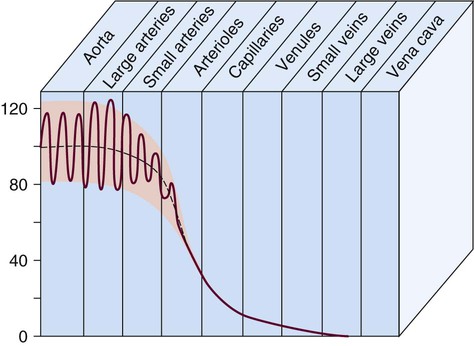
Blood pressure measurement has several components. The systolic blood pressure (SBP) represents the ventricular volume ejection and the response of the arterial system to that ejection. The diastolic blood pressure (DBP) value indicates the ventricular resting state of the arterial system. The pulse pressure is the difference between the SBP and the DBP. The mean arterial pressure (MAP) is the mean value of the area under the blood pressure curve (Fig. 12-15). Blood pressure may be measured in several ways. Direct measurement is accomplished by means of a catheter inserted into an artery. Blood pressure is measured in millimeters of mercury (mm Hg). The most common indirect method is by means of a stethoscope and sphygmomanometer (Fig. 12-16). Figure 12-17 graphically summarizes blood pressures in various portions of the systemic circulatory system.
It is also possible to calculate the resistance within the systemic vascular system, described by the phrase systemic vascular resistance (SVR). When it occurs in the pulmonary circulation, it is termed pulmonary vascular resistance (PVR). These derived values are based on calculations from other hemodynamic parameters, as described in Chapter 14 and Appendix B.
Microcirculation.
The microcirculation consists of arterioles, arterial capillaries, venous capillaries, and venules (Fig. 12-18). Oxygen, nutrients, hormones, and waste products are exchanged between the bloodstream and adjacent cells. The microcirculation has a vital role in the regulation of oxygen supply and demand at the tissue level. The density and anatomy of the microcirculation vary, depending on the metabolic needs of each tissue or organ.
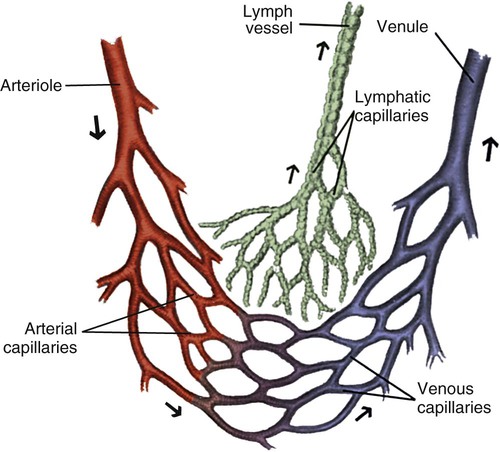
Note the branching nature and large cross-sectional area of the capillary bed. (From Thompson JM, et al. Mosby’s Clinical Nursing. 5th ed. St. Louis, MO: Mosby; 2002.)
Precapillary sphincters are small cuffs of smooth muscle that control blood flow at the junction of the arterioles and the capillaries. The precapillary sphincters allow selective blood flow into capillary beds, depending on their contractile state, and are innervated by norepinephrine released from the sympathetic nervous system (SNS) and epinephrine released by chromaffin cells in the adrenal medulla of the adrenal glands.23
As blood reaches the capillary level, the pulsatile nature of arterial flow is dampened (see Fig. 12-17). Even though the diameter of a capillary is less than that of an arteriole, the pressure and flow velocity in the capillary bed is low as a result of the large cross-sectional area of the branching capillary bed (see Fig. 12-18). The capillary consists of a single cell layer of endothelium and is devoid of muscle or elastin (see Fig. 12-12). This arrangement allows solutes to diffuse in and out of the capillaries unimpeded by mechanical barriers. The capillaries normally retain large structures such as red blood cells but are highly permeable to smaller solutes such as electrolytes.
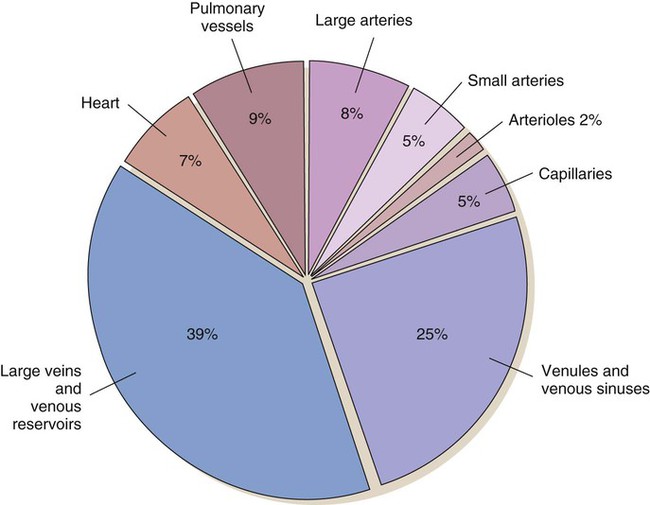
Venous System
As blood leaves the capillary system, it passes through the venules and into the veins. Venules and veins contain elastic tissue, smooth muscle, and fibrous tissue (see Fig. 12-12). The veins, however, contain a greater percentage of smooth muscle and fibrous tissue to accommodate the large venous volume and demand for reserve capacity. The majority of circulating blood is contained in the venous system. Veins are referred to as capacitance vessels (Fig. 12-19). Approximately 75% of the total blood volume is found in the veins. This enables the body to tap into a large reserve during times of need. For example, when a person changes from a supine position to a sitting position, approximately 7 to 10 mL blood per kilogram of body weight pools in the legs. Potentially, cardiac output could decrease by 20%. However, normal arterial pressure and blood flow are maintained by a combination of reflex vasoconstriction and redistribution of blood from the venous capacitance vessels. In humans, these capacitance reservoirs are greatest in the spleen, liver, and intestines. Patients with decreased blood reserves, who are dehydrated or hypovolemic, require special caution during position changes, especially from the supine position to the standing position. Before helping the patient to stand, the nurse must allow him or her to “dangle” the legs (sit on the side of the bed) to check for adequate venous reserves.
Microscopic Structure
Cardiac Fibers
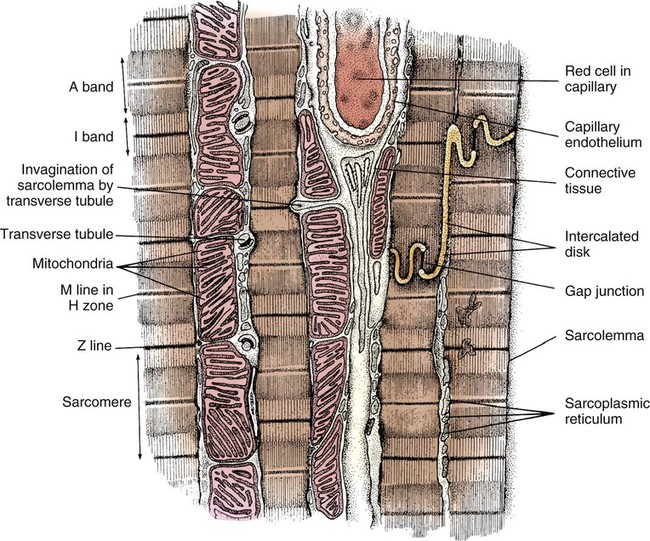
In general, cardiac myofibrils run on a longitudinal axis, and the fibers appear striped, or striated. When viewed under an electron microscope, these striations are seen to be the contractile proteins (Fig. 12-20). The areas separating each myocardial cell from its neighbor, called intercalated disks, are continuous with the sarcolemma, or cell membrane. The point at which a longitudinal branch of one cell meets the branch of another is called a tight junction (or gap junction), which is contained within the intercalated disks. These junctions offer much less impedance to electrical flow than does the sarcolemma, so depolarization occurs from one cell to another with relative ease. The cardiac muscle is a functional syncytium: depolarization initiated in any cardiac cell quickly spreads to all of the heart.
Cardiac Cells
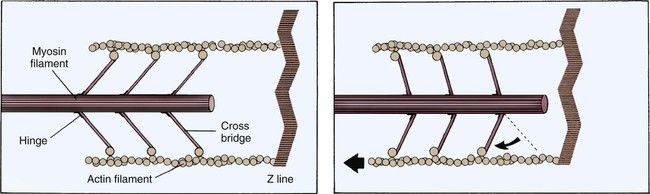
Each cardiac cell contains many intracellular proteins that contribute to contraction. Two important contractile proteins are actin and myosin. These proteins abound in the cell in organized longitudinal arrangements. Under electron microscopy, the myosin filaments appear thick, whereas the actin filaments, which are almost twice as prevalent, appear thin. The actin filaments are connected to a Z-disk on one end, leaving the other end free to interact with the myosin cross-bridges. In the resting muscle cell, actin and myosin partially overlap. Myosin has three distinct regions: 1) the head, 2) the hinge, and 3) the tail. The ends of the myosin filament that overlap with actin have tiny projections named myosin heads, which contain a binding site for actin (Fig. 12-21). For contraction to occur, myosin heads must interact with actin to form cross-bridges (see Fig. 12-21).
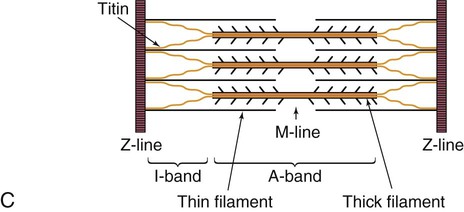
The sarcomere is the functional unit of cardiac contraction and is defined as the region between two Z-disks.24 In the normal resting state, the sarcomere is about 2 to 2.2 mm long (Fig. 12-22). Myosin filaments are situated in the middle of the sarcomere and are attached to the Z-disk of the sarcomere by the protein titan.25, 26 Each sarcomere consists of a central A-band (thick filaments) and two halves of the I-band (thin filaments), as shown in Figure 12-22C. The I-bands from two adjacent sarcomeres meet at the Z-disk. The central portion of the A-band is the M-band, which does not contain actin. Figure 12-22, C, shows the position of titin, the thin filaments and the thick filaments in the sarcomere. The thin filament is composed of the helical chains of the actin globular proteins that coil around a long filament of tropomyosin, and three regulatory troponin proteins: 1) Tn-T, 2) Tn-C, and 3) Tn-I. The troponin complex is attached to actin at regularly spaced intervals.
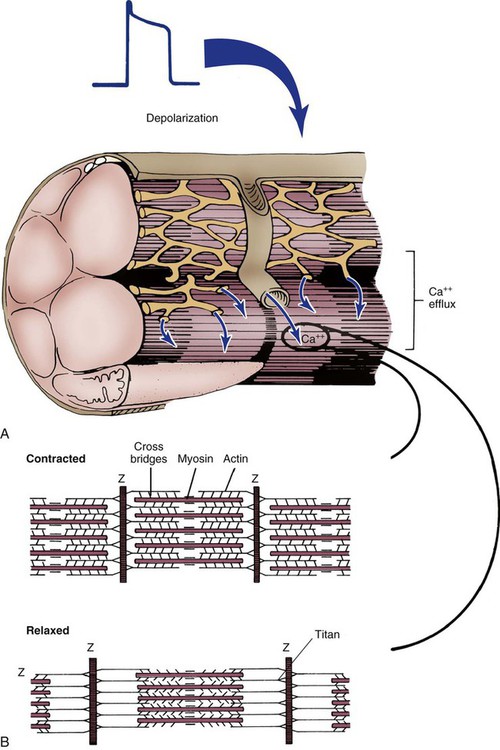
Another extremely important intracellular structure necessary for successful contraction is the sarcoplasmic reticulum. Calcium ions are stored in the in the sarcoplasmic reticulum and released for use after depolarization (see Fig. 12-22A). Deep invaginations into the sarcomere are called transverse tubules, or T-tubules.27 T-tubules are essentially an extension of the cell membrane (sarcolemma); they conduct depolarization to structures deep within the cytoplasm such as the sarcoplasmic reticulum.27 T-tubules connect to sarcomeres at the Z-disk, as shown in Figure 12-22B. The Z-disk is composed of interconnecting proteins such as alpha-actinin that link actin to the Z-disk. Cardiac cells abound with mitochondria, which contain respiratory enzymes necessary for oxidative phosphorylation (see Fig. 12-20). This enables these cells to keep up with the tremendous energy requirements of repetitive contraction. When cardiac cells are damaged by trauma or ischemia, myocardial cells release protein biomarkers such as troponin, which, when measured by laboratory analysis, can help determine the extent of injury (see Figure 15-12).
Physiology
The electrical and mechanical properties of cardiac tissue have fascinated scientists for more than 100 years. These properties include excitability, conductivity, automaticity, rhythmicity, contractility, and refractoriness. The following section relates these concepts specifically to cardiac cells (Table 12-3).
TABLE 12-3
TERMS RELATED TO CARDIAC TISSUE FUNCTION
| TERM | DEFINITION |
| Excitability | Ability of a cell or tissue to depolarize in response to a given stimulus |
| Conductivity | Ability of cardiac cells to transmit a stimulus from cell to cell |
| Automaticity | Ability of certain cells to spontaneously depolarize (“pacemaker potential”) |
| Rhythmicity | Automaticity generated at a regular rate |
| Contractility | Ability of the cardiac myofibrils to shorten in length in response to an electrical stimulus (depolarization) |
| Refractoriness | State of a cell or tissue during repolarization, when the cell or tissue cannot depolarize regardless of the intensity of the stimulus or requires a much greater stimulus than is normally required |
Electrical Activity
Transmembrane Potentials
Resting Membrane Potential
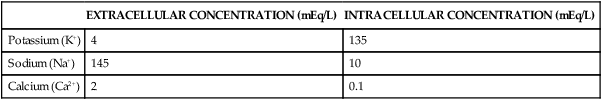
When the cell is at rest, the intracellular potassium ion (K+) concentration is very high, and the intracellular sodium ion (Na+) level is low. Conversely, the extracellular K+ concentration is relatively low compared with a high concentration of Na+ (Table 12-4). Calcium (Ca2+) has a much higher concentration outside than inside the cell when the cell is at rest. These large differences in individual ion concentrations create chemical gradients. A chemical gradient describes the tendency of an ion to move from an area of higher solute concentration to an area of lower concentration. However, an electrical gradient is also present, which causes the positively charged ions to move to an area of relative negativity. For example, the chemical gradient of K+ forces it to move out of the cell because the intracellular K+ concentration is so much higher than that of the outside medium. However, as a result of the relative negativity inside the cell (−80 to −90 mV), the electrical gradient works to retain the positively charged K+ ion. An important factor influencing both gradients is membrane permeability, or the selectivity of the membrane to ionic movements. Even at rest, some slight movement of ions occurs across the cell membrane. For example, the cell membrane is approximately 50 times more permeable to K+ than it is to Na+. Because K+ movement out of the cell results in greater negativity inside the cell, K+ is the principal ion responsible for maintaining the negative RMP.
TABLE 12-4
APPROXIMATE CONCENTRATIONS OF POTASSIUM, SODIUM, AND CALCIUM IONS IN A RESTING MYOCARDIAL CELL
| EXTRACELLULAR CONCENTRATION (mEq/L) | INTRACELLULAR CONCENTRATION (mEq/L) | |
| Potassium (K+) | 4 | 135 |
| Sodium (Na+) | 145 | 10 |
| Calcium (Ca2+) | 2 | 0.1 |
Phases of the Action Potential
In a myocardial cell, when a sudden increase in permeability of the membrane to Na+ occurs, it is followed by a rapid sequence of events that lasts a fraction of a second. This sequence of events is termed depolarization. The graphic representation of depolarization and repolarization is termed the action potential (AP) (Fig. 12-23). Ionic currents cause changes in electrical potentials, which are known as AP phases 0, 1, 2, 3, and 4. These phases give the AP a characteristic shape (Table 12-5; see Fig. 12-7).
TABLE 12-5
PHASES 0 THROUGH 4 OF A CARDIAC CELL ACTION POTENTIAL
| PHASE | DESCRIPTION | IONIC MOVEMENT | MECHANISMS |
| 0 | Upstroke | Na+ into cell | Fast Na+ channels open |
| 1 | Overshoot | — | Fast Na+ channels close |
| 2 | Plateau | Na+ and Ca2+ into cell, K+ out | Multiple channels (Ca2+, Na+, K+) open to maintain membrane voltage |
| 3 | Repolarization | K+ out of cell | Ca2+ and Na+ channels close; K+ channel remains open |
| 4 | Resting membrane potential | Na+ out, K+ in | Na+–K+ pump |
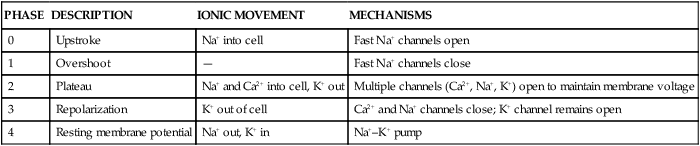
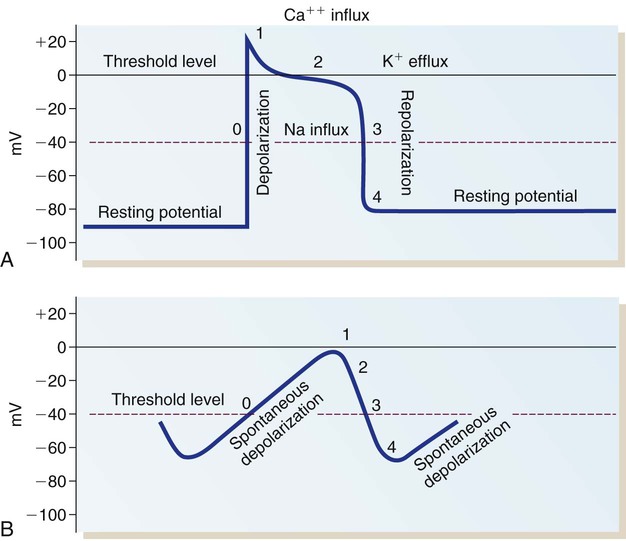
A, Action potential phases 0 to 4 of a non-pacemaker cell. B, Action potential of a pacemaker cell. (From Thompson JM, et al. Mosby’s Clinical Nursing. 5th ed. St. Louis, MO: Mosby; 2002.)
Phase 1 and Phase 2.
When the rapid influx of Na+ is terminated, a brief period of partial repolarization occurs as the AP slope returns toward zero (phase 1 of the AP). The plateau that follows is described as phase 2. During this phase, another set of channels, the slow Na+ and Ca2+ channels, open to allow the influx of Ca2+ and Na+. During phase 2, K+ tends to diffuse out of the cell, balancing the slow inward flux of Na+ and Ca2+ thereby maintaining the plateau of the AP. The Ca2+ entering the cell at this phase causes cardiac contraction, which is described later in this chapter. The inward flux of Ca2+ during this phase can be influenced by many factors. For example, calcium channel–blocking medications such as verapamil and diltiazem inhibit the inward Ca2+ current into pacemaker tissue, especially the AV node. For this reason, this class of medications is used therapeutically to slow the rate of atrial tachydysrhythmias and protect the ventricle from excessive atrial impulses, as described in the section on cardiac medications in Chapter 16.
Phase 4.
In phase 4, the AP returns to an RMP of −80 to −90 mV. The excess Na+ that entered the cell during depolarization is removed from the cell in exchange for K+ by means of the Na+–K+ pump. This mechanism returns the intracellular concentrations of Na+ and K+ to the levels present before depolarization and is essential for normal ionic balance and preparation for the next depolarization (see Table 12-5).
Fiber Conduction and Excitability.
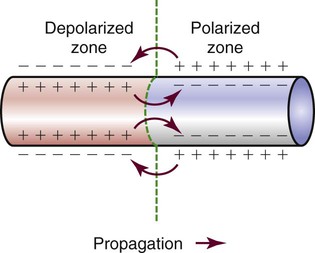
Different parts of the conduction system require different electrical currents and create individual transmembrane APs, as shown in Figure 12-7 earlier in the chapter. Ionic shifts within the endocardium, myocardium, and epicardium are not uniform, although the clinical significance of this finding is not clear. Propagation of an AP along a cardiac fiber occurs as a result of ionic shifts (discussed earlier). As a local section of the cell becomes depolarized, reaches threshold, and completely depolarizes, it affects the adjacent area of the cell and initiates depolarization in that area. The AP propagates down the fiber in a wavelike fashion (Fig. 12-24). This is somewhat analogous to a trail of gunpowder. When the gunpowder is lit at one end, a small area ignites, burns, and then ignites the area of gunpowder immediately adjacent to it and on down the line.
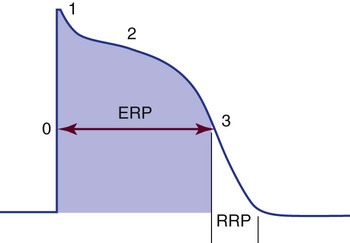
The time from the beginning of the AP until the fiber can accept another AP is called the effective or absolute refractory period. During this period, the cell cannot be depolarized regardless of the amount or intensity of the stimulus. This period lasts from the beginning of depolarization until the interior of the cell has repolarized to approximately −50 mV during phase 3. The absolute refractory period is immediately followed by the relative refractory period. At this time, the cell is not fully repolarized but could depolarize with a strong enough stimulus (Fig. 12-25). This period lasts from approximately −50 mV during phase 3 until the cell returns to RMP (phase 4); at that point, the cell is fully repolarized and is again ready to respond to the next stimulus. The concept of relative versus absolute refractory periods is useful for understanding the genesis of ventricular dysrhythmias (see Chapter 14). In brief, a cell cannot be stimulated to depolarize until it has at least partially recovered from the previous impulse. This means that an ectopic impulse cannot be propagated during the absolute refractory period.
Pacemaker Cell versus Non-pacemaker Cell Action Potentials.
The AP is representative of the depolarization of non-pacemaker myocardial cells. The AP generated by a Purkinje fiber is similar to that of a ventricular myocardial cell except that phase 2 is usually more prolonged in the Purkinje fiber. Atrial myocardial cells exhibit a shortened plateau (phase 2) compared with ventricular cells. The pacemaker cells of the SA node have an AP that is very different from that of a myocardial cell or a Purkinje cell. In the SA node, the RMP is not as negative, approximately −65 mV. Rather than having an RMP that remains constant, the pacemaker cells slowly depolarize at a steady rate until the threshold is reached (see Fig. 12-23B). The lack of a steady-state RMP is largely the result of a continual Na+ influx through the slow channels. This mechanism explains how the cells can spontaneously depolarize (automaticity). It also provides the basis for understanding alterations in the pacemaker cells. The frequency of pacemaker cell discharge may be altered by changing the rate of depolarization or by raising or lowering the cellular RMP.
Cardiac Cycle
Isovolumic Contraction
Ventricular depolarization from the QRS electrical stimulus depolarizes the septum and papillary muscles first. The ventricles then begin to tense, starting with the inner endocardium and traversing the myocardium toward the outer epicardium. This increases the pressure within the ventricular chambers. This is known as isovolumic contraction, because even though the ventricular muscle is contracting, the volume of blood within the ventricles does not change. In Figure 12-26, this is seen as a rapid rise in left ventricular pressure.
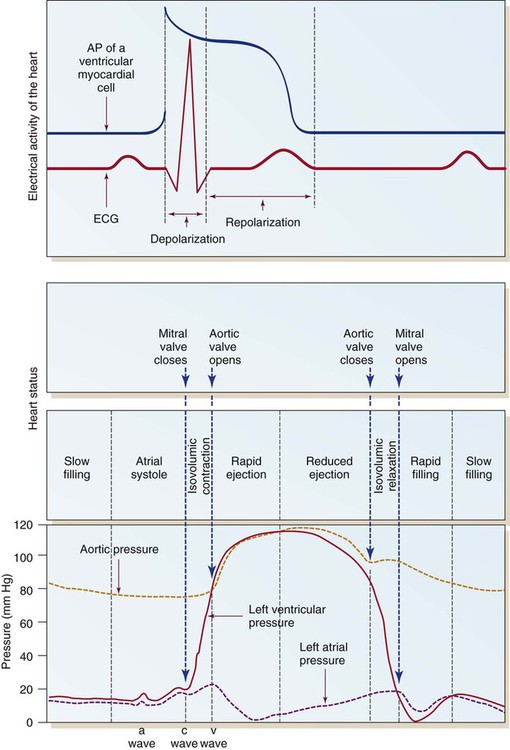
Ventricular Diastole
Once the AV valves open, the majority of ventricular filling occurs. The next phase is a reduced ventricular filling period, during which blood flows passively from the periphery and the pulmonary vasculature into the ventricles. The last part of ventricular diastolic filling occurs during atrial contraction, also described as atrial kick. This provides approximately 20% of total ventricular filling in normal sinus rhythm. With this, the cycle is complete and ready to begin once again with atrial systole (see Fig. 12-26).
Interplay of the Heart and Vessels: Cardiac Output
< ?xml:namespace prefix = "mml" />

CO is usually expressed in liters per minute (L/min). Normal CO in the human adult is approximately 4 to 8 L/min; it is approximately 4 to 6 L/min at rest and increases with exercise. CO can be made specific to body size by using the person’s height and weight to determine the cardiac index (CI). The CI is equal to CO divided by the individual’s body surface area (BSA) calculated from the height and weight. BSA is expressed in square meters (m2), the normal range is 2.5 to 4.5 L/min/m2. Changes in SV or HR can change CO. However, all three parameters must be individually assessed as described in the section hemodynamics in Chapter 14.
For example, for a person with an HR of 72 and an SV of 70 mL, the CI would be:

If the HR were to change to 140 and the SV to 40 mL in this person, the calculation would be:

Even though CO is higher, clearly the faster HR would not be an improvement in this situation. The decreased SV in the second instance indicates that cardiac decompensation is imminent. SV as a value is influenced by three primary factors: 1) preload, 2) afterload, and 3) contractility (Fig. 12-27).
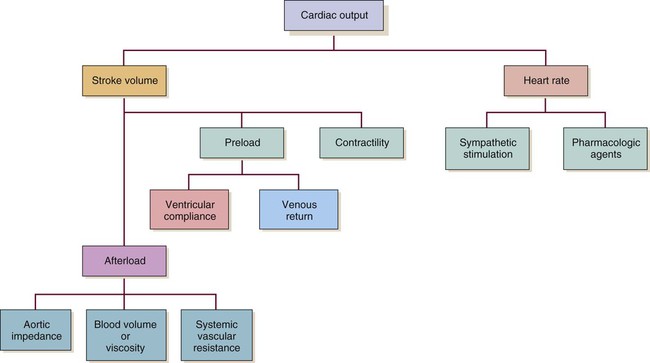
Preload
The concept of preload was introduced in the early 1900s when Ernest Starling described his findings in an isolated canine heart preparation. Starling found that as he increased the volume infused into a denervated heart, CO increased, until it reached a point at which further infusion caused CO to decrease. This has become known as Starling’s law of the heart, and it is graphically described as the Starling curve (Fig. 12-28). It can best be described on a molecular basis, using as a foundation the discussion of the actin and myosin cross-bridges in the myofibril. As the diastolic volume increases, it stretches the actin and myosin molecules in their resting state. As contraction occurs, contractility increases as a result of the increased stretch. However, if the stretch is excessive and causes actin and myosin to be stretched beyond their cross-bridging limits (>2.2 mm), contractility decreases. This is the basis for Starling’s curve. With the advent of intensive care units and sophisticated monitoring, this principle has acquired great significance in clinical practice. For example, after an MI, the ability of the left ventricle to pump may be impaired. It is desirable to optimize the contractility of the remaining viable heart muscle by “stretching” it with added volume. However, if the intravascular volume exceeds the stretch limit, CO diminishes.
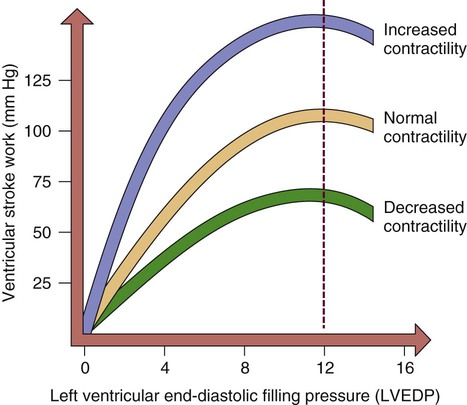
As the left ventricular end-diastolic pressure (LVEDP) increases, so does ventricular stroke work or contractility. When left ventricular filling pressure exceeds a maximal point, contractility and cardiac output diminish.
Preload, then, is the volume of blood in the left ventricle at the end of diastole. The pressure created by this volume is described as the left ventricular end-diastolic pressure (LVEDP). Factors affecting left ventricular preload include venous return to the heart, total blood volume, and atrial kick. Factors affecting the compliance (ability to stretch) of the ventricles are the stiffness and the thickness of the muscular wall. For example, the hypovolemic patient has too little preload, whereas the patient with heart failure has too much preload. One way to measure preload is through pulmonary artery occlusion pressure (PAOP). This value was previously known as pulmonary arterial wedge pressure (PAWP) or the pulmonary capillary wedge pressure (PCWP). Clinical application of PAOP is discussed in Chapter 14.
Contractility
Contractility refers to the heart’s contractile force. Also known as inotropy (ino [“strength”] and tropy [“enhancing”]), it can be positive (i.e., stronger contraction) or negative (i.e., weaker contraction). Contractility can be increased by Starling’s mechanism. It also is altered by the SNS and by pharmacologic agents that mimic the SNS (i.e., sympathomimetics) (see Fig. 12-27).
Regulation of the Heartbeat
Nervous Control
The autonomic nervous system (ANS) is composed of two competing neurologic systems of control. The parasympathetic nervous system (PNS) and the SNS operate to create a balance and homeostasis between relaxation and fight-or-flight readiness. They affect cardiovascular function by slowing HR during periods of calm and increasing it in response to sympathetic stimulation.23 Table 12-6 summarizes the effects of these divisions of the ANS on the heart.
TABLE 12-6
SUMMARY OF THE EFFECTS OF THE PARASYMPATHETIC AND SYMPATHETIC NERVOUS SYSTEMS ON THE HEART
| FUNCTION | PARASYMPATHETIC | SYMPATHETIC |
| Automaticity | Decrease | Increase |
| Contractility | Decrease | Increase |
| Conduction velocity | Decrease | Increase |
| Chronotropy (rate) | Decrease | Increase |
Parasympathetic fibers are concentrated near the SA and AV conduction tissue and in the atria.23 Specifically, this involves the right and left vagus nerves (Fig. 12-29). Stimulation of the vagus nerve produces bradycardia as a result of hyperpolarization of phase 4 of the AP, which causes the slope to take longer to reach the threshold. Sympathetic tone concomitantly decreases.
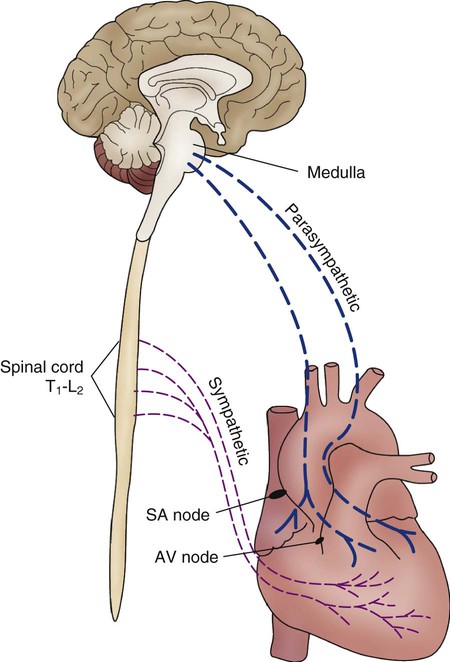
Sympathetic nerve fibers are subepicardial and follow the path of the major coronary arteries.28 When stimulated, sympathetic fibers directly alter ventricular function and increase HR and contractility.
Intrinsic Regulation
Baroreceptors.
Baroreceptors, or pressure sensors, are located in the aortic arch and the carotid sinuses.29 They are more sensitive to wall changes (wall stretch) in these areas than to the absolute pressure. As the receptors sense a change in wall conformation, usually as a result of a change in pressure, the ANS is activated to raise HR (in the case of decreased pressure) or lower it (in response to increased pressure). For example, a decrease in blood pressure alters the baroreceptor input to the vasomotor center in the medulla (brainstem), causing a reflex tachycardia. The baroreflex also initiates changes in venous tone to alter CO according to need. Venoconstriction increases blood return to the heart and augments SV.
Chemoreceptors.
The arterial chemoreceptors, or carotid and aortic bodies, are located in the carotid arteries and at the bifurcation of the aortic arch.30 They possess a rich capillary blood supply and extensive innervation of the PNS. Their primary function is to maintain homeostasis during hypoxemia.30 Chemoreceptors signal changes in oxygen tension (Pao2 <80 mm Hg), or a carbon dioxide tension (Paco2) of greater than 40 mm Hg, but not to changes in acid–base balance (pH). Changes in the pH level are detected by the central chemoreceptors in the brainstem (medulla oblongata). Information about changes in these parameters is communicated to the SNS via the brainstem altering HR. Stimulation of the carotid or aortic chemoreceptors normally causes an increase in respiratory rate and depth.
Right Atrial Receptors.
The Bainbridge reflex is attributed to receptors in the right and left atria.31 When the pressure in the right atrium rises sufficiently to stimulate the stretch receptors, it causes a reflex tachycardia. The purpose of this reflex is possibly to protect the right side of the heart from an overload state and to quickly equalize filling pressures of the right and left sides of the heart.
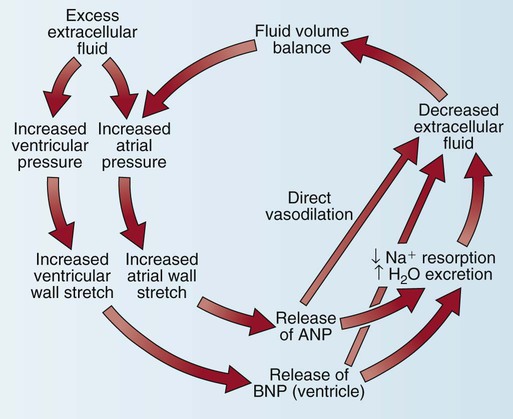
Natriuretic Peptides.
Another cardiac control mechanism involves the natriuretic peptide system (Fig. 12-30). The heart secretes two major natriuretic peptides. The atrial myocardium secretes atrial natriuretic peptide (ANP) in response to atrial stretch, and the ventricular myocardium secretes brain natriuretic peptide (BNP) if stretch of the ventricular chamber occurs. Both peptides cause vasodilatation, increase natriuresis (Na+ and water loss via the kidneys), and inhibit the SNS and the renin–angiotensin–aldosterone system (RAAS).32 Clinically, BNP levels are measured to confirm the diagnosis of acute heart failure. A recombinant form of human BNP, nesiritide (Natrecor), is used therapeutically to mimic the clinical effects of BNP and treat symptoms of heart failure.
Renin–Angiotensin–Aldosterone System.
The RAAS system is activated by low blood pressure or intravascular volume depletion. The juxtaglomerular cells of the kidney, located near the afferent arteriole, are activated by low renal blood flow. As shown in Table 12-7, this stimulates release of the hormone renin. Renin converts the protein angiotensinogen to angiotensin I. When angiotensin I passes through the pulmonary vascular bed, it is activated by angiotensin-converting enzyme (ACE) to become angiotensin II. Angiotensin II is a powerful agent with two principal actions: 1) It activates peripheral vascular receptors to vasoconstrict the systemic arterial system and increase blood pressure, and 2) it activates the release of aldosterone from the adrenal glands. Aldosterone works at the distal convoluted tubule in the kidney to retain sodium and, consequently, water. Many medications are used to manipulate the RAAS system to manage symptoms of heart failure (see “Heart Failure” in Chapter 15 and “Cardiac Medications” in Chapter 16).
TABLE 12-7
| HORMONE | EFFECT* |
| Renin ↓ | Reduction in vascular volume or low arterial blood pressure stimulates renin release from juxtaglomerular cells near the kidney. |
| Angiotensinogen ↓ | Angiotensinogen is produced in the liver. |
| Angiotensin I ↓ | Lungs release ACE to convert angiotensin I to angiotensin II. |
| Angiotensin II ↓ | Angiotensin II activates peripheral vascular receptors to increase SVR and raise arterial blood pressure. Angiotensin II release also stimulates adrenal glands to release aldosterone. |
| ADH is released from the posterior pituitary when angiotensin II causes constriction of the renal arterioles and when the hypothalamus detects intracellular dehydration. | |
| Aldosterone | Aldosterone acts on the kidney distal tubules to retain sodium; when salt is retained, so is water. |
ACE, Angiotensin-converting enzyme; ADH, antidiuretic hormone; SVR, systemic vascular resistance.
*Overall effect is to increase intravascular volume and raise blood pressure.
Respiratory Influences.
Other influences involve the respiratory cycle and its effect on HR and SV. Normally, HR varies slightly with the respiratory cycle. The heart usually accelerates on inspiration and decelerates with exhalation (see “Sinus Dysrhythmia” in Chapter 14). Left ventricular SV decreases during normal inspiration. Possible reasons include normal fluctuations in sympathetic and vagal tones during respiration or any of the following alterations: decreased intrathoracic pressure contributing to increased venous return; the Bainbridge reflex; activation of stretch receptors in the lungs; interactions between the respiratory and cardiac centers in the medulla; increased capacity of the pulmonary vessels during lung inflation; decreased left ventricular compliance resulting from increased right ventricular return; increased impedance to left ventricular outflow related to the pleural pressure changes; or neural reflex mechanisms that are independent of mechanical influences.
Control of Peripheral Circulation
Intrinsic Control
Intrinsic, or local, control of the arterial peripheral circulation is most influential at the arteriolar level. Arterioles are the major resistance vessels because of the amount of smooth muscle in the vessel walls (see Fig. 12-12). The arteriole has the potential for increasing or decreasing its lumen substantially. Several local factors influence this balance, including pharmacologic stimuli from locally released catecholamines, histamine, acetylcholine, serotonin, angiotensin, adenosine, and prostaglandins. These agents can be induced by a variety of mechanisms such as tissue injury, hypoxemia, or hormones. Other factors that influence circulation locally are temperature and carbon dioxide.
Extrinsic Control
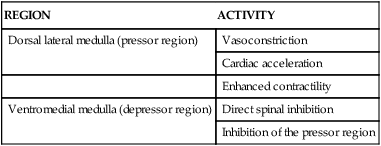
Capacitance vessels (veins) contain up to 75% of the blood volume. Increases in venous tone (venoconstriction) increase the volume of blood returning to the right side of the heart and augment SV. The most richly innervated venous beds are those in splanchnic (spleen) and cutaneous (skin) circulations. The venous and arterial vascular systems are interdependent; they dilate and constrict in unison. One does not act without the other. Table 12-8 summarizes the sympathetic receptors, including location and effects of stimulation.
TABLE 12-8
REGIONS IN THE MEDULLA THAT AFFECT CARDIOVASCULAR ACTIVITY
| REGION | ACTIVITY |
| Dorsal lateral medulla (pressor region) | Vasoconstriction |
| Cardiac acceleration | |
| Enhanced contractility | |
| Ventromedial medulla (depressor region) | Direct spinal inhibition |
| Inhibition of the pressor region |
Summary
• Knowledge of normal cardiovascular anatomy and physiology is vital for a complete understanding of the changes that occur in cardiac disease states.
• The major anatomic structures of the heart include the pericardium, myocardium, endocardium, coronary arteries, coronary veins, atria, ventricles, heart valves, and electrical conduction system.
• The electrical conduction system, the mechanical events of the cardiac cycle, the autonomic nervous system, and the preload volume in the veins act synergistically to ensure optimal cardiac output and hemodynamic stability in a state of health.
[/level-membership-for-critical-care-medicine-category][not-level-membership-for-critical-care-medicine-category]
Cardiovascular Anatomy and Physiology
Anatomy
Macroscopic Structure
Structures of the Heart
The heart is situated in the anterior thoracic cavity, just behind the sternum (Fig. 12-1). Several important structures, including the esophagus, the aorta, the vena cava, and the vertebral column, are located behind the heart. The position of the heart within the chest cavity is such that the chambers normally described as “right” and “left” are, in fact, anterior and posterior.1 The right ventricle constitutes the majority of the anterior surface (closest to the chest wall) and also the inferior surface (directly above the diaphragm). The left ventricle makes up the anterolateral (front and side) and posterior surfaces. The base of the heart is superior (atrial and great vessel level), and the tip (apex) is inferior (ventricular level), above the diaphragm. The base of the heart includes not only the superior portion of the heart itself but also the roots of the aorta, the vena cava, and pulmonary vessels.
The increasing use of thoracic computed tomography in critical care has highlighted the anatomic inaccuracy of the terms right ventricle and left ventricle because these terms do not relate to the position of the heart in the chest when described in the standard anatomic position (i.e., upright and facing the observer).1–3 Despite discussion of these differences, the impetus to change the traditional nomenclature is lacking.
Layers of the Heart
Pericardium.
The heart and the origins of the great vessels are surrounded and enclosed by the pericardium. The outermost fibrous pericardium is a thick envelope that is tough and inelastic. Ligaments anchor the outer pericardium to the diaphragm and the great vessels such that the heart is maintained in a fixed position within the thoracic cavity. The pericardium also provides a physical barrier to infection. Inside the fibrous layer is an inner, double-walled membrane described as the serous pericardium.4 The two layers are labeled “parietal” and “visceral.” The parietal pericardium adheres to the tough, outer pericardium. The visceral pericardium is flexible, adheres directly to the heart, and folds with the surface contours of the heart. The pericardial cavity is the potential space between the visceral and parietal layers.4,5 The space between these two layers normally contains a small amount of pericardial fluid, which is secreted, resorbed, and serves as a lubricant between the layers so that the heart can move without friction.5 The fibrous, outer pericardial sac is noncompliant and unable to adapt to rapid increases in pericardial fluid.5 For example, blood can collect in this sac in cardiac tamponade, or serum can collect in pericardial effusion. If the fluid collection in the sac impinges on ventricular filling, ventricular ejection, or coronary artery perfusion, removal of the excess pericardial fluid may be necessary, a procedure known as pericardiocentesis.5 The phrenic nerve provides sensory fibers to the pericardium. The pain that accompanies pericardial effusion and cardiac tamponade is sensed via phrenic nerve innervation.5
Epicardial Fat.
In adults, a layer of adipose tissue is typically present beneath the visceral pericardium and may surround the heart. This epicardial fat accumulates along the routes of the major coronary arteries and veins. Autopsy data indicate that epicardial fat increases until age 20 to 40 years, but thereafter, the quantity does not depend on age.6 Epicardial fat covers 80% of the surface of the heart and constitutes about 20% of the total weight of the heart, with the largest quantity positioned over the right ventricle.6 If a person is overweight or obese with a large quantity of visceral and subcutaneous adipose tissue, usually more epicardial fat is present.7 Because obesity is endemic in modern society, epicardial fat is receiving more attention. Epicardial fat is hypothesized to increase the risk of coronary artery disease (CAD) because it contains smaller adipocytes compared with other fat deposits, has a different fatty acid composition, and has a higher protein content. This composition facilitates the infiltration of free fatty acids and adipokines into coronary arteries.8 The fibrous, outer pericardium does not contain any fat deposits.
Myocardium.
The next layer of the heart is the myocardium, a thick, muscular layer. This layer includes all of the atrial and ventricular muscle fibers necessary for contraction. The fibers of the myocardium do not have the same thickness throughout the ventricular walls. The left ventricle is much thicker than the right ventricle or the atria. The fibers are organized in such a manner that the force of contraction is most efficient in ejecting blood toward the outflow tracts in a wringing motion from the apex toward the base (Fig. 12-2).9 The myocardium is the muscle that is damaged by a “heart attack” or transmural myocardial infarction (MI).
Cardiac Chambers
The human heart has four chambers: the left and right atria and the left and right ventricles. The atria are thin-walled and normally low-pressure chambers. They function to receive blood from the vena cavae and pulmonary arteries and to pump blood into their respective ventricles. Atrial contraction, also known as atrial kick, contributes approximately 20% of blood flow to ventricular filling; the other 80% occurs passively during diastole. The ventricles are the primary pumping chambers of the heart. The healthy left ventricle is about 10 to 13 mm thick, and the interior chamber appears round in cross-section.10 The healthy right ventricle is approximately 3 mm thick, appears to have a triangular shape when viewed from the side, and has a crescent shape when viewed in cross-section (Fig. 12-3). The right ventricle pumps blood into the low-pressured pulmonary circulation, which has a normal mean pressure of approximately 15 mm Hg. The left ventricle must generate tremendous force to eject blood into the aorta (normal mean pressure of approximately 100 mm Hg). Because of left ventricular wall thickness and the large force it must generate, the left ventricle is considered the major pump of the heart. When the left ventricular muscle is damaged from cardiomyopathy or infarction, the effective pumping pressure is diminished, leading to increased left atrial pressure, pulmonary vasculature congestion, and ultimately, systemic venous congestion.
The right ventricle forms the greater part of the anterior surface of the heart, and the wall of the left ventricle is three times as thick as the wall of the right ventricle. (From Quaal S. Comprehensive Intraaortic Balloon Pumping. 2nd ed. St. Louis, MO: Mosby; 1993.)
Cardiac Valves
Cardiac valves are composed of flexible, fibrous tissue. A normal valve has the translucent appearance of a rose petal. The valve structure allows blood to flow in only one direction. The opening and closing of the valves depends on the relative pressure gradients on either side of the valve. The four cardiac valves lie in an oblique plane of collagen described as the fibrous skeleton. Four adjacent rings of connective tissue contain and support the cardiac valves (Fig. 12-4).
Note the position of the four cardiac valves. (From Thompson JM, et al. Mosby’s Clinical Nursing. 5th ed. St. Louis, MO: Mosby; 2002.)
Atrioventricular Valves.
The two atrioventricular (AV) valves are named for their location between the atria and the ventricles. These are the tricuspid valve on the right and the mitral valve on the left. The mitral valve is described as having two leaflets, although the “leaflets” are a continuous, noninterrupted structure.11 The AV valves are open during ventricular diastole (filling) and prevent backflow of blood into the atria during ventricular systole (contraction). The chordae tendineae and papillary muscles, which attach to the tricuspid and mitral valves, give the valves stability and prevent valve leaflet eversion during systole (Fig. 12-5). Papillary muscles arise from the ventricular myocardium and derive their blood supply from the coronary arteries. Each papillary muscle gives rise to approximately 4 to 10 main chordae tendineae, which divide into increasingly finer cords as they approach and attach to the valve leaflets. The chordae tendineae are fibrous, avascular structures covered by a thin layer of endocardium. Dysfunction of the chordae tendineae or of a papillary muscle may cause incomplete closure of an AV valve, which results in backflow of blood into the atrium. Degenerative disease of the valve leaflets is another cause of regurgitation of blood into the atrium.12 Valvular regurgitation produces a murmur that can be auscultated with a stethoscope.
Semilunar Valves.
The semilunar valves are pulmonic and aortic valves. Each valve has three cuplike leaflets (Fig. 12-6). These valves separate the ventricles from their respective outflow arteries (Table 12-1). During ventricular systole (contraction), semilunar valves open, allowing blood to flow out of the ventricles. As systole ends and the pressure in the outflow arteries exceeds that of the ventricles, the semilunar valves close, preventing blood regurgitation back into the ventricles. In most individuals, the aortic valve has three leaflets. In less than 1% of the population, it is bicuspid (a two-leaflet valve), which increases susceptibility to aortic valve failure over time.13,14 Aortic valve dysfunction, from any cause, not only affects the valve leaflets but also pathologically alters the shape of the left ventricle.
TABLE 12-1
CARDIAC VALVES AND THEIR LOCATIONS
| VALVE | TYPE | SITUATED BETWEEN |
| Tricuspid | Atrioventricular | Right atrium and right ventricle |
| Pulmonic | Semilunar | Right ventricle and pulmonary artery |
| Mitral | Atrioventricular | Left atrium and left ventricle |
| Aortic | Semilunar | Left ventricle and aorta |
Conduction System
To analyze electrical activity within the heart, it is helpful to understand the three main areas of impulse propagation and conduction: 1) the sinoatrial (SA) node, 2) the AV node, and 3) the conduction fibers within the ventricle, specifically the bundle of His, the bundle branches, and the Purkinje fibers.15
Sinoatrial Node.
The SA node is considered the natural pacemaker of the heart because it has the highest degree of automaticity, producing the fastest intrinsic heart rate (Table 12-2). The node is a spindle-shaped structure located near the entrance of the superior vena cava, on the posterior aspect of the right atrium. Some normal variability in the position and shape of the node exists. The SA node is supplied from the right coronary system in 63% of people and from the left coronary system in 37%.16 The SA node contains two types of cells, the specialized pacemaker cells found in the node center and the border zone cells. Both cell types have inherent pacemaker properties (they automatically depolarize 60 to 100 times per minute). The cells in the nodal center are responsible for the pace making of the heart, whereas the intrinsic depolarization capability of the fibers in the border zone is depressed by surrounding atrial tissue.
TABLE 12-2
INTRINSIC PACEMAKER RATES OF CARDIAC CONDUCTION TISSUE
| LOCATION | RATE (BEATS/MIN) |
| Sinoatrial (SA) node | 60-100 |
| Atrioventricular (AV) node | 40-60 |
| Purkinje fibers | 15-40 |
Once the center nodal cells depolarize, the impulse is conducted through the nodal border zone toward the atrium. Atrial depolarization occurs cell to cell. Some anatomists postulate that specialized conduction pathways exit the SA node (Fig. 12-7A). These internodal pathways are directed to the AV node.17 An intra-atrial conduction pathway, known as Bachmann’s bundle, travels from the right atrium to the left atrium.18,19
Atrioventricular Node.
The AV node is located posteriorly on the right side of the interatrial septum, on the floor of the right atrium.20 The AV node receives its blood supply from the first posterior septal branch of the right (90%) or left (10%) coronary artery.16 Because the atria and ventricles are separated by nonconductive tissue, electrical impulses initiated in the atria are conducted to the ventricles only via the AV node. The AV node performs four essential functions to support cardiac conduction:
1. The AV node delays the conduction impulse from the atria (0.8 to 1.2 seconds) to provide time for the ventricles to fill during diastole.
2. The AV node controls the number of impulses that are transmitted from the atria to the ventricles. This prevents rapid irregular atrial heart rhythms from destabilizing the ventricular rhythm.
3. The AV node acts as a backup pacemaker if the faster SA node fails. Normally, the intrinsic AV nodal rate is slower than the SA nodal rate (see Table 12-2). When an impulse from the SA node arrives at the AV node, AV nodal tissue becomes depolarized, and the AV nodal pacemaker timing is reset (see Fig. 12-7B). This prevents the AV node from initiating its own pacemaker impulse that would compete with the SA node.
4. The AV node can conduct retrograde (backward) impulses through the node. If the SA and AV pacemaker cells fail to fire, an electrical impulse may be initiated in the ventricles and conducted backward via the AV node. Retrograde conduction time is usually longer than antegrade (forward) conduction.
Bundle of His, Bundle Branches, and Purkinje Fibers.
Electrical impulses are conducted in the ventricles through the bundle of His, the bundle branches, and the Purkinje fibers (see Fig. 12-7C). These structures run through the subendocardium, down the right side of the interventricular septum. About 12 mm from the AV node, the bundle of His divides into the right and left bundle branches. The right bundle branch continues down the right side of the interventricular septum toward the right apex. The left bundle branch is thicker than the right and takes off from the bundle of His at an almost right angle. It traverses the septum to the subendocardial surface of the left interventricular wall, where it divides into a thin anterior branch and a thick posterior branch. Functionally, when one of the left branches is blocked, it is referred to as a hemiblock. All of the bundle branches are subject to conduction defects (bundle branch blocks) that give rise to characteristic changes in the 12-lead electrocardiogram (ECG).
The right bundle branch and the two divisions of the left bundle branch eventually divide into the Purkinje fibers, which have the fastest conduction velocity of all heart tissue. Purkinje fibers divide many times, terminating in the subendocardial surface of both ventricles. This is followed by ventricular muscle depolarization (see Fig. 12-7D).
Coronary Blood Supply
The coronary circulation consists of those vessels that supply the heart structures with oxygenated blood (coronary arteries) and then return the blood to the general circulation (coronary veins). The right and left coronary arteries arise at the base of the aorta, immediately above the aortic valve (Fig. 12-8).21 They then traverse the outside of the heart, above the epicardium, in the natural grooves (sulci) between the chambers. To perfuse the thick heart muscle, branches from these main arteries arise at acute angles, penetrating the muscular wall and eventually feeding the endocardium (Fig. 12-9).21
A, Epicardial arteries arise at acute angles from main coronary vessels to supply the epicardial surface of the heart. B, Smaller vessels branch at oblique angles from main coronary vessels that penetrate deeper into the myocardium and endocardium (intramural arteries). (Redrawn from Quaal S. Comprehensive Intraaortic Balloon Pumping. 2nd ed. St. Louis, MO: Mosby; 1993.)
The right coronary artery (RCA) serves the right atrium and the right ventricle in most people. In 63% of the population, the sinus node artery, which supplies the SA node, arises from the RCA.16 The AV node is supplied via the RCA in 90% of the population.16 The term dominant coronary artery is used to describe the artery that supplies the posterior part of the heart. In most people, the RCA is dominant, supplying the posterior cardiac wall.21
The left coronary artery is a short but important artery that divides into two large arteries—the left anterior descending (LAD) and the circumflex (Cx) arteries. These vessels serve the left atrium and most of the left ventricle (Fig. 12-10). The LAD artery travels in the sulcus over the anterior intraventricular septum. Septal perforator branches branch off at right angles to provide blood supply to the intraventricular septum.21
Coronary Veins.
The cardiac (coronary) veins, which carry deoxygenated blood, are adjacent to the paths of the coronary arteries, with one significant difference. The coronary veins ultimately join together to become the coronary sinus (the largest cardiac vein), which primarily empties into the back of the right atrium. The coronary venous blood then mixes with the systemic venous blood in the right atrium.22
Physiologic Cardiac Shunts.
An example of an abnormal, or pathologic, intracardiac shunt is an opening in the ventricular septum, between the left and right sides of the heart. In the ventricle, this septal opening, called a ventricular septal defect (VSD), allows mixing of blood from both ventricles. The clinical impact depends on the size of the intracardiac shunt. A VSD is a congenital opening between the ventricles; a ventricular septal rupture (VSR) can occur as a complication of a large anterior-wall MI, as shown in Figure 15-15.
Major Cardiac Vessels
Aorta
The aorta is the largest artery in the body. It carries oxygenated blood from the left ventricle to the rest of the body. The aorta is separated from the left ventricle by the aortic valve. Just above the aortic valve are two small openings that represent the origins of the right and left coronary arterial systems (see Fig. 12-8). These opening are known by several names, including the coronary ostia and the sinus of Valsalva.
Pulmonary Veins
The four pulmonary veins return oxygenated blood from the lungs to the left atrium. These are the only veins in the body that carry oxygenated blood. The veins drain into the back wall of the left atrium (see Fig. 12-10). No valves inhibit the flow of blood into the left atrium. Blood flow is accomplished by simple hydrostatic pressure gradients. The pressure must be lower in the left atrium than in the pulmonary circulation for flow to occur in a forward direction.
Systemic Circulation
Arterial System.
Arteries are constructed of three layers (Fig. 12-11): 1) The adventitia, the outermost layer, is composed largely of a connective tissue coat to provide strength and shape to the vessel; 2) the media, or muscular middle layer, is made up of smooth muscle and elastic tissue. The muscular layer changes the lumen diameter when necessary; and 3) the innermost layer, or intima, consists of a thin lining of endothelium and a small amount of elastic tissue. The smooth endothelial lining decreases resistance to blood flow and minimizes opportunity for platelet aggregation.
The intimal and the adventitial layers remain relatively constant in the vascular system, whereas the elastin and smooth muscle in the media vary in proportion, depending on the size and type of the vessel. The aorta contains the greatest amount of elastic tissue. This is necessary because of the sudden shifts in pressure created by the left ventricle. The arterioles, or smaller arteries, and precapillary sphincters have more smooth muscle than do the larger arteries and aorta because they function to change the luminal diameter when regulating blood pressure and blood flow to tissues (Fig. 12-12).
Blood Flow and Blood Pressure.
The pulsatile nature of arterial flow is caused by intermittent cardiac ejection and the stretch of the ascending aorta. The pressure wave initiated by left ventricular ejection (Fig. 12-13) travels considerably faster than does blood itself. When an examiner palpates a pulse, it is the propagation of the pressure wave that is perceived.
[/not-level-membership-for-critical-care-medicine-category]
