Chapter 5 Cardiac Testing
Patients presenting for heart surgery have usually undergone a number of cardiac investigations preoperatively. In this chapter, the indications, principles, and interpretations of common preoperative cardiac investigations are discussed. Chest radiography and echocardiography are discussed in Chapters 6 and Chapter 7, respectively.
ANGIOGRAPHY OF THE CORONARY ARTERIES AND LEFT VENTRICLE
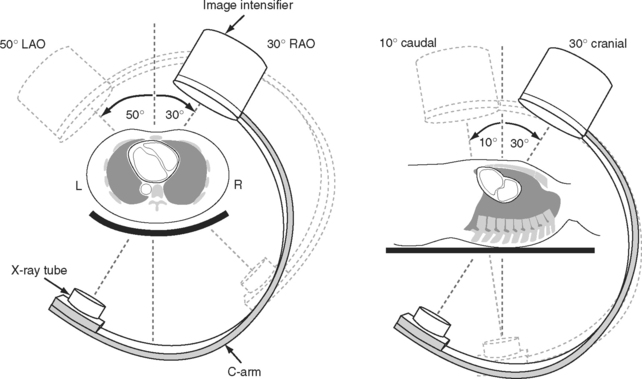
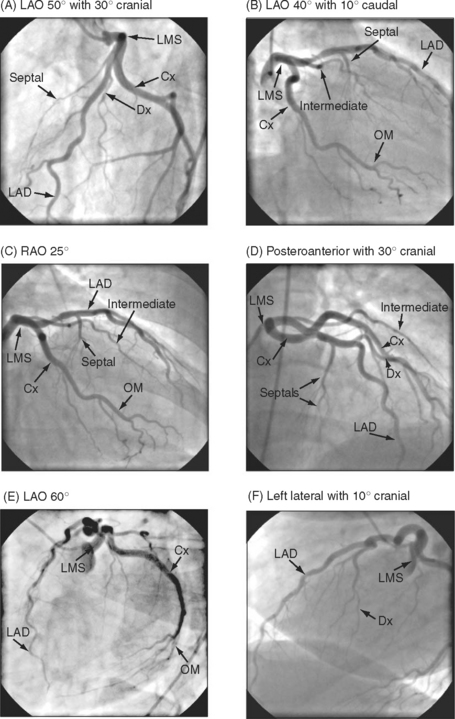
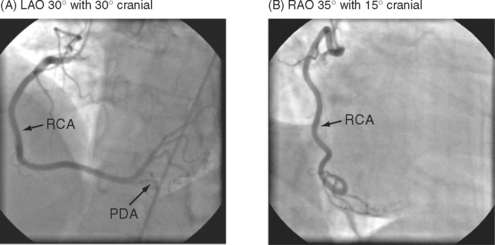
The complex and overlapping nature of the coronary anatomy necessitates image acquisition from a variety of angles to ensure complete visualization. The relationship between the patient, the x-ray tube, and the image intensifier during coronary angiography is shown in Figure 5-1. Images of normal coronary arteries obtained from some of the standard angiographic projections are shown in Figures 5-2 and 5-3.
Coronary Anatomy
The anatomy of the coronary circulation varies among individuals but most patients have similar distributions of the major epicardial vessels. The left main-stem coronary artery arises from the left coronary sinus and divides after a short distance into the left anterior descending (LAD) and the left circumflex coronary arteries. Occasionally, the circumflex coronary artery arises directly from the right coronary sinus, adjacent to the right coronary artery (RCA). The LAD coronary artery (see Fig. 5-2) runs along the surface of the interventricular septum, passing anteriorly, inferiorly, and to the left in the anterior interventricular groove. It usually terminates a short distance beyond the apex, having turned onto the inferior surface of the heart in the posterior interventricular groove. The LAD coronary artery gives rise to septal branches that pass into the substance of the anterior interventricular septum, supplying the majority of this structure. The LAD coronary artery also gives rise to branches to the anterior (or diagonal) surface of the left ventricle, known as diagonal branches (see Fig. 5-2A, 5-2F). The number, size, and point of origin from the LAD coronary artery of the septal and diagonal branches are highly variable.
The circumflex coronary artery passes to the left and inferiorly in the left atrioventricular groove, usually terminating close to the junction of the lateral and the inferior surfaces of the left ventricle. The circumflex artery gives rise to a series of branches to the lateral surface of the left ventricle known as obtuse marginal (OM) branches (see Fig. 5-2 B, 5-2C, 5-2E). The number, size, and point of origin of the OM vessels vary greatly. A large branch, known as the intermediate coronary artery (see Fig. 5-2 B, 5-2C, 5-2D), may arise directly from the left main bifurcation or from the very proximal course of either the LAD or circumflex arteries to supply a portion of the diagonal (anterior) and OM (lateral) surfaces of the heart. Intermediate arteries can supply a substantial amount of the left ventricle and may be much larger than the circumflex artery.
The RCA (see Fig. 5-3) arises from the right coronary sinus and passes inferiorly and to the right in the right atrioventricular groove before passing around the acute margin onto the inferior surface of the heart to reach the crux, the point at which the atrioventricular and interventricular grooves meet. The major branch to the posterior septum is the posterior descending coronary artery (PDA) (Fig. 5-3 A). The PDA normally arises from the RCA proximal to or at the crux, and passes anteriorly in the posterior interventricular groove, giving off a number of septal branches that enter the posterior portion of the interventricular septum. In some individuals, the RCA is so small it supplies none of the left ventricle, and the PDA arises from the circumflex coronary artery. The origin of the PDA determines the dominance of the coronary circulation. In more than 90% of the population the PDA arises from the RCA (right dominance); in about 6% of the population the PDA arises from the circumflex coronary artery (left dominance); and in less than 2% of individuals the supply to the posterior septum is shared (indeterminate dominance). Distal to the crux, the RCA continues along the posterior atrioventricular groove and gives rise to a number of branches which pass anteriorly on to the inferior surface of the left ventricle. The supply to the sinoatrial node arises from the proximal RCA. The supply to the atrioventricular node is a small artery that arises in the region of the crux, usually from the RCA.
Coronary Stenoses
Stenoses due to chronic atherosclerotic disease cause angina and exercise-induced myocardial ischemia. In contrast, unstable angina or acute coronary syndromes are usually associated with thrombus formation on a ruptured plaque, which prior to thrombus formation may have been causing only minor narrowing. Patients with acute coronary syndrome should have urgent coronary angiography with a view to revascularization. However, if a thrombolytic drug such as streptokinase has been administered, the thrombus may have resolved by the time of angiography.
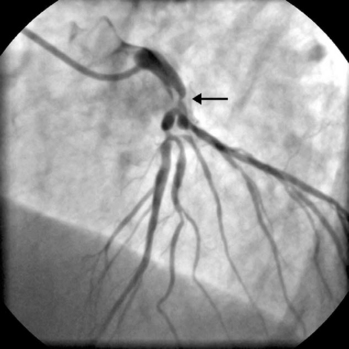
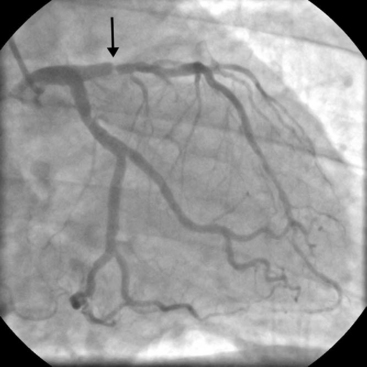
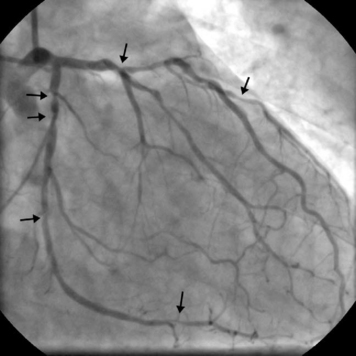
The presence of significant stenosis (>50%) of the left main stem coronary artery (Fig. 5-4) or of severe disease in the proximal course of both LAD and circumflex coronary arteries (left main equivalent disease) represents a situation of special concern because of the large proportion of the left ventricular myocardium whose vascular supply is in jeopardy. This is particularly the case in patients with left-dominant circulations. Urgent revascularization is indicated. Patients with severe stenoses of the proximal LAD coronary artery (Fig. 5-5) or extensive coronary artery disease (Fig. 5-6) also have a survival benefit from revascularization (Chapter 9).
Left Ventriculography and Pressure Recordings
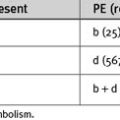
A left ventriculogram (Fig. 5-7) is commonly performed at the time of coronary angiography. Left ventriculography allows measurement of ventricular volumes and ejection fraction (Table 5-1) and provides some assessment of regional wall motion. The degree of mitral regurgitation, if any, may also be assessed. Care should be taken in the interpretation of measurements made of postectopic beats, as the measured ejection fraction will be greater than that obtained from a normal sinus beat (due to increased end-diastolic and reduced end-systolic volumes). The left ventriculogram is often omitted in patients with diabetes or left main-stem disease in order to reduce the dose of radiographic contrast medium. Radiographic contrast medium is nephrotoxic, especially in diabetics, and also has vasodilator and myocardial depressant effects, which may critically reduce myocardial perfusion in patients with left main-stem disease.
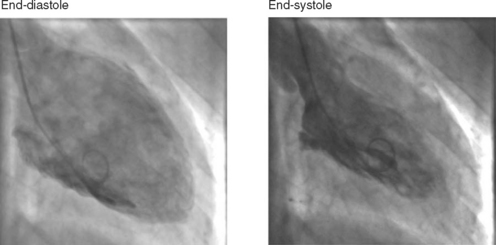
Table 5-1 Normal Values for Left Ventricular Volumes and Ejection Fraction
| End-diastolic volume index | < 90 ml/m2 |
| End-systolic volume index | < 30 ml/m2 |
| Ejection fraction | 55% to 75% |
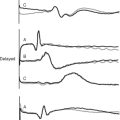
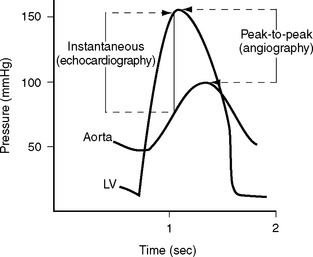
A pressure recording is made across the aortic valve as the catheter is withdrawn after the left ventricular study to check for aortic valve stenosis. Comparison of angiographic and echocardiographic transvalvular pressure gradients may reveal surprising discrepancies for a variety of reasons. Aortic valve gradients obtained from echocardiography are instantaneous measurements, whereas those from a cardiac catheter study are peak-to-peak pressure measurements (Fig. 5-8). Underestimation of transvalvular gradients in echocardiography may occur if imaging windows are poor or if the Doppler signal has not been lined up accurately with the jet of stenotic flow. Cardiac output may appear to be different on the angiogram and the echocardiogram. Cardiac catheterization is typically performed under mild benzodiazepine sedation, which may result in reduced gradients.
RIGHT HEART CATHETERIZATION
Right heart catheterization is performed for the evaluation of right ventricular function, pulmonary vascular disease, and intracardiac shunting. Common clinical scenarios in which right heart catheterization is indicated include the assessment of pulmonary vascular resistance prior to heart transplantation (Chapter 14), in patients with suspected Eisenmenger syndrome (Chapter 15), and in the diagnosis of idiopathic (or primary) pulmonary hypertension. Patients with pulmonary hypertension secondary to valvular heart disease are usually assessed with echocardiography but may occasionally undergo right heart catheterization.
The procedure may be performed using a standard balloon-tipped flow-directed pulmonary artery catheter (Chapter 8) or a catheter without a balloon (e.g., a Cournand catheter). It is often carried out in conjunction with left heart catheterization. Measurements that may be made during a right heart catheter study include right atrial pressure, pulmonary arterial pressure, pulmonary artery wedge pressure, cardiac output, and oxygen saturations from the vena cavae, right atrium, and pulmonary artery. In most catheter laboratories, cardiac output is routinely measured by using the thermodilution technique (Chapter 8). If thermodilution is likely to be inaccurate (e.g., due to the presence of severe tricuspid regurgitation) the Fick method may be used (see Equation 1-15). The Fick method necessitates obtaining pulmonary arterial and systemic arterial oxygen saturations and measuring oxygen consumption. From the measured variables (cardiac output, pulmonary artery wedge pressure, mean pulmonary artery pressure), transpulmonary gradient (Chapter 24) and pulmonary vascular resistance are calculated (see Equation 1-6).
ISCHEMIA AND VIABILITY TESTING
The identification of inducible ischemia and myocardial viability in patients with known or suspected coronary artery disease has important treatment and prognostic implications (Chapter 9). The presence of inducible ischemia on stress testing is an important criterion for proceeding to coronary angiography and subsequent percutaneous or surgical revascularization. The term viable myocardium refers to dysfunctional cardiac muscle that has the potential for partial or complete recovery of function following revascularization. Viable myocardium is composed of ischemic, stunned, or hibernating myocardium (Chapter 1) and must be distinguished from infarction. In patients with coronary artery disease and impaired ventricular function, the presence of viable, as opposed to infarcted, myocardium is associated with improved outcome following surgical revascularization.1 Therefore, viability testing is an important part of the preoperative evaluation of these patients (Chapter 9).
Exercise Electrocardiogram
An exercise ECG is indicated primarily for the investigation of inducible ischemia in patients with suspected coronary artery disease, but it is also performed in other circumstances, such as in asymptomatic patients with severe valvular heart disease and, in combination with oxygen consumption, in patients being considered for heart transplantation.2
Protocols
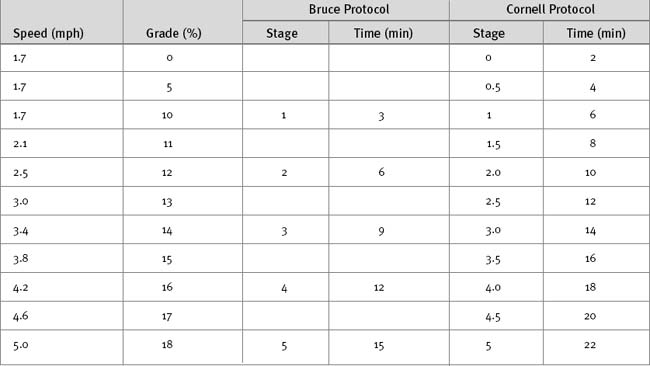
A number of exercise modalities and protocols are in use, but the most common remains treadmill exercise using the original or a modified version of the Bruce protocol (Table 5-2). The original Bruce protocol consists of 3-minute stages of increasing speed and elevation.3 The Naughton and Cornell protocols are modifications of the Bruce protocol designed for elderly or deconditioned patients, in which each standard stage is divided into 2-minute half-stages.4 The exercise target is to achieve 85% or more than a patient’s maximum predicted heart rate and a double product greater than 25,000. Maximal predicted heart rate is calculated by subtracting the patient’s age from 220; double product is the peak heart rate multiplied by peak systolic blood pressure. The exercise protocol should be individualized to allow a test duration of at least 8 to 12 minutes.5,6 A 12-lead ECG is recorded at baseline and each minute during exercise, at peak exercise, and every minute during the recovery period. Blood pressure and heart rate are recorded serially, and symptoms are assessed continuously throughout the study.
Risks and Contraindications
Although the risks involved in exercise testing in appropriately selected patients are extremely low, there is a risk for death and major morbid events of 0.5 of 10,000 and 6 to 8 of 10,000, respectively.7 Thus, emergency resuscitation equipment must be always be available. Absolute contraindications to exercise testing include myocardial infarction within the previous 2 days, unstable angina, uncontrolled cardiac arrhythmias, severe symptomatic aortic stenosis, symptomatic heart failure, and severe hypertension. Exercise testing may be performed with caution in patients with severe aortic stenosis but must be supervised by an experienced clinician.
Interpretation
A number of variables are assessed as part of an exercise test: heart rate and blood pressure responses, exercise duration and workload, symptoms, and ECG changes (ST-segment abnormalities and arrhythmias). The most widely used definition of a positive test is a greater than or equal to 1 mm of horizontal or downsloping STsegment depression (or elevation in leads without Q waves) 60 to 80 ms following the J point (see Fig. 8-4). Upsloping ST depression is considered borderline or negative.8 The pooled sensitivity and specificity of ST-segment depression for the identification of significant coronary artery disease, confirmed with coronary angiography, is 68% and 77%, respectively, although there is a wide variability among reported studies.9 The likelihood that ST segment depression represents important coronary artery disease is greatest when the magnitude of the depression is more than 2 mm, the ST depression occurs early in the test (stages 1 through 3), and the ST segment depression is associated with hypotension. ST-segment elevation in leads with Q waves is of uncertain clinical significance. However, ST elevation in leads without Q waves usually represents transmural ischemia and, in contrast to ST-segment depression, localizes the ischemia.
Alternatives to Exercise Electrocardiography
Stress Echocardiography
Protocols
At each dobutamine dose, standard parasternal and apical echocardiographic images (see Fig. 7-4) and a 12-lead ECG are obtained. Wall motion is graded from normal to dyskinetic based on the degree of systolic thickening and wall movement. Using a standard model of the left ventricle (see Fig. 7-6), segmental wall motion abnormalities (SWMAs) are localized to specific myocardial segments. Images are recorded in digital cine loop format with side-by-side display to enable assessment of wall motion at various heart rates. Assessment of SWMAs is typically qualitative (i.e., a visual assessment of wall motion) but quantitative techniques, including measurement of myocardial tissue velocity, are being progressively refined.11
Interpretation
The normal cardiac response to stress is a reduction in left ventricular size and an increase in systolic wall motion. Abnormal responses are summarized in Table 5-3. In patients with inducible ischemia, wall motion is typically normal at rest, augments with low-dose dobutamine, and develops an SWMA at higher doses of dobutamine. Analysis of inducible ischemia can be difficult in patients with resting SWMAs and left ventricular dysfunction. Features on stress echocardiography that are predictive of adverse ischemic events include multiple resting SWMAs, reduced poststress ejection fraction, and extensive poststress SWMAs.12,13
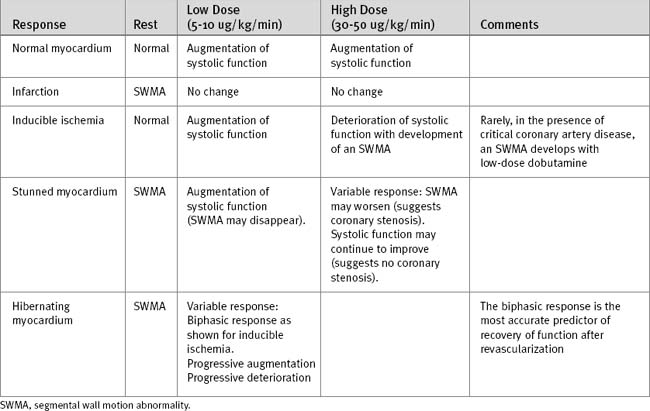
A resting SWMA may be due to infarcted or viable myocardium (see earlier material and Chapter 1). Wall thinning and dyskinesis are suggestive of infarcted rather than viable myocardium. An SWMA due to myocardial stunning typically augments with low-dose dobutamine, but at high doses the response is variable. The typical response of hibernating myocardium is an improvement in the SWMA with low-dose dobutamine and deterioration at higher doses (biphasic response), but other responses also occur. A progressive deterioration of wall motion with increasing stress is consistent with ischemic, stunned, or hibernating myocardium.
The biphasic response is the most predictive of contractile recovery following revascularization.14,15 However, patients with viable myocardium, but greatly increased ventricular volumes, have a lower likelihood of recovery compared to patients with smaller ventricular volumes.16 A lack of augmentation in wall motion with dobutamine in the first few days following myocardial infarction implies the presence of infarcted rather than stunned myocardium and identifies patients at increased risk for ventricular remodeling (Chapter 1).17
For myocardial viability testing, dobutamine stress echocardiography has a slightly lower sensitivity and negative predictive value and a slightly higher specificity and positive predictive value compared with nuclear cardiac imaging.18 Based on postrevascularization improvement in function, pooled sensitivities and specificities for the identification of viability with dobutamine stress echocardiography are 74% and 80%, respectively.18
Future Developments
Contrast agents enabling left ventricular chamber opacification are in routine use and allow improved visualization of SWMAs. Contrast agents that are taken up into perfused myocardium are also available, and their use continues to be refined.19 The ability to combine perfusion imaging with quantitative wall motion analysis is the ultimate goal of stress echocardiography.
Nuclear Cardiac Imaging
Nuclear cardiac imaging provides information on myocardial perfusion and wall motion from which evidence for inducible ischemia and myocardial viability can be inferred.20,21 The indications are similar to those for stress echocardiography.
Interpretation
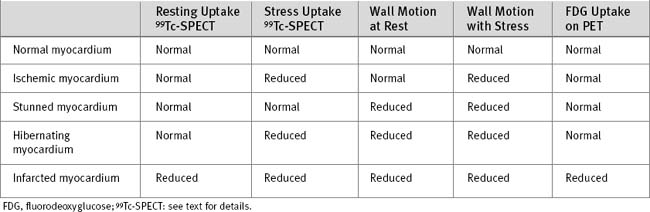
Normal myocardium demonstrates good isotope uptake on both stress and resting images. The patterns of tracer uptake with ischemic, viable, and infarcted myocardium are shown in Table 5-4. Ischemic myocardium has normal perfusion at rest but reduced perfusion during stress. A globally ischemic left ventricle may not demonstrate a focal perfusion defect during stress if perfusion to all myocardial segments is equally reduced. Ejection fraction will be reduced, and left ventricular diastolic volume will be increased. Mismatched perfusion defects that are present on stress imaging but not rest imaging represent areas of either inducible ischemia or hibernation. The two conditions can be difficult to distinguish on the basis of perfusion imaging alone, but they may be differentiated on the basis of differences in resting wall motion (Table 5-4).
Positron Emission Tomography
PET scanning, using fluorine 18 (18 Fl)-labeled fluorodeoxyglucose, can be used to assess cellular glucose utilization, which may then be compared with perfusion. Normal myocardium has normal perfusion and normal glucose uptake, whereas both are reduced in infarcted myocardium. Hibernating myocardium has reduced perfusion on stress, but normal glucose uptake. PET scanning is not widely available, and standardized metabolic conditions have to be present to achieve reproducible results; this can be difficult to achieve, especially in diabetics (see Table 5-4).
Cardiac Magnetic Resonance Imaging
Until recently the application of MR imaging to the heart has been used predominantly for congenital cardiac disease. MR imaging is now the definitive method of assessing left ventricular function,22 although in clinical practice, echocardiography and ventriculography are more commonly used. The advantages of MR imaging of ventricular function are the excellent signal contrast between myocardium and blood and the lack of restrictive imaging windows, allowing imaging of the entire epicardial and endocardial surfaces throughout the cardiac cycle. A three-dimensional reconstruction of the ventricle can be performed and assessed over time, allowing SWMAs to be measured objectively.
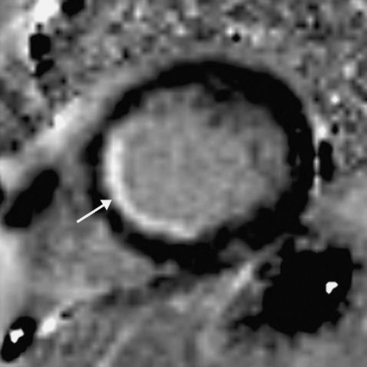
An emerging indication for MR imaging is in the assessment of myocardial perfusion and viability.23 Myocardial perfusion can be assessed with the use of gadolinium contrast media.24 There is avid first-pass uptake of gadolinium, which provides a measure of relative myocardial perfusion, either at rest or during the administration of a pharmacologic stressor, such as adenosine or dobutamine. Ischemia appears as subendocardial defects in myocardial enhancement (Fig. 5-9). The comparability of MR perfusion imaging and nuclear techniques is unclear at present unless the patient is in atrial fibrillation, when the averaged acquisition of nuclear techniques is a significant advantage.
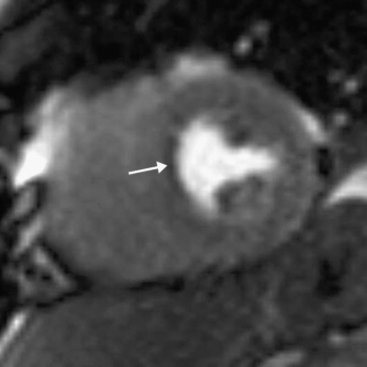
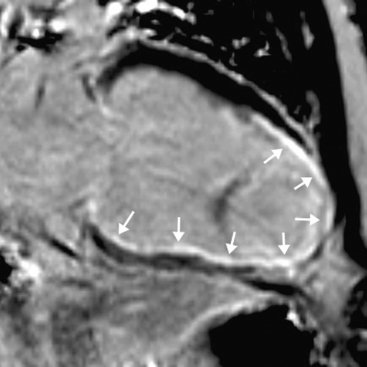
Myocardial viability is assessed by looking for delayed enhancement.25 The amount of contrast taken up by a soft tissue depends on the relative proportion of extracellular space, which is increased in myocardial scar compared with viable myocardium. Within viable myocardium, rapid wash-in and wash-out of contrast occurs, but within infarcted myocardium, enhancement develops more slowly and is washed out more slowly. The use of an inversion-recovery sequence (which nulls the signal from normal myocardium) 10 to 30 minutes after contrast administration allows for imaging of regions of infarction (Figs. 5-10 and 5-11), which are brightly enhanced and are characteristically subendocardial. The superior spatial resolution ofs MR imaging allows for differentiation between viable and nonviable myocardium with a high degree of accuracy. In particular, small regions of subendocardial infarction can be identified by MR imaging with a higher sensitivity and specificity than by nuclear imaging techniques.26 The relative thickness of infarction of a myocardial segment can be used to predict the likelihood of useful functional activity’s being restored by revascularization.27
Cardiac Computed Tomogram Scanning
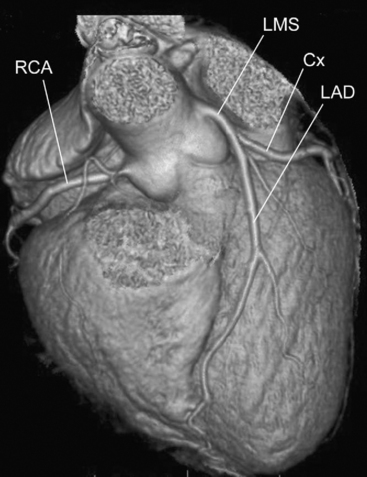
Recent developments in the technology of computed tomogram (CT) scanners have made feasible the use of this modality to evaluate coronary artery disease (Fig. 5-12). In a CT scanner, an x-ray source is rotated around the patient while a stationary row of detectors collects radiation that is then converted into a digital signal, which in turn is processed by using a complex mathematical algorithm (a Fourier transform) to generate an image. The speed of rotation of x-ray tubes has increased such that one rotation can now be performed in 0.375 seconds rather than the 1-second minimum that prevailed for some years. In addition, in the past few years the number of rows of detectors, and thus potential simultaneous imaging slices, has increased from 4 to 64, resulting in a reduction in the length of breathholding required to image the entire heart from 45 to 5 seconds. Improvements in the reconstruction algorithms have allowed for higher spatial resolution. Image acquisitions are gated to the cardiac cycle, resulting in reduced radiation exposure.
In order to perform a multidetector CT (MDCT) coronary angiogram, the patient must be in sinus rhythm and, ideally, have a slow heart rate. Radiographic contrast is administered as an intravenous bolus and images are acquired as contrast passes through the coronary circulation, with the patient holding his or her breath for the few seconds required. Subsequent image processing is performed on the basis of data acquired at a particular point in the cardiac cycle. Reconstruction of images of a particular coronary artery is performed at the point in the cardiac cycle at which the motion of that vessel is minimized, which may be different for various vessels, necessitating multiple reconstructions. An MDCT coronary angiogram allows for imaging not only of the artery lumen but also of the vessel wall. Thus, some assessment of the nature of an atherosclerotic plaque can be made noninvasively.28
There are problems with the technique. Variation in heart rate during the acquisition can result in considerable artifact, potentially rendering the study useless. Despite the advances in technology, the spatial resolution of MDCT angiography remains lower than it is in conventional angiography. Structures of very high radiographic density appear larger than they really are. Thus, coronary stenoses caused by calcified plaque appear to be more significant than they appear to be in conventional angiography. Imaging of the lumen inside a coronary stent is complicated by artifact from the metal in the stent.29 It is often very difficult to visualize tortuous coronary side-branches; the OM vessels are usually the most problematic. The recent increase in the number of detectors, with concomitant improvement in spatial resolution, partly resolves some of these issues.30,31 Coronary grafts are especially suited to MDCT imaging because they are of relatively large caliber, run in relatively straight lines, and move little with cardiac motion.32 However, the run-off vessels to which the grafts are anastomosed tend to be small and heavily calcified, and MDCT may be inadequate for their assessment.
1 Allman KC, Shaw LJ, Hachamovitch R, Udelson JE. Myocardial viability testing and impact of revascularization on prognosis in patients with coronary artery disease and left ventricular dysfunction: a meta-analysis. J Am Coll Cardiol. 2002;39:1151-1158.
2 Gibbons RJ, Balady GJ, Bricker JT, et al. ACC/AHA 2002 guideline update for exercise testing: summary article. A report of the American College of Cardiology/American Heart Association Task Force on Practice Guidelines (Committee to Update the 1997 Exercise Testing Guidelines). J Am Coll Cardiol. 2002;40:1531-1540.
3 Bruce RA, Blackmon JR, Jones JW, et al. Exercising testing in adult normal subjects and cardiac patients. Pediatrics. 1963;32:S742-S756.
4 Okin PM, Kligfield P. Heart rate adjustment of ST segment depression and performance of the exercise electrocardiogram: a critical evaluation. J Am Coll Cardiol. 1995;25:1726-1735.
5 Myers J, Buchanan N, Walsh D, et al. Comparison of the ramp versus standard exercise protocols. J Am Coll Cardiol. 1991;17:1334-1342.
6 Webster MW, Sharpe DN. Exercise testing in angina pectoris: the importance of protocol design in clinical trials. Am Heart J. 1989;117:505-508.
7 Stuart RJJr, Ellestad MH. National survey of exercise stress testing facilities. Chest. 1980;77:94-97.
8 Goldschlager N, Selzer A, Cohn K. Treadmill stress tests as indicators of presence and severity of coronary artery disease. Ann Intern Med. 1976;85:277-286.
9 Gianrossi R, Detrano R, Mulvihill D, et al. Exercise-induced ST depression in the diagnosis of coronary artery disease: a meta-analysis. Circulation. 1989;80:87-98.
10 Morise AP, Dalal JN, Duval RD. Value of a simple measure of estrogen status for improving the diagnosis of coronary artery disease in women. Am J Med. 1993;94:491-496.
11 Marwick TH, Case C, Leano R, et al. Use of tissue Doppler imaging to facilitate the prediction of events in patients with abnormal left ventricular function by dobutamine echocardiography. Am J Cardiol. 2004;93:142-146.
12 Labib SB, Goldstein M, Kinnunen PM, et al. Cardiac events in patients with negative maximal versus negative submaximal dobutamine echocardiograms undergoing noncardiac surgery: importance of resting wall motion abnormalities. J Am Coll Cardiol. 2004;44:82-87.
13 Yao SS, Qureshi E, Sherrid MV, et al. Practical applications in stress echocardiography: risk stratification and prognosis in patients with known or suspected ischemic heart disease. J Am Coll Cardiol. 2003;42:1084-1090.
14 Rizzello V, Schinkel AF, Bax JJ, et al. Individual prediction of functional recovery after coronary revascularization in patients with ischemic cardiomyopathy: the scar-to-biphasic model. Am J Cardiol. 2003;91:1406-1409.
15 Cornel JH, Bax JJ, Elhendy A, et al. Biphasic response to dobutamine predicts improvement of global left ventricular function after surgical revascularization in patients with stable coronary artery disease: implications of time course of recovery on diagnostic accuracy. J Am Coll Cardiol. 1998;31:1002-1010.
16 Schinkel AF, Poldermans D, Rizzello V, et al. Why do patients with ischemic cardiomyopathy and a substantial amount of viable myocardium not always recover in function after revascularization ? J Thorac Cardiovasc Surg. 2004;127:385-390.
17 Nijland F, Kamp O, Verhorst PM, et al. Early prediction of improvement in ejection fraction after acute myocardial infarction using low-dose dobutamine echocardiography. Heart. 2002;88:592-596.
18 Bax JJ, Poldermans D, Elhendy A, et al. Sensitivity, specificity, and predictive accuracies of various noninvasive techniques for detecting hibernating myocardium. Curr Prob Cardiol. 2001;26:147-186.
19 Senior R, Swinburn JM. Incremental value of myocardial contrast echocardiography for the prediction of recovery of function in dobutamine nonresponsive myocardium early after acute myocardial infarction. Am J Cardiol. 2003;91:397-402.
20 Crean A, Dutka D, Coulden R. Cardiac imaging using nuclear medicine and positron emission tomography. Radiol Clin North Am. 2004;42:619-634.
21 Travin MI, Bergmann SR. Assessment of myocardial viability. Semin Nucl Med. 2005;35:2-16.
22 Young AA, Cowan BR, Thrupp SF, et al. Left ventricular mass and volume: fast calculation with guide-point modeling on MR images. Radiology. 2000;216:597-602.
23 Thomson LE, Kim RJ, Judd RM. Magnetic resonance imaging for the assessment of myocardial viability. J Magn Reson Imaging. 2004;19:771-788.
24 Manning WJ, Atkinson DJ, Grossman W, et al. First-pass nuclear magnetic resonance imaging studies using gadolinium-DTPA in patients with coronary artery disease. J Am Coll Cardiol. 1991;18:959-965.
25 Simonetti OP, Kim RJ, Fieno DS, et al. An improved MR imaging technique for the visualization of myocardial infarction. Radiology. 2001;218:215-223.
26 Wagner A, Mahrholdt H, Holly TA, et al. Contrast-enhanced MRI and routine single photon emission computed tomography (SPECT) perfusion imaging for detection of subendocardial myocardial infarcts: an imaging study. Lancet. 2003;361:374-379.
27 Kim RJ, Wu E, Rafael A, et al. The use of contrast-enhanced magnetic resonance imaging to identify reversible myocardial dysfunction. N Engl J Med. 2000;343:1445-1453.
28 Fayad ZA, Fuster V, Nikolaou K, et al. Computed tomography and magnetic resonance imaging for noninvasive coronary angiography and plaque imaging: current and potential future concepts. Circulation. 2002;106:2026-2034.
29 Pump H, Mohlenkamp S, Sehnert CA, et al. Coronary arterial stent patency: assessment with electron-beam CT. Radiology. 2000;214:447-452.
30 Leber AW, Knez A, von Ziegler F, et al. Quantification of obstructive and nonobstructive coronary lesions by 64-slice computed tomography: a comparative study with quantitative coronary angiography and intravascular ultrasound. J Am Coll Cardiol. 2005;46:147-154.
31 Achenbach S, Daniel WG. Computed tomography of the coronary arteries: more than meets the (angiographic) eye. J Am Coll Cardiol. 2005;46:155-157.
32 Fernandez GC. Bypass graft imaging and coronary anomalies in MDCT. Eur Radiol. 2005;15(suppl 2):B59-B61.