5 Cardiac Physiology
Functional Implications of Gross Anatomy

Structure
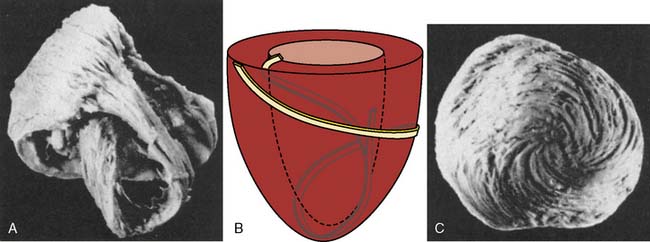
The anatomic design of the heart determines many of its major mechanical capabilities and limitations. The annuli of the cardiac valves, the aortic and pulmonary arterial roots, the central fibrous body, and the left and right fibrous trigones form the skeletal base of the heart. This flexible but very strong cartilaginous structure is located at the superior (termed basal in opposition to the left ventricular [LV] apex) aspect of the heart; provides support for the translucent, macroscopically avascular valves; resists the forces of developed pressure and blood flow within the chambers; and provides a site of insertion for superficial subepicardial muscle.1 Most of the atrial and ventricular muscle is not directly connected to this central fibrous skeleton, but instead arises from and inserts within adjacent surrounding myocardium consistent with the well-known embryologic derivation of the heart from an expanded arterial blood vessel.2 An interstitial collagen fiber network (composed of thick type I collagen cross-linked with thin type III collagen) also provides important structural support to the myocardium. The protein elastin is closely associated with this collagen matrix, thereby imparting additional flexibility and elasticity to the heart without compromising its strength. In contrast with William Harvey’s original assertion,3 atrial and ventricular myocardium cannot be separated into distinct bands or layers* using an “unwinding” dissection technique4,5 and, instead, is a continuum of interconnecting cardiac muscle fibers. The left and right atria (LA and RA, respectively) are composed of two relatively thin, orthogonally oriented layers of myocardium. The right ventricular (RV) and, to an even greater extent, the LV walls are thicker (approximately 5 and 10 mm, respectively) than those of the atria and consist of three muscle layers: interdigitating deep sinospiral, the superficial sinospiral, and the superficial bulbospiral. Well-ordered, differential alterations in fiber angle extending from the endocardium to the epicardium are especially apparent in ventricular myocardium and are spatially conserved despite the substantial alterations in wall thickness that occur with contraction and relaxation during the cardiac cycle (Figure 5-1).6 Subendocardial and subepicardial muscle fibers of the LV follow perpendicular, oblique, and helical routes from the base to the apex, but orientation of these interdigitating sheets of cardiac muscle also reverses direction at approximately the midpoint of the LV. Thus, LV fiber architecture resembles a flattened “figure of eight” (Figure 5-2). Contraction of obliquely arranged subepicardial and subendocardial fibers causes LV chamber shortening along its longitudinal axis and is accompanied by a characteristic “twisting” action that increases the magnitude of force generated by the LV during systole above that produced by basal-apical muscle fiber shortening alone. Indeed, a transition of this primarily helical geometry into a more spherical configuration has been proposed to directly contribute to the reduction in ejection fraction (EF) observed during evolving HF.7 Elastic recoil of this systolic “wringing” motion during LV relaxation is also an important determinant of diastolic suction, a critical factor that preserves LV filling during profound hypovolemia and strenuous exercise.8,9 In contrast with the subepicardial and subendocardial layers, most fibers within the midmyocardium are circumferentially oriented around the diameter of the LV cavity, and their contraction reduces chamber diameter.

The LV free walls are thickest near the base and gradually thin toward the apex because of a progressive decline in relative number of midmyocardial fibers. Subendocardial layers of both the left and right ventricles and combine with LV midmyocardium extending from the LV free wall to create the interventricular septum.1 Thus, structural elements derived primarily from the LV form the septum and, as a result, the septum normally thickens toward the LV chamber during contraction. Nevertheless, systolic movement of the interventricular septum toward the RV chamber may be observed in pathologic conditions, such as acute RV distention or chronic pressure-overload RV hypertrophy. Similar to the LV free wall, a gradual decrease in the number of midmyocardial fibers produces a characteristic basal-to-apical reduction in interventricular septum thickness. The LV apical free wall is composed of subendocardial and subepicardial fibers, but the apical interventricular septum contains only LV and RV subendocardium. These regional differences in LV wall thickness and laminar myocardial fiber orientation have been shown to contribute to load-dependent alterations in LV mechanics.10 Irregular ridges of subendocardium, termed trabeculae carneae, are commonly observed along the apical LV chamber border and within the RV, but the precise physiologic implications of these structural features remain unclear. Endocardial endothelium lines the subendocardium on the LV chamber surface and may play a minor role in the regulation of myocardial function.11
The right ventricle is located in a more right-sided, anterior position than the left ventricle within the mediastinum. Unlike the thicker-walled, ellipsoidal-shaped left ventricle that propels oxygenated blood from the pulmonary venous circulation into the high-pressure systemic arterial vascular tree, the thinner-walled, crescent-shaped right ventricle pumps deoxygenated venous blood into a substantially lower pressure, more compliant pulmonary arterial bed. The right ventricle is composed of embryologically distinct inflow and outflow tracts and, as a result, contracts in a peristaltic manner, whereas the activation sequence of the left ventricle is temporally uniform. The right ventricle moves toward the interventricular septum with a “bellows-like” action. The interventricular septum and left ventricle provide a “splint” against which the RV free wall shortens during contraction. LV contraction also makes an important contribution to RV systolic function (systolic ventricular interdependence).12 These factors give the less muscular right ventricle the mechanical advantage necessary to propel an SV equivalent to that of the left ventricle. However, the right ventricle is substantially more vulnerable than the left ventricle to acutely decompensate with modest increases in afterload because the more muscular left ventricle is able to generate pressure-volume work (stroke work [SW]) that is five- to seven-fold greater in magnitude than that produced by the right ventricle. Conversely, the right ventricle is more compliant and accommodates volume overload more easily than the left ventricle. The atrioventricular (AV) groove separating the RA and the RV and the adjacent tricuspid valve annular plane shorten toward the RV apex during contraction. This motion may be used as an index of RV contractile function by echocardiographic quantification of RV free-wall tricuspid annular plane systolic excursion.13

Valves
Two pairs of valves assure unidirectional blood flow through the right and left sides of the heart. The pulmonic and aortic valves are trileaflet structures located at RV and LV outlets, respectively, and operate passively with changes in hydraulic pressure gradients. The pulmonic valve leaflets are identified by their simple anatomic positions (right, left, and anterior), whereas the name of each aortic valve leaflet is derived from the presence or absence of an adjacent coronary artery ostium (right coronary cusp located adjacent to the right coronary artery [RCA] ostium, left coronary cusp located adjacent to the left main coronary artery ostium, and noncoronary cusp without a coronary ostium). The pulmonic and aortic valves open as a consequence of RV and LV ejection, respectively. The effective orifice area of each of these valves during maximal systolic blood flow is only modestly less than total cross-sectional area of the respective valve annulus. The proximal aortic root contains dilated segments, known as the sinuses of Valsalva, located immediately behind each leaflet. The sinuses of Valsalva prevent the aortic valve leaflets from closely approaching or adhering to the aortic wall by facilitating the formation of eddy currents of blood flow during ejection, thereby preventing the right and left coronary leaflets from occluding their respective coronary ostia. The eddy currents within the sinuses of Valsalva also assist with aortic valve closure at the end of ejection by assuring that the leaflets remain fully mobile during early diastole.14 In addition, the normal velocity of blood flow through the aortic valve (approximately 1.0 m/sec) creates vortices of flow between the aortic valve leaflets and the sinuses of Valsalva that serve to further prevent leaflet-aortic wall contact.15 In contrast with the aortic root, the proximal pulmonary artery does not contain sinuses.
The thin, flexible, and very strong mitral valve separates the LA from the LV. The mitral valve is a saddle-shaped structure containing two leaflets, identified as anterior and posterior on the basis of their anatomic location. The valve leaflets coapt in the middle of the annulus in a simple central curve in which the anterior mitral leaflet forms the convex border. The anterior mitral leaflet is oval and occupies a greater central diameter across the annulus, whereas the posterior mitral leaflet is crescent shaped and extends farther around the annular circumference. As a result, the cross-sectional area of each leaflet is similar. The leaflets are physically joined at anterior-lateral and posterior-medial commissures that are located superior to corresponding papillary muscles. The leaflets thicken slightly along the line of coaptation. The pressure gradient between the LA and LV chambers near the end of LV relaxation combined with LV mechanical recoil cause opening of the mitral valve, whereas retrograde blood flow toward the valve during LV contraction forces the previously open valve leaflets in a superior direction and produces coaptation. Thin fibrous threads, termed chordae tendineae, attach to the papillary muscles and prevent inversion of the valve leaflets during contraction. Primary and secondary chordae tendineae insert into the valve edges and the clear and rough zones of the valve bodies (located approximately one third of the distance between the valve edge and the annulus), respectively, of the leaflets. Tertiary chordae tendineae extend from the posteromedial papillary muscle and insert into the posterior mitral leaflet or the adjacent myocardium near the annulus. Each papillary muscle is an outpouching of subendocardial myocardium that provides chordae tendineae to both mitral valve leaflets and contracts synchronously with the main LV. Papillary muscle contraction tightens the chordae tendineae, thereby inhibiting excessive leaflet motion beyond the normal coaptation zone and preventing regurgitation of blood into the LA.16 The mitral annular circumference also decreases modestly during LV contraction through a sphincter-like action of the surrounding subepicardial myocardium that reduces the total orifice area and assists in valve closure.17 The importance of the functional integrity of the mitral valve apparatus to overall cardiac performance cannot be overemphasized. The apparatus not only assures unidirectional blood flow from the LA to the LV by preventing regurgitant flow into the LA and proximal pulmonary venous circulation, but also contributes to LV systolic function through papillary muscle contributions to LV apical posteromedial and anterolateral contraction. For example, loss of native chordae tendinea-papillary muscle attachments associated with mitral valve replacement is invariably associated with a modest decrease in global LV contractile function. Similarly, papillary muscle ischemia or infarction frequently causes mitral regurgitation and also may contribute to the development of LV systolic dysfunction.

Blood Supply
Blood flow to the heart is supplied by the left anterior descending, left circumflex, and right coronary arteries (LAD, LCCA, and RCA, respectively). Most of the blood flow to the LV occurs in diastole when aortic blood pressure exceeds the LV chamber pressure, thereby establishing a positive-pressure gradient in each coronary artery. All three major coronary arteries contribute to the blood supply of the LV. As a result, acute myocardial ischemia resulting from a critical coronary artery stenosis or abrupt occlusion causes a predictable pattern of LV injury based on the known distribution of blood supply. In brief, the LAD and its branches (including septal perforators and diagonals) supply the medial half of the LV anterior wall, the apex, and the anterior two thirds of the interventricular septum. The LCCA and its obtuse marginal branches supply the anterior and posterior aspects of the lateral wall, whereas the RCA and its distal branches supply the medial portions of the posterior wall and the posterior one third of the interventricular septum. The coronary artery that supplies blood to the posterior descending coronary artery (PDA) defines the right or left “dominance” of the coronary circulation. Right dominance (PDA supplied by the RCA) is observed in approximately 80% of patients, whereas left dominance (PDA supplied by the LCCA) occurs in the remainder. Anastomoses between the distal regions of the coronary arteries or collateral blood vessels between the major coronary arteries also may exist that provide an alternative route of blood flow to myocardium distal to a severe coronary artery stenosis or complete occlusion. Either the RCA (approximately two thirds of patients) or the LCCA provides the sole blood supply to the posteromedial papillary muscle, which renders this crucial structure particularly vulnerable to acute ischemia or infarction. However, one third of patients may have a dual blood supply (RCA and LCCA) to the posterior papillary muscle.18 Both the LAD and the LCCA usually provide coronary blood flow to the anterolateral papillary muscle, and as a result, ischemic dysfunction of this papillary muscle is relatively uncommon.
In contrast with the LV, coronary blood flow to the RA, LA, and RV occurs throughout the cardiac cycle because both systolic and diastolic aortic blood pressures are greater than the pressure within these chambers. The RCA and its branches supply the majority of the RV, but the RV anterior wall also may receive blood from branches of the LAD. As a result, RV dysfunction may occur because of RCA or LAD ischemia. Coronary arterial blood supply to the LA is derived from branches of the LCCA.19,20 Thus, augmented LA contractile function usually occurs in the presence of acute myocardial ischemia or infarction resulting from LAD occlusion,21 but such a compensatory response may not be observed during compromise of LCCA blood flow concomitant with LA ischemia.22 Branches of the RCA and the LCCA provide coronary blood flow to the RA.19 For example, a nodal artery from the RCA (55% of patients) or the LCCA (45%) supplies blood to the sinoatrial (SA) node. Similarly, the RCA or, less commonly, the LCCA branches supply blood flow to the AV node concomitant with the right or left dominance of the coronary circulation. As a result, a critical stenosis or acute occlusion in either of these two perfusion territories may adversely affect the proximal conduction system of the heart and produce hemodynamically significant bradyarrhythmias.

Conduction
The mechanism by which the heart is electrically activated plays a crucial role in its mechanical performance.23 The SA node is the primary cardiac pacemaker in the absence of marked decreases in firing rate, conduction delays or blockade, or accelerated firing of secondary pacemakers (e.g., AV node, bundle of His). The anterior, middle (Wenckebach), and posterior (Thorel) internodal pathways transmit the initial SA node depolarization rapidly through the RA myocardium to the AV node (Table 5-1). A branch (Bachmann’s bundle) of the anterior internodal pathway also transmits the SA node depolarization from the RA to the LA across the atrial septum. The internodal pathways may be demonstrated in the electrophysiology laboratory, but microscopic examination of tissue histology usually fails to differentiate anatomically discernible bundles of morphologically distinct cardiac cells capable of more rapid impulse conduction than the atrial myocardium itself. The cartilaginous skeleton of the heart isolates the atria from the ventricles by acting as an electrical insulator. Thus, atrial depolarization is not indiscriminately transmitted throughout the heart, but instead is directed solely to the ventricles through the AV node and its distal conduction pathway, the bundle of His. This electrical isolation between the atrial and ventricular chambers and the temporal transmission delay occurring within the slowly conducting AV node establishes the normal sequential pattern of atrial followed by ventricular contraction. Abnormal accessory pathways (e.g., bundle of Kent) between the atria and ventricles may bypass the AV node and contribute to the development of reentrant supraventricular tachyarrhythmias (e.g., Wolff–Parkinson–White syndrome). The bundle of His pierces the connective tissue insulator of the cartilaginous cardiac skeleton and transmits the AV depolarization signal through the right and left bundle branches to the RV and LV myocardium, respectively, via an extensive Purkinje network located within the inner third of the ventricular walls. The bundle of His, the bundle branches, and the Purkinje network are composed of His-Purkinje fibers that assure rapid, coordinated distribution of depolarization throughout the RV and LV myocardium. This ingenious electrical design allows synchronous ventricular contraction and efficient, coordinated ejection. In contrast, artificial cardiac pacing that bypasses the normal conduction system (e.g., epicardial RV pacing) produces dyssynchronous LV activation, causes a contraction pattern that may result in suboptimal LV systolic function, and is a frequent cause of a new regional wall motion abnormality after cardiopulmonary bypass in cardiac surgical patients. This form of contractile dyssynchrony is also associated with chronic RV apical pacing (e.g., used for the treatment of sick-sinus syndrome or an AV conduction disorder) and is known to cause detrimental effects on LV chamber geometry and function.24 Furthermore, recognition of the crucial relation between a normal electrical activation sequence and LV contractile synchrony forms the basis for the successful use of cardiac resynchronization therapy in some patients with congestive HF.25
| Structure | Conduction Velocity (m/sec) | Pacemaker Rate (beats/min) |
|---|---|---|
| Sinoatrial node | < 0.01 | 60–100 |
| Atrial myocardium | 1.0–1.2 | None |
| Atrioventricular node | 0.02–0.05 | 40–55 |
| Bundle of His | 1.2–2.0 | 25–40 |
| Bundle branches | 2.0–4.0 | 25–40 |
| Purkinje network | 2.0–4.0 | 25–40 |
| Ventricular myocardium | 0.3–1.0 | None |
Katz AM: Physiology of the Heart, 3rd ed. Lippincott Williams and Wilkins, 2001.
Cardiac myocyte anatomy and function

Ultrastructure
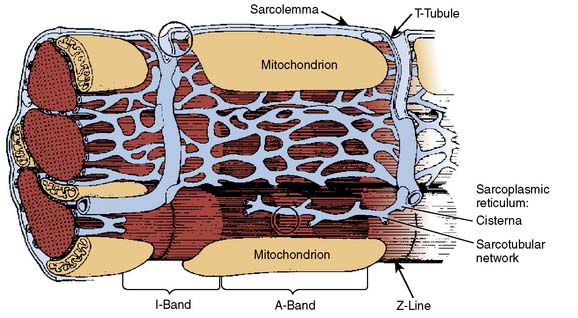
The ultrastructure of the cardiac myocyte is a remarkably elegant example of the architectural principle “form follows function.” The external membrane of the cardiac muscle cell is known as the sarcolemma. This bilayer lipid membrane contains ion channels (e.g., Na+, K+, Ca2+, Cl−), active and passive ion transporters (e.g., Na+-K+ ATPase, Ca2+-ATPase, Na+-Ca2+ or -H+ exchangers), receptors (e.g., β1-adrenergic, muscarinic cholinergic, adenosine, opioid), and transport enzymes (e.g., glucose transporter) that modulate intracellular ion concentrations, regulate homeostasis of electrophysiology, mediate signal transduction, and provide substrates for metabolism. Deep sarcolemmal invaginations, termed transverse (“T”) tubules, penetrate the myoplasm and facilitate rapid, synchronous transmission of cellular depolarization (Figure 5-3). The myocyte contains very large numbers of mitochondria responsible for the generation of high-energy phosphates (e.g., adenosine triphosphate [ATP], creatine phosphate) required for contraction and relaxation. The sarcomere is the contractile unit of cardiac myocyte and contains myofilaments arranged in parallel cross-striated bundles of thin (containing actin, tropomyosin, and the troponin complex) and thick (primarily composed of myosin and its supporting proteins) fibers. Sarcomeres are connected in series, and as a result, the long and short axes of each myocyte simultaneously shorten and thicken, respectively, during contraction. Light and electron microscopic observations form the basis for the description of sarcomere structure. Thick and thin fibers functionally interact in an area known as the “A” band that becomes wider (indicating more pronounced overlap) as the sarcomere shortens. The sarcomere region containing thin filaments alone is termed the “I” band; the width of this band is reduced during myocyte contraction. A “Z” (derived from the German zuckung, meaning “twitch”) line bisects each “I” band. The “Z” line denotes the border at which two adjacent sarcomeres are joined. Thus, an “A” band and two half “I” bands (between the “Z” lines) describe the length of each sarcomere. The “A” band also contains a central “M” band composed of thick filaments oriented in a cross-sectional hexagonal arrangement by myosin binding protein C.

Proteins of the Contractile Apparatus
The four light chains in the myosin complex are considered “regulatory” or “essential.” Regulatory myosin light chains affect the interaction between myosin and actin by modulating the phosphorylation state of Ca2+-dependent protein kinases. In contrast, essential light chains serve vital, but currently undefined, roles in myosin activity because their removal denatures the myosin molecule. Notably, LV hypertrophy is characterized by myosin light chain isoform alterations from ventricular to atrial forms that may play an important role in the contractile dysfunction associated with this disorder.26 These interesting data suggest that genetic modulation of light-chain isoform expression may form the basis for pathologic changes in function in some cardiac disease states. Thick filaments are not only composed of myosin and its binding protein, but also contain titin, a long elastic molecule that attaches myosin to the Z lines. Titin is an important contributor to myocardial elasticity and, similar to a bidirectional spring, acts as a “length sensor” by establishing greater passive restoring forces as sarcomere length approaches its maximum or minimum.27 Titin compression and stretching are observed during decreases and increases in load that serve to limit additional shortening and lengthening of the sarcomere, respectively. Thus, titin is another important elastic element (in addition to actin and myosin) that mediates the stress-strain biomechanical properties of cardiac muscle.28
Actin is the major component of the thin filament and is composed of a 42-kDa oval-shaped, globular protein (known as the “G” form; diameter = 5.5 nm). Actin exists in a polymerized filamentous configuration (“F” form) wound in double-stranded helical chains of G-actin monomers that resemble two intertwined strands of pearls. Each complete helical revolution of F-actin contains 14 G-actin monomers and is 77 nm in length. F-actin does not directly hydrolyze high-energy nucleotides (e.g., ATP), but the molecule does bind adenosine diphosphate (ADP) and divalent cations such as Ca2+ and Mg2+. Actin functions as the “activator” (hence its name) of myosin ATPase through its reversible binding with myosin. This actin-myosin complex is capable of hydrolyzing ATP, thereby supplying the energy required to cause the conformational changes in the myosin heads that mediate the cycle of contraction and relaxation within the sarcomere. Tropomyosin (weight = 68 and 72 kDa; length = 40 nm) is a major inhibitor of the interaction between actin and myosin, and consists of a rigid double-stranded α-helix protein linked by a single disulfide bond. Human tropomyosin contains both α and β isoforms (34 and 36 kDa, respectively), and may exist as either a homodimer or heterodimer.29 The Ca2+-dependent interaction of tropomyosin with the troponin complex is the primary mechanism by which excitation-contraction coupling occurs; that is, the association between sarcolemmal membrane depolarization and the resultant binding of actin and myosin that is responsible for contraction of the cardiac myocyte. Tropomyosin also stiffens the thin filament through its position within the longitudinal cleft between the interwoven F-actin helices. Several cytoskeletal proteins (e.g., α- and β-actinin, nebulette) anchor the thin filaments to the Z lines of the sarcomere.30
The troponin complex consists of three proteins that are critical regulators of the contractile apparatus. Each troponin protein serves a distinct role.31 Troponin complexes are interspersed at 40-nm intervals along the thin filament. A highly conserved, single isoform of troponin C (named for the molecule’s Ca2+ binding ability) exists in cardiac muscle. The structure of this protein consists of a central nine-turn α helix separating two globular regions that contain four discrete divalent cation-binding amino acid sequences, two of which (termed “sites I and II”) are Ca2+ specific. As a result, the troponin C molecule is able to directly respond to the acute changes in intracellular Ca2+ concentration that accompany contraction and relaxation. Troponin I (“I” for “inhibitor”; 23 kDa) exists in a single isoform in cardiac muscle. Troponin I alone weakly interferes with actin-myosin interaction, but becomes the major inhibitor of actin-myosin binding when combined with tropomyosin. This inhibition is responsive to receptor-operated signal transduction, as the troponin I molecule contains a serine residue that is susceptible to protein kinase A (PKA)–mediated phosphorylation through the intracellular second messenger cyclic adenosine monophosphate. Such phosphorylation of this serine residue reduces the ability of troponin C to bind Ca2+, an action that facilitates relaxation during administration of positive inotropic drugs including β-adrenoceptor agonists (e.g., dobutamine) and phosphodiesterase fraction III (PDE III) inhibitors (e.g., milrinone). Troponin T (the “T” identifies the protein’s ability to bind other troponin molecules and tropomyosin) is the largest of the troponin proteins and has four major human isoforms. Troponin T serves as an anchor for the other troponin molecules and also may influence the relative Ca2+ sensitivity of the troponin C.32

Ca2+-Myofilament Interaction
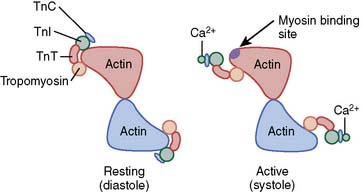
Ca2+-troponin C binding produces a sequence of conformational changes in the troponin-tropomyosin complex that expose the specific myosin-binding site on actin (Figure 5-4). Small amounts of Ca2+ are bound to troponin C when intracellular Ca2+ concentration is low during diastole (10−7 M). Under these conditions, the troponin complex confines each tropomyosin molecule to the outer region of the groove between F-actin filaments, thereby effectively preventing the interaction of myosin and actin by blocking the formation of cross-bridges between these proteins. This resting inhibitory state is rapidly transformed by the 100-fold increase in intracellular Ca2+ concentration (to 10−5 M) occurring as a consequence of sarcolemmal depolarization that opens L- and T-type Ca2+ channels, allows Ca2+ influx from the extracellular space, and stimulates ryanodine receptor–mediated, Ca2+-induced Ca2+ release from the SR. Ca2+-troponin C binding occurs under these conditions, and this action not only elongates the troponin C protein but enhances its interactions with troponin T and I. Such Ca2+-mediated allosteric alterations in the structure of the troponin complex weaken the interaction between troponin I and actin, promote repositioning of the tropomyosin molecule relative to the F-actin filaments, and minimize the previously described inhibition of actin-myosin binding by tropomyosin that is observed during low intracellular Ca2+ concentrations.33 Thus, Ca2+-troponin C binding stimulates a sequence of alterations in the chemical conformation of the regulatory proteins that reveal the binding site for myosin on the actin molecule and allow cross-bridge formation and contraction to occur. Subsequent dissociation of Ca2+ from troponin C fully reverses this antagonism of inhibition, prevents further myosin-actin interaction, and facilitates relaxation by rapidly restoring of the original conformation of the troponin-tropomyosin complex on F-actin.
An energy-dependent ion pump (Ca2+-ATPase) located in the SR membrane (abbreviated as “SERCA” for SR Ca2+-ATPase) removes most Ca2+ ions from the myofilaments and the myoplasm after the sarcolemmal membrane is repolarized. This activator Ca2+ is stored in the SR at a concentration of approximately 10−3 M and is transiently bound to calsequestrin and calrectulin until the next sarcolemmal depolarization occurs and ryanodine receptor–activated SR channels open again. Another Ca2+-ATPase and a Na+/Ca2+ exchanger passively driven by ion concentration gradients, each located in the sarcolemmal membrane, also play roles in the removal of substantially smaller amounts of Ca2+ from the myoplasm after repolarization. Phospholamban is a small protein (6 kDa) located in the SR membrane that modulates the activity of SERCA by partially inhibiting the dominant form (type 2a) of this main Ca2+ pump under baseline conditions. However, PKA-induced phosphorylation of phospholamban antagonizes this baseline inhibition and enhances SERCA-mediated Ca2+ uptake into the SR.34 Thus, drugs such as dobutamine and milrinone that act by modifying PKA-mediated signal transduction enhance the rate and extent of relaxation by facilitating Ca2+ reuptake (positive lusitropic effect), while simultaneously increasing the amount of Ca2+ available for the next contractile activation (positive inotropic effect).

Biochemistry of Myosin-Actin Interaction
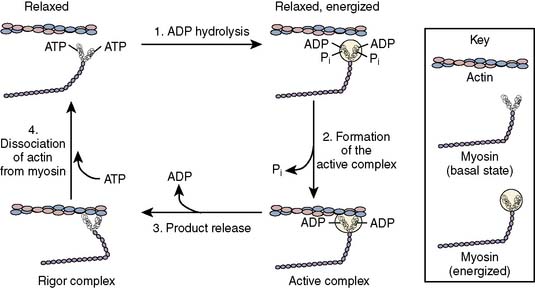
A four-component kinetic model is most often used to describe the biochemistry of cardiac muscle contraction (Figure 5-5).35 High-affinity binding of ATP to the catalytic domain of myosin initiates a coordinated sequence of events that results in sarcomere shortening. The myosin ATPase enzyme hydrolyzes the ATP molecule into ADP and inorganic phosphate. These products remain bound to myosin, thereby forming an “active” complex that retains the reaction’s chemical energy as potential energy. In the absence of actin, ADP and phosphate eventually dissociate from myosin and the muscle remains relaxed. The activity of myosin ATPase is substantially enhanced when the myosin-ADP-phosphate complex is bound to actin, and under these conditions, the energy released by ATP hydrolysis is translated into mechanical work. Myosin binding to actin releases the phosphate anion from the myosin head, thereby producing a tension-inducing molecular conformation within the cross-bridge.36 Release of ADP and potential energy from this “activated” orientation combine to rotate the cross-bridge (“power stroke”) at the hinge point separating the helical tail from the globular head of the myosin molecule. Each cross-bridge rotation generates approximately 3.5 × 10⁻¹² newtons of force, and myosin moves 11 nm along the actin molecule.37 The myosin-active complex does not immediately dissociate after rotation of the myosin head rotation and ADP release, but instead remains in a low-energy bound (“rigor”) state. Subsequent dissociation of the myosin and actin molecules occurs only when a new ATP molecule binds to myosin. This four-step process is then repeated, assuming an adequate ATP supply and lack of inhibition of the myosin-binding site on actin by the troponin-tropomyosin complex.
Laplace’s law
It is clear based on the previous discussion that the sarcomere generates tension and shortens during contraction, and thereafter it releases this developed tension and lengthens during relaxation. However, the intact heart produces pressure on and causes ejection of a volume of blood. Thus, the alterations in muscle tension and length observed in the sarcomere require transformation into the phasic changes in pressure and volume that occur in the intact heart.38 Laplace’s law facilitates this conversion of the contractile behavior of individual sarcomeres or isolated, linear cardiac muscle preparations in vitro into three-dimensional (3-D) chamber function in vivo, thereby permitting a systematic examination of the intact heart’s ability to function as a hydraulic pump. The relation between myocyte length and chamber volume (V) may be modeled as a pressurized, spherical shell (Figure 5-6),39 where volume is proportional to the cube of the radius (r) such that V = 4πr3/3. This model may be pedagogically useful and will be used for the following discussion, but the LV and the atria are more precisely described using prolate ellipsoidal geometry, which defines three axes corresponding to the anterior-posterior, septal-lateral, and long-axis diameters (DAP, DSL, and DLA, respectively), such that V = πDAPDSLDLA/6. This technique of measuring LV or atrial volume more closely approximates anatomic reality and has been validated extensively in experimental animals40,41 and humans.42,43 However, such a method does not apply when attempting to describe RV volume because of the unique bellows-shaped structure of this chamber.44
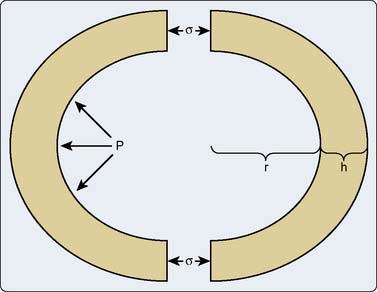
The relation between wall stress (defined as tension exerted over a cross-sectional area) and pressure within a cardiac chamber is complex. Laplace’s law relates wall stress to pressure and chamber geometry, which may be determined based on three major suppositions38: First, the chamber is assumed to be spherical with a uniform wall thickness (h) and an internal radius (r); second, the stress (σ) throughout the thickness of the chamber wall is assumed to be constant; and finally, the chamber remains in static equilibrium (i.e., is not actively contracting). Tension development within each sarcomere causes a corresponding increase in wall stress that is translated into the generation of hydraulic pressure within the chamber. Within this context, internal pressure (P) is defined as an orthogonal distending force exerted against the chamber walls, whereas wall stress is a shear force exerted around the circumference of the chamber.38 Bisecting the chamber into two equal halves exposes the internal forces within it (see Figure 5-6). The product of internal pressure and wall cross-sectional area (πr2) represents the total force tending to repel the chamber hemispheres. In contrast, the total force within the chamber walls resists this distracting force and is equal to the σ times the cross-sectional wall area. The two forces must balance for the chamber to remain in equilibrium such that Pπr2 = σ[π(r + h)2 − πr2]. This equation may be algebraically simplified to the form Pr = σh(2 + h/r) by removal of the redundant terms. The chamber wall is normally thin relative to its internal radius. As a result, the h/r term may be neglected and the remaining expression may be rearranged to become the more familiar σ = Pr/2h. This simple derivation of Laplace’s law indicates that wall stress varies directly with internal pressure and radius, and inversely with wall thickness. Despite the observation that the ratio of wall thickness to radius is not entirely negligible at LV end-diastole (h/r = 0.4),45 Laplace’s law for a thin-walled sphere provides a useful description of the factors that contribute to changes in LV or atrial wall stress. For example, LV dilation associated with chronic aortic insufficiency increases global LV wall stress that reflects greater tension on each sarcomere within the chamber wall.46 Similarly, the persistent increase of LV pressure observed in the presence of severe aortic stenosis also produces greater stress on the LV wall. Such increases in wall stress resulting from chronic volume or pressure overload are directly translated into greater myocardial oxygen demand because the myofilaments require more energy to develop this degree of enhanced tension. In contrast, an increase in wall thickness causes a reduction in global wall stress and tension developed by individual sarcomeres. Thus, Laplace’s law predicts that hypertrophy is a critically important compensatory response to chronically altered chamber load that serves to reduce the tension generated by each muscle fiber. Prolate ellipsoidal models of chamber geometry and those incorporating orthogonal radial, circumferential, and meridional components of wall stress require more complex derivations of Laplace’s law47 that may be corrected with dimensional measurements obtained using echocardiography.48 Formal derivations of these models are beyond the scope of the current chapter but are available elsewhere.49,50
In contrast with the assumption used in the derivation of Laplace’s law for a simple sphere, wall stress is not uniformly distributed across LV thickness in the intact heart,51 but instead is greatest in the subendocardium and progressively declines to a minimum at the epicardial surface. These regional differences in wall stress become especially important in LV pressure overload hypertrophy (e.g., aortic stenosis, severe hypertension),52 as the subendocardium is exposed to more pronounced increases in intraventricular pressure concomitant with greater myocardial oxygen demand that make it more susceptible to ischemia. The combination of increased subendocardial wall stress and oxygen demand is particularly deleterious in the presence of a flow-limiting coronary artery stenosis and may contribute to the relatively common occurrence of subendocardial myocardial infarction in the absence of complete coronary occlusion in patients with severe LV hypertrophy.
Cardiac cycle
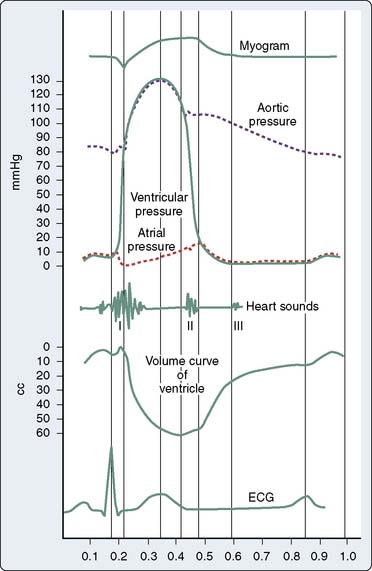
The cardiac cycle describes a highly coordinated, temporally related series of electrical, mechanical, and valvular events (Figure 5-7).53 A single cardiac cycle occurs in 0.8 second at a HR of 75 beats/min. Synchronous depolarization of RV and LV myocardium (as indicated by the electrocardiogram QRS complex) initiates contraction of and produces a rapid increase in pressure within these chambers (systole). Closure of the tricuspid and mitral valves occurs when RV and LV pressures exceed the corresponding atrial pressures and cause the first heart sound (S1). LV systole is divided into isovolumic contraction, rapid ejection, and slower ejection phases. LV isovolumic contraction describes the time interval between mitral valve closure and aortic valve opening during which LV volume remains constant. Nevertheless, global LV geometry is transformed from an ellipsoidal shape at end-diastole to a more spherical configuration during isovolumic contraction because the length of the longitudinal axis (base-apex) shortens and LV wall thickness increases.54 The maximum rate of increase of LV pressure (dP/dtmax) occurs during LV isovolumic contraction and may be used to estimate myocardial contractility in vivo. True isovolumic contraction most likely does not occur in the RV because of the sequential nature of contraction of the inflow and outflow tracts.55 The pressures in the aortic and pulmonic roots decline to their minimum value immediately before the corresponding valves open. Rapid ejection occurs when LV and RV pressures exceed aortic and pulmonary arterial pressures, respectively. Approximately two thirds of the end-diastolic volume of each ventricle is ejected during this rapid-ejection phase. Dilation of the elastic aorta and proximal great vessels, and to a lesser extent, the pulmonary artery and its proximal branches, occurs concomitant with this rapid increase in volume as the kinetic energy of LV and RV contraction is transferred to the aorta and pulmonary artery, respectively, as potential energy. The compliance of the proximal systemic and pulmonary arterial vessels determines the amount of potential energy that may be stored and subsequently released to their respective distal vascular beds during diastole. Further ejection of additional blood from the LV and RV declines precipitously as the pressures within the aorta and pulmonary artery reach their maximum values. Ejection ceases entirely when the LV and RV begin to repolarize and the arterial forces resisting further ejection are greater than the ventricular forces continuing to drive blood flow forward. As the period of slower ejection comes to an end, aortic and pulmonary artery pressures briefly exceed LV and RV pressures. These pressure gradients cause the aortic and pulmonic valves to close, an action that produces the second heart sound (S2), signifying the end of systole and the beginning of diastole. The aortic valve closes slightly before the pulmonic valve during inspiration because RV ejection is modestly prolonged by augmented venous return, thereby causing normal physiologic splitting of S2. The normal end-diastolic and end-systolic volumes (Ved and Ves) are approximately 120 and 40 mL, respectively. Thus, SV (the difference between Ved and Ves) is 80 mL and EF (the ratio of SV to Ved) is 67%.56
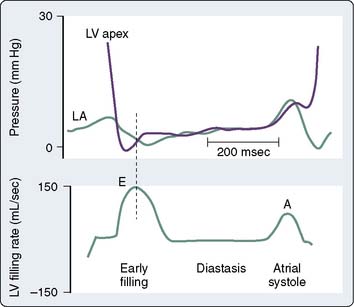
LV diastole is divided into isovolumic relaxation, early ventricular filling, diastasis, and atrial systole. LV isovolumic relaxation defines the period between aortic valve closure and mitral valve opening during which LV volume remains constant. LV pressure rapidly declines as the myofilaments relax. When LV pressure declines to less than LA pressure, the mitral valve opens, and blood volume stored in the LA enters the LV driven by the initial pressure gradient between the chambers. Notably, LV pressure continues to decline after mitral valve opening as sarcomere relaxation is completed and myocardial elastic components recoil (Figure 5-8).57–59 These factors contribute to the creation of a time-dependent pressure gradient between the LA and LV that extends to the apex.58 The rate and extent of LV pressure decline and the LA pressure when the mitral valve opens determine the initial magnitude of the pressure gradient between these chambers.60 Early LV filling occurs rapidly, as indicated by the observation that the peak blood flow velocity across the mitral valve during this phase of diastole may exceed the flow rate across the aortic valve during LV contraction.61 Vortex formation from the primary mitral blood flow jet also facilitates selective filling of the LV outflow tract.62,63 Delays in LV relaxation may occur as a consequence of age or disease processes (e.g., ischemia, hypertrophy) and are a common cause of attenuated early LV filling because the initial LA-LV pressure gradient is reduced under these circumstances.64 After the mitral valve opens, the pressure gradient between the LA and the LV is temporally dependent on the relative pressure in each chamber. Notably, most of the increase in LV volume observed during early ventricular filling occurs while LV pressure continues to decrease. In fact, LV pressure has been shown to decrease to a subatmospheric level if blood flow across the mitral valve is completely obstructed.8,65 These data imply that the LV ventricle will continue to fill through this “diastolic suction” mechanism even if LA pressure is zero.66,67 The early filling phase of diastole normally provides 70% to 75% of the total SV ejected during the subsequent LV contraction and ends when LA and LV pressures equilibrate or the gradient between these chambers transiently reverses. The mitral valve remains open and pulmonary venous blood flow directly traverses the LA into the LV after the LA and LV pressures have equalized. Thus, the LA acts as a simple conduit during this diastasis phase of diastole, and LV filling markedly slows as a result. The small amount of blood flow from pulmonary veins occurring during diastasis usually adds less than 5% to the total LV SV.68 Progressive increases in HR shorten and may completely eliminate diastasis, but such a response to tachycardia has little, if any, effect on overall LV filling. Atrial systole is the final phase of diastole. LA contraction increases the pressure in this chamber, thereby again creating a positive pressure gradient for blood flow from the LA and the LV. The peristaltic pattern of LA contraction and the unique anatomy of the pulmonary venous-LA junction largely prevent retrograde blood flow into the pulmonary veins during atrial systole at normal LA pressures.69 Atrial systole usually accounts for between 15% and 25% of total left ventricular stroke volume (LVSV), but this LA “kick” becomes especially important to the maintenance of LV filling in pathologic states characterized by delayed LV relaxation or reduced LV compliance.70 Similarly, improperly timed LA contraction or the onset of atrial tachyarrhythmias (e.g., atrial fibrillation) may cause profound hemodynamic compromise in patients with myocardial ischemia or pressure-overload hypertrophy who are particularly dependent on atrial systole for LV filling. Descriptions of RV diastole are similar to those used to characterize LV diastole, with the exception that true isovolumic relaxation most likely does not occur in the RV.
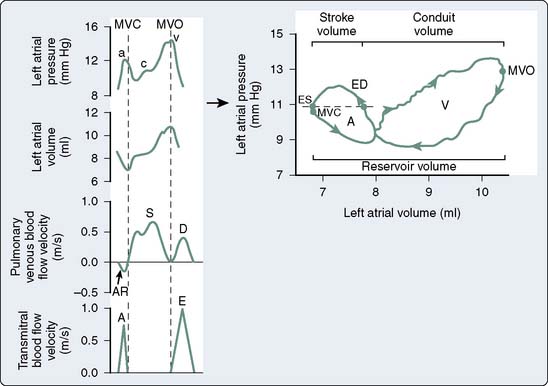
The LA pressure waveform is composed of three major deflections during normal sinus rhythm. The LA contracts immediately after the P wave of atrial depolarization is recorded on the electrocardiogram, producing the “a” wave of atrial systole. This a wave may be enhanced by an increase in LA preload or contractile state. The rate of deceleration of the a wave has been shown to be an index of LA relaxation.71 LV contraction with the onset of systole causes a pressure wave to be transmitted to the LA in retrograde fashion by closure of the mitral valve, resulting in a small increase in LA pressure. This “c” wave may become more pronounced in the presence of mitral valve prolapse. During late LV isovolumic contraction, LV ejection, and the majority of LV isovolumic relaxation, pulmonary venous blood progressively fills the LA and gradually increases LA pressure, resulting in the LA “v” wave. This v wave may be augmented in the presence of mitral regurgitation or reductions in LA compliance.72 RA pressure waveform deflections are similar to those observed in the LA. This RA a-c-v waveform morphology is transmitted to the jugular veins and may be clinically observed in the neck during routine physical examination in the supine position. In contrast with the biphasic nature of LA and RA pressure waveforms, the volume waveforms of these chambers are essentially monophasic. For example, minimum LA volume occurs immediately after the completion of LA contraction and corresponds closely to the mitral valve closure, whereas maximal LA volume is observed immediately before the mitral valve opens.
Pressure-volume diagrams
A time-dependent, two-dimensional (2D) plot of continuous LV pressure and volume throughout a single cardiac cycle creates a phase space diagram that provides a useful framework for the analysis of LV systolic and diastolic function in the ejecting heart (Figure 5-9). Otto Frank initially described the theoretic foundations of this technique at the end of the 19th century,73,74 but Hiroyuki Suga and Kiichi Sagawa† were the first to widely apply pressure-volume analysis after technologic advances enabled the continuous measurement of high-fidelity LV pressure (e.g., using a miniature micromanometer implanted in the chamber) and LV volume (e.g., sonomicrometry, conductance catheter).75–77 Alterations in LV pressure with respect to volume occur in a counterclockwise fashion over time. The cardiac cycle begins at end-diastole (point A, Figure 5-9). An abrupt increase in LV pressure at constant LV volume occurs during isovolumic contraction. Opening of the aortic valve occurs when LV pressure exceeds aorta pressure (point B, Figure 5-9) and ejection begins. LV volume decreases rapidly as blood is ejected from the LV into the aorta and proximal great vessels. When LV pressure declines below aortic pressure at the end of ejection, the aortic valve closes (point C, Figure 5-9). This event is immediately followed by a rapid decline in LV pressure in the absence of changes in LV volume (isovolumic relaxation). The mitral valve opens when LV pressure decreases to less than LA pressure (point D, Figure 5-9), thereby initiating LV filling. The LV pressure-volume diagram is completed as the LV refills its volume for the next contraction concomitant with relatively small increases in pressure during early filling, diastasis, and LA systole.
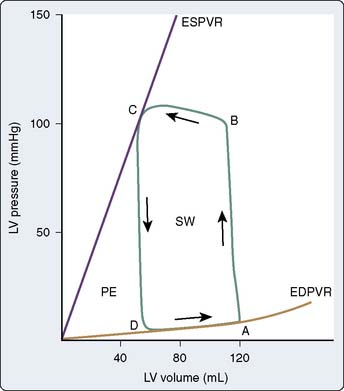
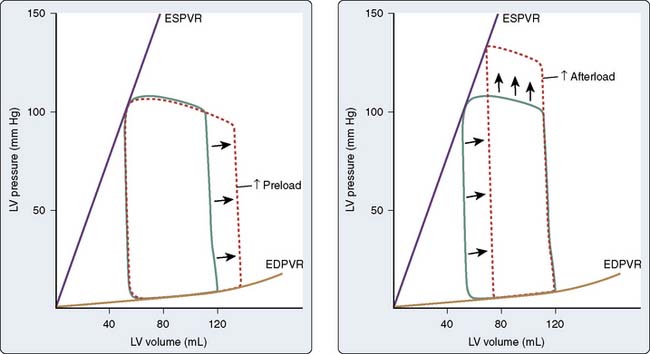
The steady-state LV pressure-volume diagram provides advantages over temporal plots of individual LV pressure and volume waveforms when recognizing major cardiac events without electrocardiographic correlation (e.g., aortic or mitral valve opening or closing) or identifying acute alterations in LV loading conditions. For example, end-diastolic and end-systolic volumes may immediately be recognized as the lower right (point A) and upper left (point C) corners of Figure 5-9, respectively, allowing rapid calculation of SV and EF. Movement of the right side of the pressure-volume diagram to the right is characteristic of an increase in preload concomitant with larger SV, whereas an increase in afterload causes the pressure-volume diagram to become taller (greater LV pressure) and narrower (decreased SV; Figure 5-10). The area of the diagram precisely defines the LV pressure-volume (stroke) work (kinetic energy) for a single cardiac cycle. As illustrative as a single LV pressure-volume diagram may be for obtaining basic physiologic information, it is the dynamic changes of a series of these LV pressure-volume diagrams occurring during an acute alteration in LV load over several consecutive cardiac cycles that truly provide unique insight into LV systolic and diastolic function. Such a series of differentially loaded LV pressure-volume diagrams may be generated by transient changes in preload or afterload using mechanical (e.g., vena caval or aortic constriction, respectively) or pharmacologic (e.g., sodium nitroprusside or phenylephrine infusions, respectively) techniques. This nested set of diagrams allows calculation of relatively HR- and load-insensitive estimates of myocardial contractility in vivo such as the end-systolic pressure-volume relation (ESPVR; the slope of the relation is termed end-systolic elastance [Ees])77 and the SW–end-diastolic volume relation (a linear Frank–Starling analog also known as “preload recruitable stroke work”78). This family of pressure-volume diagrams also describes the end-diastolic pressure-volume relation (EDPVR) that characterizes LV compliance and is a primary determinant of LV filling.38 Thus, the ESPVR and EDPVR define the operative constraints of the LV (see Figures 5-9 and 5-10). The ESPVR and the EDPVR are determined by the intrinsic properties of the LV during systole and diastole, respectively, but the relative positions of the end-diastolic and end-systolic points that lie along these lines for any given cardiac cycle are established primarily by venous return and arterial vascular tone (i.e., preload and afterload).79 This essential unifying concept emphasizes that analysis of overall cardiovascular performance in vivo must not consider the LV or the systemic circulation with which it interacts as an independent entity.80 The area to the left of the steady-state LV pressure-volume diagram that lies between the ESPVR and the EDPVR is the remaining potential energy of the system (see Figure 5-9) and is an important factor in determining the LV mechanical energetics and efficiency.81 RV systolic and diastolic function also may be quantified using the principles of this pressure-volume theory.82
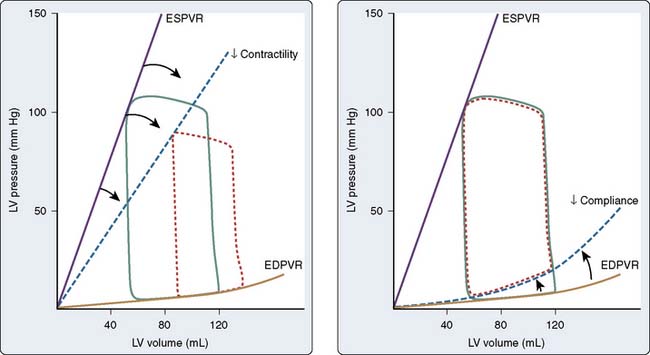
The pressure-volume plane also provides a valuable illustration of the pathophysiology of LV systolic or diastolic dysfunction as underlying causes for congestive HF.83 For example, a decrease in the ESPVR slope indicates that a reduction in myocardial contractility has occurred consistent with pure LV systolic dysfunction. Such an event is accompanied by a compensatory LV dilation (movement of the pressure-volume diagram to the right) along a normal EDPVR (Figure 5-11). This increase in preload may preserve SV and cardiac output (CO) but occurs at the cost of greater LV filling and pulmonary venous pressures.79 In contrast, an increase in the EDPVR denotes a reduction in LV compliance such that LV diastolic pressure is greater at each LV volume. Under these circumstances, myocardial contractility may remain relatively normal (the ESPVR does not change), but LV filling pressures are increased, thereby producing pulmonary venous congestion and clinical symptoms (see Figure 5-11). Simultaneous depression of the ESPVR and elevation of the EDPVR indicate the presence of both LV systolic and diastolic dysfunction. SV and CO may be severely reduced because available compensatory changes in preload or afterload, depicted by movement of the steady-state LV pressure-volume diagram within the ESPVR and the EDPVR boundaries, are quite limited under such conditions.
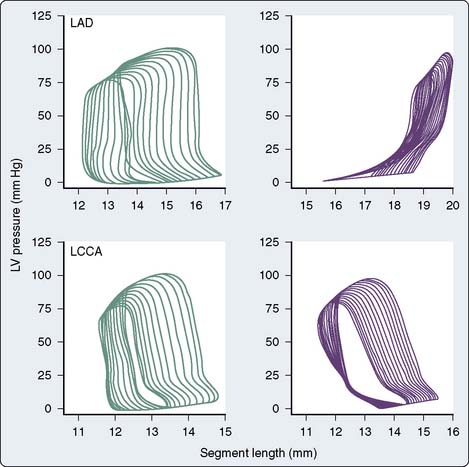
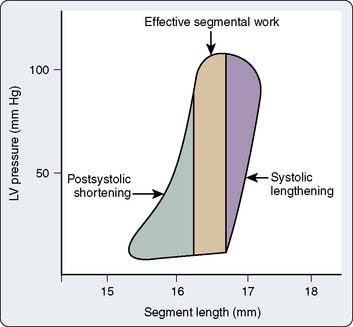
The pressure-volume plane may be extrapolated to a single region or dimension of the LV, and analogous LV pressure-dimension relationships may then be analyzed.84–86 For example, ultrasonic transducers placed within the LV wall may be used in the laboratory to measure changes in segment length87 or LV diameter88 during the cardiac cycle. Such transducers also may be placed on the LV epicardial and endocardial surfaces to measure continuous changes in wall thickness.86 The time for ultrasound to be transmitted between a pair of these transducers is directly proportional to the length between them (Doppler principle). Thus, segment length or chamber diameter normally increases during diastole and shortens during systole analogous to changes in continuous LV volume, whereas myocardial wall thickness decreases in diastole and increases during systole. Acute changes in LV loading conditions may then be used to generate a series of diagrams for measurement of LV end-systolic and end-diastolic pressure-segment length, pressure-wall thickness, or pressure-dimension relationships. The use of regional compared with global LV pressure-volume analysis is particularly advantageous when studying the mechanical consequences of myocardial ischemia.89 For example, acute occlusion of a major coronary artery produces a time-dependent collapse of the steady-state LV pressure-length diagram in the central ischemic zone consistent with a rapidly progressing decline and eventual complete absence of effective regional SW (Figure 5-12). In contrast, the LV pressure-segment length diagram tilts to the right in a moderately ischemic area such as a border zone surrounding a central ischemic region. This diagram may be divided into three regions that correspond to systolic lengthening (because of paroxysmal sysolic aneurysmal bulging of the ischemic zone), postsystolic shortening (shortening in the ischemic zone that occurs after ejection as a result of tethering to adjacent normal myocardium), and a variable area between the two that contributes to functional regional LV SW (Figure 5-13). These parameters may be used to quantify the relative intensity of regional myocardial ischemia.90
Pressure-volume analysis also may be applied to the study of atrial function. In contrast with the nearly rectangular shape of the LV pressure-volume diagram, the steady-state LA (or RA) pressure-volume diagram is composed of two intersecting loops arranged in a horizontal “figure-of-eight” pattern that incorporates active (“A” loop) and passive (“V” loop) components of LA function (Figure 5-14).91 The unusual shape of the LA pressure-volume diagram results primarily from the biphasic morphology of the LA pressure waveform. Beginning at the end of LV diastasis (corresponding to LA end-diastole), the active component of the diagram traces a counterclockwise outline during atrial systole as the LA ejects its contents into the LV through the open mitral valve. LA end-systole (corresponding to LV end-diastole) marks the end of atrial contraction and is defined by minimum LA volume. Thus, identification of LA end-diastole and end-systole on the LA pressure-volume diagram facilitates calculation of LASV and emptying fraction (analogous to LVEF). After the mitral valve closes, LA filling occurs during LV systole and isovolumic relaxation. LA pressure and volume gradually increase as the chamber is filled with pulmonary venous blood during this reservoir phase, thereby forming the bottom portion of the A loop and the upper portion of the V loop. The area of the A loop represents active LA SW92 (analogous to LV SW defined as the area inscribed by the LV pressure-volume diagram). The passive component (V loop) of the LA pressure-volume diagram proceeds in a clockwise direction as a consequence of external forces acting on the LA during this period of the cardiac cycle. Total LA reservoir volume is easily determined from the steady-state LA pressure-volume diagram as the difference between maximum and minimum LA volumes.71 The V loop area represents the total passive elastic energy stored by the LA during the reservoir phase and, thus, is an index of reservoir function.93 The slope of the line between minimum LA pressure of the A loop and maximum LA pressure in the V loop has been used as an index of static LA compliance. Regional myocardial ischemia22 or severe LV dysfunction94 increase the slope of this line, indicating that a decrease in compliance is present. LA emptying after mitral valve opening causes a rapid decline in LA volume that forms the bottom portion of the V loop. Additional pulmonary venous return also enters the LA during LV diastasis, but this blood flow does not alter LA volume because the mitral valve is open. Thus, the LA conduit phase is defined between mitral valve opening and LA end diastole, and LA conduit volume is calculated as the difference between maximum and end-diastolic volumes (see Figure 5-14). The interrelation among LA loading conditions, LA and LV contractile state, the rate and extent of LA relaxation, LA elastic properties, and pulmonary venous blood flow combine to determine the relative areas of the A and V loops and the point of intersection between them.91 Analogous to the observations in the LV, acute alterations in LA loading conditions may be used to assess LA myocardial contractility and dynamic compliance using LA end-systolic and end-reservoir pressure-volume relations.41,95,96
Determinants of pump performance
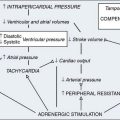
The ability of each cardiac chamber to function as a hydraulic pump depends on how effectively it is able to collect (diastolic function) and eject (systolic function) blood. For the sake of this discussion, the focus is on the LV, but the principles that determine LV pump performance are equally applicable to the RA, LA, and RV as well. From a clinical perspective, LV systolic function is most often quantified using CO (the product of HR and SV) and EF. These variables are dependent not only on the intrinsic contractile properties of the LV myocardium itself, but the quantity of blood the chamber contains immediately before contraction commences (preload) and the external resistance to emptying with which it is confronted (afterload). This complex interaction among preload, afterload, and myocardial contractility establishes the SV and EF generated during each cardiac cycle (Figure 5-15). When combined with HR and rhythm, preload, afterload, and myocardial contractility determine the volume of blood that the LV is capable of pumping per minute (CO) assuming adequate venous return. Malfunction of the mitral and aortic valves (e.g., regurgitation) or the presence of an anatomically abnormal route of intracardiac blood flow (e.g., ventricular septal defect with left-to-right shunt) reduces effective forward flow, thereby limiting the use of SV, CO, and EF as indices of LV systolic performance. Thus, the structural integrity of the LV is also a key determinant of its systolic function. Pulmonary venous blood flow, LA function, mitral valve integrity, pericardial restraint, and the active (relaxation) and passive elastic (compliance) mechanical properties of the LV during diastole determine its ability to properly fill. LV diastolic function is considered to be normal when these factors combine to provide the LV preload that is adequate to establish sufficient CO required for cellular metabolism while maintaining normal pulmonary venous and mean LA pressures (approximately 10 mm Hg for each).97 In contrast, LA or mitral valve dysfunction, delayed LV relaxation, reduced LV compliance, or increased pericardial pressure may substantially restrict the ability of the LV to properly fill unless pulmonary venous and LA pressures are increased. Thus, LV diastolic dysfunction is invariably associated with increases in pulmonary venous and LA pressures, and may lead to the development of signs and symptoms of congestive HF independent of changes in LV systolic function.
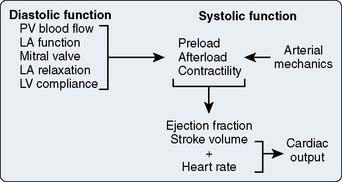
Figure 5-15 The major factors that determine left ventricular (LV) diastolic (left) and systolic (right) function.

Heart Rate
An alteration in the stimulation frequency of isolated cardiac muscle produces a parallel change in LV contractile state. The Bowditch, “staircase,” or “treppe” (German for “stair”) phenomenon or “force-frequency” relation has been demonstrated in the isolated98 and intact LV.99 Enhanced Ca2+ cycling efficiency and myofilament Ca2+ sensitivity are responsible for this stimulation-rate dependence of contractile state. Maximal contractile force occurs at 150 to 180 stimulations per minute during isometric contraction of isolated cardiac muscle. From a clinical perspective, this “treppe”-induced increase in LV contractility is especially important during exercise by matching CO to venous return at HRs approaching 175 beats/min in highly trained endurance athletes. However, contractility deteriorates above this HR because the intracellular mechanisms responsible for Ca2+ removal from the contractile apparatus are overwhelmed and LV diastolic filling time is markedly attenuated.100 These factors directly contribute to the development of hypotension during tachyarrhythmias or very rapid pacing. An increase in HR within the normal physiologic range has little effect on overall pump performance despite the modestly associated increase in LV contractile state,101 but tachycardia and its resultant “treppe”-induced enhanced contractility are essential compensatory mechanisms that serve to maintain CO during disease states characterized by severely restricted LV filling (e.g., pericardial tamponade, constrictive pericarditis).102 Myocardial hypertrophy decreases the stimulation rate at which the peak “treppe” effect occurs, whereas this phenomenon may be completely abolished in failing myocardium. Another example of the force-frequency relation occurs when a prolonged delay is observed between beats (e.g., associated with an AV conduction abnormality) or after an LV extrasystole. Under these conditions, the force of the subsequent LV contraction is enhanced. This phenomenon is termed the interval-strength effect. A time-dependent increase in the amount of Ca2+ available for contractile activation and an increase in preload resulting from greater diastolic filling are most likely responsible for the interval-strength effect.103,104

Preload
A definition of preload as sarcomere length immediately before the onset of myocyte contraction is certainly useful, but such a definition may be of limited practical utility in an ejecting heart because of the dynamic, 3D changes in geometry that occur in each chamber during the cardiac cycle. As a result, preload is most often defined as the volume of blood contained within each chamber at its end-diastole.‡ This blood volume effectively establishes the length of each LV sarcomere immediately before isovolumic contraction and is directly related to LV end-diastolic wall stress.105 Nevertheless, precise real-time measurement of continuous LV volume throughout the cardiac cycle (including LV volume at end-diastole) remains technically challenging.106 Continuous LV volume may be approximated using ultrasonic sonomicrometers implanted in a 3D orthogonal array in the LV subendocardium,107 and mathematical models may then be applied to generate remarkably accurate estimates of LV volume in the laboratory. The conductance catheter is another extensively validated method of measuring continuous LV volume in experimental animals108 and patients in the cardiac catheterization laboratory.109,110 This technique involves placement of a multiple-electrode catheter within the LV cavity to establish a series of cylindrical electric current fields and measure time-varying voltage potentials from which intraventricular conductance is determined and LV volume is estimated.111 As discussed later, continuous LV volume waveforms derived using either sonomicrometry or conductance catheter techniques are beneficial for formal pressure-volume analysis of LV systolic and diastolic function in vivo, but the use of such invasive methods to determine LV end-diastolic volume is obviously impractical in patients undergoing cardiac surgery. Similarly, LV volume may be accurately measured using noninvasive methods such as radionuclide angiography or dynamic magnetic resonance imaging (MRI), but these techniques also cannot be used in the operating room. Instead, cardiac anesthesiologists most often rely on dimensional approximations of LV end-diastolic volume using 2D transesophageal echocardiography (TEE). The transgastric LV midpapillary short-axis imaging plane is particularly useful for estimating LV end-diastolic area or diameter. For example, an acute decrease in LV preload may be easily recognized by a corresponding reduction in the end-diastolic area and diameter of the chamber concomitant with physical contact (“kiss”) between the anterior-lateral and posterior-medial papillary muscles. Real-time 3D TEE also may be used to quantify LV end-diastolic volume, but this technology has only recently become commercially available.
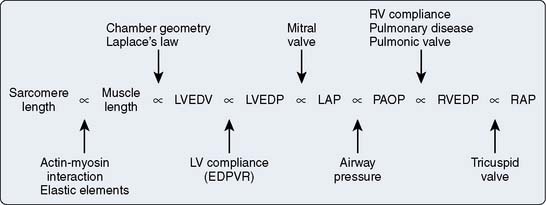
LV preload may be estimated using a variety of other methods, each of which has inherent limitations (Figure 5-16). LV end-diastolic pressure may be measured invasively in the cardiac catheterization laboratory or during surgery by advancing a fluid-filled or pressure transducer-tipped catheter from the aorta across the aortic valve or through the LA across the mitral valve into the LV chamber. LV end-diastolic pressure is related to end-diastolic volume based on the nonlinear EDPVR and, as a result, may not accurately quantify end-diastolic volume.112 Other estimates of LV end-diastolic volume commonly used by cardiac anesthesiologists are dependent on measurements obtained further “upstream” from the LV. Mean LA, pulmonary capillary occlusion (wedge), pulmonary arterial diastolic, RV end-diastolic, and RA (central venous) pressures may be used to approximate LV preload. These estimates of LV end-diastolic volume are affected by functional integrity of the structures that separate each measurement location from the LV itself. For example, a correlation between RA and LV end-diastolic pressures assumes that the fluid column between the RA and LV has not been adversely influenced by pulmonary disease, airway pressure during respiration, RV or pulmonary vascular pathology, LA dysfunction, mitral valve abnormalities, or LV compliance. The complex relation between these structures may be fully intact in healthy subjects, but this may not be the case in patients with significant pulmonary or cardiac disease who, in particular, may require accurate assessment of LV preload to assure optimal cardiac performance. The correlation among LV end-diastolic volume, pulmonary artery occlusion pressure, and RA pressure is notoriously poor in patients with compromised LV systolic function,113 and measurement of such pressures “upstream” from the LV may be of limited clinical use in the assessment of LV preload under these circumstances. The author uses the terms preload and end-diastolic volume as synonyms in the remainder of this chapter unless otherwise noted.

Afterload
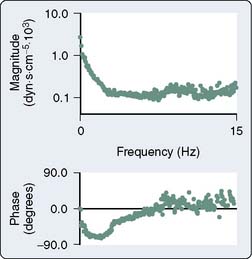
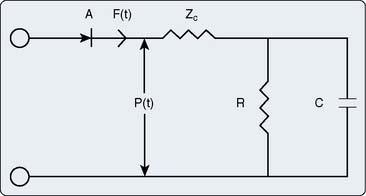
Afterload is defined as the additional load to which cardiac muscle is subjected immediately after the onset of contraction. This definition of afterload is intuitively clear and easily quantified in an isolated cardiac muscle preparation, but is more difficult to envision and measure in the intact cardiovascular system even under tightly controlled experimental conditions (Table 5-2). Impedance to LV or RV ejection by the mechanical properties of the systemic or pulmonary arterial vasculature provides the foundation for a definition of afterload in vivo. Several approaches have been used to quantify afterload. Aortic input impedance [Zin(ω); the complex ratio of aortic pressure (the forces acting on the blood) to blood flow (the resultant motion)] is derived from power spectral or Fourier series analysis of simultaneous, high-fidelity measurements of aortic pressure and blood flow, and provides a comprehensive description of LV afterload that incorporates arterial viscoelasticity, frequency dependence, and wave reflection.114,115 Zin(ω) is characterized by modulus and phase angle spectra expressed in the frequency domain (Figure 5-17).116 Zin(ω) is most often interpreted using an electrical three-element Windkessel model117 of the arterial circulation that describes characteristic aortic impedance (Zc), total arterial compliance (C), and total arterial resistance (R; Figure 5-18).118 Zc represents aortic resistance to LV ejection; C is determined primarily by the compliance of the aorta and proximal great vessels; and represents the energy storage component of the arterial circulation, and R equals the combined resistances of the remaining arterial vasculature. The three-element Windkessel model has been shown to closely approximate Zin(ω) under a variety of physiologic conditions.117–119 RV afterload also has been described using pulmonary input impedance spectra interpreted using a similar Windkessel model.
| Aortic input impedance (magnitude and phase spectra) |
| Windkessel parameters |
| Characteristic aortic impedance (Zc) |
| Total arterial compliance (C) |
| Total arterial resistance (R) |
| End-systolic pressure |
| End-systolic wall stress |
| Effective arterial elastance (Ea) |
| Systemic vascular resistance |
The mechanical forces to which the LV is subjected during ejection also may be used to define LV afterload as LV end-systolic wall stress. Increases in LV pressure and wall thickness occur during isovolumic contraction and are accompanied by a large reduction in LV volume (radius) after the aortic valve opens. These factors combine to cause a dramatic increase in LV systolic wall stress as predicted by Laplace’s law. LV systolic wall stress reaches a maximum during early LV ejection and declines thereafter.47 Such changes in continuous LV systolic wall stress have several important physiologic consequences. For example, peak LV systolic wall stress is a major stimulus of LV concentric hypertrophy in disease states characterized by chronic pressure overload (e.g., poorly controlled essential hypertension, aortic stenosis).47,120 The integral of LV systolic wall stress with respect to time is an important determinant of myocardial oxygen demand.121 The relation between LV end-systolic wall stress and the HR-corrected maximal velocity of circumferential fiber shortening (Vcfs) during contraction has been used as a relatively HR- and load-independent index of contractile state in humans because each parameter may be derived noninvasively using echocardiography.122 LV end-systolic wall stress identifies the magnitude of force that prevents further fiber shortening at the end of ejection, thereby determining the degree of LV emptying that may occur at a fixed inotropic state. Thus, LV end-systolic wall stress defines the maximal isometric value of instantaneous myocardial force at end ejection for each chamber size, thickness, and pressure, and incorporates both internal cardiac forces and those external to the heart (the arterial system) that oppose it.123–125 As suggested in the previous discussion of Laplace’s law, the use of LV end-systolic wall stress as a quantitative index of LV afterload may be complicated by LV geometry assumptions, the nonlinear force distribution between the subendocardium and subepicardium, and the nonuniformity of wall thickness throughout the LV.51 Such difficulties may become especially important when abnormal regional wall motion is present (e.g., critical coronary artery stenosis or occlusion, LV remodeling after infarction).
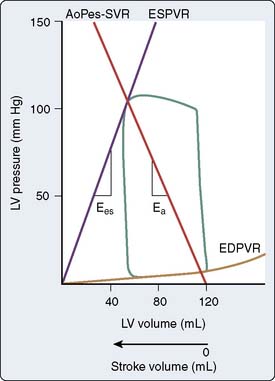
Optimal transfer of energy from the LV to the arterial circulation during ejection requires coupling of these mechanical systems and provides another interpretation of LV afterload.126,127 LV-arterial coupling most often has been described using a series elastic chamber model of the cardiovascular system in which LV elastance (Ees) and effective arterial elastance (Ea) are determined in the pressure-volume plane using the slopes of the LV ESPVR and aortic end-systolic pressure-SV relation, respectively (Figure 5-19).128 The ratio of Ees to Ea formally defines coupling between the LV and the arterial circulation,129,130 identifies the SV that may be transferred between these elastic components, and provides a useful foundation from which to study energetics and myocardial efficiency.81 As such, Ea is strictly a composite coupling variable that is affected by total arterial resistance and total arterial compliance, but this parameter also has been suggested as a measure of LV afterload that is somewhat analogous to LV end-systolic wall stress.126 The product of Ea and HR also approximates systemic vascular resistance (SVR). Nevertheless, Ea alone most likely should not be used to quantify LV afterload because this variable does not strictly incorporate alterations in characteristic aortic impedance, an important high-frequency component of arterial mechanical behavior, nor does it consider arterial wave reflection properties.
The magnitude of Zin(ω) is primarily dependent on total arterial resistance131 and, thus, may be reasonably approximated by SVR, the most commonly used estimate of LV afterload in clinical anesthesiology. SVR is a simple ratio of pressure to flow (analogous to Ohm’s law) that is calculated using the familiar formula (MAP − RAP)80/CO, where MAP and RAP are mean arterial and right atrial pressures, respectively, CO is cardiac output, and 80 is a constant that converts mm Hg/min/L to dynes • sec • cm−5. However, SVR is an inadequate quantitative description of LV afterload because this parameter ignores the mechanical characteristics of the blood (e.g., viscosity, density) and arterial walls (e.g., compliance); does not consider the frequency-dependent, phasic nature of arterial blood pressure and blood flow; and fails to incorporate arterial wave reflection. The phasic contributions to arterial load become especially important in the presence of advanced age, peripheral vascular disease, and tachycardia.132,133 As a result, SVR cannot be reliably used to quantify changes in LV afterload produced by vasoactive drugs or cardiovascular disease and, instead, should be used as a nonparametric estimate of LV afterload.134
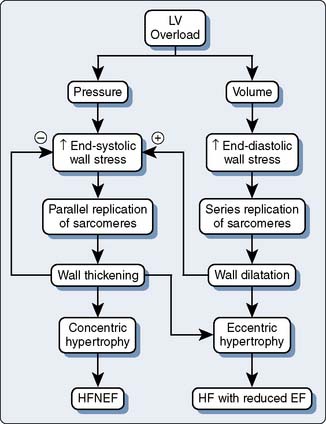
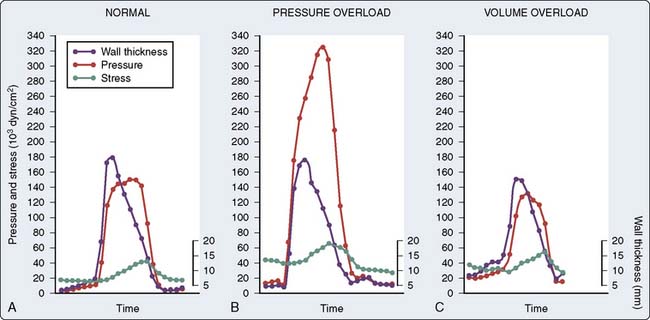
It is clear based on the previous discussion that four major components mediate LV afterload in the intact cardiovascular system: (1) the physical properties (e.g., diameter, elasticity) of arterial blood vessels; (2) LV end-systolic wall stress (determined by LV pressure development and the geometric changes in the LV chamber required to produce it); (3) total arterial resistance (determined primarily by arteriolar smooth muscle tone); and (4) the volume and physical properties (e.g., rheology, viscosity, density) of blood. An acute increase in LV afterload is most often well tolerated in the presence of normal LV systolic function, but the performance of the failing LV is more sensitive to an increase in afterload (Figure 5-20),135,136 and such an event may precipitate further LV dysfunction. Reflex activation of the sympathetic nervous system occurs in response to LV systolic dysfunction, but this compensatory mechanism also inadvertently increases LV afterload and may further decrease CO, especially when combined with pathologic abnormalities that reduce arterial compliance (e.g., atherosclerosis). LV hypertrophy is an important adaptive response to chronic increases in LV afterload that serves to reduce LV end-systolic wall stress by increasing wall thickness and thereby may preserve LV systolic function, but the greater mass of LV myocardium associated with hypertrophy also substantially increases the risk for myocardial ischemia and contributes to the development of LV diastolic dysfunction (Figures 5-21 and 5-22). Thus, the primary therapeutic objective in the management of acutely or chronically increased LV afterload is directed at reduction of the inciting stress.
Descriptions of RV afterload are similar to those described for the LV with two important differences: The pulmonary arterial vasculature is more compliant than its systemic arterial counterpart, and the RV is more sensitive to acute changes in afterload than the LV. The ability of the AV valves to open freely and the compliance of the LV and RV are the primary determinants of LA and RA afterload, respectively. A model of LA afterload based on analogous descriptions of LV-arterial coupling also has been developed using combined LA and LV pressure-volume analysis and has been used to characterize LA compensatory responses to alterations in LA afterload.94,96

Myocardial Contractility
Rigid control of loading conditions and measurement of the velocity, force, and extent of muscle shortening facilitate accurate determination of myocardial contractility in isolated cardiac muscle preparations, but quantifying inotropic state in the intact heart has proved to be challenging. The ability to precisely assess LV or RV contractility remains an important objective that may allow the cardiac anesthesiologist to reliably evaluate the effects of pharmacologic interventions or pathologic processes on LV or RV systolic performance. To date, a “gold standard” of myocardial contractility in vivo has yet to be developed, and all contractile indices proposed, including those derived from pressure-volume analysis, have significant limitations because contractile state and loading conditions are fundamentally interrelated at the level of the sarcomere.137,138 Many indices of myocardial contractility have been suggested that may be classified into four broad categories (Table 5-3): pressure-volume relations, isovolumic contraction, ejection phase, and power analysis.
| Pressure-Volume Analysis |
| End-systolic pressure-volume relation (Ees) |
| Stroke work—end-diastolic volume relation (Msw) |
| Isovolumic Contraction |
| dP/dtmax |
| dP/dtmax/50 |
| dP/dtmax/P |
| dP/dtmax/end-diastolic volume relation (dE/dtmax) |
| Ejection Phase |
| Stroke volume |
| Cardiac output |
| Ejection fraction |
| Fractional area change |
| Fractional shortening |
| Wall thickening |
| Velocity of shortening |
| Ventricular Power |
| PWRmax |
| PWRmax/EDV2 |
dE/dtmax, slope of the dP/dtmax–end-diastolic volume relation; dP/dtmax, maximum rate of increase of left ventricular pressure; EDV, end-diastolic volume; Ees, end-systolic elastance; Msw, slope of the stroke work–end-diastolic volume relation; P, peak left ventricular pressure; PWRmax, maximum left ventricular power (product of aortic pressure and blood flow).
End-Systolic Pressure-Volume Relations
The relation between LV pressure and volume may be described in terms of time-varying elastance (the ratio of pressure to volume).75,76 LV elastance increases during systole as LV pressure increases and LV volume declines. Maximum LV elastance (Emax) occurs at or very near end-systole for each cardiac cycle and usually corresponds to the left upper corner of the steady-state LV pressure-volume diagram. Analogously, minimum LV elastance is observed at end-diastole. Thus, E(t) = P(t)/[V(t) − V0], where E(t) is the time-varying elastance, P(t) and V(t) are the time-dependent changes in LV pressure and volume, respectively, during the cardiac cycle, and V0 is LV volume at 0 mm Hg LV pressure (unstressed volume). The relation between each Emax of a differentially loaded series of LV pressure-volume diagrams is linear within the normal physiologic range at a constant inotropic state and establishes the ESPVR. The slope (Ees; designating “end-systolic elastance”) of the ESPVR is a quantitative index of LV contractile state that incorporates afterload because the analysis is conducted at end-systole (Figure 5-23). As a result, the time-varying elastance equation may be rewritten at end-systole as Pes = Ees(Ves − V0), where Pes and Ves are LV end-systolic pressure and volume, respectively. Thus, an increase in the magnitude of Ees produced by a positive inotropic drug (e.g., epinephrine) quantifies the increase in LV contractility that has occurred. Regional LV contractility may also be determined using pressure-dimension relations based on determinations of continuous segment length, LV midpapillary short-axis diameter, or wall thickness,84,86,139 and usually reflects global LV systolic function in the absence of wall motion abnormalities.107 LV ESPVR or dimension relations have been derived noninvasively using radionuclide angiography140 or 2D echocardiography141 with automated border detection142 to measure continuous LV volume or area. In addition, single-beat estimates of Ees (determined as the simple ratio of Pes to Ves or derived using a modified time-varying elastance method) were proposed that may provide quantitative information about contractile state assuming that the value V0 remains small.143,144 The principle of time-varying elastance also has been successfully applied to the study of RV82 and atrial contractility41 (Figure 5-24) in the intact heart.
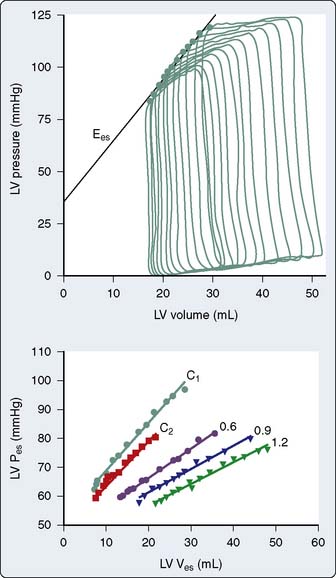
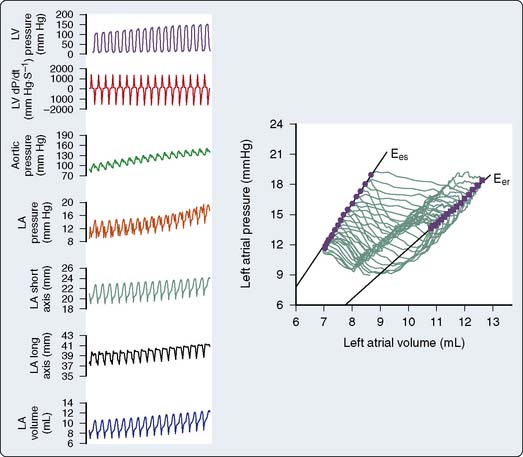
The simplicity and elegance of time-varying elastance model of LV contractility may be particularly attractive from an engineering perspective, but a number of potential pitfalls were subsequently identified after its initial description that may limit the use of Ees as a clinical index of inotropic state. The position of unstressed volume (V0) does not consistently remain constant during alterations in contractility.77,145 For example, administration of dobutamine not only increases Ees, but also shifts the ESPVR to the left (decrease in V0),145 whereas acute coronary artery occlusion-induced regional LV dysfunction has the opposite effect.146 Thus, both Ees and V0 may reflect alterations in LV contractility, and an index of inotropic state based on the combined effects of these variables was proposed as a result.147 Several consecutive LV pressure diagrams must be obtained over a range of LV loading conditions to accurately define Ees and V0, but this necessary intervention may inadvertently produce baroreceptor reflex–mediated increases in HR and contractility during generation of the ESPVR by activating the sympathetic nervous system.148 Emax or aortic valve closure may not occur precisely at end-systole in the presence of markedly increased or reduced LV afterload and may be delayed or occur earlier, respectively.149 Thus, Emax may deviate from its normal position in the left upper corner of the LV pressure-volume diagram, thereby introducing errors into the derivation of ESPVR. The units of Ees are millimeters of mercury per milliliter (mm Hg/mL), and as a result, Ees is inherently dependent on chamber size despite efforts to standardize its measurement.150,151 This volume dependence of Ees may complicate direct comparison of contractile state between patients with different LV sizes. Other potential limitations of the use of Ees as an index of contractile state include lack of measurement precision,152 nonlinearity,153 load sensitivity,154 dependence on underlying autonomic nervous system balance155 or ejection-mediated alterations on LV pressure generation,156 and interaction with LV diastolic function.157 Despite these concerns, the ESPVR is a superb conceptual tool with which to examine contractile state and its interactions with loading conditions in vivo.
Stroke Work–End-Diastolic Volume Relations
Early studies by Frank73 and Starling158 initially defined a fundamental relation between LV pump performance (e.g., CO) and preload determined using indirect indices of LV filling (e.g., central venous pressure). Sarnoff and Berglund159 extended these seminal investigations in his landmark description of LV or RV function curves that relate estimates of SW to filling pressures. In this familiar framework, movement of an LV function curve upward or to the left indicated that an increase in contractile state had occurred because the LV was now able to effectively generate more SW at an equivalent preload. Unfortunately, these LV function curves were inherently nonlinear and difficult to quantify because the technology available to Sarnoff at the time precluded his ability to precisely measure LV SW and end-diastolic volume. Glower et al78 used a high-fidelity LV micromanometer and 3D orthogonal endocardial sonomicrometers to measure continuous LV pressure and volume, respectively, in a pressure-volume reexamination of Sarnoff’s original hypothesis. These investigators demonstrated that the relationship between each LV SW–end-diastolic volume (Ved) pair obtained from a series of differentially loaded LV pressure-volume diagrams was indeed linear such that SW = Msw(Ved − Vsw), where Msw and Vsw were the slope and volume intercept of the relation (Figure 5-25). Thus, Msw was shown to quantify alterations in LV inotropic state in a relatively load-independent manner because preload is already incorporated and, unlike the ESPVR, its determination does not occur solely at end-systole. Similar linear relations between regional work and dimensional measurements (e.g., segment length, wall thickness) also may be used to quantify changes in regional contractile state. Notably, LV SW-Ved relations may be calculated with the same series of pressure-volume diagrams used to determine the ESPVR.
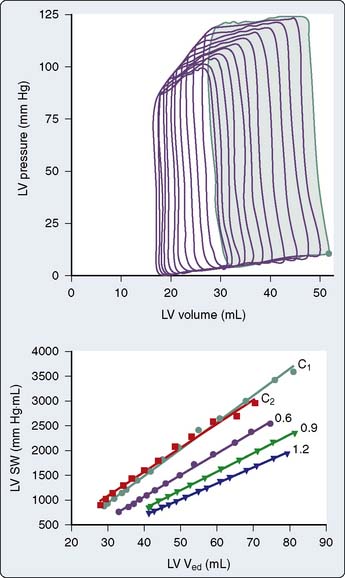
The SW-Ved relation offers several advantages over the ESPVR for the determination of LV or RV contractility. The SW-Ved relation is highly linear and reproducible over a wide variety of loading conditions, arterial blood pressures, and contractile states because LV pressure and volume data from the entire cardiac cycle are incorporated into its calculation.78,152 Conversely, the ESPVR displays more pronounced curvilinear behavior and may be more susceptible to instrument noise because it is determined at a single instantaneous time point (end-systole).154 The ESPVR may also demonstrate some degree of afterload sensitivity,160 but the SW-Ved relation is essentially afterload-independent over a wide physiologic range.78 Unlike Ees, the unit of Msw is millimeters of mercury (mm Hg); therefore, quantification of LV contractile state may be performed independent of chamber size. Thus, Msw allows direct comparisons of contractility to be made between patients with varying LV size. Nevertheless, the SW-Ved relation has two disadvantages compared with the ESPVR. First, integration of data from the entire cardiac cycle implies that the SW-Ved relation does not strictly separate LV systolic events from those that occur during diastole. Thus, a reduction in LV compliance without a simultaneous change in the ESPVR (as may be observed in the presence of LV pressure-overload hypertrophy) may introduce errors into the calculation of LV contractile state using the SW-Ved relation.138 Second, partial collapse of the LV pressure-volume diagram during regional myocardial ischemia90 makes calculation of LV contractility more difficult using the SW-Ved relation compared with the ESPVR.161 Despite these relatively minor potential shortcomings, the SW-Ved relation provides a useful index of LV or RV contractile function in the intact heart that has been successfully applied in a variety of laboratory settings and in patients with heart disease.
Isovolumic Indices of Contractility
The maximum rate of increase of LV pressure (dP/dtmax) is the most commonly derived index of global LV contractile state during isovolumic contraction. Precise determination of LV dP/dtmax requires high-fidelity, invasive measurement of continuous LV pressure and usually is performed in the cardiac catheterization laboratory. LV dP/dtmax also may be noninvasively estimated using TEE in patients undergoing cardiac surgery by analysis of the continuous-wave Doppler mitral regurgitation waveform.162 LV dP/dtmax is very sensitive to acute alterations in contractile state163 but is probably most useful when quantifying directional changes in contractility rather than establishing an absolute baseline value.164 LV dP/dtmax is essentially afterload-independent because the peak rate of increase of LV pressure occurs before the aortic valve opens unless severe myocardial depression or pronounced arterial vasodilation is present.165 However, LV preload profoundly affects dP/dtmax, and an increase in LV dP/dtmax produced by either greater preload or enhanced contractile state may be virtually indistinguishable. LV mass, chamber size, and mitral or aortic valve disease also affect LV dP/dtmax. In addition, LV dP/dtmax may not detect changes in contractile state produced by regional myocardial ischemia because LV dP/dtmax is an index of global LV systolic function. The failure of LV dP/dtmax to detect such an alteration in regional dysfunction resulting from compromised coronary perfusion may occur because of a compensatory increase in contractility in the remaining normal myocardium through activation of the Frank–Starling mechanism or an increase in sympathetic nervous system activity. The rate of increase of LV pressure at a fixed developed pressure [e.g., dP/dt measured at 50 mm Hg (dP/dt50)] and the ratio of dP/dt to peak developed LV pressure (dP/dt/P) also have been proposed as isovolumic indices of contractility. These measures of LV contractile state may be somewhat less preload dependent than LV dP/dtmax, but neither provides any truly unique additional information compared with LV dP/dtmax.
The preload dependence of LV dP/dtmax may be used to derive another index of myocardial contractility based on the pressure-volume framework. Similar to the SW-Ved relation, the relation between each pair of LV dP/dtmax and Ved values obtained from a differentially loaded series of LV pressure-volume diagrams was shown to be linear such that LV dP/dtmax = dE/dtmax(Ved − V0), where dE/dtmax is the slope and V0 is the volume intercept of the relation.166 Like Ees and Msw, alterations in dE/dtmax produced by inotropic drugs or cardiac disease may be used to quantify changes in LV contractile state. For example, the LV dP/dtmax-Ved relation was shown to precisely determine alterations in contractility in the normal and regionally ischemic LV.166,167 Furthermore, LV dE/dtmax and Ees are mathematically related,166 and interventions that shift the ESPVR without altering Ees also shift the volume intercept of the LV dP/dtmax-Ved relation without changing dE/dtmax as well.138 Similar to the ESPVR, the LV dP/dtmax-Ved relation becomes more curvilinear at greater LV volumes or contractile states, a finding that is predicted based on isolated cardiac muscle mechanics.168 Direct comparison among the ESPVR, the SW-Ved relations, and the LV-dP/dtmax relation also indicated that dE/dtmax may be more variable than either Ees or Msw during acute changes in contractile state.152 RV dP/dtmax-Ved relations also have been described.44
Ejection Phase Indices of Contractility
Examination of the degree (e.g., EF, SV) or the rate (e.g., velocity of shortening) of LV ejection forms the basis of all currently used ejection phase indices of LV contractile state, including newer echocardiography parameters derived from tissue Doppler imaging, myocardial stress-strain relations, speckling tracking technology, and endocardial color kinesis. From a clinical perspective, the most common ejection phase index of LV contractility is EF, where EF = Ved-Ves/Ved. LVEF may be calculated using a variety of noninvasive techniques (e.g., radionuclide angiography, functional MRI, echocardiography). Cardiac anesthesiologists most often measure LVEF using 2D TEE. Midesophageal four- or two-chamber images are obtained at LV end-systole and end-diastole and are subsequently analyzed by applying Simpson’s rule of disks (Figure 5-26). This method of measuring LVEF is simple, but it is rather time-consuming and may be impractical during rapidly changing hemodynamic conditions. As a result, two closely related parameters, fractional shortening (FS) and fractional area of change, are often calculated as surrogate measures of LVEF in the midpapillary short-axis plane using images obtained at end-systole and end-diastole. FS is calculated from endocardial measurements of anterior-posterior (or septal-lateral) wall diameter as FS = Ded − Des/Ded, where Ded and Des are endocardial end-diastolic and end-systolic diameters, respectively (Figure 5-27). Fractional area change (FAC) may be determined using the same midpapillary short-axis images by manually tracing the endocardial borders (the papillary muscles are most often excluded) at end-systole and end-diastole (see Figure 5-27). Computer software automatically integrates the end-systolic and end-diastolic areas (Aes and Aed, respectively) within each endocardial tracing, and FAC is calculated as Aed − Aes/Aed. These and all other ejection phase indices are inherently dependent on both LV contractile state and loading conditions.80 Because preload is incorporated into the denominators of EF, FAC, and FS (Ved, Aed, and Ded, respectively), these indices are relatively unaffected by moderate preload alterations in the presence of normal mitral and aortic valve function.169 Myocardial stress-strain relations or speckle tracking techniques also may include similar modifications (e.g., Lagrangian or natural strain) designed to minimize such intrinsic preload dependency. Nevertheless, EF, FAC, FS, and related variables derived from newer technologies decrease linearly with increases in afterload and also vary inversely with HR, and as a result, are relatively insensitive indices of LV contractile state. Similar to the observations with LV dP/dtmax, EF and FAC are global measures of pump performance that may not adequately reflect regional contractile dysfunction produced by myocardial ischemia or infarction. Ejection phase indices also may provide inaccurate information about contractility in the presence of mitral or aortic valvular disease, LV chamber enlargement, or LV hypertrophy.120,170,171 Similar difficulties with load and HR dependency are encountered when ejection phase indices are used in an attempt to quantify RV or atrial contractile state.
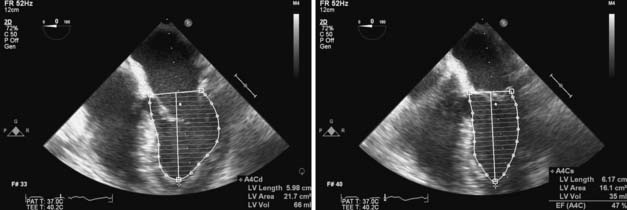
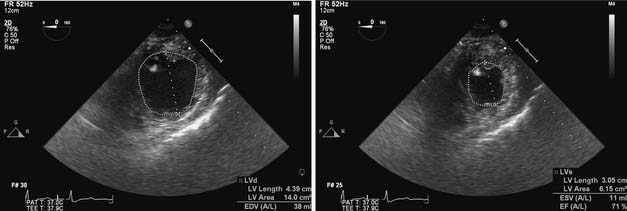
The rate of myocardial fiber shortening also provides information about the LV contractile state during ejection. Maximal or mean velocity of circumferential fiber shortening may be determined using a variety of invasive and noninvasive techniques. The midpapillary short-axis view on TEE is especially useful for cardiac anesthesiologists measuring these variables in the operating room. Maximal velocity of circumferential fiber shortening (Vcfs) is calculated as the ratio of FS to ejection time and may be more sensitive to changes in contractile state than EF because the velocity, rather than the magnitude, of shortening is evaluated. Nevertheless, Vcfs also varies directly with HR and inversely with changes in afterload similar to other ejection phase indices.165 Methods for correcting the inherent HR and afterload dependency of Vcfs have been proposed that are based on the force-velocity behavior of isolated cardiac muscle. For example, a linear relation was demonstrated between LV end-systolic wall stress and HR-corrected Vcfs, and the slope of this relation provided a relatively HR- and afterload-independent index of LV contractile state in healthy patients123 and those with hypertension or valve disease.120,122 A similar relation between EF and effective arterial elastance also was described.172 Unfortunately, these and other analogous techniques173 have not achieved widespread clinical application because extensive analysis is required after data have been acquired.
Contractile Indices Based on Ventricular Power
The product of LV or RV pressure and aortic or pulmonary blood flow defines LV or RV power, respectively. Maximal LV power (PWRmax) and the rate of increase of LV power during ejection are sensitive to alterations in contractile state,174,175 but these indices are also profoundly affected by LV preload. In contrast, the ratio of LV PWRmax to the square of end-diastolic volume (PWRmax/Ved2) largely eliminates this preload dependence and allows the rapid calculation of LV contractile state from data obtained during a single cardiac cycle.176 Alterations in LV contractile state determined using this preload-adjusted maximal power technique correlate with those calculated with the ESPVR (Ees) and the LV dP/dtmax-Ved relation (dE/dtmax), and also may be measured using noninvasive arterial blood pressure (e.g., tonometry, oscillometry) concomitant with 2D and Doppler echocardiography to define its pressure, flow, and dimension variables without the need for formal pressure-volume analysis.177,178 A regional power quotient using end-diastolic segment length (SLed) also correlated with the regional SW-SLed (Msw) and accurately quantified depression of LV contractility produced by volatile anesthetics.179