Chapter 5 Cardiac Computed Tomography
The clinical potential of computed tomography (CT) of the heart had always been limited by relatively long acquisition time and poor spatial resolution. The introduction of spiral multidetector CT scanning, and in particular, achievement of isotropic voxel acquisition, has shortened acquisition time, increased spatial and contrast resolution, and resulted in a dramatic expansion of the use of CT for evaluation of patients with acquired and congenital heart disease. Cardiac diagnosis by CT had always been limited to identification of abnormal calcification, or the observation of incidental findings, such as pleural or pericardial effusion. CT diagnosis and the characterization of pericardial, myocardial, and valvular disease, as well as the cause and sequelae of ischemic coronary heart disease, are now not only possible, but are rapidly becoming an imaging modality of choice in certain patient populations and clinical circumstances.
APPROACH TO CARDIAC COMPUTED TOMOGRAPHY
Study Acquisition and Processing
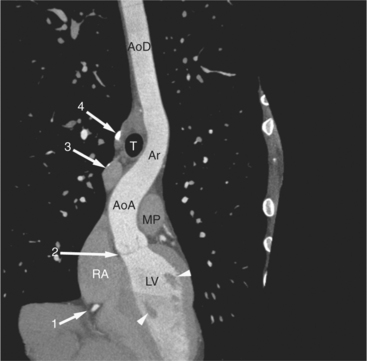
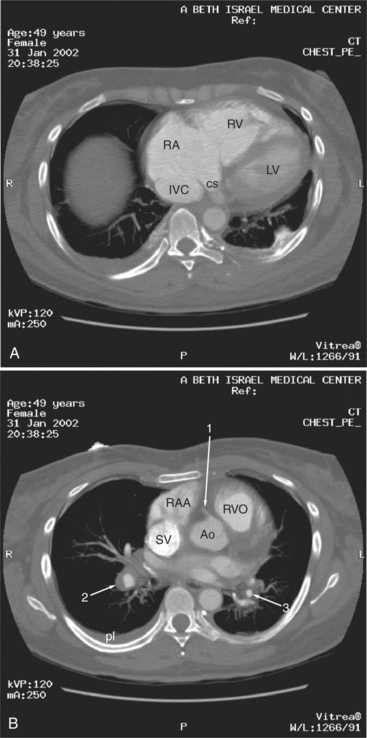
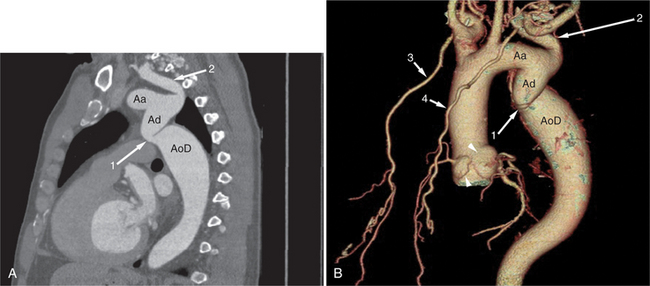
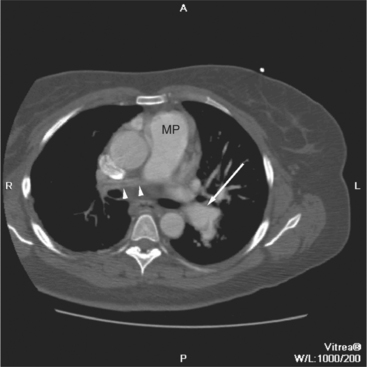
A typical study commences with scout image acquisition to locate the cephalad and caudad limits (Fig. 5-1) of the examination (i.e., from above the aortic arch to the diaphragm if coronary artery bypass grafts are to be evaluated or from about the level of the tracheal carina to the diaphragm for evaluation of the epicardial coronary arteries). From the scout images, typically one identifies the aortic root or origin of the left main artery as the anatomic level for performing a contrast timing run to estimate time to maximum arterial opacification (Fig. 5-2). However, if, for example, the examination is being performed for evaluation of the cardiac veins (for placement of additional ventricular pacing leads, etc.) then timing may be based on maximum opacification of the coronary sinus, the confluence of the epicardial cardiac venous tributaries.
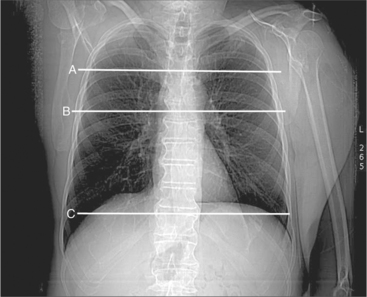
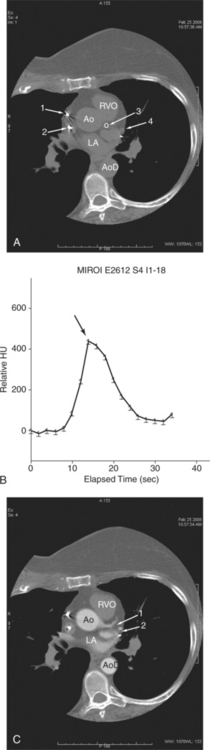
Image Post-Processing
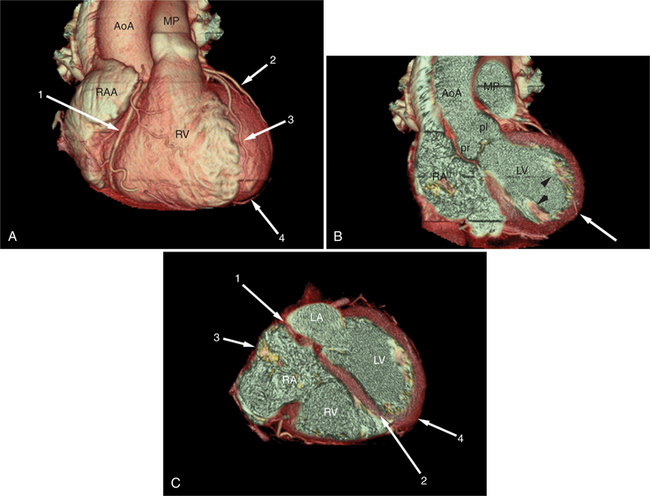
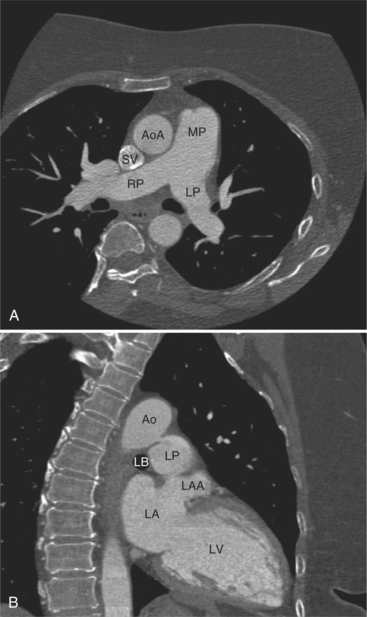
Intravenous contrast administration and radiation exposure are the two significant risk factors associated with performing cardiac CT. Thus, all examinations should be performed using the least intravenous contrast and radiation dose to assure a diagnostic study. The initial image data obtained from the CT scanner is axial images obtained at one particular phase of the cardiac cycle. In fact, using so-called snapshot acquisition, only one phase of the cardiac cycle is used for image acquisition, and thus only single phase data displayed. In principle, all the information in a volume of the chest obtained by CT examination is contained in the axial image data. The traditional approach to CT image interpretation is in the axial (acquisition) plane. However, the heart sits obliquely in the chest, oblique to all body planes (Fig. 5-3). Therefore, cardiac structure may not be visualized to best advantage in this section. Furthermore, many cardiac structures, most notably the epicardial coronary arteries, do not reside within only one isolated plane and are therefore best visualized using more advanced reconstruction methods. Unless obtained only at one phase of the cardiac cycle, image data obtained from a cardiac CT examination covers the entire cardiac cycle and can thus be best viewed not only in arbitrary tomographic section, but also serially in a cine loop mode, allowing qualitative and quantitative analysis of function. Comprehensive review of a case now involves a more integrated approach to the three- and four-dimensional data set (so-called volume visualization). The case is approached as a volume of information, using different means of data manipulation as needed to best view and elucidate a particular clinical problem. Most advanced image processing algorithms have been evaluated in the arterial bed. That is, the advantage of one technique over another for evaluation of the heart and heart disease has been restricted to date to the coronary arteries. Therefore, their value is limited to increasing lesion conspicuity, but not necessarily diagnostic precision. Nevertheless, if use of such techniques increases confidence in the diagnosis of an abnormality, then there exists at least a potential role in clinical cardiac imaging.
Axial and Oblique Tomograms
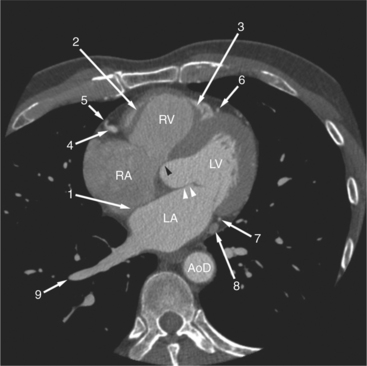
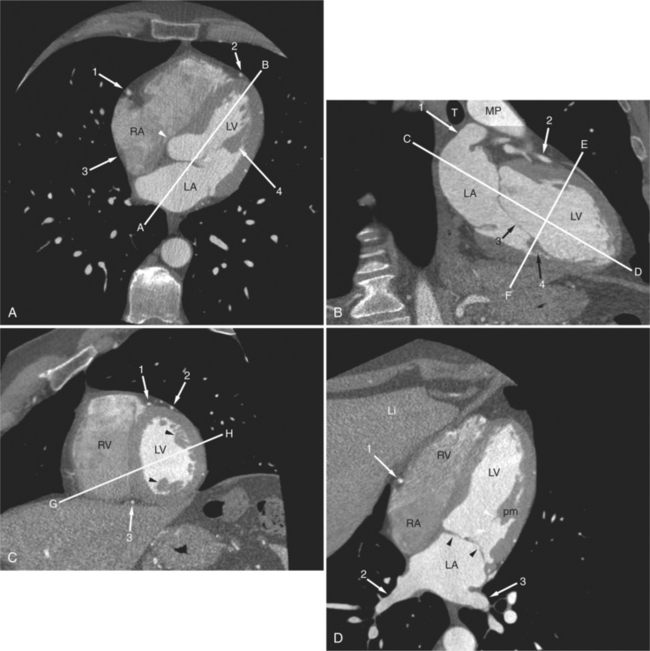
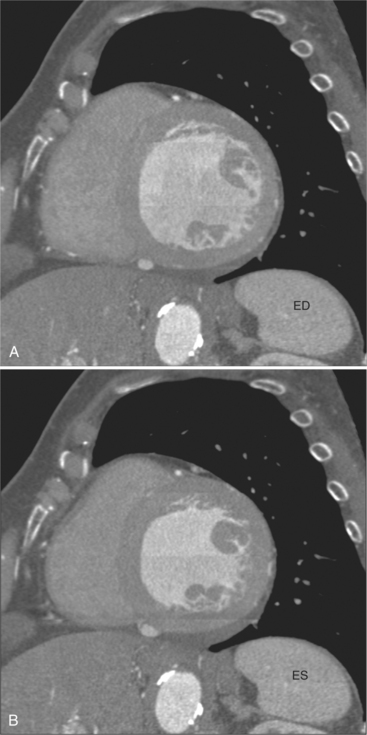
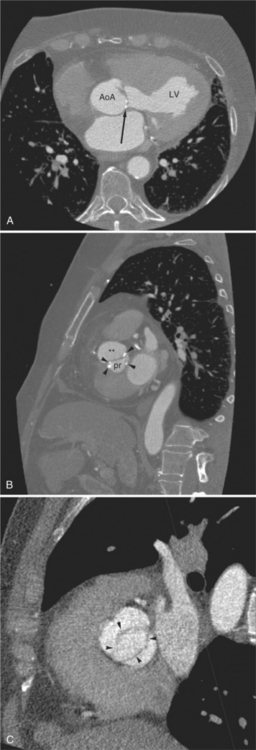
Axial tomograms are the most basic of CT imagery and are the mainstay of cardiac CT interpretation (Fig. 5-4). Images are viewed in their thinnest reconstruction (i.e., a 64-detector scanner produces isotropic voxels 0.6 mm on an edge, and these slices are 0.6 mm thick. Axial tomograms should be analyzed in an interactive way by scrolling up and down through the slices. An organized approach to cardiac analysis is less likely to produce errors of omission. Therefore, a rigorous approach to image analysis should be adopted. That is, there is no one way to interpret a series of CT images. Rather, by adopting a method and keeping to it, such errors may be avoided. For example, one may scroll back and forth, analyzing one structure at a time, such as the ascending aorta, then the superior vena cava, and then the pulmonary arteries. Alternatively, one may follow the flow of blood through the heart and analyze structures in that order (i.e., the superior and inferior vena cava, followed by the right atrium, followed by the right ventricle and pulmonary arteries, etc.). No one axial slice should be used alone without its neighboring slices for analysis. Furthermore, the robust data set acquired by cardiac CT examination lends itself to the rapid image processing software available on workstations designed for these scanners. Reconstruction of particular structures in oblique tomographic section is frequently helpful for elucidating a perplexing series of images and provides a great deal of information concerning the severity of an abnormality and the effect of a particular abnormality on adjacent cardiac structures. Oblique tomograms may be constructed in arbitrary plane, depending on the problem at hand, or in the so-called standard planes, parallel and orthogonal to the intrinsic cardiac axes (Fig. 5-5). These planes are useful for the assessment of cardiac volumes, ejection fraction, and for comparison of CT findings with imagery obtained by other modalities (namely nuclear cardiology, angiocardiography, and echocardiography).
Maximum Intensity Projections
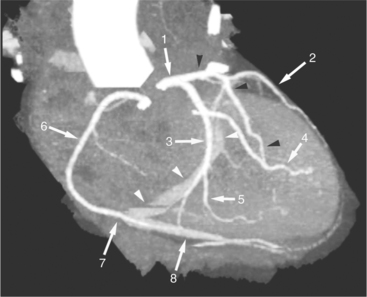
A maximum intensity projection (MIP) is produced by selecting the highest attenuation voxels along lines projected through the volume data set, that is, the line of sight of the observer (Fig. 5-6). The subset of these high attenuation voxels is used to produce a two-dimensional image. MIP imagery is more accurate for evaluating arteries than is volume rendering. However, the presence of other (nonvascular, namely, calcified) voxels confound the appearance of a structure. Furthermore, MIPs are twodimensional representations (projections) that do not accurately depict the actual three-dimensional relationships of nonadjacent structures.
Mutiplanar (Curved) Reformats
Multiplanar reformats (MPRs) are generally used to “untangle” a complex three-dimensional structure (such as a blood vessel) by displaying a plane constructed by a reference in the object (such as a centerline) in a planar two-dimensional manner. By identifying the x and y coordinates of a point within the object in each of a series of a stack (volume) of axial-acquired data, the “three-dimensional course” of the object can be ascertained. Then, the resultant “curved plane” is mathematically flattened out and displayed as a two-dimensional object (Fig. 5-7). These images are often confusing because of the unusual apparent course of a structure and distribution of adjacent structures.
Three-Dimensional Volume-Rendered Images
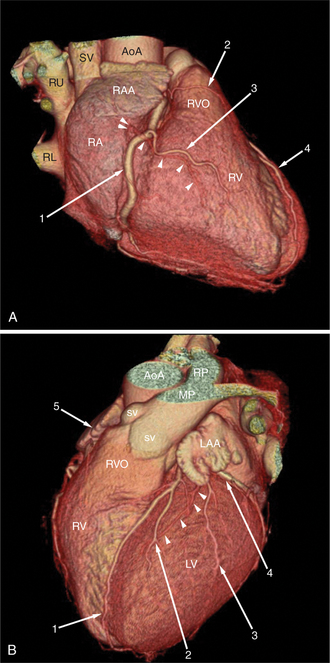
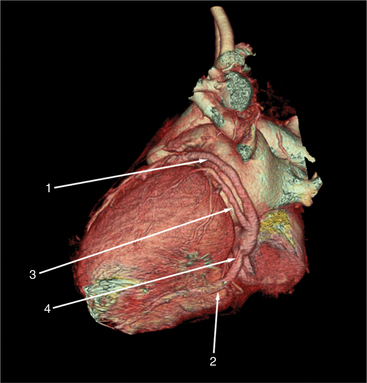
Surface-rendered images are displays of the surfaces of a particular object within a three-dimensional data set. The processing algorithm asks whether a voxel is within an object or not based on comparison of attenuation of the voxel with a “threshold” value. Thus, the outermost voxels of similar attenuation form the surface of the object; those voxels “outside” this surface are not part of the object and not displayed. The “surface” of the object is further modeled as a collection of small polygons and displayed with surface shading based on expected appearance to an observer (Figures 5-3A, 5-8). Reducing the large three-dimensional data set to a surface drastically reduces the amount of data processed per manipulation and thus allows real time interaction between observer and object. These images are excellent for the visualization of gross cardiac structure and the relationship of the heart to surrounding organs.
NORMAL ANATOMY
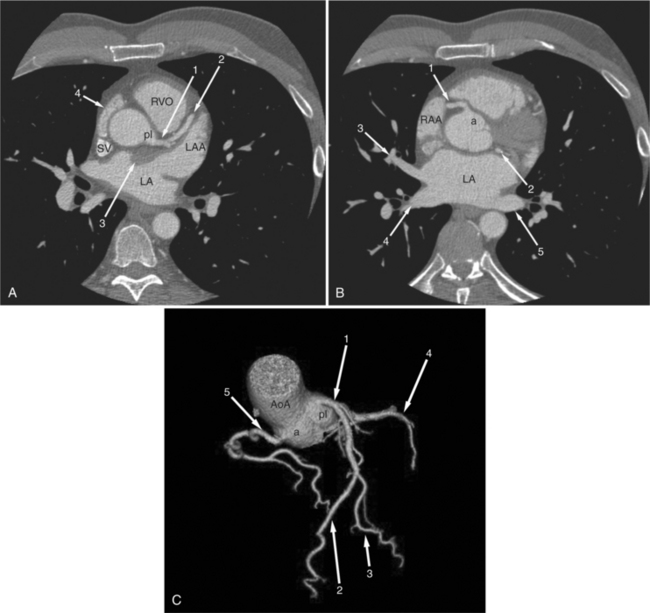
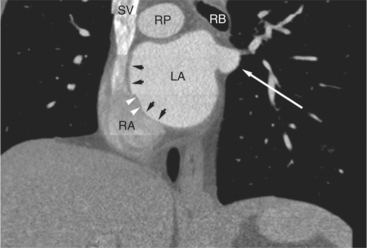
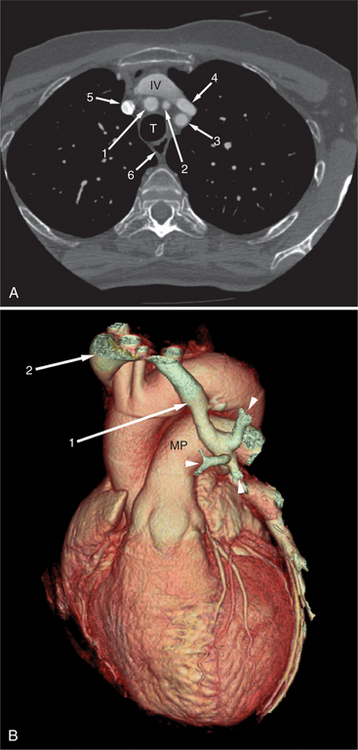
The heart is enveloped in the pericardium. The visceral pericardium cannot be resolved on CT, but with contrast enhancement, the parietal pericardium appears as a thin, bright structure, sandwiched between the pericardial space (and epicardial fat) and the pericardial fat- or air-filled lungs (Fig. 5-9). The pericardium reflects over the top of the main pulmonary artery, the ascending aorta at about the level of the insertion of the azygos vein, and along the diaphragmatic surface of the heart. The pericardial sac contains potential spaces anterior to the aorta (preaortic recess), between the aorta, pulmonary artery and left atrium (superior pericardial recess), and behind the heart, between the insertions of the left and right pulmonary veins (lateral recesses), which become more apparent in face of pericardial effusion or hemorrhage (Fig. 5-10). The coronary arteries are epicardial and are identified as contrast-enhanced cross sections within the epicardial fat, subjacent to the pericardial space, parietal pericardium, and pericardial fat (see Figure 5-9). They arise from the aortic sinuses of Valsalva, immediately cephalad to the aortic annulus (Fig. 5-11).
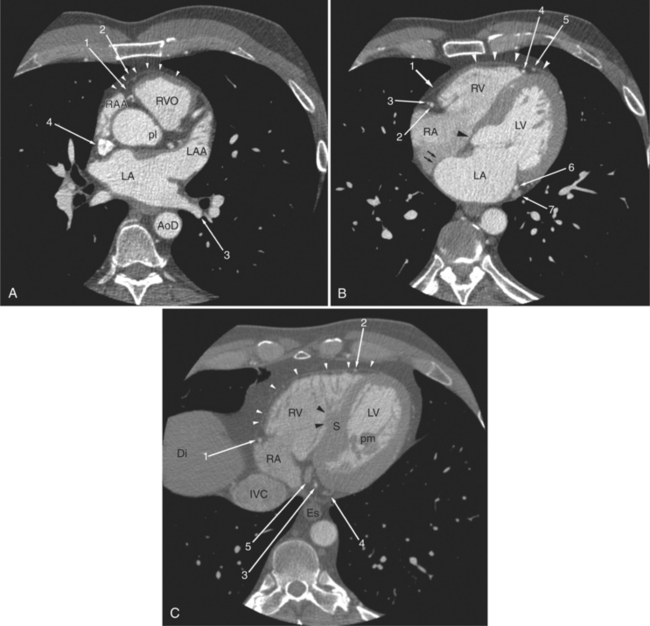
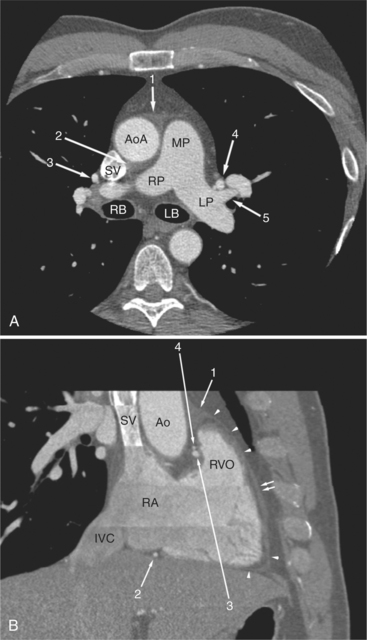
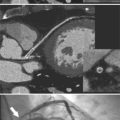
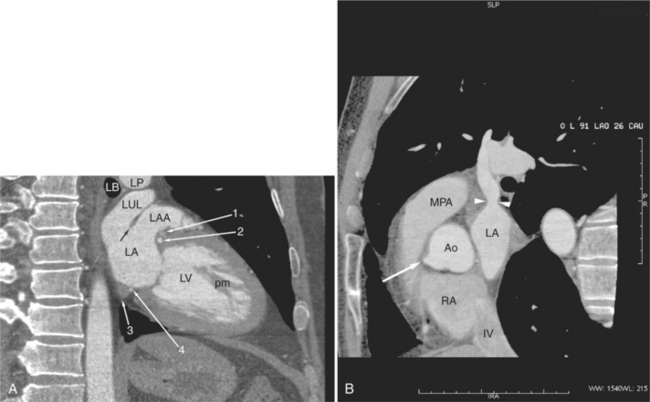
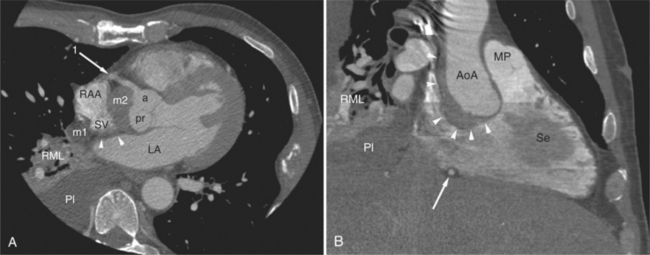
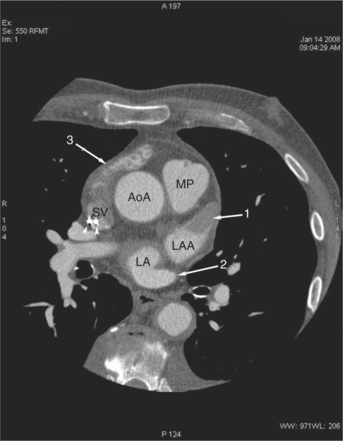
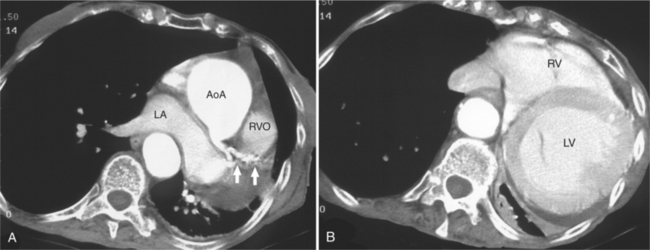
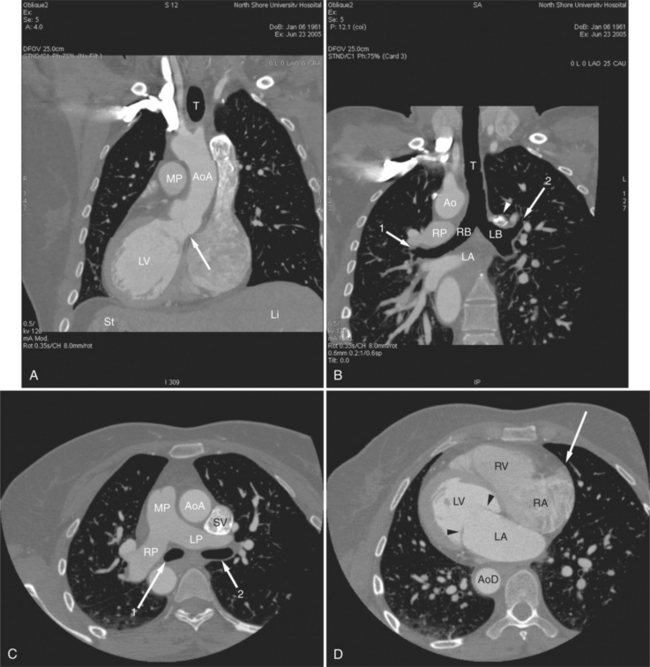
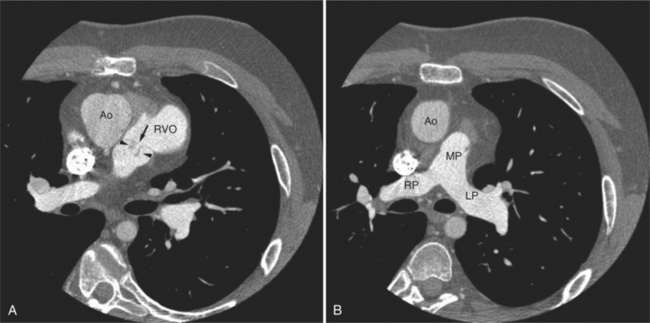
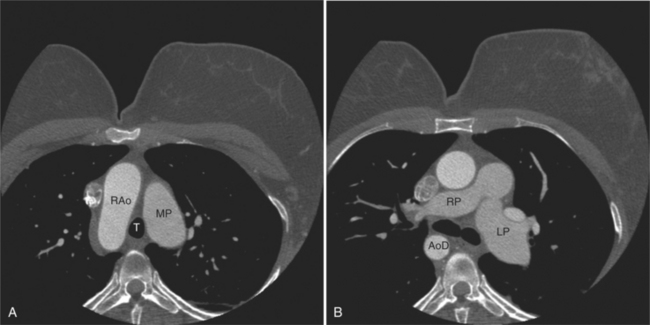
FIGURE 5-10 Images obtained from the patient in Figure 5-9. A, Axial acquisition through the main (MP) and left (LP) pulmonary artery. The preaortic recess is a fluid attenuation collection (arrow 1) between the ascending aorta (AoA) and MP. Similarly, the superior pericardial recess (arrow 2) is the fluid attenuation space between the superior vena cava (SV), AoA, and proximal right pulmonary artery (RP). The right upper lobe pulmonary vein (arrow 3) lies anterior to the prehilar right pulmonary artery, and the left upper lobe pulmonary vein (arrow 4) lies anterior to the left upper lobe pulmonary artery (arrow 5). The left bronchus (LB) and right bronchus (RB) are labeled. B, Right anterior oblique sagittal reconstruction from the patient in Figure 5-9 through the right ventricular outflow (RVO) and the aortic root (Ao). The pericardium (arrowheads) is a thin line separating the epicardial and pericardial fat. A small amount of fluid (double white arrows) has accumulated over the right ventricular sinus, increasing the width of the pericardial space. The preaortic recess (arrow 1) is a homogeneous fluid density bounded by the Ao, the RVO, and the reflection of the pericardium over the pulmonary artery and onto the aorta. The distal right coronary artery (arrow 2) runs in the inferior aspect of the anterior atrioventricular ring. The proximal right coronary artery (arrow 3) and the proximal portion of the conus branch (arrow 4) run embedded in fat in the superior aspect of the anterior atrioventricular ring. The suprahepatic inferior vena cava (IVC) enters the right atrium (RA) from its posterolateral aspect.
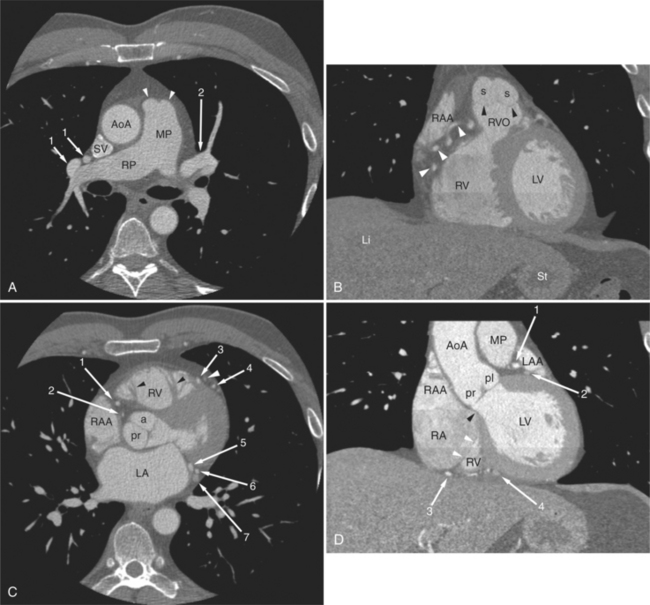
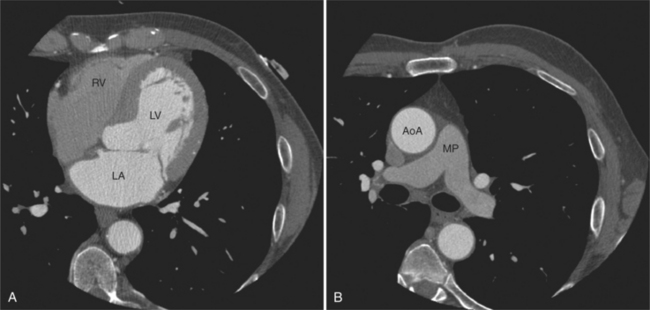
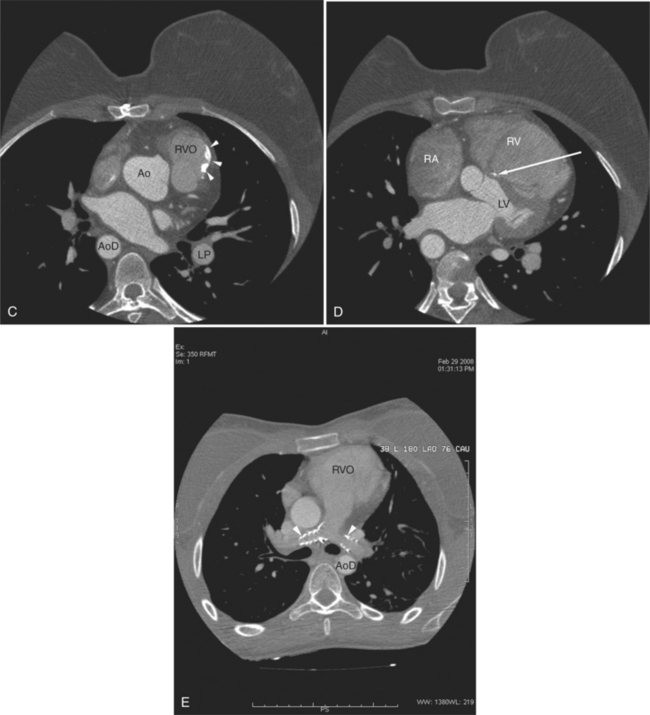
The aortic root lies nearly in the geographic center of the heart. In axial section, the normal relationship of the ascending aorta to main pulmonary artery is aorta to the right. The plane of the aortic valve lies inferior and to the right of the pulmonary valve. Thus, when the pulmonary valve and main pulmonary artery are visualized, the ascending aorta is in field to the right. When the aortic root and sinuses of Valsalva are in field, the free wall myocardium of the right ventricular outflow is in view (Fig. 5-12). Measurement of aortic or pulmonary caliber should be expected to be inaccurate on axial CT examination as a result of their oblique course from the heart. Nevertheless, recognition of arterial enlargement is conveniently based on comparison of great artery caliber. The superior vena cava is formed by the confluence of the left and right innominate veins, immediately inferior to the origins of the branches of the aortic arch. The superior cava courses to the right of the ascending aorta and passes anterior to the right pulmonary artery before entering into the right atrium at about the level of the ostium of the right atrial appendage (Figures 5-9A, 5-10A, 5-10B, 5-13). The azygos vein passes over the right hilum to enter the superior cava from behind.
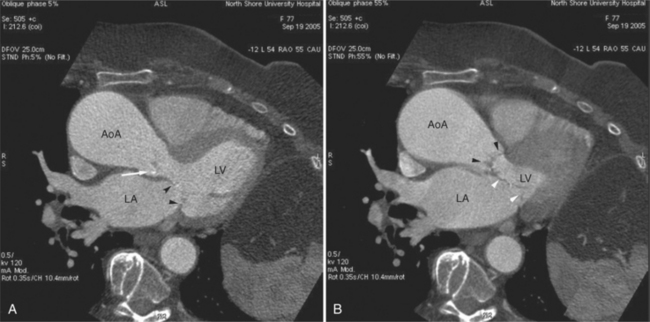
The left atrium is located high and posterior in the heart between the aortic root and the descending aorta and spine, nearly in the midline (see Figures 5-2A, 5-9A, 5-12C). The left atrial wall should be bald smooth and the cavity free of filling defects. The relationship between the left upper lobe pulmonary vein and orifice of the left atrial appendage is constant, and well-demonstrated on CT. The left upper lobe vein passes behind the orifice of the left atrial appendage to enter the posterior aspect of the atrial cavity. A redundant fold of endothelium (the “Q-tip sign”) separates their orifices (Fig. 5-14). The course of the right upper lobe pulmonary vein is nearly constant as well. As it passes medial and inferior from the right pulmonary parenchyma, it passes from anterior-to-posterior to the right pulmonary artery and superior vena cava to enter the superolateral aspect of the left atrium (Figures 5-10A, 5-11B, 5-12A, 5-15). The left lower lobe pulmonary vein often takes a horizontal course, passing between the anterior aspect of the descending aorta and the posterior wall of the left atrium (see Figures 5-5D, 5-9A, 5-11B). The right middle and right lower lobe pulmonary veins frequently form a confluent structure before draining into the left atrium. A common anatomic variant is for the middle lobe veins to drain independently (see Figure 5-15), and slightly superior to the drainage of the right lower lobe vein. Pulmonary vein stenosis, whether of primary or secondary origin, appears as focal narrowing of vessel at an arbitrary location. Juxtaorificial narrowing (see Figures 5-14B, 5-15B) secondary to radiofrequency ablation is, luckily, much less common than in the past.
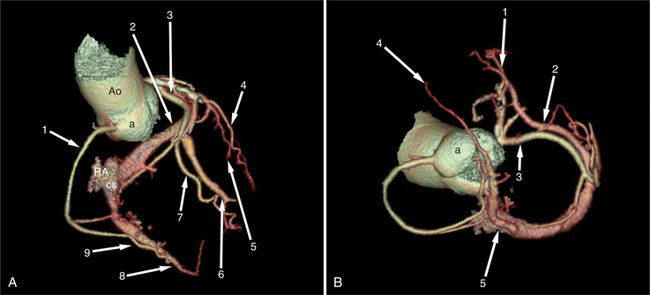
The left atrium shares the interatrial septum with the inferior, anterior, and right-sided right atrium (the sinus venosus interatrial septum separates the inferior aspect of the superior vena cava from the left atrium; see Figures 5-9B, 5-13). The left atrium forms a posterior border of the heart. The esophagus is intimately related to the posterior wall of the left atrium. The left atrial appendage forms part of the left border of the heart, immediately inferior to the main pulmonary artery (see Figures 5-8B, 5-9A, 5-12D). The right atrium receives the superior vena cava and inferior vena cava. The inferior vena cava enters the inferior aspect of the atrium inferior and lateral to the drainage of the coronary sinus. The two structures share a redundant fold of endothelium, the eustachian valve (Figures 5-9C, 5-16). The coronary sinus is the confluence of the cardiac veins (Fig. 5-17). The anterior interventricular vein runs with the anterior descending artery along the anterior interventricular groove (see Figures 5-6, 5-8B, 5-9B, 5-12C, 5-17) and then passes along the base of the heart to the posterior atrioventricular ring to run with the circumflex coronary artery as the great cardiac vein. This vein receives a lateral ventricular vein from the lateral ventricular wall and then passes beneath the left atrium. It picks up the posterior interventricular vein (which runs with the posterior descending coronary artery) to become the coronary sinus and enter the right atrium. The right atrium is divided by a constant mural filling defect, the crista terminalis (see Figure 5-5A). This remnant of the vein of the sinus venosus divides the right atrium into a trabeculated anterior portion and a smooth walled posterior portion. The hepatic veins usually drain to the suprahepatic inferior vena cava before entering the right atrium (see Figures 5-10B, 5-16), but on occasion, they drain directly to the floor of the right atrium. The two atria share the interatrial septum. The plane of the interatrial septum is oblique to the coronal body plane and bows toward the right atrium (see Figures 5-3C, 5-4, 5-5D, 5-9B, 5-13, 5-16). From superior to inferior, the septum is divided into the lateral sinus venosus portion, the medially located secundum portion, and the inferior and medial primum septum. The primum septum is in fibrous continuity with the anterior mitral leaflet, the membranous and atrioventricular septum, and the septal tricuspid leaflet (see Figures 5-4, 5-12C). The interatrial septum is fat laden and thins in the region of the foramen ovale.
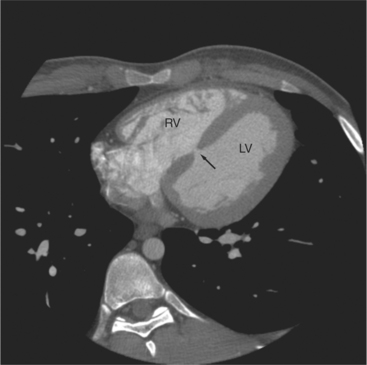
The tricuspid valve lies within the anterior atrioventricular ring with the right coronary artery, protecting the inflow to the right ventricle (see Figure 5-17). The leaflets are usually poorly visualized in less-enhanced right ventricles. The mitral valve lies within the posterior atrioventricular ring, along with the circumflex coronary artery and the great cardiac vein, and protects the inflow to the left ventricle (see Figures 5-5B, D, 5-14, 5-17). The right ventricular inflow lies anterior, inferior, and to the right of the left ventricular inflow. Thus, the left ventricle lies slightly superior and posterior and to the left of the right ventricle (see Figures 5-3A, C, 5-5A, C, 5-8B). The two ventricles share the interventricular septum. The right ventricular side of the septum contains the septomarginal trabeculation and is therefore irregular and trabeculated (see Figures 5-9C, 5-12B). The basal aspect of the trabeculation contributes to the crista supraventricularis and right ventricular infundibulum (see Figures 5-8B, 5-10B, 5-12B). The right ventricle gives papillary muscles from both the septomarginal trabeculation along the interventricular septum and also from the free wall. These myocardial trabeculations appear as filling defects distributed within the right ventricular cavity. The left ventricle gives two large papillary muscles from the posterior (lateral) ventricular wall. Muscle bundles divide into heads and subheads, appearing as branching intracavitary filling defects (see Figures 5-3B, 5-5A, C, D, 5-9C, 5-14). Tricuspid valve chordae are generally not well visualized on CT. However, mitral chordae tendineae are frequently exquisitely visualized. They appear as stringlike filling defects connecting the papillary muscle heads and the mitral leaflets (see Figures 5-5B, D). Because the left ventricle gives no papillary muscles from the interventricular septum, the left ventricular side of the septum appears smoother than the right ventricular side. However, interconnected left ventricular myocardial trabeculations are commonly seen along the lateral wall and toward the ventricular apex.
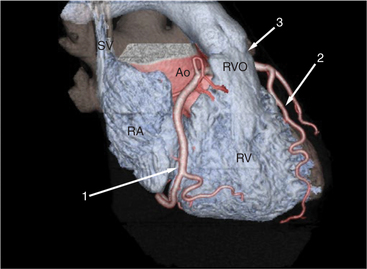
The right ventricle lies in the midline, posterior to the sternum (Figures 5-3A, 5-4, 5-5A, 5-9B, C, 5-12B, C). The right ventricular infundibulum separates the tricuspid and pulmonary valves, and thus the ventricular inflow and outflow. This results in the unique shape of the right ventricle (Fig. 5-18). The right ventricular free wall is only about 2 to 3 mm thick (see Figure 5-9). Low attenuation epicardial fat within the visceral pericardium sharply defines the structure of the outer wall. The contrast-enhanced epicardial coronary arteries appear as round and tubular high attenuation objects. On a contrast-enhanced scan, the right ventricular subendocardial trabeculae appear as scalloped, interconnected filling defects along the internal surface of the free wall. The septomarginal trabeculation is a band of myocardium that runs obliquely along the right ventricular surface of the interventricular septum. As it courses toward the intersection of the interventricular septum and right ventricular free wall, it is associated with small intracavitary filling defects. These represent small papillary muscles of the tricuspid valve. Occasionally, myocardial bundles extend from the interventricular septum clear across to the free wall. The moderator band is a distal branch of the septomarginal trabeculation that carries the right bundle branch to the right ventricular free wall. It is usually seen distally toward the intersection of free wall and septum (see Figure 5-9C).
The interventricular septum is homogeneous in attenuation and thickness; normal left ventricular myocardium is 1 cm thick at end diastole. The septum should never be greater than 1.5 times as thick as the left ventricular free wall. Under normal circumstances, the septum bows toward the right ventricular cavity (see Figures 5-5C, 5-9C, 5-12B). Moving from cardiac apex toward the aortic valve, the septum changes thickness at the transition from the crest of the muscular septum to subaortic membranous septum. The end-diastolic chamber volume of the two ventricles is nearly equal, but their shapes are different, and they do not lie at the same level in space. Moving caudad, one typically continues to view the right ventricular cavity inferior to the diaphragmatic surface of the left ventricle.
PERICARDIAL DISEASE
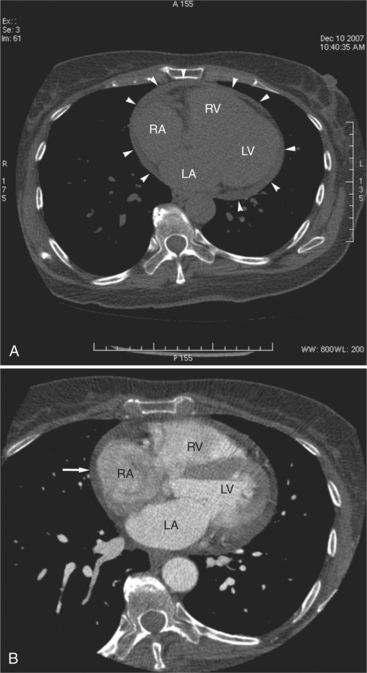
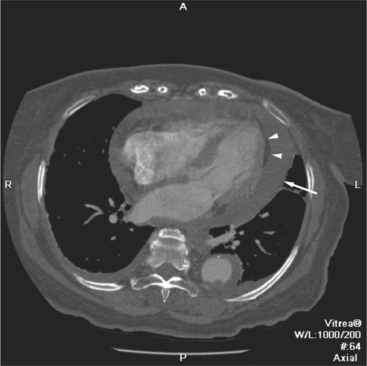
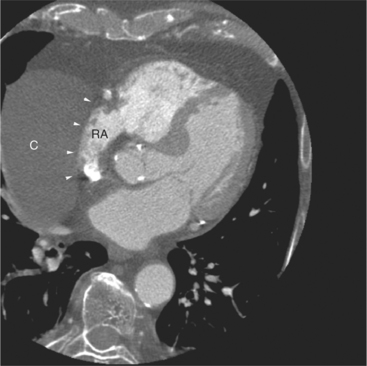
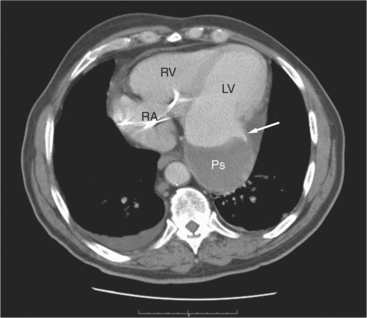
The pericardial response to insult includes fluid exudation, fibrin production, and cellular proliferation. These processes result in pericardial effusion and pericardial thickening. Pericardial effusion increases the volume of the pericardial space, increasing the separation of the epicardial and pericardial fat pads. Small effusions collect posterior to the left ventricle and left atrium. Larger collections accumulate anteriorly, and very large effusions surround the heart (Fig. 5-19). The CT attenuation values of the effusion reflect its character. Serous fluid appears as an isointense locus, usually found posteriorly, or in the pericardial recesses; when the fluid collection is large enough, the isointense band surrounds the heart. Acute intrapericardial hemorrhage produces effusion of higher attenuation values than serous fluid (Fig. 5-20).
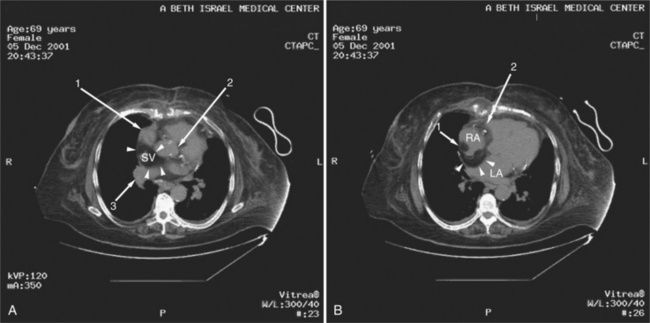
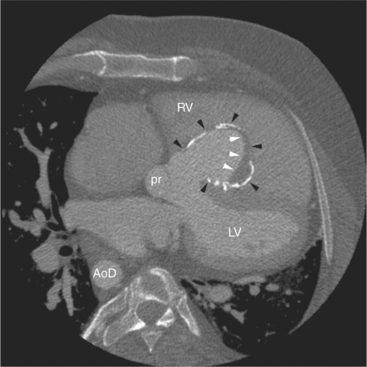
The pericardium is best visualized along the anterior surface of the heart between the atrial appendages. However, the parietal pericardium may appear non-uniform in thickness in this area, even in the absence of pericardial disease. Therefore, the CT features of pericarditis are thickened or calcified pericardium associated with a pericardial effusion (Fig. 5-21). Calcification may be dense (Fig. 5-22) and is commonly found in the atrioventricular rings and over both the atria and ventricles (which helps to differentiate pericarditis from old myocardial infarction). Calcification is independent of pericardial constriction and vice versa; pericardial calcification indicates pericarditis. Pericardial thickening or calcification associated with physiologic impairment indicates pericardial constriction. Absence of pericardial change speaks strongly for myocardial restriction. Morphologic sequelae of the constrictive process include evidence of right atrial hypertension, including dilatation of the right atrium, coronary sinus, inferior vena cava, and hepatic veins (Fig. 5-23). Frequently, the azygos vein is dilated as well. CT is the gold standard for the diagnosis of calcified pericarditis and remains invaluable for surgical planning and postoperative evaluation of patients.
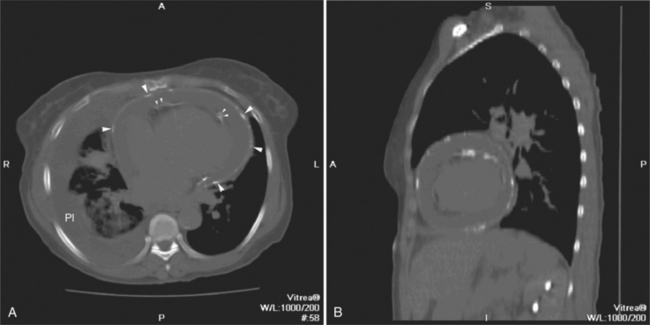
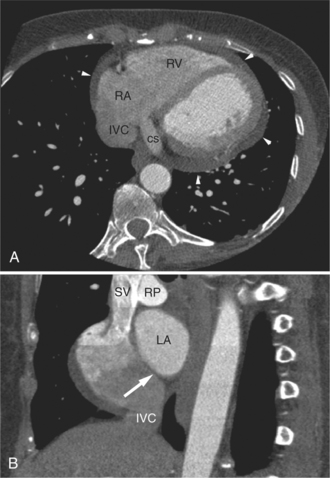
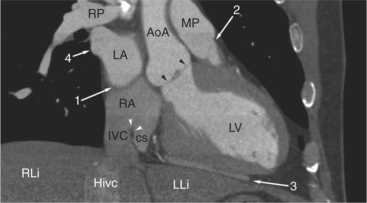
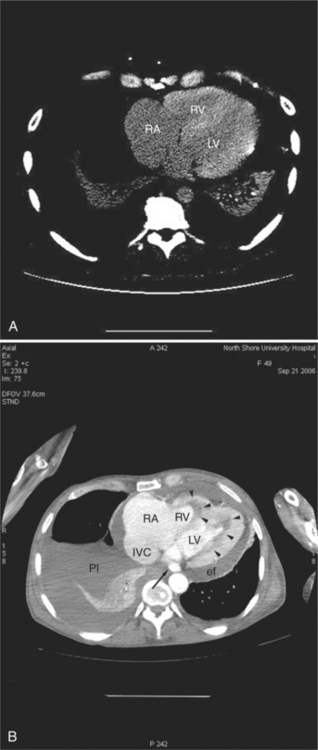
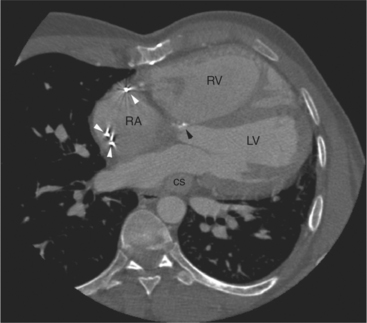
FIGURE 5-23 Contrast-enhanced examination from the same patient in Figure 5-9. A, Axial acquisition through the coronary sinus (cs). Right atrial (RA) hypertension and right heart enlargement is characterized by clockwise (toward the left) cardiac rotation and enlargement of the cs, RA, and inferior vena cava (IVC). The pericardial effusion (arrowheads) and the right ventricle (RV) are also labeled. B, Reconstruction in left anterior oblique section through the interatrial septum (arrow). The superior vena cava (SV) and IVC are dilated. The left atrium (LA) and right pulmonary artery (RP) are labeled.
Pericardial diverticula (Fig. 5-24) are probably failed pericardial cysts (Fig. 5-25). They present as smooth, round, homogeneous masses of low attenuation adjacent to or near the pericardial space. Congenital partial absence of the pericardium usually presents with displacement of the heart into the left chest. The actual defect in the pericardium, through which the heart falls, may be identified. This diagnosis is usually determined by exclusion. The heart is displaced and rotated into the left chest; however, the cardiac chambers and great arteries themselves, are normal in appearance.
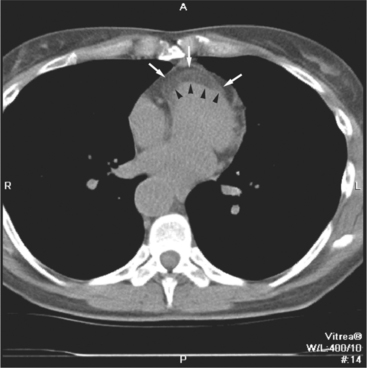
Primary pericardial tumors are slow growing and tend to distort, rather than obstruct the great arteries and cardiac chambers. They are derived from the totipotential cells of the pericardial mesothelium, and therefore are inhomogeneous in histology and radiographic appearance. They usually appear on CT as bulky masses having some anatomic relationship with the pericardium itself. Most primary pericardial tumors are associated with a pericardial effusion, which is well demonstrated by CT, but may be confusing on echocardiography. Metastatic disease to the pericardium may be an incidental finding in a workup for malignancy. Common metastatic lesions include lung, breast, and lymphoma (Fig. 5-26).
ISCHEMIC HEART DISEASE
The mainstay of coronary artery analysis by CT lies in calcium detection, characterization of mural plaque, and quantitation and analysis of luminal narrowing on contrast-enhanced examinations. This will be extensively discussed in Chapter 8. However, the sequelae of atherosclerotic coronary heart disease are readily apparent on CT examination and will be discussed in detail in this chapter.
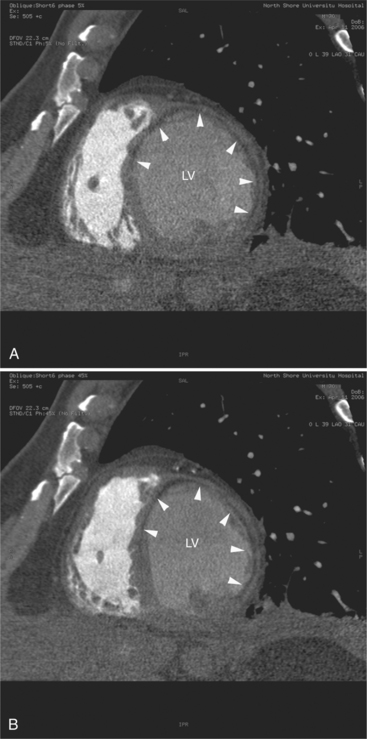
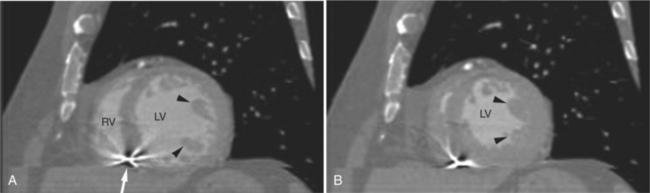
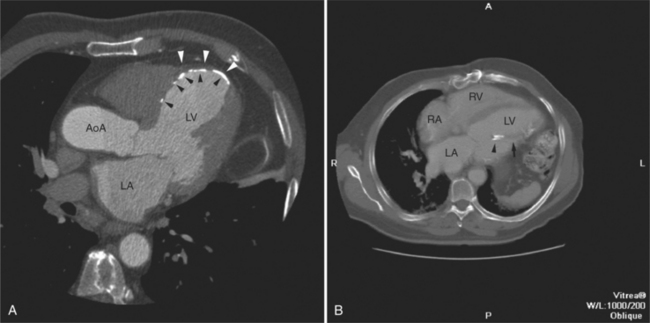
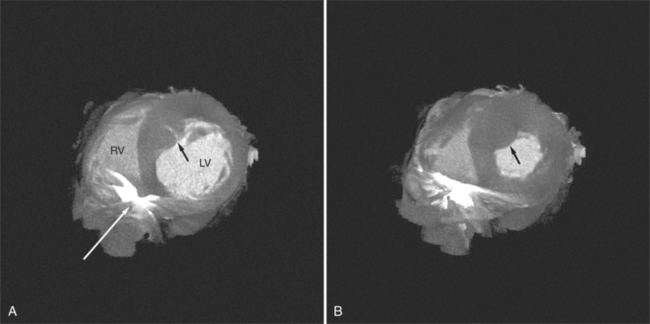
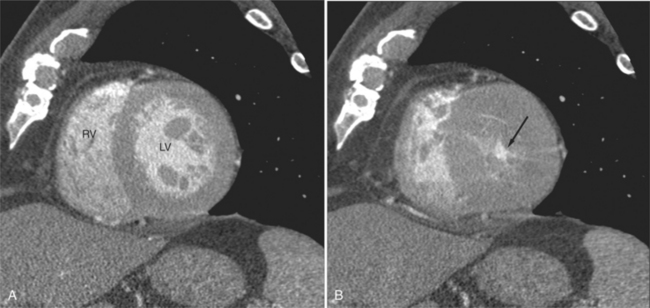
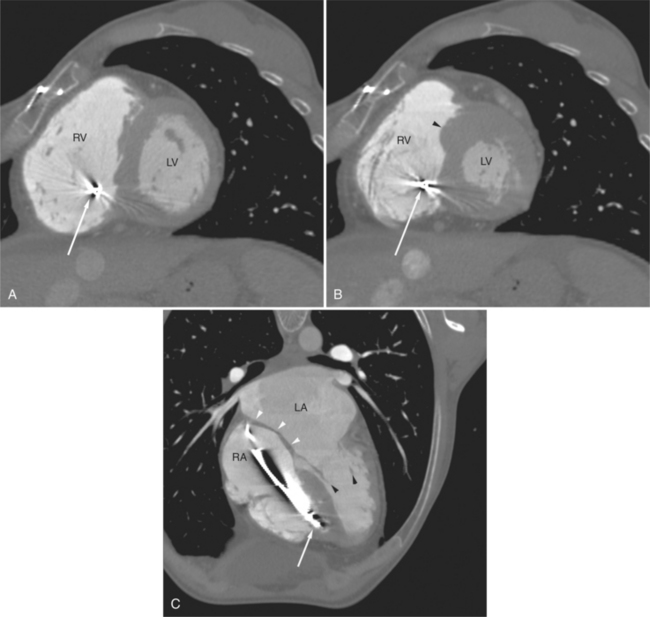
The process of an acute myocardial infarction results in a series of changes in the left ventricular myocardium, characterized by acute ischemia, myocyte death, and chronic remodeling. These changes may be visualized on CT examination. On contrastenhanced scans, ischemic myocardium appears as a region of decreased attenuation. Early acute ischemia frequently appears as a band of low attenuation distributed along the subendocardial (inner) margin of the left ventricular myocardium in a distribution reflecting upstream coronary arterial occlusion (Fig. 5-27). In the early phase of myocardial ischemia, the ventricular wall is of normal thickness and may show no regional wall motion abnormality. As the ischemic process proceeds, the low attenuation extends through the myocardium and may appear as a focal myocardial defect. Myocyte death results in decreased wall thickness and myocardial mass (Fig. 5-28). Regional wall motion abnormalities reflecting upstream coronary artery disease are usually associated with areas of myocardial thinning (Fig. 5-29). Left ventricular aneurysm formation (areas of akinesia and dyskinesia) is associated with myocardial stunning (in the early phase after acute myocardial infarction) and subsequent myocardial scar formation. After intravenous administration of contrast material, the ventricular myocardium and cavitary blood enhance. Mural thrombus does not enhance, and therefore appears as a nonenhancing filling defect within the ventricular cavity (Fig. 5-30) subjacent to areas of myocardial thinning or dyskinesia. Left ventricular thrombus is well seen with CT and may be detected more easily than by echocardiography. Thrombus may have the same appearance (intracavitary filling defects) as papillary muscles. However, papillary muscles appear as branching structures enhanced with contrast administration and thickened through the cardiac cycle; thrombus does not (Fig. 5-31). Myocardial calcification is a reliable sign of previous myocardial infarction (Fig. 5-32). It is rarely seen without infarction, but when seen, it is most commonly found in patients with hypercalcemia. The CT appearance of myocardial calcification is that of dense, irregular calcification taking a coronary artery distribution. Septal involvement and regional myocardial thinning help to differentiate these lesions from those of calcific pericarditis. Differentiation between pericardial and myocardial calcification is based primarily on distribution of the calcification. That is, pericardial calcification tends to extend over the atria and atrioventricular grooves; myocardial calcification takes a coronary artery distribution. On higher resolution scanners (16-detector, and especially ECG gated 64-detector acquisitions) intramyocardial calcification can be distinguished from pericardial change. Areas of nonviable ventricular myocardium may exhibit delayed hyperenhancement, analogous to that seen on contrast enhanced magnetic resonance imaging (see Chapter 3). Chronic myocardial infarction is commonly associated with fatty replacement of myocytes (see Figure 5-19). In these segments, low attenuation bands corresponding to upstream coronary artery occlusions may be identified. Differentiation between low attenuation caused by hypoperfusion and that caused by fatty replacement is improved by comparison of noncontrast-enhanced with contrast-enhanced scans.
Contrast administration increases the difference between ventricular chamber and wall attenuation (see Figure 5-8), demonstrating the extent of regional myocardial thinning and focal dilatation of an aneurysm. CT examination may be helpful in differentiating false from true aneurysms by demonstrating a small ostium in the former (Fig. 5-33) and a broad ostium in the latter. CT may be more accurate than echocardiography for the demonstration of thrombus in the left atrium, especially if situated on the lateral atrial wall and in the atrial appendage (Fig. 5-34).
CARDIOMYOPATHY
Cardiomyopathy is a heterogeneous class of myocardial disease associated with mechanical or electrical dysfunction, usually exhibiting inappropriate ventricular hypertrophy or dilatation. Etiology is varied and often includes a genetic component. The disease may be confined to the heart or may be part of generalized systemic disorders, often leading to cardiovascular death or progressive heart failure. The value of CT examination of patients with cardiomyopathy lies it its ability to depict regional myocardial morphology and change in wall thickness through the cardiac cycle (i.e., regional function) and for the visualization of the epicardial coronary arteries and pericardium as a means of differentiating ischemic from nonischemic, and restrictive from constrictive etiology. Furthermore, visualization of the epicardial cardiac venous tree provides a means of planning lead placement for biventricular pacing in patients with low ejection fraction.
Hypertrophic cardiomyopathy is a clinically heterogeneous but relatively common autosomal dominant genetic heart disease. It is the most frequently occurring cardiomyopathy. It is characterized by a hypertrophied, nondilated left ventricle in the absence of another systemic or cardiac disease capable of producing left ventricular hypertrophy (i.e., systemic hypertension or aortic stenosis). CT is valuable for defining the distribution of abnormal myocardium, and thus for classification of the anatomic variants of this disease. The interventricular septum is typically more prominently involved than the left ventricular free wall (previously referred to as asymmetric septal hypertrophy) (Fig. 5-35). Predominantly posterior septal hypertrophy (the so-called idiopathic hypertrophic subaortic stenosis [IHSS]), concentric (the diffuse form), and apical variant may be differentiated on CT. Contractile function is vigorous, and systolic cavitary obliteration is not uncommon (Fig. 5-36). Because left ventricular obstruction is subvalvular, there is no post stenotic aortic dilatation. Systolic anterior motion (SAM) of the anterior mitral leaflet results in mitral regurgitation and left atrial enlargement.
Arrhythmogenic right ventricular cardiomyopathy (ARVC; arrhythmogenic right ventricular dysplasia [ARVD]) is an uncommon form of inheritable cardiomyopathy associated with progressive loss of ventricular myocytes and fatty or fibrofatty replacement, resulting in regional contractile abnormalities or aneurysms of the right ventricular free wall. Clinical diagnosis is difficult. Supporting evidence of a major structural abnormality by an imaging technique is necessary to make this diagnosis. Magnetic resonance imaging has become popular for contributing to the diagnosis of this disease, but it may have limited value in patients with implanted permanent pacemakers and automated defibrillators. CT examination is beginning to be performed with more frequency in the diagnosis and management of these patients. Nearly all patients with ARVC have right ventricular enlargement. The high contrast resolution of CT x-ray detectors allows detection of the extensive epicardial fat deposition and may be useful for detecting the fatty and fibrous infiltration of the right ventricular free wall found in these patients (Fig. 5-37). Axial imagery demonstrates clockwise rotation of the heart into the left hemithorax in these individuals. Increased epicardial fat and infiltration of fat into the right ventricular free wall, producing a characteristic scalloping, may be demonstrated. In nearly 75% of patients with ARVC, left ventricular myocardial involvement may be demonstrated, producing low attenuation in the interventricular septum and lateral left ventricular wall continuous with the fat of the interventricular sulcus.
Dilated cardiomyopathy is characterized by dilatation and impaired systolic and commonly diastolic function of one or both ventricles. The dilatation often becomes severe. Although myocardial wall thickness may remain normal, there is invariably an increase in total cardiac mass. Systolic impairment may or may not go on to overt heart failure (Fig. 5-38). The presenting manifestations can include atrial or ventricular arrhythmias, and sudden death can occur at any stage of the disease. CT is helpful for evaluation of ventricular function, assessment of the epicardial coronary arteries (to exclude ischemia as an etiology for the ventricular dysfunction), and visualization of the cardiac veins for biventricular pacer placement (Figures 5-17, 5-39).
Restrictive cardiomyopathy is characterized by nondilated ventricles with impaired ventricular filling, often resulting in biatrial enlargement. Systolic function usually remains normal, at least early in the disease. Although restrictive cardiomyopathy can be idiopathic, myocardial infiltration in amyloidosis, sarcoidosis, and hemochromatosis are common etiologies (Fig. 5-40). CT may be helpful in excluding pericardial disease as a cause of the diastolic ventricular dysfunction (see Figure 5-21). Furthermore, the association of other findings, such as pulmonary changes or mediastinal lymphadenopathy in sarcoidosis or myocardial or valve leaflet thickening in amyloidosis, provide important information needed for accurate diagnosis.
RIGHT VENTRICULAR DISEASE
Dilatation and hypertrophy of the right ventricle and dilatation of the right atrium typically characterize right ventricular disease on CT. The right ventricle usually resides behind the sternum. Right atrial enlargement itself may cause cardiac rotation. Right heart enlargement, whether associated with ventricular dilatation or not, is associated with a clockwise (looking from below) rotation of the heart into the left chest; when dilated, the heart rotates and the right ventricle is displaced to behind the left anterior chest wall (see Figures 5-23, 5-30B, 5-40). Right atrial enlargement usually precedes right ventricular enlargement. The underlying etiology of the right ventricular disease may be inferred by the demonstration of other radiographic changes. Because right ventricular dysfunction is commonly associated with pulmonary hypertension, pulmonary artery dilatation frequently coexists. Other diagnostic clues include pulmonary hyperaeration or interstitial disease, cardiac chamber abnormalities, or pericardial changes (Figures 5-41, 5-42).
On CT examination, right atrial enlargement is characterized by increased curvature of the right atrial cardiac border (see Figures 5-21, 5-41A). Dilatation of the coronary sinus and azygos vein are signs of right atrial hypertension and are usually found in cases of right heart failure. Furthermore, demonstration of pericardial effusion or ascites or other signs of right atrial hypertension, including dilatation of the inferior vena cava and hepatic veins, are commonly found in more chronic cases. In cases with right atrial hypertension, flattening and posterior bowing of the interatrial septum may be seen as well (see Figure 5-41C).
In patients with pulmonary hypertension (or other causes of chronic right ventricular afterload), the right ventricular myocardium hypertrophies, resulting in thickening of the right ventricular free wall and septal myocardium. In addition, intracavitary bundles of right ventricular myocardium also become prominent and appear as filling defects within the right ventricular cavity. Right ventricular hypertrophy results in a change in the shape of the interventricular septum. Flattening and reversal of septal curvature may be appreciated in midventricular sections or reconstructions from these data (see Figures 5-41, 5-42).
Primary right ventricular myocardial disease is uncommon. However, there has been interest in the use of CT examination for screening and diagnosis of patients with arrhythmogenic right ventricular cardiomyopathy (see Figure 5-37).
INTRACARDIAC MASSES
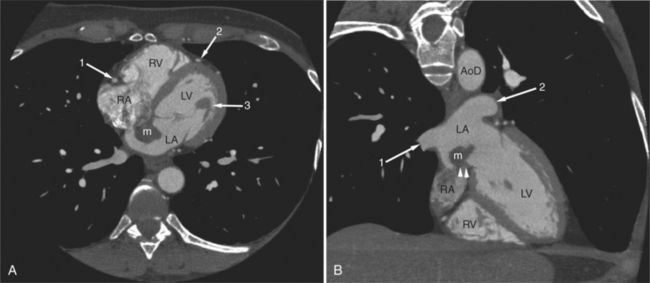
Most cardiac tumors present on CT examination as space occupying lesions within the cardiac chambers. Primary myocardial tumors, including rhabdomyoma and rhabdomyosarcoma, may be entirely intramyocardial and not evident on examination. Administration of intravenous contrast material may increase contrast between normal myocardium and a mass. However, unless an intracavitary filling defect is identified, diagnosis of tumor is difficult to make. The most common intracardiac tumor to be detected by CT is the left atrial myxoma (Fig. 5-43). This mass usually presents as a space-occupying mass in the left (or right) atrium. It is differentiated from intra-atrial thrombus by its typical attachment to the interatrial septum near the limbus of the fossa ovalis. Although these masses may be vascular, their relative attenuation as compared with contrast-enhanced atrial blood may not be adequate for characterization. Differentiation of atrial myxoma from thrombus is empirical and based on location within the atrium. Left atrial thrombus often resides in or near the orifice of the left atrial appendage and appears as a filling defect on contrast-enhanced examination (see Figure 5-34). Right atrial thrombus may be difficult to evaluate on CT. If contrast is injected from the upper extremity, then unopacified blood from the abdomen and lower extremities may produce the appearance of a mass (representing the unopacified flow surrounded by opacified blood arriving from above) within the chamber. Ventricular thrombus appears as a filling defect immediately subjacent to the myocardial wall. As described previously, intraventricular thrombus is most commonly associated with previous myocardial infarction and thus regions of wall thinning.
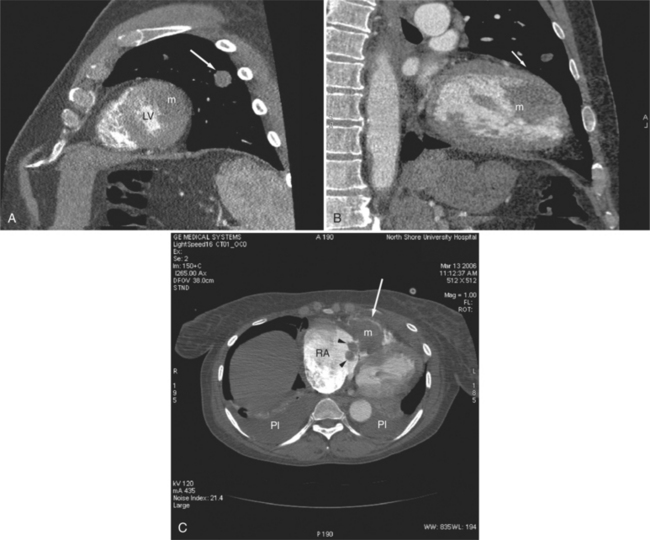
Cardiac lymphoma appears on CT examination as an infiltrating intermediate signal intensity mass. It usually involves the pericardial space and extends along the base of the heart between the great arteries and veins. Typically, it separates and distorts these structures, but it does not cause obstruction (see Figure 5-26). Extension through the myocardium into the right-sided cardiac chambers is often demonstrated on contrastenhanced scans.
Lipomatous hypertrophy of the interatrial septum is not truly a tumor of the heart. Rather, this condition represents prolific growth of normally occurring fat within the interatrial septum (Figures 5-44, 5-30A). Not uncommonly, the fatty deposits extend along the right atrial wall toward the tricuspid valve and may extend into the right ventricle. On noncontrast-enhanced scans, the low signal fat may be recognized within the atrial cavity. After intravenous contrast administration, the mass appears as an intracavitary filling defect. However, if careful attention is made, it is apparent that the attenuation of the defect is much less than found with intracavitary tumor or thrombus. Furthermore, its typical distribution within the interatrial septum and along the lateral right heart border is unusual for a malignancy.
Metastatic cardiac tumors are malignant and are associated with a pericardial or pleural effusion (Fig. 5-45). They are most commonly from breast (in women) and lung (in men).
VALVULAR HEART DISEASE
Chronic mitral stenosis results in left atrial and left atrial appendage enlargement in face of a normal left ventricle (Fig. 5-46). Mitral annular calcification without leaflet calcification is the result of a degenerative process and is not associated with valve dysfunction (Fig. 5-47). Primary calcification of the atrial wall is almost always caused by chronic rheumatic disease (Fig. 5-48). The chronic left atrial hypertension results in pulmonary vein dilatation, and eventually in pulmonary hypertension, as manifested by right ventricular hypertrophy. In chronic disease, right ventricular and right atrial dilatation ensues, accompanied by characteristic clockwise cardiac rotation (see Figures 5-19, 5-21A, 5-30B, 5-40, 5-41A, 5-45C, 5-46). Right ventricular failure in these patients is manifested by coronary sinus, inferior vena cava, hepatic vein, and azygos vein dilatation. Pleural and pericardial effusions and ascites may be encountered.
In acute mitral regurgitation, cardiac chamber size is not altered, and the heart may appear normal. However, the predominant findings are the changes of severe left atrial hypertension and interstitial pulmonary edema. Pleural effusion, alveolar infiltrates, and pericardial effusion are commonly found. In patients sustaining acute myocardial infarction, coronary arterial calcification may be evident. Chronic mitral regurgitation results in adaptation of the left atrium and ventricle to the volume load (Fig. 5-49). Thus, left atrial and ventricular dilatation is the rule. Left ventricular mass increases with the increased chamber volume, resulting in thickening of the left ventricular myocardium. Pulmonary arterial dilatation and right heart dysfunction are less commonly seen in these compensated patients.
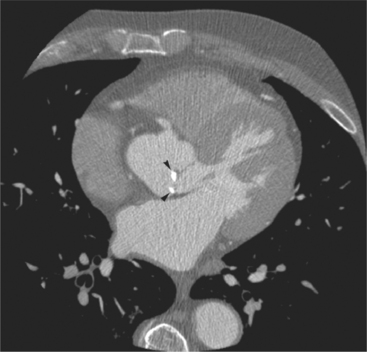
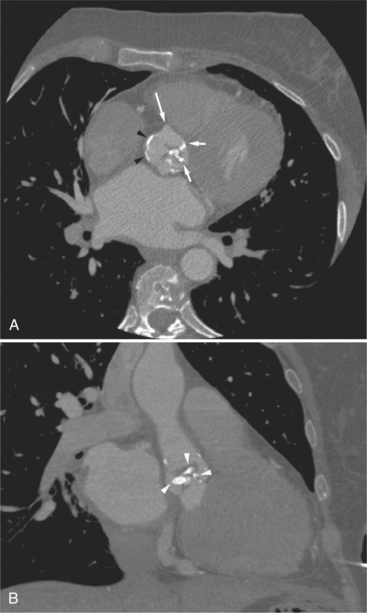
The CT diagnosis of aortic stenosis is based on the demonstration of left ventricular hypertrophy, mild-to-moderate dilatation of the ascending aorta (poststenotic dilatation), and calcification of the aortic valve (Fig. 5-50). Depending on the severity and chronicity of the valvular obstruction, left ventricular thickening is variable. In patients with congenital aortic valve disease, turbulence commencing in the newborn period causes an early fibrocalcific process, which results in thickening and calcification of the valve leaflets early. Calcific deposits are irregular, often multiple, and generally in the geographic center of the heart. They are commonly distributed along the commissural edges of the leaflets, and calcification, in general, is not severe (Fig. 5-51). Acquired degenerative calcific aortic stenosis results in greater calcification (heavier, more extensive calcium deposits). This disease is commonly associated with calcification of the aortic annulus and the leaflets (Fig. 5-52). Although the standard teaching that calcification of the aortic valve on plain film examination indicates the presence of aortic stenosis, CT allows differentiation between annular and leaflet calcification. In the former circumstance, aortic sclerosis may be present, but a transvalvular gradient is commonly not found. On the other hand, there is a strong association between aortic leaflet calcification and a gradient across the valve. Evaluation of prosthetic valve function on CT is enhanced by image acquisition through the cardiac cycle (Fig. 5-53).
Aortic regurgitation is diagnosed on CT by recognition of left ventricular and aortic dilatation (Fig. 5-54). Thus, milder forms of the disease may be overlooked, and grading of the severity of the valvular dysfunction is inaccurate. In aortic regurgitation, CT may be helpful by demonstrating the severity and extent of aortic dilatation. That is, the severity of valvular dysfunction is reflected by the size of the aortic caliber and how far toward the aortic arch the aortic dilatation extends.
Tricuspid regurgitation results in right heart dilatation, and as described previously, clockwise cardiac rotation (Fig. 5-55). The etiology of the valvular dysfunction can usually be inferred from associated morphologic abnormalities. For example, dilatation of the pulmonary arteries indicates that pulmonary hypertension mediates the valve disease. Pulmonary hyperaeration indicates obstructive lung disease as the cause of the pulmonary hypertension and tricuspid valve dysfunction. Left heart dilatation or regional left ventricular dysfunction indicates left heart disease as the etiology of the right heart dysfunction. Left atrial calcification or interstitial lung change with a normal appearing left ventricle indicates mitral stenosis causing right-sided changes.
COMPUTED TOMOGRAPHY OF ADULT CONGENITAL HEART DISEASE
Congenital heart defects (CHD) are the most common birth defects, occurring in about 1% of live births. Today, most infants born with CHD live into adulthood. The number of adults with CHD now exceeds the number of children with CHD. As a result, patients with CHD represent a large and steadily growing subpopulation of patients that require specialized diagnostic and therapeutic management. The expanding use of multidetector computed tomography (MDCT) in identifying and assessing CHD allows for efficacious evaluation of these patients.
MDCT examination of pediatric and adult patients with congenital heart disease is an excellent complement to echocardiographic evaluation. That is, it is unusual for a congenital malformation to be first discovered in an MDCT examination. Rather, patients with unoperated or operated congenital heart disease are followed with serial echocardiograms. Other imaging modalities such as MDCT are indicated if the echo examination cannot provide complete information for diagnosis and assessment of cardiac function. In particular, chest wall abnormalities (pectus deformity), hyperaerated lungs (chronic obstructive pulmonary disease, cor pulmonale), and pan chamber cardiac enlargement preclude high quality, complete echocardiographic examination, necessitating MDCT to complete the investigation. Cine acquisition supplements the anatomic and morphologic information obtained from static axial tomographic images. Retrospective or prospective ECG gating with MDCT produces series of data sets, each obtained at intervals through the cardiac cycle, which may be used to evaluate cardiac output, shunt flow, pulmonary-to-systemic flow ratios, ventricular volumes, ejection fraction, regurgitant volumes, and myocardial mass.
ATRIAL MORPHOLOGY AND SITUS
The morphologic right atrium is the cardiac chamber expected to relieve the hepatic venous drainage, the inferior vena cava, and the coronary sinus. It possesses the right atrial appendage and the crista terminalis. The right atrial appendage is a broad-based, triangular-shaped extension of the atrial cavity. It is contained within the pericardium and lies anterior to the ascending aorta and medial to the right heart border (see Figures 5-3A, 5-8A, 5-9A, 5-11A, B, 5-12B, C, D). The crista terminalis is a fibrous remnant of the vein of the embryologic sinus venosus. It divides the right atrial chamber into a smooth posterior portion and a moderately trabeculated anterior portion (including the appendage; see Figure 5-5A). The morphologic left atrium is expected to receive the four pulmonary veins. It contains the (fingerlike) left atrial appendage, which is long and narrower than the right atrial appendage. It passes just inferior to the main pulmonary artery along the left of the heart to reach the radiographic left heart border (see Figures 5-8B, 5-9A, 5-11A, 5-12D, 5-14). The walls of the left atrium are smooth; there is no crista terminalis.
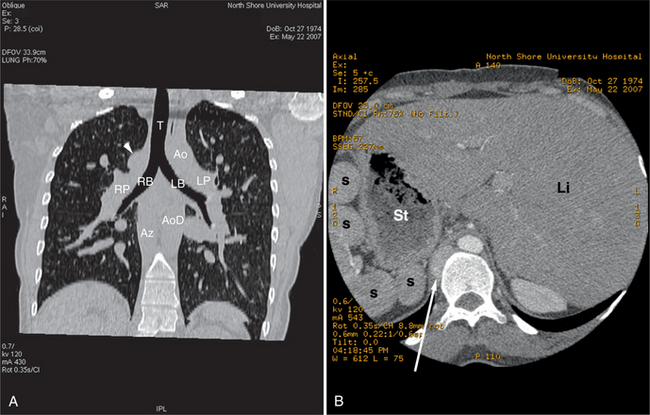
Atrial situs may be directly determined by analysis of the morphology of the atria. Alternatively, situs may be deduced from the situs of the chest and abdomen. In the normal individual in situs solitus, abdominal situs (Fig. 5-56A) matches thoracic situs. That is, the liver is on the right and the stomach is on the left; the right lung is on the right and the left lung is on the left. When abdominal and thoracic situs are concordant in situs solitus, atrial situs is solitus. In an analogous manner, when thoracoabdominal situs is concordant, but in situs inversus, then atrial situs is situs inversus. Thoracic situs is determined by examining the morphology of the lungs. The morphologic left lung is the lung with two lobes (thus one fissure) and a characteristic relationship between bronchus and pulmonary artery. In the morphologic left lung, the bronchus takes a long course from the tracheal bifurcation before giving the left upper lobe bronchus; the right bronchus travels for a short distance before the origin of the right upper lobe bronchus (see Figure 5-56B). The left pulmonary artery courses over the left bronchus immediately proximal to the left upper lobe pulmonary artery orifice; the right pulmonary artery runs anterior and slightly inferior to the right bronchus (see Figure 5-56C). In atrial situs solitus, the right atrium lies in the right; the left atrium lies to the left (see Figures 5-3C, 5-4, 5-5A, 5-5D, 5-9B, 5-13). Atrial situs inversus is the mirror image analog of situs solitus. The morphologic right atrium lies on the left, and the morphologic left atrium is on the right (Fig. 5-57).
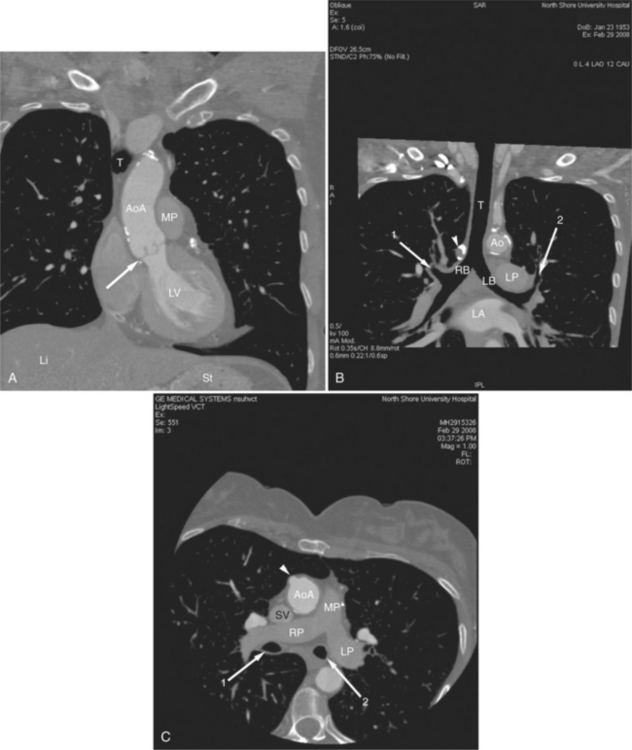
Situs ambiguous may be indicated by the presence of symmetric left-sided and right-sided bronchi. Two left-sided bronchi indicate left isomerism (Fig. 5-58); two right-sided bronchi indicate right isomerism. In atrial situs solitus, the upper abdominal aorta lies to the left of midline and the inferior vena cava to the right; in atrial situs inversus, the abdominal aorta lies to the right. In situs ambiguous, the inferior vena cava may lie anterior to the aorta.
VENTRICULAR MORPHOLOGY
The right and left ventricles may be confidently differentiated by their shape, trabecular appearance, and relationship between atrioventricular and semilunar valves. The endocardial surface of the morphologic left ventricle appears smoother than that of the morphologic right ventricle. The muscular trabeculations of the morphologic right ventricle are thicker and straighter than those of the relatively smooth-appearing left ventricle (see Figures 5-4, 5-9C, 5-12B, C). These trabeculations are most apparent along the right ventricular side of the interventricular septum. The left ventricle has large papillary muscles that only originate from the free wall (see Figures 5-3B, 5-5, 5-9C, 5-31, 5-43A). Tricuspid valve papillary muscles originate from both the interventricular septum and the free wall of the right ventricle. These are visualized as soft tissue within the right ventricular cavity on imaging. The most reliable means of differentiating the right from left ventricle is by demonstration of the right ventricular infundibulum. This circumferential band of myocardium separates the tricuspid from semilunar valve. MDCT examination is useful for demonstrating the right ventricular infundibulum (see Figures 5-3A, 5-8, 5-10B, 5-12B, 5-18). The left ventricle has no infundibulum. There is fibrous continuity between the mitral and aortic valve (see Figures 5-4, 5-12C). Putting it another way, the ventricle whose semilunar valve abuts its atrioventricular valve is the morphologic left ventricle.
ATRIOVENTRICULAR AND VENTRICULOARTERIAL CONNECTION
Atrioventricular concordance exists when blood flows from the morphologic right atrium to the morphologic right ventricle and from the morphologic left atrium to the morphologic left ventricle; this is the result of D-looping of the ventricles (see Figures 5-3C, 5-4). Atrioventricular concordance may exist in either situs solitus (right atrium to the right) or situs inversus (right atrium to the left). An L-looped heart exhibits atrioventricular discordance; right atrial blood flows to the morphologic left ventricle, and left atrial blood flows to the morphologic right ventricle (Fig. 5-59).
Ventriculoarterial concordance exists when the morphologic right ventricle supports the pulmonary valve and pulmonary artery and when the morphologic left ventricle supports the aortic valve and aorta (see Figures 5-3A, B, 5-12B, D). The normal great artery relationship is for the aorta to be to the right with respect to the pulmonary artery. Ventriculoarterial discordance, therefore, exists when the right ventricle supports the aorta or the left ventricle supports the pulmonary artery. Ventriculoarterial discordance, in general, occurs in two important lesions, congenitally corrected transposition of the great arteries (CCTGA or L transposition of the great arteries [L-TGA]) and D transposition of the great arteries (D-TGA). In L-TGA, the association of both atrioventricular and ventriculoarterial discordance results in a doubly switched circulation (see Figure 5-59). In D-TGA, there is ventriculoarterial discordance in the presence of atrioventricular concordance (Fig. 5-60). In L-TGA, MDCT examination provides explicit demonstration of discordant connections or simple demonstration of the left-sided upper heart border forming aorta and the medially located main pulmonary artery segment. MDCT is also useful in the evaluation of postoperative changes in the patients, including graft degeneration, long-term postoperative changes, conduit patency and stenosis, conduit valve regurgitation, and aneurysm formation.
ANOMALIES OF THE GREAT VESSELS
Coarctation of the Aorta
MDCT examination of patients with CoA is directed toward demonstration of the location, caliber, and length of the coarctation segment, the status of the aortic isthmus, and the degree of arterial collateralization present (Fig. 5-61). Furthermore, the relationship of the coarctation to the origins of the left and right subclavian arteries (especially in cases with an aberrant subclavian artery) must be demonstrated. These changes are usually best appreciated in oblique sagittal or coronal sections, parallel to the axis of the ascending and descending aorta. However, in smaller children or in older adults, the small caliber of the aorta or aortic tortuosity may necessitate acquisition in additional oblique sections. The origin of the left subclavian artery in many of these patients appears to be “pulled” inferiorly from the distal aortic arch toward the hourglass deformity of the coarctation itself, the so-called capture of the left subclavian artery. In oblique sagittal sections from the posterior chest, dilated intercostal arteries may be identified traveling along the underside of the posterior upper ribs. The internal mammary arteries run along the inner aspect of the anterior chest wall on either side of the lateral border of the sternum. MDCT examination is a useful means of following the results of balloon dilatation and surgical repair of coarctation. Serial examination allows close follow-up and assessment of residual stenosis and early demonstration of aneurysmal dilatation.
Pulmonary Arteries
MDCT complements echocardiographic examination for the assessment of the size, patency, confluence, and character of the pulmonary arteries. The main pulmonary artery should be no greater in caliber than the ascending aorta at that anatomic level. Dilated central pulmonary artery segments indicate either elevated pulmonary resistance resulting in pulmonary hypertension or increased flow in left-to-right shunts. Main pulmonary artery enlargement, with or without associated left or right pulmonary arterial enlargement, may be seen in patients with valvular pulmonic stenosis. Aneurysmal dilatation of the pulmonary arterial tree may be found in patients with chronic, mild valvular pulmonic stenosis or pulmonary insufficiency. In patients with pulmonary hypertension and long-standing left-to-right shunts, the pulmonary arterial wall is thickened and increased in signal intensity. The central pulmonary arteries in cases of right ventricular outflow obstruction (including pulmonary atresia or tetralogy of Fallot with pulmonary atresia) may be diminutive or if atretic, not identifiable. Focal branch stenosis proximal to the pulmonary hila may be identified directly (Fig. 5-62). The main and central pulmonary arteries in cases of supravalvar pulmonic stenosis (as an isolated lesion or in association with Williams or Noonan syndrome) reveal diffuse or focal wall thickening. Similarly, surgical pulmonary arterial banding results in focal pulmonary artery narrowing.
Patent Ductus Arteriosus
The ductus arteriosus is the persistent distal left sixth aortic arch. It extends from the underside of the aortic arch just distal to the origin of the left subclavian artery to the left pulmonary artery near its origin (Fig. 5-63). Usually the ductus is left-sided, but in cases of right aortic arch, it may be right-sided. Bilateral patent ductus arteriosus (PDA) is rarely found. This abnormality has a variable morphology. The most common shape of a PDA is long and cylindrical with the shape of an hourglass-like narrowing in its midportion. Aneurysmal ducti are less common but may appear saccular or spindle shaped. The variable length and orientation of the duct between the aorta and pulmonary artery often makes its demonstration difficult. Communication between the underside of the distal aortic arch or proximal aorta with the superior aspect of the left pulmonary artery may be easily demonstrated. MDCT examination for PDA in infants may be limited by the size of the ductus and spatial resolution of the scanner.
CORONARY ARTERY ANOMALIES
MDCT is a useful means of evaluating congenital coronary anomalies in symptomatic children. It provides important information concerning the sequela of Kawasaki disease. MDCT detects and characterizes coronary artery stenoses in children undergoing surgical repair of their malformation. In adults, MDCT examination is used for the evaluation of coronary artery takeoff, course, and for the presence of coronary stenoses. These topics are covered in Chapter 8.
VALVULAR ABNORMALITIES
Bicuspid Aortic Valve
Congenital bicuspid aortic valve is the most frequent malformation of the aortic valve, occurring in between 0.9% and 2% of all individuals in autopsy series. Although the valve may be narrowed with commissural fusion at birth, it is more commonly not responsible for severe stenosis in childhood. However, these valves tend to present later in life, usually by late adolescence. Fibrosis, increasing rigidity, and calcification of the leaflets and subsequent narrowing of the aortic orifice develops as a result of turbulence associated with the abnormal valvular architecture (Fig. 5-64). Stenotic changes resemble those found in cases of degenerative calcific stenosis of a trileaflet aortic valve, but these changes occur several decades earlier in the congenitally malformed valve. About one third of patients born with congenital bicuspid aortic valve will remain free of any hemodynamically significant problem. About one third of patients greater than 20 years of age will develop valvular stenosis. An additional one third of patients develop aortic regurgitation on the basis of organic structural abnormality or after a bout of acute bacterial endocarditis.
The aortic annulus in these patients may be normal, but in more severe cases, it is decreased in caliber. The three aortic sinuses of Valsalva may be maldistributed by the unseparated valvular commissures; the valve leaflets themselves may be thickened. Calcium is apparent on MDCT examination. Aortic valve doming may be demonstrated. Dilatation of the ascending aorta and left ventricle are identified in cases of valves with mixed stenosis and regurgitation. In both instances, there is left ventricular hypertrophy; in mixed regurgitant bicuspid aortic valves, left ventricular hypertrophy is less apparent because the left ventricle is dilated as well.
Congenital Pulmonary Stenosis
In patients with noncritical PS, the pulmonary valve leaflets thicken and fibrose with age, but they rarely calcify (Fig. 5-65). Right ventricular hypertrophy reflects the severity and duration of the valvular obstruction. Right heart failure is uncommon in infancy and before the fifth decade. Prolonged right ventricular hypertension distorts chamber geometry, causing right ventricular papillary muscle dysfunction and tricuspid regurgitation. Some patients with moderate PS progress to more severe obstruction as a result of late fibrosis and deformity of the valve leaflets or superimposed infundibular hypertrophy. Survival into the seventh decade in patients with valvular PS has been reported.
SEPTAL DEFECTS AND SHUNTS
Atrial Septal Defect
Direct visualization of shunt flow across a defect is at best lucky to demonstrate, may be an optical illusion, or more likely wishful thinking. Therefore, diagnosis is based on anatomic localization and recognition of changes caused by shunt flow. Atrial septal defects (ASDs) are classified based on the location of the defect (Fig. 5-66). Primum defects (whether or not associated with other defects) are inferiorly and medially located, immediately superior to the atrioventricular valves. Secundum defects are centrally located in the septum and are usually large. These may be differentiated from a patent foramen ovale by their size. Sinus venosus defects are superiorly and laterally located, appearing as defects between the posterior, inferior border of the inferior vena cava and the left atrium, immediately inferior and posterior to the entry of the right upper lobe pulmonary vein.
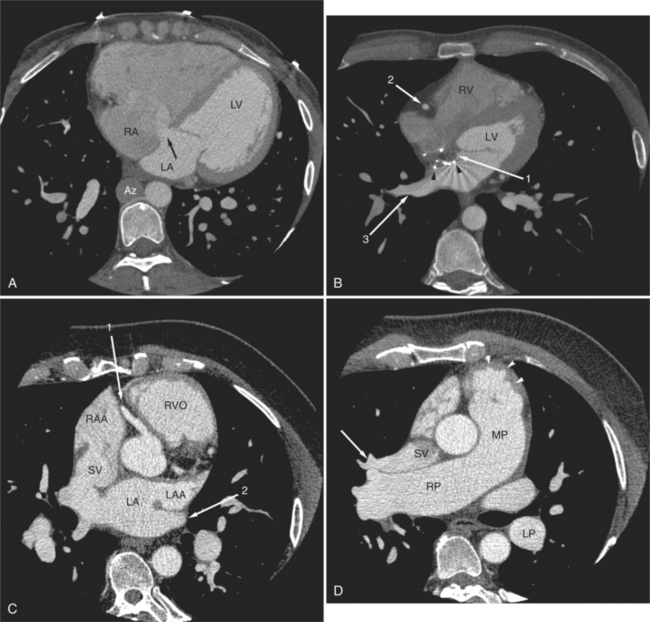
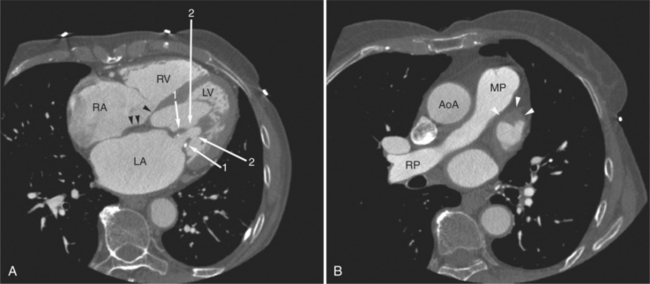
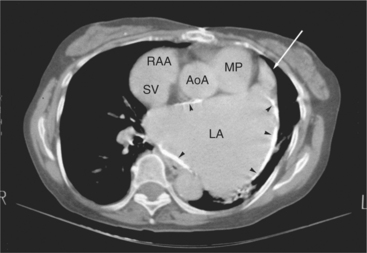
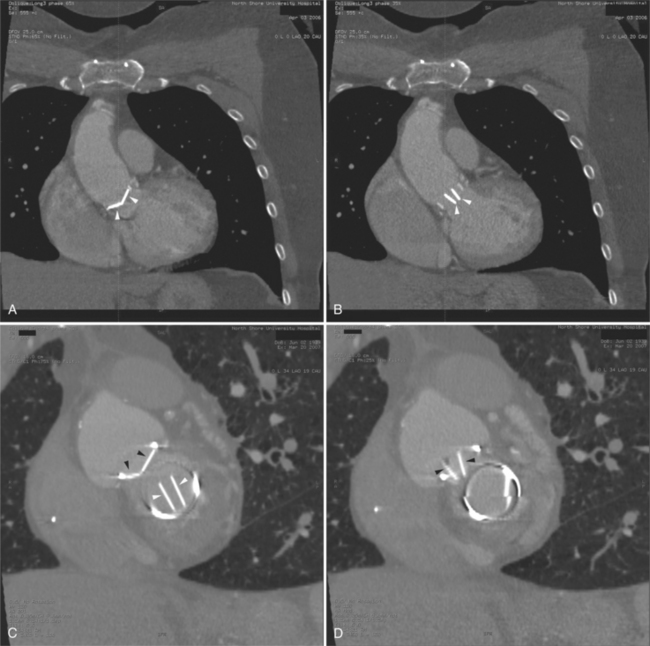
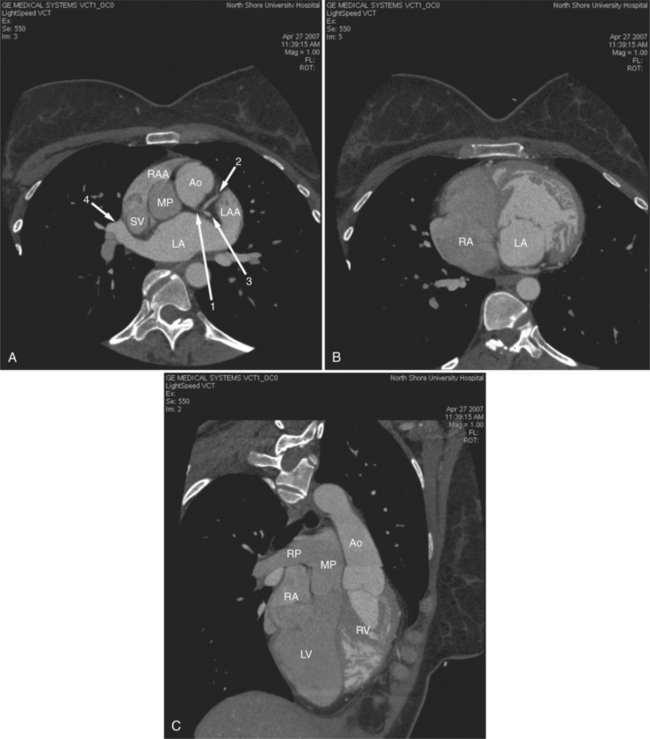
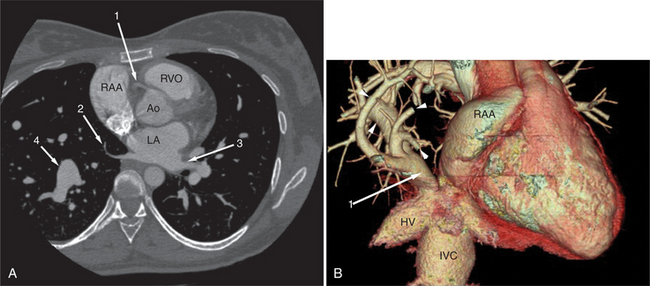
FIGURE 5-66 Three adult patients with atrial septal defect. A, Axial acquisition from a contrast-enhanced examination in the 24-year-old patient in Figure 5-58. A primum interatrial septal defect (arrow) is indicated by the passage of higher attenuation left-sided blood from the left atrium (LA) into the right atrium (RA), across the inferior and medial aspect of the interatrial septum. Notice the clockwise cardiac rotation reflecting right heart enlargement, the flattened interventricular septum, and the normal-appearing left ventricle (LV). In this patient with interruption of the inferior vena cava with azygos continuation, the dilated azygos vein (Az) is seen to the right of the lower thoracic aorta. B, Axial acquisition image from a contrast-enhanced examination in a 30-year-old woman after closure of a secundum atrial septal defect. The metal struts (arrowheads) of the occluder device define the location of the secundum atrial septum. It is lateral to the primum septum (arrow 1). The right ventricle (RV) and LV, the right coronary artery viewed in cross section (arrow 2) and dilated right lower lobe pulmonary vein (arrow 3) are also labeled. C, Axial acquisition through the aorta and proximal right coronary artery (arrow 1) from a contrast-enhanced examination in a 28-year-old patient with a murmur. There is continuity between the posterior wall of the superior vena cava (SV) and the lateral anterior aspect of the LA. Note that the left atrium is normal in size and that the right atrial appendage (RAA) and right ventricular outflow RVO) are dilated, and the RVO is rotated toward the left chest wall, indicating right heart enlargement. The left atrial appendage (LAA) and left upper lobe pulmonary vein (arrow 2) are also labeled. D, Axial acquisition a few centimeters cephalad from part C through the top of the right ventricular outflow (arrowheads), main (MP) and right (RP) pulmonary arteries. The right upper lobe pulmonary vein (arrow) does not pass inferior and posterior to the RP as expected, but rather, it drains directly to the SV. The descending left pulmonary artery (LP) is dilated. Again, note the cardiac rotation and pulmonary artery dilatation.
The interatrial septum is often infiltrated with fat (see Figures 5-4, 5-5A, 5-13, 5-16, 5-23B, 5-30A, 5-42C, 5-46A). It normally bows toward the right atrium. The septum is thinner in the region of the foramen ovale. Care must be taken to avoid making the misdiagnosis of an ASD based solely on the isolated observation of a break in the septal contour. The diagnosis of a shunt is assured if the associated morphologic and anatomic changes are seen. In particular, in an ASD, blood shunts across the atrial septum to volume load the right heart and pulmonary arteries. Volume loading the right heart results in (looking from below) clockwise cardiac rotation. In this circumstance, the plane of the interventricular septum rotates toward (or beyond) the coronal plane. In patients with ASD, the left atrium decompresses during diastole; the left atrium and left ventricle are therefore not enlarged. Right ventricular myocardial mass in simple ASD is increased, but does not appear hypertrophied.
Ventricular Septal Defect
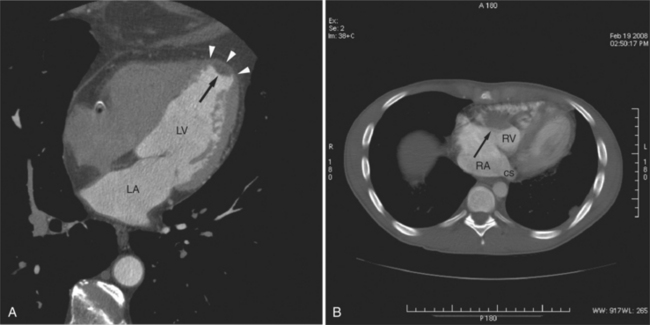
Ventricular septal defects (VSDs) appear as gaps in the septum. They are characterized by their location and the tissue that surrounds the defect. Specific chamber enlargement supports the diagnosis and aid in characterizing the severity of the lesion. Large subaortic (membranous) VSDs are in the posterior portion of the interventricular septum (Fig. 5-67). They are characterized by the absence of septal tissue in the posterior, superior-most aspect of the interventricular septum, immediately below the aortic valve, and adjacent to the septal leaflet of the tricuspid valve. They are commonly associated with septal aneurysms that may close spontaneously (Fig. 5-68). When this myocardium is deficient, the aorta is no longer properly supported, and it “falls” anteriorly, acquiring a relationship with both the left and right ventricles. Smaller and more distal defects may be difficult to identify because they take a serpiginous course within the septal myocardium (Fig. 5-69).
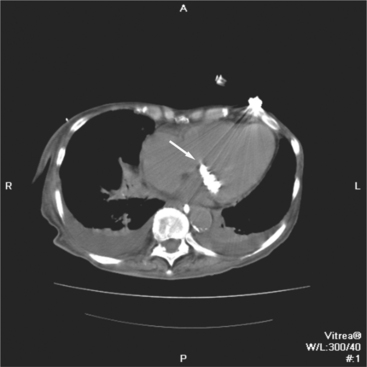
Right and left ventricular enlargement with right ventricular hypertrophy and evidence of pulmonary hypertension characterize the examination of adult patients with VSD. The heart is rotated toward the left, the right ventricular free wall myocardium is thickened, and the pulmonary arteries are enlarged (Figures 5-66D, 5-70). Evidence of prior operation and focal calcification (Fig. 5-71) indicate surgical patch repair of VSD. Septal patches may also become aneurysmal and be a site of thrombus deposition (Fig. 5-72).
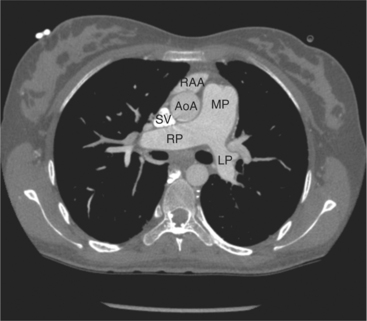
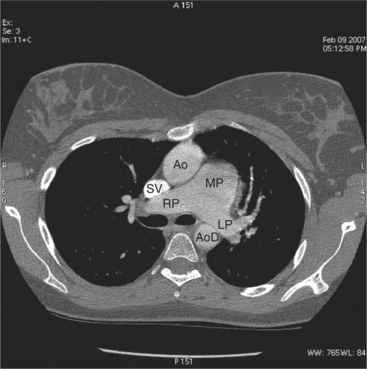
FIGURE 5-70 Axial acquisition through the main (MP), left (LP), and right (RP) pulmonary arteries from a contrast-enhanced examination in the 24-year-old woman in Figure 5-67. The MP is greater in caliber than the ascending aorta (AoA), indicating increased pulmonary blood flow or resistance. The right atrial appendage (RAA) and superior vena cava (SV) are also labeled.
Other Shunts
One can expect to identify four pulmonary veins draining to the left atrium on MDCT acquisition. Anomalous pulmonary veins may drain to systemic veins above the level of the heart, including the innominate and subclavian veins or superior vena cava (Figures 5-66C, 5-73). Veins may also drain directly to the right atrium or coronary sinus or below the level of the heart to the inferior vena cava or portal vein. The scimitar syndrome represents a collection of congenital malformations of the pulmonary arteries, veins, and bronchi resulting in (usually right) pulmonary and pulmonary artery hypoplasia and partial or total anomalous pulmonary venous return from the right lung. Pulmonary segments drain anomalously and the location of their anomalous drainage is variable, but the lesion typically demonstrates total or near-total anomalous drainage from the right lung to the floor of the right atrium or suprahepatic inferior vena cava. The entity is remarkable for the scimitar or sword-shaped vein draining the abnormal lung (Fig. 5-74).
TETRALOGY OF FALLOT
The underlying malformation in patients with tetralogy of Fallot is a malalignment VSD. These defects are usually large. Therefore, the degree to which the crista supraventricularis is malaligned determines the severity of right ventricular outflow obstruction, and thus, the severity of the malformation. Because it is unlikely that CT examination of a patient with unoperated tetralogy of Fallot will be encountered in clinical practice, we will emphasize the findings in adult patients who have undergone surgical repair at a remote time in their lives. In other words, we will describe the long-term findings in operated patients with tetralogy (Figures 5-72, 5-75). The long-term consequences of conventional tetralogy repair include pulmonary insufficiency and right ventricular dysfunction, chronic aortic regurgitation causing aortic and left ventricular dilatation, and pulmonary artery stenosis or dilatation secondary to surgical manipulation.
Boxt LM, Lipton MJ. CT Anatomy of the heart. In: DiCarli MF, Lipton MJ, editors. Cardiac PET and PET/CT imaging. New York: Springer Science and Business Media, 2007.
Braunwald E, Goldblatt A, Aygen MM, et al. Congenital aortic stenosis. I: clinical and hemodynamic findings in 100 patients. Circulation. 1963;27:426-450.
Farmer DW, Lipton MJ, Higgins CB, et al. In vivo assessment of left ventricular wall and chamber dynamics during transient myocardial ischemia using cine CT. Am J Cardiol. 1985;55:560-565.
Cardiovascular computed tomography. Cardiol Clin. 2003;21:491-675. Gerber TC, Kuzo RS, eds:
Lipton MJ, Farmer DW, Killebrew E, et al. Regional myocardial dysfunction: evaluation of patients with prior myocardial infarction with fast CT. Radiology. 1985;157:735-740.
Mirowitz SA, Gutierrez FR. Fibromuscular elements of the right atrium: pseudomass at MR imaging. Radiology. 1992;182:231-233.
Roberts WC. The congenitally bicuspid aortic valve. A study of 85 autopsy cases. Am J Cardiol. 1970;26:72-83.
Cardiovascular imaging. Int J Cardiovasc Imag. 2005;21:1-176. Stanford W, Boxt LM, eds:
Van Praagh R. The segmental approach to diagnosis in congenital heart disease. The cardiovascular system. Birth defects. 1972;8:4-23.
Van Praagh R. The importance of segmental situs in the diagnosis of congenital heart disease. Semin Roentgenol. 1985;20:254-271.