43 Bedside Monitoring of Pulmonary Function
 Pulse Oximetry
Pulse oximetry is a microprocessor-based instrument that incorporates both oximetry and plethysmography to provide continuous noninvasive monitoring of the oxygen saturation of arterial blood (SpO2). Often considered the “fifth vital sign,” it is one of the most important technologic advances for monitoring patients during anesthesia, in the intensive care unit (ICU), on the general ward, in the emergency department, and during a wide variety of procedures.1–3 The pulse oximeter probe is embedded into either a clip or an adhesive wrap and consists of two light-emitting diodes on one side, with a light-detecting photodiode on the opposite side. Either a finger or an earlobe serves as the sample “cuvette.” The tissue bed is transilluminated, and the forward-scattered light is measured. Pulse oximetry targets the signal arising from the arterial bed as light absorbance fluctuates with changing blood volume. Arterial blood flow causes signal changes in light absorption (the pulsatile component called photoplethysmography) that can be distinguished from venous and capillary blood in the surrounding tissues (the baseline, or direct current, component; Figure 43-1).
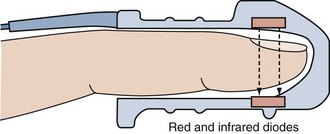
Figure 43-1 Schematic depiction of the pulse oximeter light absorption signal.
(Adapted with permission from Phillips Medical Systems, Carlsbad, California.)
Oximetry uses spectrophotometry to determine SaO2. According to the Beer-Lambert law, the concentration of a substance can be determined by its ability to transmit light.4 Oxygenated hemoglobin (HbO2) and deoxygenated or “reduced” hemoglobin (HbR) species absorb light differently, so that the ratio of their absorbencies can be used to calculate saturation. In addition, there are two minor hemoglobin (Hb) species: carboxyhemoglobin (COHb) and methemoglobin (MetHb). Fractional SaO2 is the proportion of oxygenated hemoglobin relative to the four hemoglobin species:
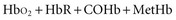
Measuring fractional hemoglobin requires a co-oximeter that incorporates four wavelengths to distinguish each species (Figure 43-2). In contrast, oxygen saturation as determined by pulse oximeter (SpO2) uses two wavelengths, so that it measures functional SaO2:

Accuracy and Precision
Because pulse oximeters themselves cannot be calibrated, their accuracy is highly variable and dependent on both the calibration curve programmed into the monitor and the quality of signal processing.5,6 The ratio of absorbencies is calibrated empirically against SaO2 measured by co-oximetry in normal volunteers subjected to various levels of oxygenation. Pulse oximeters are calibrated against measured SaO2 down to 70% (saturations below this level are determined by extrapolation).5 The resulting calibration curve is stored in the monitor’s microprocessor to calculate SpO2.6
The accuracy of the calibration curve depends on laboratory testing conditions (co-oximeter used, range of oxygenation studied, and characteristics of sample subjects). Most manufacturers report an accuracy of ±2% at an SaO2 greater than 70% and ±3% when the SaO2 is 50% to 70%.2 In normal subjects tested at an SaO2 between 99% and 83%, pulse oximetry has a bias and precision that are within 3% of co-oximetry.7 However, under hypoxic conditions (SaO2 78% to 55%), when the monitor must rely on extrapolated values, bias increases (8%) and precision deteriorates (5%).7 Likewise, in critically ill patients, pulse oximeters historically perform well when the SaO2 is greater than 90% (bias of 1.7%; precision of ±1.2%), but accuracy diminishes at an SaO2 below 90% (bias of 5.1%; precision of ±2.7%)8 (Figure 43-3). Technologic advances over the past decade have apparently improved this performance; a recent study comparing pulse oximetry to co-oximetry reported a bias of 0.19% and a precision of ±2.22% over an SaO2 range of 60% to 100%.9
Dynamic Response
Because pulse oximeters detect very small optical signals (and must reject a variety of artifacts), data must be averaged over several seconds, thus affecting response time.5 Pulse oximeters may register a near-normal SpO2 when the actual SaO2 is less than 70%.5 A prolonged lag time is more common with finger probes than ear probes5,10,11 and is attributed to hypoxia-related peripheral vasoconstriction.5 Bradycardia also is associated with a prolonged response time.11
Sources of Error
Motion artifact and low perfusion are the most common sources of SpO2 inaccuracies, because the photoplethysmographic pulse signal is very low in these settings compared with the total absorption signal.12,13 The combination of motion artifact and low perfusion substantially lowers SpO2 accuracy compared with either artifact alone.14 Causes of motion artifact include shivering, twitching, agitation, intraaortic balloon pump assistance, and patient transport.15,16 Signs of motion artifact include a false or erratic pulse rate reading or an abnormal plethysmographic waveform. Peripheral hypoperfusion from hypothermia, low cardiac output, or vasoconstrictive drugs may increase bias, reduce precision, and prolong the detection time for a hypoxic event.16 Newer technologies have helped reduce the incidence of these problems but they have not been eliminated as a source of error. Relocation of the probe may be required to obtain a more accurate signal.
Despite recent technologic advances, there still are a number of factors that may affect the accuracy of the pulse oximeter. Table 43-1 lists the most common factors.
TABLE 43-1 Common Factors Affecting Pulse Oximetry Measurements
| Factor | Effect |
|---|---|
| Carboxyhemoglobin (COHb) | Slight reduction of the assessment of oxygen saturation (SaO2) by pulse oximetry (SpO2) (i.e., overestimates the fraction of hemoglobin available for O2 transport) |
| Methemoglobin (MetHb) | At high levels of MetHb, SpO2 approaches 85%, independent of actual SaO2 |
| Methylene blue | Transient, marked decrease in SpO2 lasting up to several minutes; possible secondary effects as a result of effects on hemodynamics |
| Anemia | If SaO2 is normal, no effect; during hypoxemia with Hb values less than 14.5 g/dL, progressive underestimation of actual SaO2 |
| Ambient light interference | Bright light, particularly if flicker frequency is close to a harmonic of the light-emitting diode switching frequency, can falsely elevate the SpO2 reading |
| Blood flow | Reduced amplitude of pulsations can hinder obtaining a reading or cause a falsely low reading |
| Motion | Movement, especially shivering, may depress the SpO2 reading |
| Nail polish | Slight decrease in SpO2 reading, with greatest effect using blue nail polish, or no change |
| Sensor contact | “Optical shunting” of light from source to detector directly or by reflection from skin results in falsely low SpO2 reading |
| Skin pigmentation | Small errors or no significant effect reported; deep pigmentation can result in reduced signal |
| Tape | Transparent tape between sensor and skin has little effect; falsely low SpO2 has been reported when smeared adhesive is in the optical path |
| Vasodilation | Slight decrease |
| Venous pulsation | Artifactual decrease in SpO2 |
Dyshemoglobins and Vascular Dyes
Significant amounts of COHb or MetHb can cause errors in SpO2. Carboxyhemoglobin and HbO2 absorb equivalent amounts of red light, so carbon monoxide poisoning results in a falsely elevated SpO2 because the pulse oximeter reports total Hb saturation not just HbO2 saturation. In the setting of carbon monoxide poisoning, the amount of COHb is elevated, resulting in a falsely high SpO2. The patient, however, could be experiencing profound hypoxemia. In contrast, MetHb causes substantial absorption of both red and infrared light, so the ratio approaches 1 (estimated SpO2 of 85%).4 Significant MetHb causes falsely low SpO2 values when the actual SaO2 is greater than 85% and falsely high values when the SaO2 is less than 85%.4 Administration of methylene blue or indocyanine green dyes for diagnostic tests causes a false, transient (1- to 2-minute) drop in SpO2 to as low as 65%.17,18
Nail Polish and Skin Pigmentation
Both dark skin pigmentation and dark nail polish interfere with absorption of the wavelengths used by pulse oximetry. Pulse oximeters thus have greater bias and less precision in black patients.8 Whereas an SpO2 of 92% is sufficient to predict adequate oxygenation in white patients, a saturation of 95% is required in black patients.8 Dark nail polish can falsely lower SpO2, whereas red polish tends not to affect accuracy.19 However, with newer technology, the negative effects of nail polish are lessened. A recent study showed that there was an effect of dark nail polish on the pulse oximetry reading, but it was not clinically relevant.20 When nail polish cannot be removed, mounting the oximeter probe sideways on the finger yields an accurate reading.21
Ambient Light, Anemia, and Hyperbilirubinemia
Although pulse oximeters compensate for the presence of ambient light, the sensor should be shielded from intense light sources with an opaque material. Falsely low SpO2 readings occur when even minor gaps exist between the probe and skin, allowing reflected light off the skin surface to “shunt” directly to the photodiode.22 Xenon surgical lamps and fluorescent lighting can cause a falsely low SpO2.23 Under conditions of anemia (Hb 8 g/dL) and severe hypoxia (SaO2 54%), SpO2 bias is markedly increased (−14%).24 Hyperbilirubinemia does not affect SpO2 directly.25 However, carbon monoxide is a byproduct of heme metabolism, and icteric patients tend to have higher levels of COHb,25 so SpO2 may be falsely elevated.
Reflectance Pulse Oximetry
Reflectance pulse oximetry was designed to counter signal-detection problems associated with finger probes during hypoperfusion. The reflectance sensor is designed for placement on the forehead just above the orbital area, where superficial blood flow is abundant and less susceptible to vasconstriction.26 Whereas traditional probes work by transilluminating a tissue bed and measuring the forward-scattered light on the opposite side of the finger or earlobe, reflectance probes are constructed with the light-emitting diodes and the photodetector located on the same side. The photodetector measures the back-scattered light from the skin.26 In addition, more liberal placement sites for reflectance pulse oximetry has allowed fetal monitoring during labor.27 Intraesophageal SpO2 monitoring is currently under investigation.28 Anasarca, excessive head movement, and difficulty in securing the probe site are some of the problems encountered with reflectance pulse oximetry.29 Light “shunting” from poor skin contact and direct sensor placement over a superficial artery are associated with artifacts.30 Reflectance pulse oximetry is also limited by poor signal-to-noise ratio and variability among sites in the arrangement of blood vessels and tissue blood volume.30 However, recent studies have shown reflectance pulse oximetry to be as effective as finger sensors in many situations.31–34
Technologic Advances
Recent advances in signal analysis and processing have markedly improved SpO2 accuracy during low perfusion and reduced the problem of motion artifact.16,35 According to recent independent testing, these advances occur with pulse oximeters made by several manufacturers.36 Durban and Rostow reported that new pulse oximeter technology can accurately detect SaO2 in 92% of the cases in which traditional SpO2 monitoring failed owing to low perfusion and motion artifact37 (Box 43-1).
Box 43-1
Aarc Clinical Practice Guideline: Pulse Oximetry
Indications
Precautions
Assessment of Need


 Capnometry
Capnometry consists of the measurement and numeric display of expired carbon dioxide (CO2) at the patient’s airway opening.38 When a waveform plotting CO2 against time or volume is also displayed, it is referred to as capnography, and the waveform is referred to as a capnogram.38 Capnometry is most commonly used on patients receiving mechanical ventilation and works by passing infrared light through a sample chamber to a detector on the opposite side. CO2 absorbs infrared light at a peak wavelength of approximately 4.27 µm.38,39 More infrared light passing through the sample chamber (i.e., less CO2) causes a larger signal in the detector relative to the infrared light passing through a reference cell. The sample chamber is either connected directly to the Y-adapter of the ventilator circuit (mainstream), or by a sampling line at the Y-adapter that continuously aspirates gas into a sampling chamber located inside the monitor (sidestream).
Clinical Applications
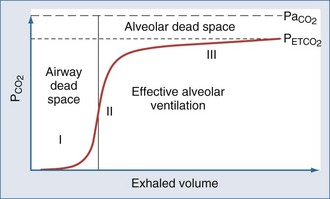
Capnometric determination of the partial pressure of CO2 in end-tidal exhaled gas (PETCO2) is used as a surrogate for the partial pressure of CO2 in arterial blood (PaCO2) during mechanical ventilation40,41 (Figure 43-4). Although widely available today, the utilization of PETCO2 to represent PaCO2 in ICUs remains unclear. While perhaps not an exact match for PaCO2, PETCO2 does provide a valuable trending tool. Also, with newer technologies, the accuracy of PETCO2 measurements is improving. In a recent study, McSwain et al. showed strong correlations between PETCO2 and PaCO2 across a wide range of dead-space conditions.42 Capnometry is used for a variety of purposes, such as the diagnosis of pulmonary embolism, determination of lung recruitment response to positive end-expiratory pressure (PEEP), detection of intrinsic PEEP, evaluation of weaning, indirect marker of elevated dead-space ventilation, assessment of cardiopulmonary resuscitation, indirect determination of cardiac output through partial CO2 rebreathing, verification of endotracheal cannulation, detection of airway accidents, and even determination of feeding tube placement.43–55 Guidelines for the use of capnometry/capnography are outlined by the American Association for Respiratory Care (Box 43-2).
Box 43-2
Aarc Clinical Practice Guideline: Capnography/Capnometry During Mechanical Ventilation
Indications


From AARC clinical practice guideline: capnography/capnometry during mechanical ventilation. Respir Care 2003;48:534-9.
Precautions and Possible Complications
Assessment of Need
Assessment of Outcome


PaCO2-PETCO2 Gradient
Normal subjects have a PaCO2-PETCO2 gradient of 4 to 5 mm Hg.40,43,47,56–60 In critically ill patients, the PaCO2-PETCO2 gradient can be markedly elevated, with a tendency toward wider gradients in obstructive lung diseases (7-16 mm Hg) than in acute lung injury or cardiogenic pulmonary edema (4-12 mm Hg).46,47,61–63 A strong correlation between ΔPETCO2 and ΔPaCO2 (r = 0.82), along with minor bias and reasonable precision between PETCO2 and PaCO2, suggests that arterial blood gas monitoring may not be needed to assess ventilation unless the ΔPETCO2 exceeds 5 mm Hg.48 Yet several studies found that the ΔPETCO2 often falsely predicts the degree and direction of ΔPaCO2.58–6063 Therefore, despite PETCO2 monitoring, routine arterial blood gas analysis is still required in critically ill patients.
Several factors determine the PaCO2-PETCO2 gradient. Whereas PaCO2 reflects the mean partial pressure of CO2 in alveolar gas (PaCO2), PETCO2 approximates the peak PaCO2.64 During expiration, lung regions with high ventilation-to-perfusion ratios dilute the mixed CO2 concentration so that PETCO2 is usually lower than PaCO2.65 However, when CO2 production is elevated (or expiration is prolonged), PETCO2 more closely resembles mixed venous PCO2, as a higher amount of CO2 diffuses into a progressively smaller lung volume.64 Thus, the PaCO2-PETCO2 gradient can be affected by changes in respiratory rate and tidal volume (VT) due to alterations in expiratory time and by CO2 production and mixed venous CO2 content.64 In fact, it is not uncommon for PETCO2 to exceed PaCO2.65 Inotropic or vasoactive drugs may affect the PaCO2-PETCO2 gradient in an unpredictable manner, either by increasing cardiac output and pulmonary perfusion (thereby reducing alveolar dead space) or by reducing pulmonary vascular resistance and magnifying intrapulmonary shunt by countering hypoxic pulmonary vasoconstriction.58
Mechanical factors can cause either inconsistencies or inaccuracies in PETCO2. The sample tubing length and aspirating flow rates used in sidestream capnometers affect the time required to measure changes in tidal CO2 concentration.66 At respiratory frequencies above 30, capnometers tend to underreport the true PETCO2.67 This may occur because of gas mixing between adjacent breaths during transport down the sampling line and in the analysis chamber.67 This problem can be avoided with mainstream analyzers, which provide near-instantaneous CO2 measurement (<250 msec).68
PaCO2-PETCO2 Gradient, Positive End-Expiratory Pressure, and Lung Recruitment
PEEP recruits collapsed alveoli, improves ventilation-perfusion matching, and reduces alveolar dead space, although excessive levels cause overdistention and increased alveolar dead space.69 Because the PaCO2-PETCO2 gradient correlates strongly with the physiologic dead space–to–tidal volume ratio (VD/VT), it may be useful in titrating PEEP in patients with acute lung injury (ALI) or acute respiratory distress syndrome (ARDS).49,50 An animal model of ARDS found that the stepwise application of PEEP progressively reduced the PaCO2-PETCO2 gradient and coincided with maximal or near-maximal improvements in oxygenation.61 However, PEEP applied beyond the lowest PaCO2-PETCO2 gradient caused a secondary rise in the gradient, along with decreased cardiac output. Although a subsequent trial was unable to reproduce these findings in humans, another study found that the PaCO2-PETCO2 gradient narrowed (14 to 8 mm Hg) and oxygenation improved when PEEP was set at the lower inflection point of the pressure-volume curve.45,62 When PEEP was set 5 cm H2O above the lower inflection point, the PaCO2-PETCO2 gradient rose to 11 mm Hg, and cardiac output trended downward. In patients without a lower inflection point, the PaCO2-PETCO2 gradient did not change in response to PEEP. Thus, in a subset of ARDS patients, the PaCO2-PETCO2 gradient may be an effective way to titrate PEEP.
PETCO2 Monitoring During Cardiopulmonary Resuscitation
Monitoring end-tidal CO2 concentration is a reliable method for evaluating the effectiveness of cardiopulmonary resuscitation.70 In animal models, PETCO2 is strongly correlated with coronary perfusion pressure and successful resuscitation,71 whereas in humans, changes in PETCO2 are directly proportional to changes in cardiac output.72 PETCO2 during precordial compressions can distinguish successful from unsuccessful resuscitation, with values greater than 10 mm Hg73 or greater than 16 mm Hg74 associated with successful resuscitation.
Measurement of Dead-Space Ventilation
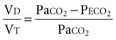
Ventilation-perfusion abnormalities are the primary physiologic disturbance in nearly all pulmonary diseases and the principal mechanism for elevated PaCO2.75 Dead-space ventilation (VD), the portion of VT that does not encounter perfused alveoli, directly impacts CO2 excretion and is used as an indirect measure of ventilation-perfusion abnormalities. Physiologic VD represents the summation of anatomic-conducting airway) and nonperfused alveolar components.
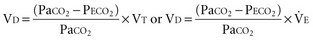
The dead-space volume per breath or per minute can be determined by multiplying VD/VT by the simultaneously measured average VT or minute ventilation ( )76:
)76:
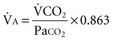
By subtracting the physiologic VD per minute from the  , the alveolar minute ventilation (
 ) is obtained
 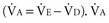 also can be calculated as the volume production of CO2 per minute (
 ) divided by the PaCO276:
Expired gas collection with a Douglas bag is the classic method for measuring VD/VT. However, the gas collection system requires additional valving and connectors, making the procedure time consuming and awkward. Metabolic monitors produce equally accurate, reliable results and are less cumbersome.77,78 The Douglas bag method and metabolic monitors, however, do share a limitation when used on a mechanically ventilated patient. During mechanical ventilation, gas is compressed in the circuit, which dilutes the fractional expired carbon dioxide concentration.79 A correction factor can be used to offset mathematical effects of gas compression. Volumetric capnography is an alternative method of measuring PECO2 and VD/VT and has the advantage of being measured at the patient, thus eliminating the effects of compression volume contamination and the need to apply a correction factor.80 In patients with ARDS, it has been shown that measurements of VD/VT using volumetric capnography is as accurate as those obtained through the use of a metabolic monitor.81 In addition, newer monitors incorporating capnography and pneumotachygraphy provide accurate single-breath determinations of VD/VT.82
A significant source of measurement error for VD/VT is the contamination of expired gas with circuit compression volume.83 During positive-pressure ventilation, part of the VT is compressed in the circuit, and during expiration, this gas mixes with CO2-laden gas from the lungs. The dilution of the expired CO2 results in a falsely elevated VD/VT that is directly proportional to the peak inspiratory pressure and circuit compliance. Clinically, correcting VD/VT for compression volume is done by multiplying the measured PECO2 by the ratio of the ventilator-set VT to the VT delivered to the patient.84 This requires determination of the ventilator circuit compliance.
Clinically, VD/VT may assist in the management of pulmonary disease in terms of both ventilator adjustments and diagnostic testing. Suter and colleagues found that VD/VT decreased as the lung was recruited but increased with lung overdistention during PEEP titration in ARDS.69 A more recent study involving the use of dead-space calculations in ARDS showed that increased dead space is associated with a higher mortality in the early and intermediate phases of ARDS.85 Fletcher and Jonson used VD/VT to optimize VT and inspiratory time settings during general anesthesia.86 Measuring VD/VT may assist in identifying patients who can be removed from mechanical ventilation. Hubble and coworkers found that values less than 0.50 predicted successful extubation, and values greater than 0.65 identified patients at risk for post-extubation respiratory failure.82
One of the main clinical uses of VD/VT is to aid in the diagnosis of acute pulmonary embolism. VD/VT is comparable to radioisotopic lung scanning in detecting acute pulmonary embolism, with a value less than 0.40 suggesting that a significant embolus is improbable.87 Single-breath estimates of alveolar VD are also capable of identifying patients with pulmonary embolus.88 Increased physiologic VD/VT (>0.60) was found to be significantly associated with mortality in patients with ARDS and in neonates with congenital diaphragmatic hernia.89,90 In particular, the findings that VD/VT is elevated early in the course of ARDS and is associated with increased mortality may be particularly useful. The efficacy of new therapies for ARDS may be judged, in part, by their ability to reduce VD/VT.
Transcutaneous Monitoring
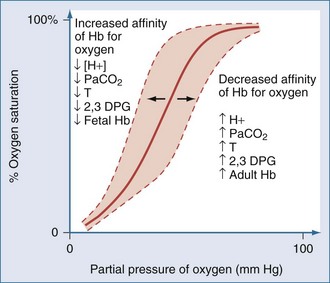
Transcutaneous blood gas monitoring involves the use of a surface skin sensor to provide continuous noninvasive estimates of arterial PO2 and PCO2 (TcO2 and TcCO2, respectively). The sensor warms the skin to promote arterialization as well as to increase the permeability of the skin to oxygen and carbon dioxide (Figure 43-5). Elements of the sensor include a heating element, O2 electrode, and a CO2 electrode. The electrodes measure the gas tensions in an electrolyte gel located between the sensor and the skin. Similar to end-tidal CO2 and pulse oximetry, transcutaneous monitoring has the potential advantages over direct arterial blood gas sampling of reducing the amount of blood drawn, time spent for analysis, and associated costs. TcCO2 tends to be more reliable, most likely because of the greater diffusion capacity of CO2 through the skin and the skin’s own oxygen consumption.91 TcCO2 has historically been used more frequently in the neonatal and pediatric population, but recent technologic advances have led to increased utilization in adults, despite the effects of a thicker epidermis. Its use in neonates in particular has been shown to be the most accurate because of their thin, poorly keratinized skin, which has fewer diffusion barriers to capillary gases.92
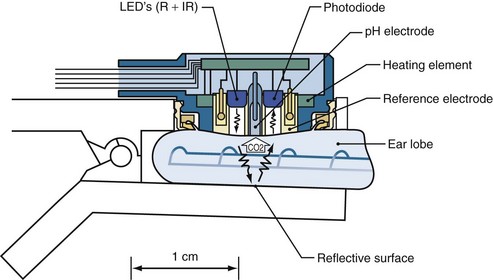
Figure 43-5 A combined SpO2/TcPCO2 sensor at the ear lobe.
(From Eberhard P. The design, use, and results of transcutaneous carbon dioxide analysis: current and future directions. Anesth Analg 2007;105:S48-52.)
The accuracy of transcutaneous arterial blood gas measurement in adults remains a point of debate. A number of studies have shown that TcCO2 monitoring is accurate in adult patients with respiratory disorders.93–96 Some studies even suggest that TcCO2 monitoring may be more accurate than ETCO2 monitoring owing in part to elimination of dead space.97–99 Conversely, some reports suggest that TcPO2 is not accurate enough to be used clinically in the adult population or even with preterm infants.100,101
 Assessment of Pulmonary Mechanics
Compliance
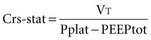
Under conditions of passive mechanical ventilation, peak airway pressure denotes the total force necessary to overcome the resistive and elastic recoil properties of the respiratory system (i.e., both lungs and chest wall). Compliance is expressed as the ratio of volume added to pressure applied. Dynamic compliance is ratio of volume added to the peak airway pressure (Paw) and includes the resistive forces in the tracheobronchial tree. A more useful measurement is that of static compliance. Static compliance requires the use of an end-inspiratory hold.102 During an end-inspiratory pause, peak airway pressure dissipates down to a stable plateau pressure. At the end of the inspiratory hold maneuver, “static” conditions usually exist (resistive forces have been eliminated), and the corresponding “plateau pressure” represents the elastic recoil pressure.
Dividing the VT by the plateau pressure (Pplat) minus the PEEP yields the static compliance of the respiratory system (Crs-stat).103 Even at moderate levels of  (>10 L/min), dynamic gas trapping can occur (intrinsic PEEP) and, if suspected, Crs-stat must be calculated using total PEEP (PEEPtot) measured during an end-expiratory pause rather than the PEEP applied at the airway104:
Resistance
Respiratory system resistance (Rrs) is the ratio of driving pressure to flow.105 It is calculated as the difference between Paw and Pplat divided by the preocclusion peak inspiratory flow rate  and expressed as cm H2O/L per second106:
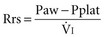
Resistance is flow dependent because the driving pressure necessary to overcome resistance increases disproportionately to changes in  (due to increased turbulence).107 Therefore, respiratory system resistance can be accurately determined only with a constant inspiratory flow (square wave) pattern.106
Compliance and Resistance in Normal and Pathologic Conditions
In mechanically ventilated normal patients, compliance is 57 to 85 mL/cm H2O, and resistance is 1 to 8 cm H2O/L per second.108–110 Abnormalities in compliance and resistance in patients with acute respiratory failure are dependent on both the cause and severity of the disease. Patients with ARDS or cardiogenic pulmonary edema tend to have a low compliance (35 or 44 mL/cm H2O, respectively) and an elevated resistance (12 or 15 cm H2O/L per second, respectively).111 In contrast, patients with chronic airway obstruction tend to have both a higher compliance (66 mL/cm H2O) and a higher resistance (26 cm H2O/L per second).111
Dynamic Gas Trapping and Intrinsic Positive End-Expiratory Pressure
At end expiration, if the respiratory system remains above its relaxed position, gas gets trapped and the elastic recoil pressure in the lungs remains above baseline and is considered positive. This phenomenon is referred to as intrinsic PEEP (PEEPi).112 PEEPi can be measured by an end-expiratory circuit occlusion whereby, after a normal expiratory time elapses, both the inspiratory and expiratory ventilator valves close for 3 to 5 seconds, allowing alveolar pressure to equilibrate with airway pressure (see Figure 43-3).113,114 This pressure represents an average PEEPi throughout the lungs.113,115 However, it is important to keep in mind that different degrees of intrinsic PEEP may coexist in the lungs because of regional variations in time constants from underlying pathology.114,115 Intrinsic PEEP is more common in mechanically ventilated patients with chronic obstructive lung diseases (where dynamic hyperinflation slows elastic recoil) and patients who require high respiratory rates (where there is inadequate time for complete exhalation).
Pressure-Volume Curves
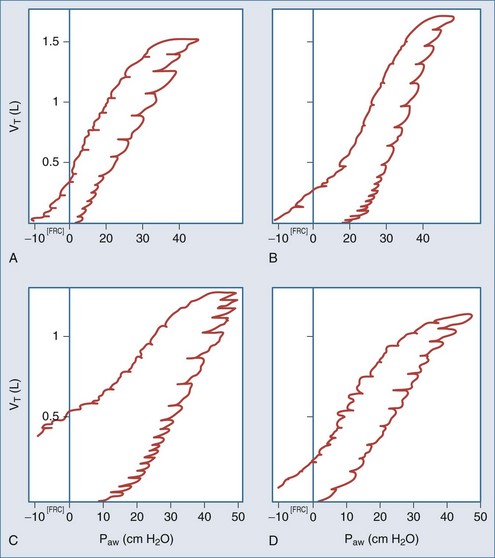
The static pressure-volume relationship can be used to analyze the elastic properties of the respiratory system and help guide mechanical ventilation.116 Pressure-volume (P-V) curves usually have a sigmoidal shape (Figure 43-6). When inflation begins below functional residual capacity (FRC), there is relatively little volume change as transpulmonary pressure increases. This is referred to as the starting compliance and corresponds to the first 250 mL of volume change.117 It reflects either the relatively high pressure required to overcome small airway closure in the dependent lung zones or the relatively small area of aerated lung tissue as inflation commences.117,118 Typically this low compliance segment in the P-V curve is followed by an abrupt slope change with a concave appearance that is termed the lower inflection point,100 or “Pflex.”101 A common interpretation of the lower inflection point is that it signifies an abrupt reopening of collapsed peripheral airways and alveoli.116,118–120 Above the lower inflection point, the P-V curve becomes linear and is referred to as the inflation compliance.121 As the total lung capacity is approached, compliance decreases and the P-V curve becomes convex (bow shaped). This is referred to as end compliance121 and is thought to signify the loss of distensibility at maximal inflation.118 This point is termed the upper inflection point.121 As the lung is deflated, the linear portion of the curve is referred to as the deflation compliance, or true physiologic compliance, as it represents the elastic properties of the lung after full recruitment.122 As lung deflation proceeds below FRC, an inflection point often occurs on the deflation limb that represents small-airway closure.122 This airway closure tends to occur at a lower pressure than the lower inflection point on the inflation limb because the minimal force necessary to maintain patent airways is less than the pressure needed to recruit collapsed ones.123
Constructing a Pressure-Volume Curve
There are three general approaches for determining the P-V curve: the supersyringe method, constant flow method, and multiple occlusion method.121,124,125 The supersyringe method involves the use of a large syringe that can accommodate up to 2 liters of volume. At exhalation, insufflated volume and the resulting pressures are recorded (after a 2-3 second pause at each point to eliminate the resistive forces) in a stepwise fashion (usually 100-mL increments).125 Usually, when airway pressure reaches the 40 cm H2O range, inflation is stopped and deflation is performed the same way. Volume steps are plotted against the corresponding static pressure points on graph paper to obtain the curve. Respiratory system compliance is the slope of the inflation and deflation curves between volumes of 0.5 and 1 L.119 The disadvantage to the supersyringe method is that it requires additional equipment, the patient has to be disconnected from the ventilator, and patient paralysis is required. The constant flow method is available on some ventilators and involves the use of very low inspiratory and expiratory flows. The ventilator will then display the pressure-volume plot. Higher flows, though, will allow the viscoelastic properties of the lung to shift the curve to the right. Disadvantages to this method include the fact that some ventilators cannot control expiratory flow (the deflation limb would be inaccurate) and, in most instances, the patient will require additional sedation so as not to contribute any spontaneous efforts.
Determination of Lower and Upper Inflection Points
In clinical practice, the lower inflection point of the inflation limb is usually determined by the graphic technique.97 First, a tangent is drawn extending the slope of the starting compliance. Another tangent is drawn extending the slope of the inflation compliance down toward the horizontal axis. Where the two tangents intersect, a third tangent is drawn down to the horizontal axis, and this point is considered the lower inflection point. The same technique can be used to determine the upper inflection point on the inflation limb, as well as the deflation limb’s lower inflection point. Typically, PEEP is set 2 cm H2O above the lower inflection point to ensure optimal lung recruitment, and VT is set below the upper inflection point to prevent lung injury from excessive stretch.116,126 Pressure-volume curves obtained through the use of a ventilator require visual interpretation of the inflection points. The problem with visual interpretation is that the inflection points are not always completely evident. This can lead to differing interpretations among clinicians.
Hysteresis
Hysteresis refers to the difference in compliance during inflation versus deflation. Compliance tends to be higher during deflation than inflation because higher pressures may be required during inspiration to recruit collapsed alveoli. This “extra” pressure is not required during deflation to prevent derecruitment. Ultimately then, the deflation limb may be more important for setting PEEP, since the deflation limb inflection point represents the point at which the alveoli will collapse.127
 Assessment of Breathing Pattern and Central Drive
Rate and Tidal Volume
Basic assessment of the respiratory pattern includes the measurement of respiratory rate and VT. A normal respiratory rate is 12 to 24 breaths/min, and mechanical ventilation is generally indicated when it exceeds 35.128 A VT of 5 mL/kg is considered sufficient to maintain unassisted breathing.129 Tachypnea is often the earliest sign of impending respiratory failure, even when arterial blood gases remain within normal limits.130 This may reflect the fact that muscle fatigue (which results from a mechanical workload that exceeds the power capacity of the ventilatory muscles) occurs before overt ventilatory pump failure.131 If untreated, a rapid-shallow breathing pattern can develop that will be progressively ineffective in maintaining acceptable arterial blood gases.132
Of particular interest is the utility of breathing pattern in assessing the feasibility of weaning from mechanical ventilation. Typically, patients who fail to wean are more tachypneic (respiratory rate > 32) and have an abnormally low VT (<200 mL).133 The respiratory rate–VT ratio (rapid shallow breathing index [RSBI]) is a method that helps in evaluating readiness to wean. The RSBI is thought to be an accurate predictor of breathing effort.134,135 A RSBI threshold of less than 105 has both a high positive predictive value (0.78) and negative predictive value (0.95) for the ability to maintain unassisted breathing.136 Although the utility of RSBI has support from various studies,137,138 the original negative predictive value, at a cutoff greater than 105, may be too low according to some.138,139 While not an absolute predictor in and of itself, RSBI can be a valuable tool in helping to predict readiness to wean.
Central Ventilatory Drive
In some situations, clinicians may want to assess the central ventilatory drive. A heightened drive will increase the patient’s work of breathing during mechanical ventilation.140 Measuring the respiratory rate will give the clinician an indication of the central ventilatory drive but not the depth of the drive. Depth of the drive can be measured by a brief (100 msec) inspiratory occlusion after the onset of an effort, called P0.1. Briefly occluding the airway at the onset of inspiratory effort results in isometric contraction of the inspiratory muscles, so P0.1 is independent of respiratory system mechanics.141 Measuring airway pressure at 100 msec indirectly reflects efferent motor neuron output. An increasing stimulus to the inspiratory muscles causes a more forceful contraction, with a proportional increase in pressure development. The selection of 100 msec is based on the fact that conscious or nonconscious perception of (and response to) sudden load changes requires approximately 250 msec.142 It is convenient that during mechanical ventilation, the lag associated with the trigger phase provides sufficient time to measure P0.1.143 Some ventilators144 and pulmonary mechanics monitors145 now measure P01. Experimentally, P0.1 has been used for closed-loop control of pressure support levels during weaning from mechanical ventilation.146
At rest, P0.1 is normally 0.8 cm H2O, whereas in patients with respiratory failure, it can range from 2 to 6 cm H2O, depending on the level of ventilatory support.143,145,147–150 P0.1 correlates highly with patient work of breathing, and changes in P0.1 (which occur with ventilator adjustments) show a high degree of sensitivity and specificity for corresponding changes in patient work.151,152 P0.1 has been used to predict weaning and extubation success in patients recovering from acute respiratory failure. Levels exceeding 6 cm H2O may predict weaning failure in chronic obstructive lung disease, whereas a P0.1 greater than 4 cm H2O may presage failure in ARDS.153,154
During brief trials of unassisted breathing, a P0.1 greater than 7 cm H2O tends to describe patients requiring total ventilatory support and has been reported as a cutoff level in patients who ultimately fail a trial of extubation.155 P0.1 values between 4 and 7 cm H2O may indicate patients who can be managed with partial ventilatory support, whereas a value less than 4 cm H2O may indicate patients no longer in need of mechanical assistance.154
Key Points
Assessment of Pulmonary Mechanics
Assessment of Breathing Pattern, Strength, and Central Drive
Alberti A, Gallo F, Fongaro A, et al. P0.1 is a useful parameter in setting the level of pressure support ventilation. Intensive Care Med. 1995;21:547-553.
Falk JL, Rackow EC, Weil MH. End-tidal carbon dioxide concentration during cardiopulmonary resuscitation. N Engl J Med. 1988;318:607-611.
Nuckton TJ, Alonso JA, Kallet RH, et al. Pulmonary dead-space fraction as a risk factor for death in acute respiratory distress syndrome. N Engl J Med. 2002;346:1281-1286.
Pepe PE, Marini JJ. Occult positive end-expiratory pressure in mechanically ventilated patients with airflow obstruction. Am Rev Respir Dis. 1982;126:166-170.
Tremper KK, Barker SJ. Pulse oximetry. Anesthesiology. 1989;70:98-108.
1 Severinghaus JW, Astrup PB. History of blood gas analysis. VI. Oximetry J Clin Monit. 1986;2:270-288.
2 Pedersen T, Moller AM, Pederson BD. Pulse oximetry for perioperative monitoring: systemic review of randomized controlled trials. Anaesth Analg. 2003;96:426-431.
3 Van de Louw A, Cracco C, Cerf C, et al. Accuracy of pulse oximetry in the intensive care unit. Intensive Care Med. 2001;27:1606-1613.
4 Tremper KK, Barker SJ. Pulse oximetry. Anesthesiology. 1989;70:98-108.
5 Severinghaus JW, Naifeh KH. Accuracy of response of six pulse oximeters to profound hypoxia. Anesthesiology. 1987;67:551-558.
6 Jubran A. Advances in respiratory monitoring during mechanical ventilation. Chest. 1999;116:1416-1425.
7 Hannhart B, Haberer JP, Saunier C, Laxenaire MC. Accuracy and precision of fourteen pulse oximeters. Eur Respir J. 1991;4:115-122.
8 Jubran A, Tobin MJ. Reliability of pulse oximetry in titrating supplemental oxygen therapy in ventilator-dependent patients. Chest. 1990;97:1420-1425.
9 Wouters PF, Gehring H, Meyfroid G, et al. Accuracy of pulse oximeters: the European multi-center trial. Anesth Analg. 2002;94:S13-S16.
10 Kagle DM, Alexander CM, Berko RS. Evaluation of the Ohmeda 3700 pulse oximeter: Steady-state and transient response characteristics. Anesthesiology. 1987;66:376-381.
11 West P, George CF, Kryger MH. Dynamic in vivo response characteristics of three oximeters: Hewlett-Packard 47201 A, Biox III, Nellcor N-100. Sleep. 1987;10:263.
12 Welch JP, DeCesare R, Hess D. Pulse oximetry: instrumentation and clinical application. Respir Care. 1990;35:584-601.
13 Salyer JW. Neonatal and pediatric pulse oximetry. Respir Care. 2003;48:386-396.
14 Gehring H, Hornberger C, Matz H, et al. The effects of motion artifact and low perfusion on the performance of a new generation of pulse oximeters in volunteers undergoing hypoxemia. Respir Care. 2002;47:48-60.
15 Lutter NO, Urankar S, Kroeber S. False alarm rates of three third-generation pulse oximeters in PACU, ICU and IABP patients. Anesth Analg. 2002;94:S69-S75.
16 Tobin RM, Pologe JA, Batchelder PB. A characterization of motion affecting pulse oximetry in 350 patients. Anesth Analg. 2002;94:S54-S61.
17 Scheller MS, Unger RJ, Kelner MJ. Effect of intravenously administered dyes on pulse oximetry readings. Anesthesiology. 1986;65:550-552.
18 Kessler MR, Eide T, Humayun B, Poppers PJ. Spurious pulse oximeter desaturation with methylene blue injection. Anesthesiology. 1986;65:435-436.
19 Cote CJ, Goldstein EA, Fuchsman WH, Hoaglin DC. The effect of nail polish on pulse oximetry. Anesth Analg. 1989;67:683-685.
20 Hinkelbein J, Genzwuerker HV, Sogl R, et al. Effect of nail polish on oxygen saturation determined by pulse oximetry in critically ill patients. Resuscitation. 2007;72:82-91.
21 White PF, Boyle WA. Nail polish and oximetry. Anesth Analg. 1989;68:546-548.
22 Gardosi JO, Damianou D, Schram CM. Inappropriate sensor application in pulse oximetry. Lancet. 1992;340:920-925.
23 Amar D, Neidzwski J, Wald A, Finck AD. Fluorescent lighting interferes with pulse oximetry. J Clin Monit. 1989;5:135-137.
24 Severinghaus JW, Koh SO. Effect of anemia on pulse oximeter accuracy at low saturation. J Clin Monit. 1990;6:85-88.
25 Veyckemans F, Baele P, Guillaume JE, et al. Hyperbilirubinemia does not interfere with hemoglobin saturation measured by pulse oximetry. Anesthesiology. 1989;70:118-122.
26 Dassel ACM, Graaff R, Sikkema M, et al. Reflectance pulse oximetry at the forehead improves by pressure on the probe. J Clin Monit. 1995;11:237-244.
27 Johnson N, Johnson VA, Fisher J. Fetal monitoring with pulse oximetry. Br J Obstet Gynaecol. 1991;98:36-41.
28 Kyriacou PA, Moye AR, Choi DM, et al. Investigation of the human oesophagus as a new monitoring site for blood oxygen saturation. Physiol Meas. 2001;22:223-232.
29 Cheng EY, Hopwood MB, Kay J. Forehead pulse oximetry compared with finger pulse oximetry and arterial blood gas measurement. J Clin Monit. 1988;4:223-226.
30 Nijland R, Jongsma HW, van den Berg PP, et al. The effects of pulsating arteries on reflectance pulse oximetry: measurements in adults and neonates. J Clin Monit. 1995;11:118-122.
31 Fernandez M, Burns K, Calhoun B, et al. Evaluation of a new pulse oximeter sensor. Amer J Crit Care. 2007;16:146-152.
32 Choi SJ, Ahn HJ, Kim CS, et al. Comparison of desaturation and resaturation response times between transmission and reflectance pulse oximeters. Acta Anaesthesiol Scand. 2010;54:212-217.
33 Berkenbosch JW, Tobias JD. Comparison of a new forehead reflectance pulse oximeter sensor with a conventional digit sensor in pediatric patients. Resp Care. 2006;51:726-731.
34 Hodgson CL, Tuxen DV, Holland AE, et al. Comparison of forehead Max-Fast pulse oximetry sensor with finger sensor at high positive end-expiratory pressure in adult patients with acute respiratory distress syndrome. Anaesth Intensive Care. 2009;37:953-960.
35 Mendelson Y, Lewinsky RM, Wasserman Y. Multi-wavelength reflectance pulse oximetry. Anesth Analg. 2002;94:S26-S30.
36 Next-generation pulse oximetry. Health Devices. 2003;32:47-87.
37 Durban CG, Rostow SK. Advantages of new technology pulse oximetry with adults in extremis. Anesth Analg. 2002;94:S81-S83.
38 Hess D. Capnometry and capnography: technical aspects, physiologic aspects, and clinical applications. Respir Care. 1990;35:557-576.
39 Stock M. Capnography for adults. Crit Care Clin. 1995;11:219-232.
40 Nunn JF, Hill DW. Respiratory dead space and arterial to end-tidal CO2 tension differences in anesthetized man. J Appl Physiol. 1960;15:383-389.
41 Whitesell R, Asiddao C, Gollman D, Jablonski J. Relationship between arterial and peak expired carbon dioxide pressure during anesthesia and factors influencing the difference. Anesth Analg. 1981;60:508-512.
42 McSwain DS, Hamel DS, Smith BP, et al. End-tidal and arterial carbon dioxide measurements correlate across all levels of physiologic dead space. Resp Care. 2010;55:288-293.
43 Hatle L, Rokseth R. The arterial to end-expiratory carbon dioxide tension gradient in acute pulmonary embolism and other cardiopulmonary diseases. Chest. 1974;66:352-357.
44 Murray IP, Modell JH, Gallagher TJ, Banner MJ. Titration of PEEP by the arterial minus end-tidal carbon dioxide gradient. Chest. 1984;85:100-104.
45 Blanch L, Fernandez R, Benito S, et al. Effect of PEEP on the arterial minus end-tidal carbon dioxide gradient. Chest. 1987;92:451-454.
46 Blanch L, Fernandez R, Artigas A. The effect of auto-positive end-expiratory pressure on the arterial-end-tidal carbon dioxide slope in critically ill patients during total ventilatory support. J Crit Care. 1991;6:202-210.
47 Morley TF, Giaimo J, Maroszan E, et al. Use of capnography for assessment of the adequacy of alveolar ventilation during weaning from mechanical ventilation. Am J Respir Crit Care Med. 1993;148:339-344.
48 Healey CJ, Fedullo AJ, Swinburne AJ, Wahl GW. Comparison of noninvasive measurements of carbon dioxide tension during withdrawal from mechanical ventilation. Crit Care Med. 1987;15:764-768.
49 Yamanaka MK, Sue DY. Comparison of arterial-end-tidal PCO2 difference and dead space/tidal volume ratio in respiratory failure. Chest. 1987;92:832-835.
50 Poppius H, Korhonen O, Viljanen AA, Kreus KE. Arterial to end-tidal CO2 difference in respiratory disease. Scand J Respir Dis. 1975;56:254-262.
51 Falk JL, Rackow EC, Weil MH. End-tidal carbon dioxide concentration during cardiopulmonary resuscitation. N Engl J Med. 1988;318:607-611.
52 Jaffe MB. Partial CO2 rebreathing cardiac output—operating principles of the NICO system. J Clin Monit. 1999;15:387-401.
53 Birmingham PK, Cheney FW, Ward RJ. Esophageal intubation: a review of detection techniques. Anesth Analg. 1986;65:886-891.
54 Murray IP, Modell JH. Early detection of endotracheal tube accidents by monitoring carbon dioxide concentration in respiratory gas. Anesthesiology. 1983;59:344-346.
55 Kindopp AS, Drover JW, Heyland DK. Capnography confirms correct feeding tube placement in intensive care unit patients. Can J Anaesth. 2001;48:705-710.
56 Takki S, Aromaa U, Kauste A. The validity and usefulness of the end-tidal PCO2 during anesthesia. Ann Clin Res. 1972;4:278-284.
57 Tulou PP, Walsh PM. Measurement of alveolar carbon dioxide tension at maximal expiration as an estimate of arterial carbon dioxide tension in patients with airway obstruction. Am Rev Respir Dis. 1970;102:921-926.
58 Russell GB, Graybeal JM. Stability of arterial to end-tidal carbon dioxide gradients during postoperative cardiorespiratory support. Can J Anaesth. 1990;37:560-566.
59 Raemer DB, Francis D, Philip JH, Gabel RA. Variation in PCO2 between arterial blood and peak expired gas during anesthesia. Anesth Analg. 1983;62:1065-1069.
60 Hess D, Schlottag A, Levin B, et al. An evaluation of the usefulness of end-tidal PCO2 to aid weaning from mechanical ventilation following cardiac surgery. Respir Care. 1991;36:837-843.
61 Blanch L, Fernandez R, Benito S, et al. Effect of PEEP on the arterial minus end-tidal carbon dioxide gradient. Chest. 1987;92:451-454.
62 Jardin F, Genevray B, Pazin M, Margairaz A. Inability to titrate PEEP in patients with acute respiratory failure using end-tidal carbon dioxide measurements. Anesthesiology. 1985;62:530-533.
63 Russell GB, Graybeal JM. Reliability of the arterial to end-tidal carbon dioxide gradient in mechanically ventilated patients with multisystem trauma. J Trauma. 1994;36:317-322.
64 Jones NL, Robertson DG, Kane JW. Difference between end-tidal and arterial PCO2 in exercise. J Appl Physiol. 1979;47:954-960.
65 Moorthy SS, Losasso AM, Wilcox J. End-tidal PCO2 greater than PaCO2. Crit Care Med. 1984;12:534-535.
66 Schena J, Thompson J, Crone RK. Mechanical influences on the capnogram. Crit Care Med. 1984;12:672-674.
67 From RP, Scamman FL. Ventilatory frequency influences accuracy of end-tidal CO2 measurements. Anesth Analg. 1988;67:884-886.
68 Block FE, McDonald JS. Sidestream versus mainstream carbon dioxide analyzers. J Clin Monit. 1992;8:139-141.
69 Suter PM, Fairley HB, Isenberg MD. Optimal end-expiratory pressure in patients with acute pulmonary failure. N Engl J Med. 1975;292:284-289. 65
70 Weil MH, Bisera J, Trevino RP, Rackow EC. Cardiac output and end-tidal carbon dioxide. Crit Care Med. 1985;13:907-909.
71 Sanders AB, Ewy GA, Bragg S, et al. Expired PCO2 as a prognostic indicator of successful resuscitation from cardiac arrest. Ann Emerg Med. 1985;14:948-952.
72 Shibutani K, Muraoka M, Shirasaki S, et al. Do changes in end-tidal PCO2 quantitatively reflect changes in cardiac output? Anesth Analg. 1994;79:829-833.
73 Sanders AB, Kern KB, Otto CW, et al. End-tidal carbon dioxide monitoring during cardiopulmonary resuscitation: a prognostic indicator for survival. JAMA. 1989;262:1347-1351.
74 Salen P, O’Connor R, Sierzenski P, et al. Can cardiac sonography and capnography be used independently and in combination to predict resuscitation outcomes? Acad Emerg Med. 2001;8:654-657.
75 West JB. Assessing pulmonary gas exchange. N Engl J Med. 1987;316:1336-1338.
76 Ruppel GL. Manual of Pulmonary Function Testing, 5th ed. St Louis: Mosby Year Book; 1991. p. 30-4
77 MacKinnon JC, Houston PL, McGuire GP. Validation of the Deltatrac metabolic cart for measurement of dead-space-to-tidal-volume ratio. Respir Care. 1997;42:761-764.
78 Lum L, Saville A, Venkataraman ST. Accuracy of physiologic deadspace measurement in intubated pediatric patients using a metabolic monitor: comparison with the Douglas bag method. Crit Care Med. 1998;26:760-764.
79 Crossman PF, Bushnell LS, Hedley-Whyte J. Dead-space during artificial ventilation: gas compression and mechanical dead-space. J Appl Physiol. 1970;28:94-97.
80 Blanch L, Lucangelo U, Lopez-Aguilar J, et al. Volumetric capnography in patients with acute lung injury: effects of positive end-expiratory pressure. Eur Respir J. 1999;13:1048-1054.
81 Kallet RH, Daniel BM, Garcia O, et al. Accuracy of physiologic dead space measurements in patients with acute respiratory distress syndrome using volumetric capnography: comparison with the metabolic monitor method. Respir Care. 2005;50:462-467.
82 Hubble CL, Gentile MA, Tripp DS, et al. Deadspace to tidal volume ratio predicts successful extubation in infants and children. Crit Care Med. 2000;28:2034-2040.
83 Crossman PF, Bushnell LS, Hedley-Whyte J. Dead space during artificial ventilation: gas compression and mechanical dead space. J Appl Physiol. 1970;28:94-97.
84 Forbat AF, Her C. Correction for gas compression in mechanical ventilators. Anesth Analg. 1980;59:488-493.
85 Raurich JM, Vilar M, Colomar A, et al. Prognostic value of the pulmonary dead-space fraction during the early and intermediate phases of acute respiratory distress syndrome. Resp Care. 2010;55:282-287.
86 Fletcher R, Jonson B. Deadspace and the single breath test for carbon dioxide during anaesthesia and artifical ventilation: effects of tidal volume and frequency of respiration. Br J Anaesth. 1984;56:109-119.
87 Burki NK. The dead space to tidal volume ratio in the diagnosis of pulmonary embolism. Am Rev Respir Dis. 1986;133:679-685.
88 Eriksson L, Wollmer P, Olsson CG, et al. Diagnosis of pulmonary embolism based upon alveolar dead space analysis. Chest. 1989;96:357-362.
89 Nuckton TJ, Alonso JA, Kallet RH, et al. Pulmonary dead-space fraction as a risk factor for death in acute respiratory distress syndrome. N Engl J Med. 2002;346:1281-1286.
90 Arnold JH, Bower LK, Thompson JE. Respiratory deadspace measurements in neonates with congenital diaphragmatic hernia. Crit Care Med. 1995;23:371-375.
91 Dawson S, Cave C, Pavord I, et al. Transcutaneous monitoring of blood gases: is it comparable with arterialized earlobe sampling? Respir Med. 1998;92:584-587.
92 Franklin ML. Transcutaneous measurement of partial pressure of oxygen and carbon dioxide. Respir Care Clin North Am. 1995;1:119-131.
93 Herrejon A, Inchaurraga I, Palop J, et al. Usefulness of transcutaneous carbon dioxide pressure monitoring to measure blood gases in adults hospitalized for respiratory disease. Arch Bronconeumol. 2006;42:225-229.
94 Cuvelier A, Grigoriu B, Molano LC, et al. Limitations of transcutaneous carbon dioxide measurements for assessing long-term mechanical ventilation. Chest. 2005;127:1744-1748.
95 Rodriguez P, Lellouche F, Aboab J, et al. Transcutaneous arterial carbon dioxide pressuring monitoring in critically ill adult patients. Intensive Care Med. 2006;32:309-312.
96 Bendjelid K, Schutz N, Stotz M, et al. Transcutaneous PCO2 monitoring in critically ill adults: clinical evaluation of a new sensor. Crit Care Med. 2005;33:2203-2206.
97 Casati A, Squicciarini G, Malagutti G, et al. Transcutaneous monitoring of partial pressure of carbon dioxide in the elderly patient: a prospective, clinical comparison with end-tidal monitoring. J Clin Anesth. 2006;18:436-440.
98 Dullenkopf A, Bernardo SD, Berger F, et al. Evaluation of a new combined SpO2/PTcCO2 in anaesthetized pediatric patients. Paediatr Anaesth. 2003;13:777-784.
99 Tingay DG, Stewart MJ, Morley CJ. Monitoring of end-tidal carbon dioxide and transcutaneous carbon dioxide during neonatal transport. Arch Dis Child Fetal Neonatal Ed. 2005;90:F523-F526.
100 Nishiyama T, Nakamura S, Yamashita K. Effects of the electrode temperature of a new monitor, TCM4, on the measurement of transcutaneous oxygen and carbon dioxide tension. J Anesth. 2006;20:331-334.
101 Aliwalas LL, Nobel L, Nesbitt K, et al. Agreement of carbon dioxide levels measured by arterial, transcutaneous and end-tidal methods in preterm infants < or =28 weeks gestation. J Perinatol. 2005;25:26-29.
102 Eissa NT, Ranieri VM, Corbeil C, et al. Analysis of behavior of the respiratory system in ARDS patients: Effects of flow, volume and time. J Appl Physiol. 1991;70:2719-2729.
103 Nunn JF. Elastic resistance to ventilation. In Applied Respiratory Physiology, 2nd ed, London: Butterworth; 1977:63-93.
104 Brown DG, Pierson DJ. Auto-PEEP is common in mechanically ventilated patients: a study of incidence, severity, and detection. Respir Care. 1986;31:1069-1074.
105 Marini JJ. Lung mechanics determinations at the bedside: instrumentation and clinical application. Respir Care. 1990;35:669-696.
106 Bates JHT, Rossi A, Milic-Emili J. Analysis of the behavior of the respiratory system with constant inspiratory flow. J Appl Physiol. 1985;58:1840-1848.
107 Dubois AB. Resistance to breathing. In: Fenn WO, Rahn H, editors. Handbook of Physiology: Respiration, sec 3, vol 1. Washington, DC: American Physiological Society; 1964:451-462.
108 Don HF, Robson JC. The mechanics of the respiratory system during anesthesia: the effect of atropine and carbon dioxide. Anesthesiology. 1977;26:168-178.
109 Pelosi P, Cereda M, Foti G, et al. Alterations of lung and chest wall mechanics in patients with acute lung injury: Effects of positive end-expiratory pressure. Am J Respir Crit Care Med. 1995;152:531-537.
110 Ne to PPRAuler JOC. Respiratory mechanical properties during fentanyl and alfentanil anaesthesia. Can J Anaesth. 1992;39:458-465.
111 Broseghini C, Brandolese R, Poggi R, et al. Respiratory mechanics during the first day of mechanical ventilation in patients with pulmonary edema and chronic airway obstruction. Am Rev Respir Dis. 1988;138:355-361.
112 Rossi A, Gottfried SB, Zocchi L, et al. Measurement of static compliance of the total respiratory system in patients with acute respiratory failure: the effects of intrinsic positive end-expiratory pressure. Am Rev Respir Dis. 1985;131:672-677.
113 Pepe PE, Marini JJ. Occult positive end-expiratory pressure in mechanically ventilated patients with airflow obstruction. Am Rev Respir Dis. 1982;126:166-170.
114 Maltais F, Reissmann H, Navalesi P, et al. Comparison of static and dynamic measurements of intrinsic PEEP in mechanically ventilated patients. Am J Respir Crit Care Med. 1994;150:1318-1324.
115 Kacmarek RM, Kirmse M, Nishimura M, et al. The effects of applied vs auto-PEEP on local lung unit pressure and volume in a four-unit lung model. Chest. 1995;108:1073-1079.
116 Lemaire F, Simoneau G, Harf A, et al. Static pulmonary pressure-volume curve, positive end-expiratory pressure ventilation and gas exchange in acute respiratory failure [abstract]. Am Rev Respir Dis. 1979;119:329.
117 Gattinoni L, Pesenti A, Avalli L, et al. Pressure-volume curve of the total respiratory system in acute respiratory failure: a computed tomographic scan study. Am Rev Respir Dis. 1987;136:730-736.
118 Beydon L, Jonson B, Lemaire F. Lung mechanics in ARDS: compliance and the pressure-volume curves. In: Zapol WM, Lemaire F, editors. Adult Respiratory Distress Syndrome. New York: Marcel Dekker; 1991:139-161.
119 Matamis D, Lemaire F, Harf A, et al. Total respiratory pressure-volume curves in the adult respiratory distress syndrome. Chest. 1984;86:58-66.
120 O’Keefe GE, Gentilello LM, Erford S, Maier RV. Imprecision in lower “inflection point” estimation from static pressure-volume curves in patients at risk for acute respiratory distress syndrome. J Trauma Inj Infect Crit Care. 1998;44:1064-1068.
121 Maggiore SM, Brochard L. Pressure-volume curve in the critically ill. Curr Opin Crit Care. 2000;6:1-10.
122 Mergoni M, Martelli A, Volpi A, et al. Impact of positive end-expiratory pressure on chest wall and lung pressure-volume curve in acute respiratory failure. Am J Respir Crit Care Med. 1997;156:846-854.
123 Benito S, Lemaire F. Pulmonary pressure-volume relationship in acute respiratory distress syndrome in adults: Role of positive end expiratory pressure. J Crit Care. 1990;5:27-34.
124 Surratt PM, Owens DH, Kilgore WT, et al. A pulse method of measuring respiratory system compliance. J Appl Physiol. 1980;49:1116-1121.
125 Harris R. Pressure-volume curves of the respiratory system. Respir Care. 2005;50:78-98.
126 Roupie E, Dambrosio M, Servillo G, et al. Titration of tidal volume and induced hypercapnia in acute respiratory distress syndrome. Am J Respir Crit Care Med. 1995;152:121-128.
127 DiRocco J, Carney D, Nieman G. Correlation between alveolar recruitment/derecruitment and inflection points on the pressure-volume curve. Intensive Care Med. 2007;33:1204-1211.
128 Pontoppidan H, Geffin B, Lowenstein E. Acute respiratory failure in the adult (second of three parts). N Engl J Med. 1972;287:743-752.
129 Pierson DJ. Weaning from mechanical ventilation in acute respiratory failure: concepts, indications and techniques. Respir Care. 1983;28:646-662.
130 Tobin MJ. Breathing pattern analysis. Intensive Care Med. 1992;18:193-201.
131 Hall JB, Wood LDH. Liberation of the patient from mechanical ventilation. JAMA. 1987;257:1621-1628.
132 Gallagher CG, Hof IM, Younes M. Effect of inspiratory muscle fatigue on breathing pattern. J Appl Physiol. 1985;59:1152-1158.
133 Tobin MJ, Perez W, Guenther SM. The pattern of breathing during successful and unsuccessful trials of weaning from mechanical ventilation. Am Rev Respir Dis. 1986;134:1111-1118.
134 Vassilakopoulos T, Zakynthinos S, Roussos C. The tension-time index and the frequency/tidal volume ratio are the major pathophysiologic determinants of weaning failure and success. Am J Respir Crit Care Med. 1998;158:378-385.
135 Johannigman JA, Davis K, Campbell RS, et al. Use of the rapid/shallow breathing index as an indicator of patient work of breathing during pressure support ventilation. Surgery. 1997;122:737-740.
136 Yang KL, Tobin MJ. A prospective study of indexes predicting the outcome of trials of weaning from mechanical ventilation. N Engl J Med. 1991;324:1445-1450.
137 Epstein SK. Etiology of extubation failure and the predictive value of the rapid shallow breathing index. Am J Respir Crit Care Med. 1995;152:545-549.
138 Jacob B, Chatila W, Manthous CA. The unassisted respiratory rate/tidal volume ratio accurately predicts weaning outcome in postoperative patients. Crit Care Med. 1997;25:253-257.
139 Lee KH, Hui KP, Tan WC, Lim TK. Rapid shallow breathing (frequency-tidal volume ratio) did not predict extubation outcome. Chest. 1994;105:540-543.
140 Marini JJ. Monitoring during mechanical ventilation. Clin Chest Med. 1988;9:73-100.
141 Derenne J-P. P0.1—about the relevance of 100 milliseconds. Intensive Care Med. 1995;21:545-546.
142 Whitlaw WA, Derenne JP, Milic-Emili J. Occlusion pressure as a measure of respiratory center output in conscious man. Respir Physiol. 1975;23:181-199.
143 Fernandez R, Benito S, Sanchis J, et al. Inspiratory effort and occlusion pressure in triggered mechanical ventilation. Intensive Care Med. 1988;14:650-653.
144 Kuhlen R, Hausmann S, Pappert D, et al. A new method for P0.1 measurement using standard respiratory equipment. Intensive Care Med. 1995;21:554-560.
145 Kallet RH, Campbell AR, Alonso JA, et al. The effects of pressure control versus volume control assisted ventilation on patient work of breathing in acute lung injury and acute respiratory distress syndrome. Respir Care. 2000;45:1085-1096.
146 Iotti GA, Brunner JX, Braschi A, et al. Closed-loop control of airway occlusion pressure at 0.1 second (P0.1) applied to pressure-support ventilation: algorithm and application in intubated patients. Crit Care Med. 1996;24:771-779.
147 Scott GC, Burki NK. The relationship of resting ventilation to mouth occlusion pressure: an index of resting respiratory function. Chest. 1990;98:900-906.
148 Marini JJ, Rodriguez M, Lamb V. The inspiratory workload of patient-initiated mechanical ventilation. Am Rev Respir Dis. 1986;134:902-909.
149 Montgomery AB, Holle RHO, Neagley SR, et al. Prediction of successful ventilator weaning using airway occlusion pressure and hypercarbic challenge. Chest. 1987;91:496-499.
150 Cinella G, Conti G, Lofaso F, et al. Effects of assisted ventilation on the work of breathing: volume-controlled versus pressure-controlled ventilation. Am J Respir Crit Care Med. 1996;153:1025-1033.
151 Mancebo J, Albaladejo P, Touchard D, et al. Airway occlusion pressure to titrate positive end-expiratory pressure in patients with dynamic hyperinflation. Anesthesiology. 2000;93:81-90.
152 Alberti A, Gallo F, Fongaro A, et al. P0.1 is a useful parameter in setting the level of pressure support ventilation. Intensive Care Med. 1995;21:547-553.
153 Sassoon CSH, Te TT, Mahutte CK, Light RW. Airway occlusion pressure: an important indicator for successful weaning in patients with chronic obstructive pulmonary disease. Am Rev Respir Dis. 1987;135:107-113.
154 Fernandez R, Cabrera J, Calaf N, Benito S. P0.1/PImax: an index for assessing respiratory capacity in acute respiratory failure. Intensive Care Med. 1990;16:175-179.
155 Capdevila XJ, Perrigault PF, Perey PJ, et al. Occlusion pressure and its ratio to maximal inspiratory pressure are useful predictors for successful extubation following T-piece weaning trial. Chest. 1995;108:482-489.
