[level-membership-for-neurosurgery-category]
4 Assessment of Cerebrovascular Reactivity Using Emerging MR Technologies
Extracranial-intracranial (EC-IC) arterial bypass is a potential therapy for the prevention of ischemic stroke in patients with high internal carotid or middle cerebral artery (MCA) steno-occlusive disease. This procedure was popular until the EC-IC Bypass Study1 was published in 1985. This study of patients with ischemic symptoms and atherosclerotic stenosis or occlusion of the high internal carotid artery or MCA found no difference in stroke incidence between patients randomized to medical therapy versus surgical bypass. A critique of the EC-IC Bypass Study was that patients were included based on angiographic stenosis, without specifically selecting the subset of patients who had cerebral hemodynamic compromise. Subsequent advances in brain imaging have made it possible to better identify this subset.
The most widely studied imaging markers of cerebral hemodynamic compromise are increased oxygen extraction fraction (OEF) and decreased cerebrovascular reactivity (CVR). A major trial currently under way, the North American Carotid Occlusion Surgery Study (COSS),2 uses increased OEF on positron emission tomography (PET) to select patients for EC-IC bypass. PET measurement of OEF is accurate and the results of this trial are highly anticipated, yet clinical translation of PET OEF may remain a challenge due to limited availability, high cost, and the requirement for an on-site cyclotron to produce the very short-lived radiopharmaceutical oxygen-15 (half-life 2 minutes). This chapter will focus on CVR measurement using MRI.
Existing techniques for measuring CVR
Assessment of CVR requires a vasodilatory stimulus and a technique for measuring the resulting change in CBF. The commonly used vasodilatory stimuli used are intravenous administration of acetazolamide and induction of hypercapnia through breath holding or inhalation of carbon dioxide (CO2). Acetazolamide is widely available and administration does not require special equipment, but the technique does have limitations. After baseline CBF measurement and then acetazolamide injection, one must wait 10 to 15 minutes for peak change in CBF before imaging again. Differences in pharmacokinetics and pharmacodynamics between sessions for a given patient, and among patients, result in unmeasured variation in magnitude of the vasodilatory stimulus. Induction of hypercapnia through breath holding suffers from a constantly changing blood CO2 level and it is therefore extremely difficult to quantify the magnitude of vasodilatory stimulus. Our preferred technique uses a re-breathing device called the RespirAct™ developed by one of our collaborators. This device is capable of controlling end-tidal CO2 and O2 precisely and independently with transitions between a stable baseline state and stable hypercapnic state occurring within three breaths.3 End-tidal PCO2 measured with this device is as accurate a measurement of arterial PCO2 as actual arterial blood sampling.4
Techniques for measuring the acetazolamide or hypercapnia-induced changes in CBF have traditionally included transcranial Doppler ultrasound (TCD), single-photon emission tomography (SPECT), and stable-xenon inhalation computed tomography (Xe-CT). TCD is inexpensive, noninvasive, and free of ionizing radiation. However, the technique yields only a single measurement of CVR for each MCA territory rather than a spatial map of reactivity for the brain, it is technically not feasible in about 10% of patients due to lack of an acoustic window, and it is highly operator dependent. SPECT has had relatively widespread use for mapping CVR. A major limitation of SPECT is that the study is typically performed over 2 days due to radiopharmaceutical kinetics. It is possible to perform the study over a single day, but this requires much higher activity for the second scan, increasing the radiation dose to the patient.5 Xe-CT is an excellent imaging technique, but it not widely available and inhalation of stable xenon can have undesirable side effects.
Clinical significance of impaired CVR
CVR is typically categorized into three patterns: normal, reduced, and paradoxical (negative). The paradoxical pattern refers to vasodilatory stimulus–induced reduction of CBF. This “steal phenomenon”6 develops because flow is diverted away from tissue that can no longer vasodilate toward tissues that retain this ability. Blood simply follows the path of least resistance. Consider a patient with severe stenosis of the right middle cerebral artery (MCA), and a normal right internal carotid artery (ICA) and right anterior cerebral artery (ACA). A vasodilatory stimulus will result in dilatation of the arterial vessels of the right ACA territory, and a corresponding decrease in vascular resistance in this territory. The right MCA territory arterial vessels are already maximally dilated at rest, and will not dilate any further. Following application of a vasodilatory stimulus, the decrease in vascular resistance in the ACA territory relative to the MCA territory results in redistribution of blood flow from the MCA to the ACA. In this way, the ACA territory “steals” from the MCA territory. Reduced CVR indicates impairment of cerebral hemodynamics, and paradoxical CVR indicates particularly severe impairment.7,8
CVR Impairment is a strong and independent predictor of future ischemic events. Ogasawara et al.9 studied 70 patients with symptomatic unilateral ICA or MCA occlusion. Patients were categorized as having normal versus impaired CVR using acetazolamide and Xe-133 SPECT, and were followed prospectively for 2 years. The recurrent stroke rate was 6% in patients with normal CVR at entry, compared with 35% in patients with impaired CVR (significant difference, p = 0.03). Silvestrini et al.10 studied 94 patients with asymptomatic carotid artery stenosis of at least 70%. Patients were categorized as having normal versus impaired CVR using CO2 and TCD, and were followed prospectively for a median of 2.4 years. The annual rate of ipsilateral ischemic events was 4% in patients with normal CVR at entry, compared with 14% in patients with impaired CVR. Markus et al.11 studied 107 patients with symptomatic carotid artery stenosis or carotid occlusion. Patients were categorized as having normal versus impaired CVR using CO2 and TCD, and were prospectively followed for a mean of 4.4 years. Controlling for patient demographics, vascular risk factors, prior infarct, and degree of stenosis, impaired reactivity was an independent predictor of ipsilateral TIA or stroke (odds ratio 14.4, 95% CI 2.63–78.74, p = 0.002). From these studies, and others with similar results,12,13 it is well known that CVR can identify a subgroup of steno-occlusive disease patients at higher risk of stroke. The Japanese Extracranial to Intracranial Bypass Trial (JET),14 is an ongoing surgical study using acetazolamide SPECT CVR and acetazolamide Xe-CT CVR to identify this high-risk subgroup.
Other important uses of CVR in the context of EC-IC bypass are follow-up of those patients who do not initially meet criteria for bypass, and long-term follow-up of patients who do undergo bypass. A recent acetazolamide SPECT CVR study15 of 77 patients with Moyamoya disease demonstrated that CVR performed 6 to 12 months following bypass is a strong predictor of long-term post-operative clinical course.
Emerging MR techniques for measuring CVR
I BOLD CO2 MR Measurement of CVR
Blood oxygen level–dependent (BOLD) MRI refers to a MRI acquisition that is sensitive to the concentration of deoxyhemoglobin in blood. Arterial blood is normally 95% to 100% saturated with oxygen, and venous blood is approximately 60% to 70% saturated. An increase in CBF during stable neuronal activity (i.e., a stable number of deoxyhemoglobin molecules produced per unit time) results in dilution or “wash-out” of deoxyhemoglobin in the cerebral microcirculation. Deoxyhemoglobin is a paramagnetic substance. Paramagnetic substances constrained by boundaries such as red cell membranes or blood vessel walls yield magnetic field inhomogeneities that act to reduce the MRI signal. Therefore, an increase in CBF in the setting of constant neural activity results in a decrease in deoxyhemoglobin concentration in the microcirculation, yielding an increase in MR signal. Furthermore, % BOLD MRI signal is linearly related to %
 CBF over the range of CBF changes that occur in a CVR study,16 enabling the use BOLD MRI to measure CVR.
The greatest concern with BOLD CVR has been that BOLD MRI signal depends on CBF, but also (and to an unknown extent) on other factors: cerebral blood volume (CBV), cerebral metabolic rate of oxygen consumption (CMRO2), arterial partial pressure of oxygen (PaO2), and hematocrit. However, we now have empirical evidence that these other factors are not major issues. Goode et al.17 and Kassner et al.18 have demonstrated between-session reproducibility of BOLD CO2 CVR, and Shiino et al.19 and our group20 have demonstrated the accuracy of BOLD CO2 CVR in patients with severe cerebrovascular disease. Shiino et al. compared BOLD CO2 CVR with SPECT acetazolamide CVR in 10 patients with severe carotid stenosis or occlusion. They found that the degree of impairment and distribution of impaired areas detected by BOLD MRI correlated with the results of SPECT. Our group studied 38 patients with steno-occlusive disease by both BOLD CO2 CVR and arterial spin labeling (ASL) MRI. The latter technique does not have the CBV and CMRO2 dependencies of BOLD MRI. Hemispheric CVR measured by BOLD MRI was significantly correlated with that measured by ASL MRI for both gray matter (r = 0.83, p < 0.0001) and white matter (r = 0.80, p < 0.0001). Diagnostic accuracy (area under receiver operating characteristic curve) for BOLD MRI discrimination between normal and abnormal hemispheric CVR was 0.90 (95% CI = 0.81 to 0.98; p < 0.001) for gray matter and 0.82 (95% CI = 0.70 to 0.94; P<0.001) for white matter. Regions of paradoxical CVR on BOLD MRI had a moderate predictive value (14 of 19 hemispheres) for spatially corresponding paradoxical CVR on ASL MRI. Complete absence of paradoxical CVR on BOLD MRI had a high predictive value (31 of 31 hemispheres) for corresponding nonparadoxical CVR on ASL MRI.
The BOLD CO2 CVR examination
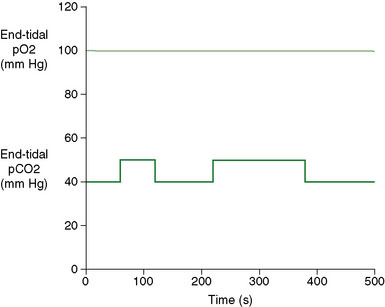
Vasodilatory Stimulus: Patients’ expiratory gas concentrations are controlled by providing a series of gas flows with variable CO2, O2, and N2 concentrations to a sequential re-breathing manifold21 (Thornhill Research Inc., Toronto, Canada) attached to the facemask. Gas flows to the manifold are controlled by a computer-controlled gas blender (RespirAct™, Thornhill Research, Toronto, Canada) programmed to provide the flow and proportion of O2, N2, and CO2 needed to attain the target end-tidal partial pressures of CO2 (PetCO2) and O2 (PetO2). Our target gas sequence is 8 minutes and 20 seconds in duration, with target PetO2 of 100 mm Hg throughout, and target PetCO2 alternating between normocapnia (40 mm Hg) and hypercapnia (50 mm Hg) (Figure 4–1). Tidal pCO2 and pO2 are monitored continuously (RespirAct™), digitized, and recorded using data acquisition software (LabView, National Instruments Corporation, Austin, TX). The apparatus and technique are described in greater detail elsewhere.3,4
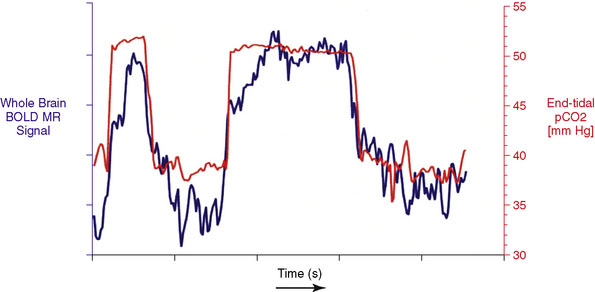
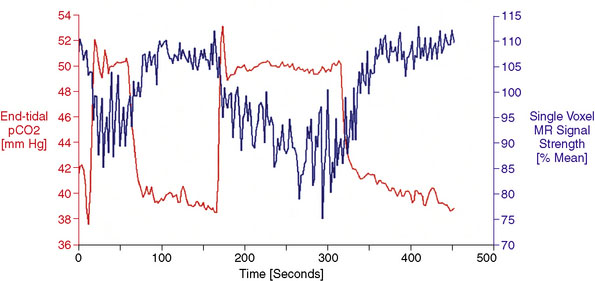
Data Processing: MRI and PetCO2 data are imported into AFNI,22 a functional neuroimaging software package available for download at http://afni.nimh.nih.gov/afni/. Total MR signal is calculated for each whole-brain acquisition (i.e., for every set of images covering the entire brain), yielding a whole-brain BOLD MR signal waveform of 500 seconds duration. This whole-brain BOLD MR signal waveform is temporally shifted to the point of maximum statistical correlation with the PetCO2 waveform (output from the RespirAct). Figure 4–2 shows PetCO2 (in red) and whole-brain BOLD MR signal (in blue) as a function of time for a normal subject. Note how each increase in PetCO2 is accompanied by a corresponding increase in BOLD MR signal.
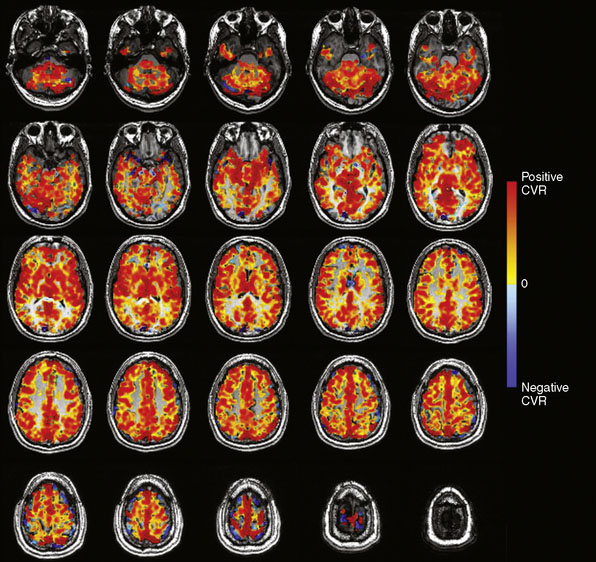
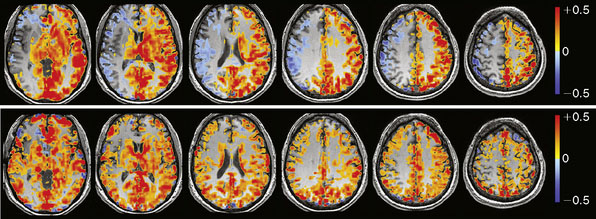
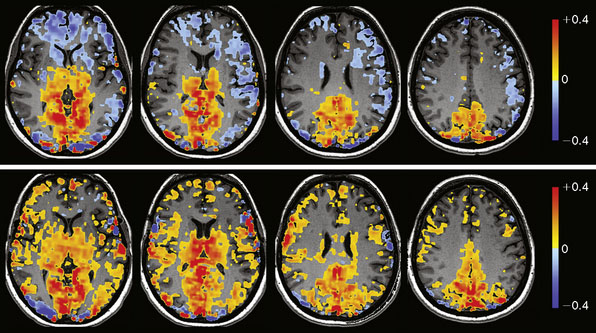
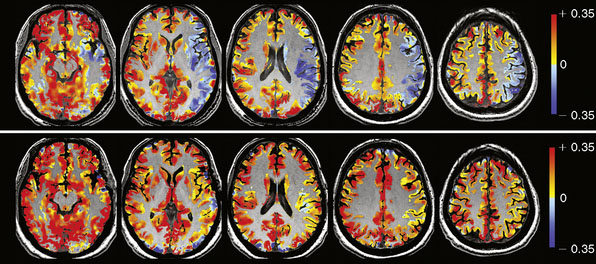
The BOLD MRI signal time course is then regressed (least squares) against the PetCO2 waveform on a voxel-by-voxel basis. The slope of the regression, expressed as %ΔBOLD MR signal per mm Hg ΔPetCO2, is CVR. The CVR map is color-coded using a two-color continuous spectrum ranging from red for positive CVR to blue for negative CVR, and then overlaid voxel by voxel on the anatomical images (Figure 4–3).
BOLD MR measurement of CVR in the EC-IC bypass population
In addition to patient factors (CBV, CMRO2, pO2, hematocrit) discussed earlier, BOLD MR signal depends on both MR hardware (most notably magnetic field strength) and MR pulse sequence specifics (sequence type, echo time, voxel size, etc.). When performing CVR studies using one MR scanner with consistent sequence parameters, CVR measured as %ΔBOLD MR signal per mm Hg ΔPetCO2 is highly reproducible. This does not provide a measure of CVR in the gold-standard CBF units of ml/100 g/min, but it does enable quantitative comparisons within individual patients over time, and among patients. The ability to quantitatively compare BOLD CO2 CVR values across institutes using different MR scanners and MR sequences will require further development, but interinstitute reproducibility studies23,24 of myocardial T2⁎ measurements suggest that this is feasible.
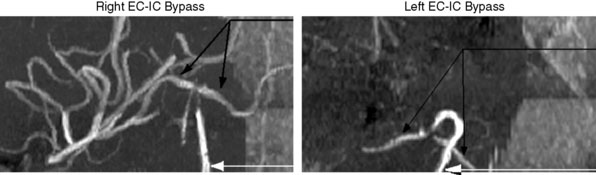
We are currently studying the ability of preoperative CVR to predict the degree of hemodynamic improvement post-bypass. To date we have studied 16 consecutive patients with arterial steno-occlusive disease undergoing EC-IC bypass surgery. Preliminary results25 show that ipsilateral MCA territory BOLD CO2 CVR (%ΔBOLD MR signal per mm Hg ΔPetCO2) improves significantly following revascularization (0.07% ± 0.08% prebypass to 0.24% ± 0.07% postbypass [two-sided p < 0.01]). Greater impairment of CVR preoperatively correlates with greater improvement in that territory following bypass (r = 0.73, p < 0.01). Figure 4–10 illustrates a case from this series.
II DSC MR Measurement of CVR
A T2⁎-weighted echo-planar MR pulse sequence (which is sensitive to the susceptibility effects of gadolinium) is used to repeatedly image the whole brain every 1 to 2 seconds. This records the baseline signal intensity of each voxel prior to the gadolinium bolus. After several whole-brain acquisitions, a tight bolus of intravenous contrast is infused using a power injection of gadolinium chelate at 5 ml/s through an 18-gauge intravenous catheter in the antecubital fossa. Brain imaging continues during and after contrast injection, for a total of 90 seconds, capturing the first pass of gadolinium through the microcirculation. It has been shown that the signal change in a voxel is directly related to the amount of gadolinium in that voxel,26 and thus the signal-time curve for each voxel is converted into a tissue concentration–time curve. Calculation of CBF requires one additional parameter: an arterial input function (AIF). The AIF describes the concentration-time curve of the contrast bolus on the arterial side, before it passes through the tissue (capillaries). There are a variety of methods for determining the AIF, but most often it is measured as the concentration-time curve for a single region of interest drawn near a major artery supplying the brain. CBF is then calculated based on indicator-dilution theory for a nondiffusible tracer. There are commercial software packages that perform this postprocessing, generating maps of perfusion including relative blood flow, blood volume, and transit time. The extension of DSC MRI perfusion to DSC MRI CVR simply involves performing DSC MRI before and after a vasodilatory stimulus, and then calculating the percent change in CBF per unit vasodilatory stimulus on a voxel-by-voxel basis.
There is a wealth of literature on DSC for measuring perfusion, but only a few reports of DSC CVR. Schreiber et al.27 studied 13 normal subjects and eight patients with steno-occlusive disease using DSC acetazolamide CVR and found reduced CVR in disease patients compared with normals. Similarly, Guckel et al.28 studied 21 symptomatic patients with occlusive cerebrovascular disease using DSC acetazolamide CVR, and demonstrated significantly reduced CVR in the affected hemisphere compared with the contralateral side. Ma et al.29 studied 12 patients with symptomatic unilateral ICA occlusion using DSC acetazolamide CVR and Tc-99m ECD SPECT acetazolamide CVR in each patient. Statistical conclusions were limited given the small sample size: seven of nine patients with impaired CVR on SPECT had impaired CVR on DSC MRI, and two of three patients with normal CVR on SPECT had normal CVR on DSC.
1 The EC/IC Bypass Study Group. Failure of extracranial-intracranial arterial bypass to reduce the risk of ischemic stroke. Results of an international randomized trial. N Engl J Med. 1985;313:1191-1200.
2 Grubb R.L.Jr, Powers W.J., Derdeyn C.P., et al. The Carotid Occlusion Surgery Study. Neurosurg Focus. 2003;14:e9.
3 Slessarev M., Prisman E., Han J., et al. Prospective targeting and control of end-tidal CO2 and O2 concentrations. J Physiol. 2007;581(Pt3):1207-1219.
4 Ito S., Mardimae A., Han J., et al. Non-invasive prospective targeting of arterial P(CO2) in subjects at rest. J Physiol. 2008;586(Pt 15):3675-3682.
5 Vagal A.S., Leach J.L., Fernandez-Ulloa M., et al. The acetazolamide challenge: techniques and applications in the evaluation of chronic cerebral ischemia. AJNR Am J Neuroradiol. 2009;30(5):876-884.
6 Nariai T., Senda M., Ishii K., et al. Posthyperventilatory steal response in chronic cerebral hemodynamic stress: a positron emission tomography study. Stroke. 1998;29(7):1281-1292.
7 Webster M.W., Makaroun M.S., Steed D.L., et al. Compromised cerebral blood flow reactivity is a predictor of stroke in patients with symptomatic carotid artery occlusive disease. J Vasc Surg. 1995;21(2):338-344. discussion 44–45
8 Yonas H., Smith H.A., Durham S.R., et al. Increased stroke risk predicted by compromised cerebral blood flow reactivity. J Neurosurg. 1993;79(4):483-489.
9 Ogasawara K., Ogawa A., Yoshimoto T. Cerebrovascular reactivity to acetazolamide and outcome in patients with symptomatic internal carotid or middle cerebral artery occlusion: a xenon-133 single-photon emission computed tomography study. Stroke. 2002;33(7):1857-1862.
10 Silvestrini M., Vernieri F., Pasqualetti P., et al. Impaired cerebral vasoreactivity and risk of stroke in patients with asymptomatic carotid artery stenosis [see comment]. JAMA. 2000;283(16):2122-2127.
11 Markus H., Cullinane M. Severely impaired cerebrovascular reactivity predicts stroke and TIA risk in patients with carotid artery stenosis and occlusion. Brain. 2001;124(Pt 3):457-467.
12 Kleiser B., Widder B., Kleiser B., et al. Course of carotid artery occlusions with impaired cerebrovascular reactivity. Stroke. 1992;23(2):171-174.
13 Blaser T., Hofmann K., Buerger T., et al. Risk of stroke, transient ischemic attack, and vessel occlusion before endarterectomy in patients with symptomatic severe carotid stenosis. Stroke. 2002;33(4):1057-1062.
14 Hayden M.G., Lee M., Guzman R., et al. The evolution of cerebral revascularization surgery. Neurosurg Focus. 2009;26(5):E17.
15 So Y., Lee H.-Y., Kim S.-K., et al. Prediction of the clinical outcome of pediatric moyamoya disease with postoperative basal/acetazolamide stress brain perfusion SPECT after revascularization surgery. Stroke. 2005;36(7):1485-1489.
16 Hoge R.D., Atkinson J., Gill B., et al. Investigation of BOLD signal dependence on cerebral blood flow and oxygen consumption: the deoxyhemoglobin dilution model. Magn Reson Med. 1999;42(5):849-863.
17 Goode S.D., Krishan S., Alexakis C., et al. Precision of cerebrovascular reactivity assessment with use of different quantification methods for hypercapnia functional MR imaging. AJNR Am J Neuroradiol. 2009;30(5):972-977.
18 Kassner A., Winter J.D., Poublanc J., et al. Blood-oxygen level dependent MRI measures of cerebrovascular reactivity using a controlled respiratory challenge: reproducibility and gender differences. J Magn Reson Imaging. 2010;31(2):298-304.
19 Shiino A., Morita Y., Tsuji A., et al. Estimation of cerebral perfusion reserve by blood oxygenation level-dependent imaging: comparison with single-photon emission computed tomography. J Cereb Blood Flow Metab. 2003;23(1):121-135.
20 Mandell D.M., Han J.S., Poublanc J., et al. Mapping cerebrovascular reactivity using blood oxygen level–dependent MRI in patients with arterial steno-occlusive disease: comparison with arterial spin labeling MRI. Stroke. 2008;39(7):2021-2028.
21 Somogyi R.B., Vesely A.E., Preiss D., et al. Precise control of end-tidal carbon dioxide levels using sequential rebreathing circuits. Anaesth Intensive Care. 2005;33(6):726-732.
22 Cox R.W., AFNI. Software for analysis and visualization of functional magnetic resonance neuroimages. Comput Biomed Res. 1996;29:162-173.
23 Westwood M.A., Firmin D.N., Gildo M., et al. Intercentre reproducibility of magnetic resonance T2⁎ measurements of myocardial iron in thalassaemia. Int J Cardiovasc Imaging. 2005;21(5):531-538.
24 Westwood M.A., Anderson L.J., Firmin D.N., et al. Interscanner reproducibility of cardiovascular magnetic resonance T2⁎ measurements of tissue iron in thalassemia. J Magn Reson Imaging. 2003;18(5):616-620.
25 Mandell D.M., Han J.S., Poublanc J., et al. Absolute measurement of cerebrovascular reactivity on BOLD MRI predicts response to surgical revascularization. Abstract in press. Proc American Society of Neuroradiology. 2010.
26 Rosen B.R., Belliveau J.W., Vevea J.M., et al. Perfusion imaging with NMR contrast agents. Magn Reson Med. 1990;14(2):249-265.
27 Schreiber W.G., Guckel F., Stritzke P., et al. Cerebral blood flow and cerebrovascular reserve capacity: estimation by dynamic magnetic resonance imaging. J Cereb Blood Flow Metab. 1998;18(10):1143-1156.
28 Guckel F.J., Brix G., Schmiedek P., et al. Cerebrovascular reserve capacity in patients with occlusive cerebrovascular disease: assessment with dynamic susceptibility contrast-enhanced MR imaging and the acetazolamide stimulation test. Radiology. 1996;201(2):405-412.
29 Ma J., Mehrkens J.H., Holtmannspoetter M., et al. Perfusion MRI before and after acetazolamide administration for assessment of cerebrovascular reserve capacity in patients with symptomatic internal carotid artery (ICA) occlusion: comparison with 99mTc-ECD SPECT. Neuroradiology. 2007;49(4):317-326.
30 Wray D.W., Nishiyama S.K., Monnet A., et al. Antioxidants and aging: NMR-based evidence of improved skeletal muscle perfusion and energetics. Am J Physiol Heart Circ Physiol. 2009;297(5):H1870-H1885.
31 Arbab A.S., Aoki S., Toyama K., et al. Quantitative measurement of regional CBF with flow-sensitive alternating inversion recovery imaging: comparison with [iodine 123]-iodoamphetamin single photon emission CT. AJNR Am J Neuroradiol. 2002;23(3):381-388.
[/level-membership-for-neurosurgery-category][not-level-membership-for-neurosurgery-category]
4 Assessment of Cerebrovascular Reactivity Using Emerging MR Technologies
Extracranial-intracranial (EC-IC) arterial bypass is a potential therapy for the prevention of ischemic stroke in patients with high internal carotid or middle cerebral artery (MCA) steno-occlusive disease. This procedure was popular until the EC-IC Bypass Study1 was published in 1985. This study of patients with ischemic symptoms and atherosclerotic stenosis or occlusion of the high internal carotid artery or MCA found no difference in stroke incidence between patients randomized to medical therapy versus surgical bypass. A critique of the EC-IC Bypass Study was that patients were included based on angiographic stenosis, without specifically selecting the subset of patients who had cerebral hemodynamic compromise. Subsequent advances in brain imaging have made it possible to better identify this subset.
The most widely studied imaging markers of cerebral hemodynamic compromise are increased oxygen extraction fraction (OEF) and decreased cerebrovascular reactivity (CVR). A major trial currently under way, the North American Carotid Occlusion Surgery Study (COSS),2 uses increased OEF on positron emission tomography (PET) to select patients for EC-IC bypass. PET measurement of OEF is accurate and the results of this trial are highly anticipated, yet clinical translation of PET OEF may remain a challenge due to limited availability, high cost, and the requirement for an on-site cyclotron to produce the very short-lived radiopharmaceutical oxygen-15 (half-life 2 minutes). This chapter will focus on CVR measurement using MRI.
Existing techniques for measuring CVR
Assessment of CVR requires a vasodilatory stimulus and a technique for measuring the resulting change in CBF. The commonly used vasodilatory stimuli used are intravenous administration of acetazolamide and induction of hypercapnia through breath holding or inhalation of carbon dioxide (CO2). Acetazolamide is widely available and administration does not require special equipment, but the technique does have limitations. After baseline CBF measurement and then acetazolamide injection, one must wait 10 to 15 minutes for peak change in CBF before imaging again. Differences in pharmacokinetics and pharmacodynamics between sessions for a given patient, and among patients, result in unmeasured variation in magnitude of the vasodilatory stimulus. Induction of hypercapnia through breath holding suffers from a constantly changing blood CO2 level and it is therefore extremely difficult to quantify the magnitude of vasodilatory stimulus. Our preferred technique uses a re-breathing device called the RespirAct™ developed by one of our collaborators. This device is capable of controlling end-tidal CO2 and O2 precisely and independently with transitions between a stable baseline state and stable hypercapnic state occurring within three breaths.3 End-tidal PCO2 measured with this device is as accurate a measurement of arterial PCO2 as actual arterial blood sampling.4
Techniques for measuring the acetazolamide or hypercapnia-induced changes in CBF have traditionally included transcranial Doppler ultrasound (TCD), single-photon emission tomography (SPECT), and stable-xenon inhalation computed tomography (Xe-CT). TCD is inexpensive, noninvasive, and free of ionizing radiation. However, the technique yields only a single measurement of CVR for each MCA territory rather than a spatial map of reactivity for the brain, it is technically not feasible in about 10% of patients due to lack of an acoustic window, and it is highly operator dependent. SPECT has had relatively widespread use for mapping CVR. A major limitation of SPECT is that the study is typically performed over 2 days due to radiopharmaceutical kinetics. It is possible to perform the study over a single day, but this requires much higher activity for the second scan, increasing the radiation dose to the patient.5 Xe-CT is an excellent imaging technique, but it not widely available and inhalation of stable xenon can have undesirable side effects.
Clinical significance of impaired CVR
CVR is typically categorized into three patterns: normal, reduced, and paradoxical (negative). The paradoxical pattern refers to vasodilatory stimulus–induced reduction of CBF. This “steal phenomenon”6 develops because flow is diverted away from tissue that can no longer vasodilate toward tissues that retain this ability. Blood simply follows the path of least resistance. Consider a patient with severe stenosis of the right middle cerebral artery (MCA), and a normal right internal carotid artery (ICA) and right anterior cerebral artery (ACA). A vasodilatory stimulus will result in dilatation of the arterial vessels of the right ACA territory, and a corresponding decrease in vascular resistance in this territory. The right MCA territory arterial vessels are already maximally dilated at rest, and will not dilate any further. Following application of a vasodilatory stimulus, the decrease in vascular resistance in the ACA territory relative to the MCA territory results in redistribution of blood flow from the MCA to the ACA. In this way, the ACA territory “steals” from the MCA territory. Reduced CVR indicates impairment of cerebral hemodynamics, and paradoxical CVR indicates particularly severe impairment.7,8
CVR Impairment is a strong and independent predictor of future ischemic events. Ogasawara et al.9 studied 70 patients with symptomatic unilateral ICA or MCA occlusion. Patients were categorized as having normal versus impaired CVR using acetazolamide and Xe-133 SPECT, and were followed prospectively for 2 years. The recurrent stroke rate was 6% in patients with normal CVR at entry, compared with 35% in patients with impaired CVR (significant difference, p = 0.03). Silvestrini et al.10 studied 94 patients with asymptomatic carotid artery stenosis of at least 70%. Patients were categorized as having normal versus impaired CVR using CO2 and TCD, and were followed prospectively for a median of 2.4 years. The annual rate of ipsilateral ischemic events was 4% in patients with normal CVR at entry, compared with 14% in patients with impaired CVR. Markus et al.11 studied 107 patients with symptomatic carotid artery stenosis or carotid occlusion. Patients were categorized as having normal versus impaired CVR using CO2 and TCD, and were prospectively followed for a mean of 4.4 years. Controlling for patient demographics, vascular risk factors, prior infarct, and degree of stenosis, impaired reactivity was an independent predictor of ipsilateral TIA or stroke (odds ratio 14.4, 95% CI 2.63–78.74, p = 0.002). From these studies, and others with similar results,12,13 it is well known that CVR can identify a subgroup of steno-occlusive disease patients at higher risk of stroke. The Japanese Extracranial to Intracranial Bypass Trial (JET),14 is an ongoing surgical study using acetazolamide SPECT CVR and acetazolamide Xe-CT CVR to identify this high-risk subgroup.
Other important uses of CVR in the context of EC-IC bypass are follow-up of those patients who do not initially meet criteria for bypass, and long-term follow-up of patients who do undergo bypass. A recent acetazolamide SPECT CVR study15 of 77 patients with Moyamoya disease demonstrated that CVR performed 6 to 12 months following bypass is a strong predictor of long-term post-operative clinical course.
Emerging MR techniques for measuring CVR
I BOLD CO2 MR Measurement of CVR
Blood oxygen level–dependent (BOLD) MRI refers to a MRI acquisition that is sensitive to the concentration of deoxyhemoglobin in blood. Arterial blood is normally 95% to 100% saturated with oxygen, and venous blood is approximately 60% to 70% saturated. An increase in CBF during stable neuronal activity (i.e., a stable number of deoxyhemoglobin molecules produced per unit time) results in dilution or “wash-out” of deoxyhemoglobin in the cerebral microcirculation. Deoxyhemoglobin is a paramagnetic substance. Paramagnetic substances constrained by boundaries such as red cell membranes or blood vessel walls yield magnetic field inhomogeneities that act to reduce the MRI signal. Therefore, an increase in CBF in the setting of constant neural activity results in a decrease in deoxyhemoglobin concentration in the microcirculation, yielding an increase in MR signal. Furthermore, % BOLD MRI signal is linearly related to % CBF over the range of CBF changes that occur in a CVR study,16 enabling the use BOLD MRI to measure CVR.
The greatest concern with BOLD CVR has been that BOLD MRI signal depends on CBF, but also (and to an unknown extent) on other factors: cerebral blood volume (CBV), cerebral metabolic rate of oxygen consumption (CMRO2), arterial partial pressure of oxygen (PaO2), and hematocrit. However, we now have empirical evidence that these other factors are not major issues. Goode et al.17 and Kassner et al.18 have demonstrated between-session reproducibility of BOLD CO2 CVR, and Shiino et al.19 and our group20 have demonstrated the accuracy of BOLD CO2 CVR in patients with severe cerebrovascular disease. Shiino et al. compared BOLD CO2 CVR with SPECT acetazolamide CVR in 10 patients with severe carotid stenosis or occlusion. They found that the degree of impairment and distribution of impaired areas detected by BOLD MRI correlated with the results of SPECT. Our group studied 38 patients with steno-occlusive disease by both BOLD CO2 CVR and arterial spin labeling (ASL) MRI. The latter technique does not have the CBV and CMRO2 dependencies of BOLD MRI. Hemispheric CVR measured by BOLD MRI was significantly correlated with that measured by ASL MRI for both gray matter (r = 0.83, p < 0.0001) and white matter (r = 0.80, p < 0.0001). Diagnostic accuracy (area under receiver operating characteristic curve) for BOLD MRI discrimination between normal and abnormal hemispheric CVR was 0.90 (95% CI = 0.81 to 0.98; p < 0.001) for gray matter and 0.82 (95% CI = 0.70 to 0.94; P
[/not-level-membership-for-neurosurgery-category]
