Advanced Imaging Technologies
Introduction – retinal imaging to date
Assessment of chorioretinal disease is dependent on the ability to visualize pathologic changes occurring in the posterior segment of the eye using optical instruments, termed ophthalmoscopy (Fig. 5.1A).1 Ophthalmoscopy, in turn, has been greatly enhanced by the development of techniques that allow recording of these changes.2 By the end of the 19th century the first images of the living human retina had been obtained (Fig. 5.1B) and, by the 1950s, with the advent of electronic flashes and 35-mm cameras, the field of modern retinal/fundal imaging had been born.3
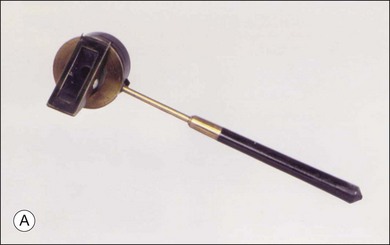
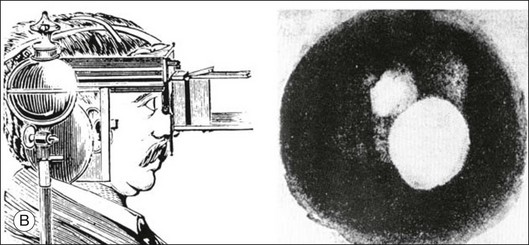
Fig. 5.1 Early attempts at retinal visualization and image capture. (A) Early model of the Helmholtz ophthalmoscope, 1851. (Alcon Laboratories Museum of Ophthalmology, The Sherman Collection, Fort Worth, TX, USA. Historical image: Helmholtz ophthalmoscope, 1851. Ophthalmology 2002;109:729. Reproduced with permission.) (B) The first published human fundus photograph involved this apparatus, an albocarbon burner, and a  -minute exposure. Blood vessels cannot be defined, but the optic disc can be seen as a white area superiorly, while inferiorly, the larger light area is an artifact. (Reproduced with permission from Same PJ. Landmarks in the historical development of fluorescein angiography. J Ophthalm Photography 1993;15:18.)
As well as documenting pathology, fundal imaging facilitates the identification of morphologic features not visible to the clinician on biomicroscopy. For example, from an early stage in its development, fundus photography has incorporated angiographic methodologies for the visualization of blood vessels.1,4 In the 1960s, the assessment of retinal disease was revolutionized by the introduction of fluorescein angiography (Fig. 5.2A). In the 1970s, evaluation of the choroidal circulation was also improved through the use of indocyanine green dye. The development of these angiographic techniques has also led, at least in part, to the discovery that certain fundal structures fluoresce in the absence of contrast. The subsequent evolution of fundus autofluorescence imaging has greatly extended our ability to evaluate retinal degenerative and other disorders.2
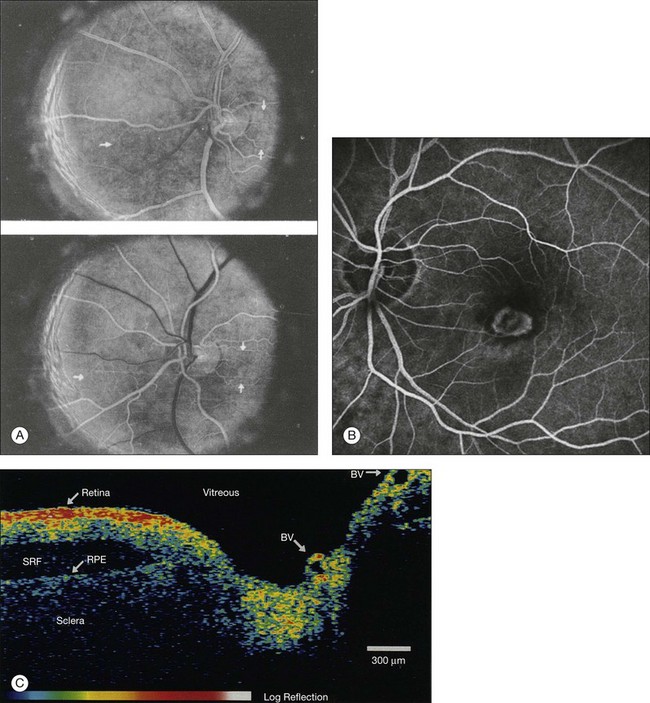
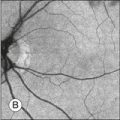
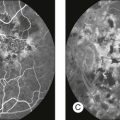
Fig. 5.2 Fluorescein angiography, scanning laser ophthalmoscopy, and optical coherence tomography (OCT). (A) Early attempt at fundus fluorescein angiography in a normal subject. (Reproduced with permission from Novotny HR, Alvis DL. A method of photographing fluorescence in circulating blood in the human retina. Circulation 1961;24:82–6.) (B) A single frame from a fluorescein angiogram taken with a confocal scanning laser ophthalmoscope (cSLO) showing a choroidal neovascular membrane. (Reproduced with permission from Bennett PJ, Barry CJ. Ophthalmic imaging today: an ophthalmic photographer’s viewpoint – a review. Clin Exp Ophthalmol 2009;37:2–13.) (C) Early attempt at OCT imaging of the human retina and optic nerve, obtained in vitro. SRF, subretinal fluid; RPE, retinal pigment epithelium; BV, blood vessel. (Reproduced with permission from Huang D, Swanson EA, Lin CP, et al. Optical coherence tomography. Science 1991;254:1178–81.)
Since the 1990s, fundus photographic systems have also made the transition from “analogue” image capture using film to digital image capture using charge-coupled devices (CCDs), allowing for improved image processing and analysis.2 In parallel with this, new image capture technologies have emerged such as scanning laser ophthalmoscopy (SLO) and optical coherence tomography (OCT) (Fig. 5.2B, C). In particular, the widespread adoption of OCT in recent years has greatly extended our knowledge of chorioretinal disease pathophysiology, and has proven important for the provision of new pharmacotherapeutics.1
Adaptive optics – imaging of single cells in the retina
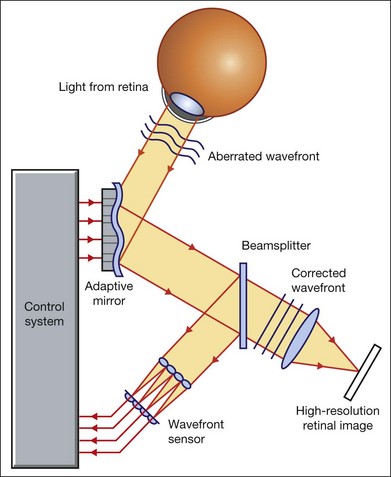
Our ability to obtain high-resolution images of the human retina is limited by the presence of defects, or aberrations, in the optical system of the eye (i.e., the cornea and lens).5 In addition to exhibiting lower-order monochromatic aberrations such as defocus and astigmatism, normal eyes also exhibit higher-order monochromatic aberrations such as coma, trefoil, and spherical aberration. The combined effects of these aberrations limit the quality of images obtainable for the diagnosis and management of retinal disease. Until the early 1990s, there existed no effective way to obtain rapid, precise measurements of the human eye’s optical aberrations. However, wavefront sensors based on the Hartmann–Shack principle, originally developed for astronomical purposes, have now been adapted for use in the human eye. These sensors consist of an array of lenses, each having the same focal length, which can be used to approximate the whole wavelength of incident light. Once measured, the detected aberrations can then be corrected (i.e., rendered flat) using one or more deformable mirrors: the mirrors have large numbers of small electronically controlled actuators on their rear surface that can push and pull the mirror within a range of ±2 µm, allowing it to adopt any desired configuration (Fig. 5.3). By incorporating wavefront sensing and correction into existing optical imaging platforms – “adaptive optics” – it is now possible to acquire images of the retina with cellular-level resolution, and in a noninvasive fashion.5,6
Technology
The adaptive optics devices first developed for ophthalmic use were conventional fundus cameras modified to incorporate wavefront sensing and correction.7,8 These systems typically focus a laser beam on the retina at a location of interest. The light reflected from the retina is then distorted by the optical system of the eye before returning to the wavefront sensor. Information obtained from the wavefront sensor is then used to alter the shape of the deformable mirrors and compensate for the aberration. This process continues in a closed loop until the ocular aberrations have been reduced to near diffraction-limited levels; at this point, a flash from a separate incoherent light source is triggered by the wavefront sensor, illuminating the retina as an image is captured by the digital fundus camera.
Adaptive optics components have also been incorporated into confocal SLO systems, offering the advantage of increased contrast, cross-sectional imaging, and the measurement of dynamic changes such as blood flow.5,9 In an adaptive optics SLO, light returning from the retina is split into a light detection path and a wavefront-sensing path. Again, deformable mirrors are used to provide closed-loop dynamic compensation for ocular aberrations. In contrast to flood-illuminated adaptive optics devices, the adaptive optics SLO uses the same source of light for the wavefront sensor as for the retinal illumination; as a result, the wavefront sensor is able to measure aberrations from the entire scanned area of the retina. When imaging the retina, SLO devices provide a transverse resolution of approximately 15 µm but are limited to an axial resolution of approximately 300 µm. With the addition of adaptive optics correction to an SLO, the transverse resolution may be increased to less than 3 µm while the axial resolution may be improved to 40 µm.
Adaptive optics devices have also been incorporated into prototype OCT systems.10,11 The axial resolution achievable using OCT is many orders of magnitude greater than that achievable using an SLO device, with commercially available devices commonly achieving axial resolutions of approximately 5 µm. However, the transverse resolution of OCT systems is determined by the size of the laser spot that can be focused on the retina – a factor limited by ocular aberrations. A successful combination of OCT and adaptive optics could potentially demonstrate, therefore, the narrowest point-spread function of all in vivo retinal-imaging techniques (Fig. 5.4). However, a number of technical challenges remain, in particular, the reductions in image quality that occur as a result of chromatic aberrations when large-bandwidth light sources are used.12,13
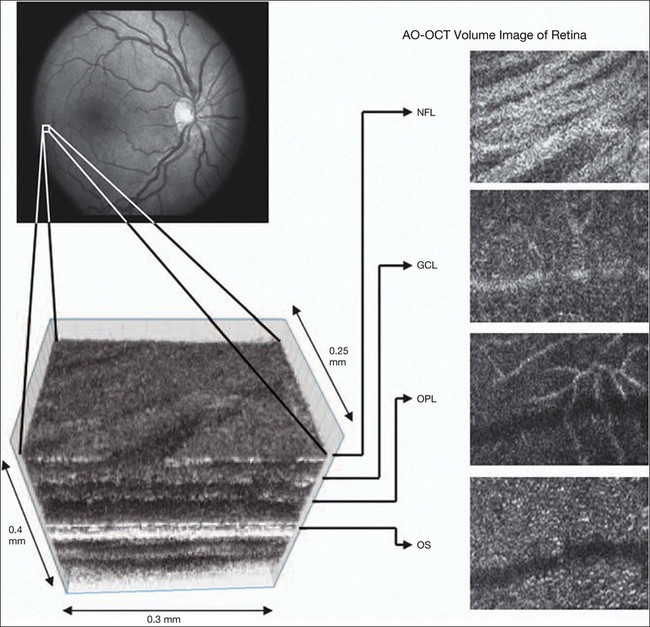
Fig. 5.4 Adaptive optics optical coherence tomography (AO-OCT) volume acquired over a 1° retinal region located temporal of the fovea, as illustrated by the rectangle in the fundus photograph. The images on the right are en face views of particular retinal layers extracted from the AO-OCT volume. Retinal layers from top to bottom are: nerve fiber layer (NFL), ganglion cell layer (GCL), outer plexiform layer (OPL), and outer-segment (OS) layer of photoreceptors. (Reproduced with permission from Miller DT, Kocaoglu OP, Wang Q, et al. Adaptive optics and the eye (super resolution OCT). Eye 2011;25:321–30.)
Finally, adaptive optics may be useful for the performance of fundus perimetry (“microperimetry”) in the study of macular disease.1 In current microperimetry systems, macular light sensitivity is measured using a stimulus size that covers an area containing in excess of 150 cones at the foveal center. As with the imaging modalities described above, further reductions in stimulus size are hindered by aberrations of the optical systems in the human eye, a shortcoming that may be overcome through the incorporation of adaptive optics.14 In addition, by analyzing the warping that occurs both within individual SLO frames and between frames, adaptive optics can be used to resolve the effects of eye movements at a fine spatial scale. As a consequence, in adaptive optics microperimetry, real-time stabilization of the retinal image is possible, and allows for targeted delivery of the small visual stimulus to the retina.15,16
Visualization of retinal structures
Cone photoreceptors are the dominant feature seen with both flood-illuminated and SLO devices (Fig. 5.5A).6,17 Light projected into the eye from these devices passes through the cone outer segment and is reflected by the retinal pigment epithelium (RPE), the most highly reflective surface in the retina. As light is reflected out of the eye, it is guided toward a small area of the pupil by the cone inner segments (in this respect cones act as “optical fibers,” rejecting stray light in the retina and maximizing efficiency in light collection). The human eye has three classes of cone photoreceptors: blue (S), green (M), and red (L). Adaptive optics has supplied the first data regarding the proportion, and arrangement, of each cone class in the human eye.18 By quantifying cone receptor density, it has also been demonstrated that the density of cone packing appears to be lower in highly myopic eyes versus emmetropic eyes – a finding consistent with the reduced visual acuity and contrast sensitivity observed in the eyes of axial myopes.19
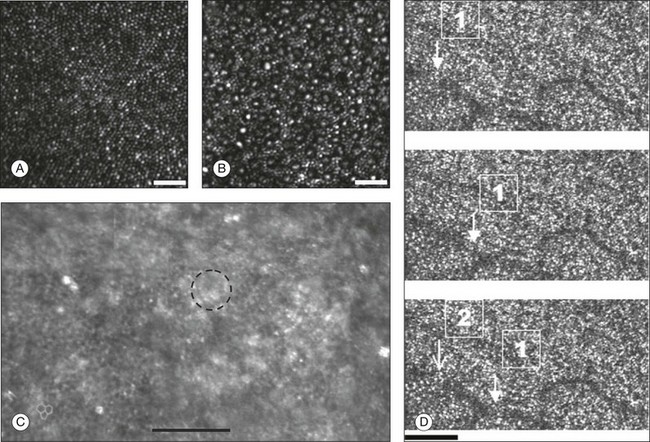
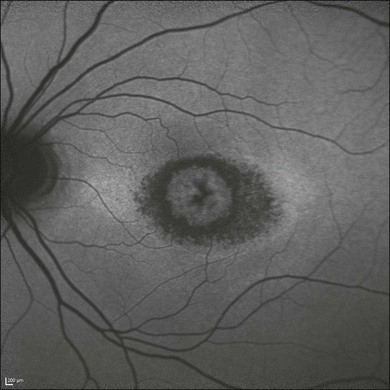
Fig. 5.5 Visualization of photoreceptors, retinal pigment epithelium (RPE), and retinal vasculature using adaptive optics. (A) The complete foveal cone mosaic and (B) the complete peripheral photoreceptor mosaic showing both rods and cones, imaged at 10° temporal and 1° inferior. Scale bars = 20 µm. (Reproduced with permission from Rossi EA, Chung M, Dubra A, et al. Imaging retinal mosaics in the living eye. Eye 2011;25:301–8.) (C) Adaptive optics scanning laser ophthalmoscopy image revealing a patchy foveal cone mosaic with increased cone spacing, and resulting visualization of the RPE cells (three RPE cells in the bottom left corner have been outlined, and the preferred retinal locus is also indicated by the dashed circle in the image). (Reproduced with permission from Roorda A, Zhang Y, Duncan JL. High-resolution in vivo imaging of the RPE mosaic in eyes with retinal disease. Invest Ophthalmol Vis Sci 2007;48:2297–303.) (D) Three successive frames demonstrate a single leukocyte’s (1) change in position from left to right in each frame. A second leukocyte (2) has just come into view in the last frame. Scale bar = 100 µm. (Reproduced with permission from Martin JA, Roorda A. Direct and noninvasive assessment of parafoveal capillary leukocyte velocity. Ophthalmology 2005;112:2219–24.)
Rod photoreceptors are abundant in the peripheral retina but are also seen in the macular region of human eyes. Rods are not as easily visualized in the normal retina, even in areas of the retina where they outnumber cones approximately 10-fold.6 The difficulty in imaging rods is consistent with their smaller size (approximately 2 µm in diameter), and their broad angular tuning, which reflects less light back through the pupil where it can be collected for imaging. However, recent advances, including the use of smaller confocal pinholes and improvements in registration algorithms, have now allowed clear images of single rods to be obtained in the living human eye (as well as aiding visualization of the smallest cones at the foveal center) (Fig. 5.5A).20
Rod and cone photoreceptors rest on a monolayer of RPE cells. Each RPE cell in the monolayer has an approximate diameter of 10 µm, dimensions well within the resolution limits of adaptive optics systems; however, direct in vivo visualization of single RPE cells remains challenging. Unlike cone photoreceptors, the intrinsic contrast of RPE cells is poor. In addition, much of the light scattered by the RPE is masked by the overlying photoreceptors, which are also highly scattering. To date, direct imaging of the RPE has only been possible in human subjects with retinal disease where absence of cone photoreceptors has allowed visualization of the underlying RPE (Fig. 5.5B).21 However, by the incorporation of adaptive optics with fundus autofluorescence, images of the RPE cell mosaic have been achieved in primate eyes.22
The high scanning speed of SLO systems allows retinal images to be captured at video rates, thus allowing measurement of dynamic retinal changes, such as blood flow. The use of an adaptive optics SLO thus allows direct visualization of white blood cells as they transit through retinal capillaries (the smaller size and different absorption characteristic of red blood cells make them more difficult to visualize) (Fig. 5.5C).23,24 As a consequence, direct noninvasive measurement of the velocity of retinal blood flow becomes possible. Retinal imaging with adaptive optics may also be useful for detection of structural changes in the retinal vasculature not visible with other imaging modalities, such as microaneurysms and hard exudates in diabetic retinopathy.25
Although cone photoreceptors offer high contrast and can now routinely be imaged using adaptive optics, other cell types in the retina are not as easily visualized. Unlike cones, other neurons are not highly reflective of light and do not exhibit high contrast (the reflected signal from ganglion cells is 60 times lower than that from cones). These difficulties are especially difficult to surmount given the safe limits for laser usage in humans, and the effects of involuntary eye movements. Despite these obstacles, recent animal studies have made progress toward in vivo visualization of retinal ganglion cells using fluorescent markers, and the development of similar capabilities in humans may lead to improved understanding of optic neuropathies such as glaucoma.26
Early clinical applications
The cellular-level resolution provided by adaptive optics retinal imaging allows direct measurement of photoreceptor density and diameter and is, therefore, an ideal tool for the examination of patients with inherited retinal degenerations (Fig. 5.6). On examination with adaptive optics, diseased cones do not show the same reflectance pattern as healthy photoreceptors, resulting in dark gaps or areas of “drop-out” within the cone photoreceptor mosaic.27 Significant correlations have been found between parafoveal cone density and a number of functional parameters, including best-corrected visual acuity, contrast sensitivity, and detection sensitivities for visual stimuli recorded using multifocal electroretinography.28–30 In a recent phase II clinical trial where patients with inherited retinal degenerations were treated with sustained-release ciliary neurotrophic factor, no changes in visual acuity, visual field, or electroretinography responses were observed. However, using an adaptive optics SLO, significant differences in both cone density and spacing were detected between treatment and control groups.31
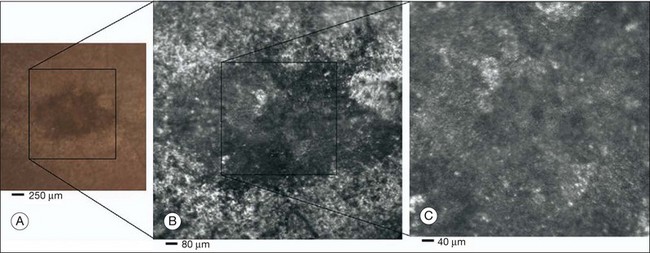
Fig. 5.6 Adaptive optics scanning laser ophthalmoscope (AOSLO) images at different magnifications with corresponding features on the fundus photograph (A). (B) Six-degree montage from 3° adaptive optics images of the central macula of the cone–rod dystrophy patient’s right eye. In addition to the features detected in the fundus photograph, detailed structures in the granular pattern of the retinal pigment epithelium in the atrophic bull’s-eye lesion are observed. Within the central relatively spared region (box), photoreceptors are seen as gray dots. (C) Three-degree montage from 1.5° images. The photoreceptors are visible in the central relatively spared area of the retina. (Reproduced with permission from Wolfing JI, Chung M, Carroll J, et al. High-resolution retinal imaging of cone–rod dystrophy. Ophthalmology 2006;113:1019.)
High-resolution adaptive optics imaging has also been used to aid the examination of patients with “macular microholes,”32 color blindness,33 foveal hypoplasia,34 and otherwise unexplained visual disturbances.35 In patients with glaucoma and other optic neuropathies, adaptive optics has also revealed evidence of structural changes in cone photoreceptors when there is permanent damage to the overlying inner retinal layers.36
Doppler imaging – assessment of blood flow
The Doppler effect, first described in the 19th century by the Austrian physicist Christian Doppler, is the change in frequency of a wave as it is reflected off a moving object: if the reflecting object is moving away from the observer/transducer, the frequency of the reflected waves is lower than that of the waves emitted, and vice versa. As the frequency shift is dependent on the velocity of the moving object, this effect can be used to measure the velocity of blood flowing in the eye.37 Importantly, the Doppler effect is also dependent on the angle between the axis of the wave and the axis of movement of the object. Therefore, if the observer/transducer is not parallel to the axis of the moving object calculations must be performed using a Doppler angle correction formula:
Utilization of the Doppler effect in ocular imaging systems allows calculation of ocular blood flow velocities.37 Reductions in blood flow velocity may occur as a result of vascular degenerative changes in diseases such as diabetic retinopathy, or as a result of vascular occlusion in diseases such as central retinal vein occlusion (CRVO). However, changes in retinal blood flow velocity may also occur as a result of either constriction or dilatation of vessels during normal physiological autoregulation (according to Bernoulli’s principle, constriction of a blood vessel causes a conversion of pressure into kinetic energy, thereby increasing the velocity of the blood, but decreasing its pressure). Therefore, measurements of the absolute quantities of “blood flow” may represent a more clinically relevant parameter.
Blood flow (Q) is the volume of blood passing through a vessel in a given time, and is determined by the velocity of the blood (V) multiplied by the cross-sectional area of the blood vessel through which it passes (πr2).38 Consequently, if blood flow velocity can be measured using the Doppler effect, and the diameter of the blood vessel can also be measured, then absolute values for blood flow may be determined. Measurements of retinal vascular diameter can be acquired from fundus images obtained with standard optical imaging techniques (e.g., fundus photography).39,40 However, in order to measure retinal vascular diameters in real units of length, the magnification of the image induced by the eye, as well as the magnification of the camera, must be known (failure to account for such magnification will result in significant errors).
Non-Doppler assessment of retinal blood flow
Measurement of retinal blood flow is possible using quantitative angiography, based on use of dye dilution techniques.37,39,40 In this method, the concentration of fluorescent dye within the blood at a specific observation point is graphed over time, producing a dye dilution curve. The enhanced contrast provided by SLO systems is particularly suited to this approach, and it can be used to evaluate vascular parameters such as retinal arteriovenous passage time and mean dye velocity. The increased contrast provided by SLO images also allows measurement of blood velocities in the small vessels surrounding the fovea and the optic nerve head (in the future, this technique is likely to be enhanced through the incorporation of adaptive optics).40 Indocyanine green angiography may also be used to evaluate the choroidal circulatory flow, as the infrared light sources employed penetrate the RPE more efficiently than the shorter wavelengths used in fluorescein angiography. In one analysis method, the choroid is divided into six regions, and dye dilution curves are created for each region (Fig. 5.7A). Parameters such as 10% filling time, and maximum brightness, can then be calculated.40 SLO-based fluorescein and indocyanine green angiography provide significant information regarding retinal and choroidal blood velocities. However, without measurement of corresponding vascular diameters, it is not possible to measure blood flow. In addition, the invasive nature of the dye injections required for these approaches precludes their routine use in many clinical scenarios.
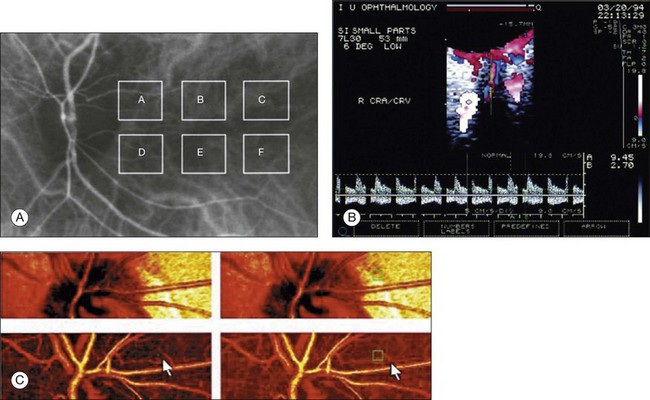
Fig. 5.7 Evaluation of chorioretinal blood flow. (A) Quantification of choroidal blood flow using indocyanine green angiography. Six locations, each a 6° square, are identified on the image for dye dilution analysis. (B) Color Doppler image (CDI) of the central retinal artery and vein. The Doppler shifted spectrum (time–velocity curve) is displayed at the bottom of the image. Red and blue pixels represent blood movement towards and away from the transducer, respectively. (C) Confocal scanning laser Doppler flowmetry (Heidelberg retinal flowmeter) of optic nerve head and peripapillary retina. The left arrow indicates a 1 × 1-pixel measurement window, which collects flow values from the entire retina except for large vessels, for new pixel-by-pixel analysis. The right arrow indicates a 10 × 10-pixel measurement window used for conventional analysis. (Reproduced with permission from Harris A, Chung HS, Ciulla TA, et al. Progress in measurement of ocular blood flow and relevance to our understanding of glaucoma and age-related macular degeneration. Prog Retin Eye Res 1999;18:673–7.)
Doppler ultrasound
Color Doppler imaging (CDI) is an ultrasound technique that combines B-scan gray-scale imaging of tissue structure, color representation of blood flow based on Doppler shifted frequencies, and pulsed-Doppler measurement of blood flow velocities (Fig. 5.7B).37,40 As in other Doppler-based methods, blood flow velocity is determined by the shift in the frequency of sound waves reflected from the moving blood column. Color is then added to the B-scan gray-scale image of the eye to represent the motion of blood through the vessels. The color varies in proportion to the flow velocity and is typically coded red–white for motion toward the probe, and blue–white for motion away from the probe. Using the color Doppler image, the operator can then identify the vessel of interest and place the sampling window for pulsed Doppler measurements (this window is generally situated in the center of the vessel). At this point, the general flow axis of the blood flow is detected simply by observation to determine the Doppler flow angle for the appropriate calculation of velocity. Flow–velocity data are then plotted against time, and the computer identifies the peak and trough of the waves.
Current CDI analysis focuses primarily on the arteries located behind the globe: ophthalmic artery, central retinal artery, and posterior ciliary arteries. CDI can be used to describe blood flow to the eye in terms of a set of well-defined parameters including: (1) peak systolic velocity (PSV); (2) end-diastolic velocity; and (3) resistance index.37,40 It does not provide absolute measurements of blood flow (no quantitative information on vessel diameter is obtained). With a 7.5-MHz probe, CDI is able to resolve structures of 0.2 mm (200 µm) or larger, but can also be used to measure Doppler shifts in smaller vessels such as the posterior ciliary arteries (diameter of approximately 40 µm). CDI may be of particular use for the primary evaluation and follow-up of orbital vascular lesions, such as varices, arteriovenous malformations, and carotid-cavernous sinus fistulas. It has also been used for the semiquantitative assessment of perfusion in retinal and choroidal vascular disease. Specifically, in patients with CRVO, the central retinal artery PSV and end-diastolic velocity have been found to be much lower than in unaffected fellow eyes and in healthy control subjects.41 Patients with ocular ischemic syndromes also present reduced PSVs in the central retinal and posterior ciliary arteries, as well as increased resistance.42
Laser Doppler velocimetry
Bidirectional laser Doppler velocimetry (LDV) is a technique used to quantify maximum blood velocity in large retinal vessels.37,43 Instruments based on this principle typically consist of a modified fundus camera where the body of the camera has been replaced by a fiberoptic unit. A low-powered laser light source casts a beam on to the ocular fundus which is positioned by the operator on the retinal vessel of interest. The Doppler shifted frequency spectra of the returning light can then be measured. These spectra exhibit large fluctuations up to a clearly measurable maximum shift – this maximum shift arises from scattered light from red blood cells flowing at the maximum speed at the center of the vessel. If the Doppler angles are then known, the maximum frequency shift can be used to calculate the maximum vessel velocity; however, these angles are difficult to measure reproducibly. Therefore, a bidirectional technique was developed to expand the capability of LDV to provide absolute measurements of maximum velocity.43 In the bidirectional technique, one incident beam is used to illuminate a sight along a retinal vessel. The light scattered by the blood cells at the illuminated site is then detected simultaneously in two distinct directions separated by a known, fixed angle. Two Doppler shifted frequency spectra are measured and the difference between their maximum shifts is then used to calculate the maximum velocity in units of speed.
By combining an eye-tracking system with a retinal laser instrument based on bidirectional LDV, Canon has developed a commercially available instrument (Canon Laser Blood Flowmeter (CLBF)-100, Tokyo, Japan).44 This device allows concomitant measurement of blood vessel diameter; as a result, total retinal blood flow in a single vessel can be calculated in absolute units. Thus far, the smallest vessels in which the blood flow rate has been measured were approximately 40 µm in diameter.44
Laser Doppler flowmetry
Laser Doppler flowmetry (LDF) is a technique where laser light is not directed at a retinal vessel, but on an area of vascularized retinal tissue with no large vessels visible.37,39 LDF instruments are based on the theories of Bonner and Nossal, which describe the characteristics of laser light injected at one point into capillary tissue and collected at an adjacent point.43 This theory relates the Doppler shift of the light to the total number of blood cells moving in the illuminated tissue volume, and to the flow rate of the moving cells. By using this theory, relative measurements of the mean velocity of the red blood cells, and the blood volume, can be obtained. Relative values of blood flow can then be calculated as the product of velocity and volume. However, such measurements are not absolute, and variations in vascular density and vessel orientation, even within relatively small volumes of tissue, can lead to considerable differences in the scattering properties between subjects.
Scanning LDF combines the principles of scanning laser tomography and LDF, with the commercially available Heidelberg retina flowmeter (HRF) providing two-dimensional flow maps of the retina and optic nerve head (Fig. 5.7C).45 In this system, the HRF images a 2880 × 720 µm area of the retina or optic nerve, at a resolution of approximately 10 µm/pixel. After the scan is performed, the HRF computer performs a fast Fourier transform to extract the Doppler shift spectrum from each measured pixel of reflected light. The HRF device is simple to use and sensitive to small changes over time in the same eye. However, the flow measurements are displayed in arbitrary units and there is a lack of accuracy when dealing with very high and very low blood speeds. Furthermore, contributions to blood flow measurements from the underlying choriocapillaris cannot be excluded and previous experimental tests of the instrumentation have demonstrated that large-flow readings can be obtained from sample volumes even when they contain no moving cells.43
Doppler optical coherence tomography
OCT, first described by Huang et al. in 1991, uses interferometry to generate high-resolution cross-sectional images of the neurosensory retina.46 Since the mid-1990s, Doppler measurements have been incorporated into prototype OCT imaging systems (Fig. 5.8).10 In the original time-domain OCT systems, the blood velocity can be determined by measurement of the Doppler shift of the interference fringe frequency after Fourier transformation of the data, whereas, in newer spectral domain OCT systems, direct recording of the interference fringe frequency is possible. However, in this approach, blood velocity sensitivity and image spatial resolution are coupled and inversely related (increasing the velocity sensitivity decreases the spatial resolution). In order to overcome this limitation, a number of Doppler OCT prototypes utilize the phase change between sequential A-scans in order to generate information regarding the Doppler shift.10 Although OCT can generate cross-sectional images of retinal blood flow, accurate quantification of this flow remains challenging: to achieve this it is necessary to measure the geometry of the vessel and, in particular, the Doppler angle. Furthermore, current Doppler OCT systems are limited in terms of the maximal velocities measurable, and in terms of the smallest vessel diameters measurable (capillary flow involves single erythrocyte movement rather than continuous fluid flow).

Fig. 5.8 Doppler optical coherence tomography (OCT). (A) Fundus photograph showing the double circular pattern of the OCT beam scanning retinal blood vessels emerging from the optic disc. (B) The relative position of a blood vessel in the two OCT cross-sections is used to calculate the Doppler angle θ between the beam and the blood vessel. (C) Color Doppler OCT image showing the unfolded cross-section from a circular scan. Arteries and veins can be distinguished by the direction of flow as determined by the signs (blue or red) of the Doppler shift and the angle θ. (Reproduced with permission from Wang Y, Fawzi AA, Varma R, et al. Pilot study of optical coherence tomography measurement of retinal blood flow in retinal and optic nerve diseases. Invest Ophthalmol Vis Sci 2011;52:841.)
Spectral imaging – assessment of retinal oxygenation
Spectroscopy is the study of the interaction between any form of matter and radiated energy (e.g., visible light). By measuring radiation intensity as a function of wavelength, and through the identification of characteristic signatures, it is possible to determine the constituents of a material. For example, in astronomy, spectral analysis can be used to derive many properties of distant stars and galaxies. As well as its uses in remote sensing, spectroscopy has also been adapted for a number of laboratory-based applications. In biological systems, the combination of spectroscopy with conventional imaging techniques – “spectral imaging” – allows determination of the spatial distribution of spectroscopic data.47 In clinical settings, the application of spectroscopic principles has been of particular use for oximetry – the measurement of oxygen saturation in a patient’s blood. From as early as 1935, transillumination of the ear has been used as a method of continuously measuring oxygen saturation in human blood. The subsequent incorporation of plethysmography (the analysis of pulsatile components of the arterial cycle) has facilitated the development of pulse oximeters capable of measuring arterial oxygen saturation in isolation.
The use of spectral imaging to perform blood oximetry is dependent on assumptions about the relationship between light transmittance through the blood and its oxygen saturation.47 According to the Lambert–Beer law, for any given wavelength of light, its transmittance through blood is dependent on the extinction coefficient of the blood (ε), the concentration of blood (c), and the path length (d) through which the light travels:
The extinction coefficient of blood (ε) is dependent on its main absorbing component, hemoglobin, which, in turn, is dependent on its oxygen concentration. As the extinction coefficient of blood varies with wavelength, analyzing the optical density of blood at multiple wavelengths compensates for variables such as the concentration and path length and ultimately allows estimation of oxygen levels in the blood (the exact details of these calculations are beyond the scope of this chapter, but have been reviewed in detail by Harris et al.).48 However, in retinal oximetry, it is impractical to determine optical densities (and thus oxygen concentrations) through the measurement of light transmittance. Instead, measurements of light reflected from the retina are typically used:
Technology
Spectral imaging devices typically employ one of three different approaches: (1) multispectral imaging; (2) hyperspectral imaging; and (3) imaging spectroscopy.47,48 Initial efforts by Hickam et al. in the 1950s49 employed film-based fundus cameras; more recently, digital fundus cameras and confocal scanning laser ophthalmoscopes have also been employed. Early attempts have also been made at the utilization of OCT in association with spectral analysis techniques.
Multispectral imaging involves the measurement of reflected light from images obtained at discrete and somewhat narrow spectral bands. Adopting a similar approach to that first described by Beach et al.,50 Hardarson et al. have developed Oxymap, a commercially available device approved for investigational usage.51 This device consists of a fundus camera, which is coupled with a beam splitter and a digital camera. The beam splitter separates the original image into four optical channels, each of which contains a different narrow band-pass filter (each band-pass filter only allows light of specific wavelengths to pass). This simultaneously yields four fundus images, each with a specific wavelength of light. Specialized software automatically selects measurement points on these images and calculates the optical density of retinal vessels at two wavelengths, 605 nm and 586 nm (optical density is sensitive to oxygen saturation at 605 nm but not at 586 nm). The ratio of these optical densities is approximately linearly related to the hemoglobin oxygen concentration. The oximeter is then calibrated to yield relative oxygen saturation values. This approach has been shown to be sensitive to changes in oxygen concentration and to yield reproducible results. Other commercially available multispectral devices have also recently been described (Imedos UG, Jena, Germany).
Hyperspectral imaging involves the measurement of light from images obtained at narrow spectral bands over a contiguous spectral range. Mordant et al. have recently described the validation of a hyperspectral fundus camera for noninvasive retinal oximetry (Fig. 5.9).52 In their system, a commercial fundus camera is linked to a liquid crystal tunable filter in the optical path of the camera’s light source; this enables the electronic selection of a combination of desired wavelengths between 400 and 700 nm. A CCD camera is then used to record a sequence of spectral images between 500 and 650 nm in 2-nm increments (this process takes approximately 10–15 minutes in healthy volunteers). Further image processing and analysis then take place: the images are registered, the retinal vessel profiles extracted, and their optical densities estimated. Oxygen saturations can then be calculated. Use of hyperspectral imaging in this manner may provide more accurate measurements of oxygen saturation than two-wavelength multispectral approaches (such approaches have been reported to overestimate oxygen saturation). However, such an approach requires the use of sensitive detectors and powerful computers to enable fast and accurate processing of images.
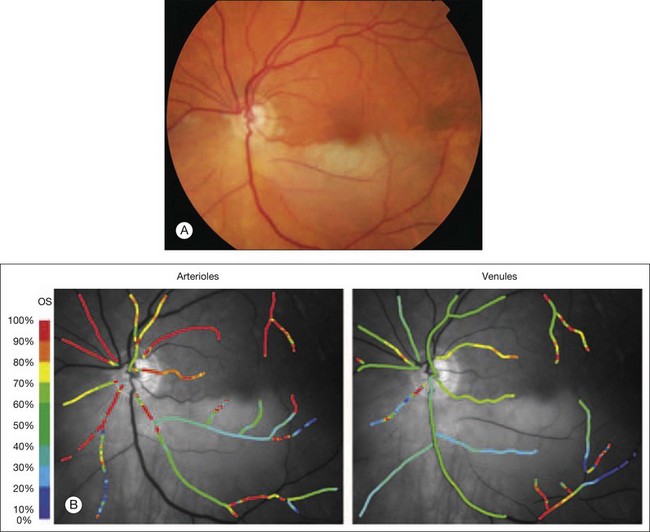
Fig. 5.9 Spectral imaging of the retina. (A) Color fundus photograph demonstrating a left inferotemporal branch retinal arteriole occlusion. (B) Pseudocolor oxim map showing abnormally low oxygen saturation within the affected inferotemporal retinal arteriole in contrast to the normal oxygen saturation levels in the unaffected superotemporal arteriole. The corresponding inferotemporal retinal venule has a normal level of oxygen saturation. (Reproduced with permission from Mordant DJ, Al-Abboud I, Muyo G, et al. Spectral imaging of the retina. Eye 2011;25:317.)
A third method utilized for the noninvasive measurement of retinal oxygen saturation involves imaging spectroscopy. Schweitzer et al. have described an imaging ophthalmospectrometer, which consists of a modified fundus camera and an attached spectrograph.53 The instrument illuminates the retina with a small slit of light and then simultaneous measurements are made at 76 different wavelengths in this discrete area using a spectrometer. This approach may be the most accurate; however, a major limitation is that measurements are made at one single cross-section of one or two retinal vessels. By contrast, a complete two-dimensional mapping of oxygen saturation in the retinal vascular tree is needed for clinical diagnostics.
Clinical applications
Using the Oxymap system, Hardarson and Stéfansson have evaluated retinal vasculature oxygen saturations in patients following CRVO and branch retinal vein occlusion (BRVO).54,55 In patients with CRVO, they demonstrated that retinal venular oxygen saturation is lower than in fellow eyes. However, they also demonstrated considerable variability within and between CRVO eyes. Similarly, in patients with BRVO, they found considerable variability in oxygen saturation between patients. They found evidence of hypoxia in some patients but not others and speculated that this reflected variable disease severity in terms of degree of occlusion, recanalization, collateral circulation, and coexistent tissue atrophy. Hardarson et al. have also used this system to examine the effects of glaucoma filtration surgery, and topical antiglaucoma medications, on retinal vascular oxygen concentrations.56
Using the Imedos system, Hammer et al. found that, in patients with diabetes, increasing severity of retinopathy was associated with increased retinal venous oxygen saturations (from 63 ± 5% for mild nonproliferative retinopathy to 75 ± 8% for proliferative retinopathy). They suggest that these changes may occur secondary to the degeneration of capillary vascular beds with formation of arteriovenous shunt vessels.57 Conversely, earlier work by Tiedeman et al. demonstrated evidence of increased oxygen consumption (i.e., decreased retinal venous oxygen saturation) in diabetic patients with acute hyperglycemia.58
Photoacoustic imaging – assessment of retinal absorption
In large part, contemporary retinal imaging modalities are based on the measurement of light reflected from the retina, e.g., fundus photography, SLO, OCT systems.2 In contrast, no ophthalmic imaging modality exists that can directly measure the absorption of light by retinal tissues – information of potentially great significance. Assessment of optical absorption profiles at multiple wavelengths may improve the accuracy of retinal vascular oxygen saturation measurements (current “spectral imaging” determines optical density ratios indirectly, through the measurement of reflected light). Retinal absorption characteristics may also provide contrast for generation of enhanced retinal angiographic maps. Assessment of optical absorption could also be useful for providing contrast when imaging the highly pigmented RPE cell mosaic. Fortunately, through recent advances in microscopy, utilizing the photoacoustic effect, it has become possible to acquire optical absorption profiles in the context of noninvasive ophthalmic imaging – photoacoustic ophthalmoscopy (PAOM).59,60
The photoacoustic effect was first recognized by Alexander Graham Bell in the 1880s when he discovered that thin discs of selenium emit sound when exposed to a rapidly interrupted beam of sunlight. This phenomenon occurs as energy absorbed from the incident light is converted into kinetic energy, which results in local heating and, thus, generation of a pressure wave or sound. In the recently described photoacoustic microscopy (PAM),61 a laser is used to irradiate a target tissue and thus induce ultrasonic pressure waves as a result of specific optical absorption. These pressure waves can then be recorded using a high-resolution ultrasonic transducer, and images generated. Through the integration of OCT technology with a laser-scanning, optical-resolution PAM, Jiao et al. have recently reported the use of PAOM in small animals.59,60
Technology
In the system developed by Jiao et al. the illumination source is a frequency-doubled, Q-switched, Nd:YAG laser, combined with the output laser beam of a fiber-based spectral domain OCT system, and then scanned across the retina using a galvanometer.59 The photoacoustic waves induced from the retina are then detected by an ultrasonic transducer placed in contact with the eyelid (coupled by ultrasound gel). The resulting photoacoustic images can then be registered with the images generated from the integrated OCT system (Fig. 5.10). As with conventional OCT image sets, maximum-amplitude “projection” images can be generated from photoacoustic datasets allowing two-dimensional visualization of the retinal vasculature. Volumetric images can also be generated following automated segmentation of the RPE and retinal vessels. More recently, the same group has tested the acquisition of photoacoustic images in association with fundus autofluorescence signals (apart from generating heat, the absorbed photons may undergo other physical processes, such as stimulating autofluorescence when fluorophores are present). Multimodal imaging in this manner may thus provide spatial information on the distribution of both melanin and lipofuscin via photoacoustic and autofluorescent signals respectively.62
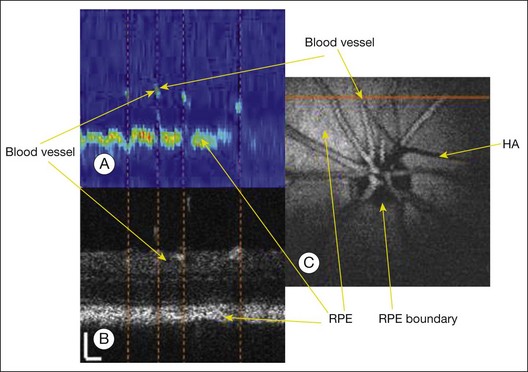
Fig. 5.10 Comparison of optical coherence tomography (OCT) and photoacoustic ophthalmoscopy (PAOM) images acquired simultaneously in vivo. (A) PAOM B-scan image in pseudocolor; (B) OCT B-scan image; (C) projection image of the PAOM data set. Scale: 100 µm. HA, hyaloid artery; RPE, retinal pigment epithelium. (Reproduced with permission from Jiao S, Jiang M, Hu J, et al. Photoacoustic ophthalmoscopy for in vivo retinal imaging. Optics Express 2010;18:3971.)
Magnetic resonance imaging
As previously described, the acquisition of retinal images is largely dependent on optical techniques such as fundus photography. However, many such techniques are constrained by a relatively small field of view, and are often limited when there is disease-induced opacification of the ocular media, such as lens opacity or vitreous hemorrhage. In the clinical setting, these limitations are addressed, at least in part, by acoustic imaging techniques such as ultrasonography. More recently, however, advances in MRI offer the prospect of retinal application in humans.63,64 In addition to a wide field of view, and the ability to acquire images despite media opacification, retinal MRI may also enable evaluation of novel functional parameters.
Basic principles
In MRI systems, a powerful magnetic field is applied to the body leading to alignment of the magnetization of its hydrogen nuclei or protons (the human body is largely made up of water molecules which contain two hydrogen atoms). Radiofrequency fields are then used to alter this alignment systematically, causing the protons to spin and producing a rotating magnetic field detectable by the scanner. Detectors in the MRI system then evaluate a number of parameters (e.g., spin density, spin–lattice relaxation time (T1), spin–spin relaxation times (T2)), which vary depending on the local tissue environment. As a result, soft tissue images can be generated. Image contrast may be further enhanced through the use of exogenous paramagnetic contrast agents such as gadolinium. In this manner, clinical MRI scanners can produce high-resolution images of the entire body, both noninvasively and in a single setting.63
As well as its anatomical imaging capability, MRI scanning can be used to measure blood flow.63 MRI-derived quantification of blood flow may be performed by the use of exogenous intravenous contrast agents. However, it may also be performed noninvasively by magnetically labeling blood as a means of providing endogenous contrast. These techniques have been widely used to quantify blood flow to the brain and have been cross-validated using positron emission tomography. Relative blood oxygen saturations can also be measured using the blood oxygenation level-dependent (BOLD) technique. This technique detects differences in magnetic resonance signal intensity that arise from changes in the oxygen saturation of hemoglobin during brain activation – a local decrease in concentration of deoxygenated hemoglobin will increase the BOLD signal, while an increase will decrease the BOLD signal. In the brain, when a specific region is activated in response to stimulation, local blood flow increases in response to the increased metabolic demand; such increases in blood flow will provide a boost in oxygen delivery and thus decrease the concentration of deoxygenated hemoglobin. Techniques that measure blood flow and oxygenation can thus be used to image brain function noninvasively – functional MRI (fMRI).63
Retinal imaging
To date, most work on retinal imaging using magnetic resonance has been reported in animal studies (Fig. 5.11).63 As the spatial resolution of MRI is limited compared to that of OCT and other optical imaging modalities, current magnetic resonance-derived retinal imaging only allows delineation of three to four distinct retinal layers. Using gadolinium for contrast provides increased signal from the retinal and choroidal vasculature and thus aids in correlation of MRI retinal scans with histological sections (the avascular photoreceptor layers do not show any enhancements using this method). Manganese has also been used as a contrast agent to improve the anatomic contrast between layers; using this approach, it has been possible to reveal seven distinct retinal bands of alternating hypo- and hyperintensity.63
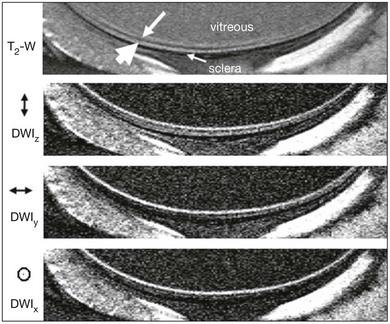
Fig. 5.11 Magnetic resonance imaging (MRI) of the retina in vivo. Higher-resolution T2-weighted (TE = 40 ms) and diffusion-weighted (b = 504 s/mm2) images at 50 × 100 µm resolution. Diffusion-sensitizing gradients were placed along the x, y, or z axis separately. The small and large white arrows indicate the “inner” and “outer” strips, respectively. (Reproduced with permission from Shen Q, Cheng H, Pardue MT, et al. Magnetic resonance imaging of tissue and vascular layers in the cat retina. J Magn Reson Imaging 2006;23:470.)
In 2008, the first report of retinal blood flow assessment in rats, using MRI, was published.65 In this study, arterial spin labeling was used to quantify basal blood flow levels and their responses to physiological stimulation. With the improvements in spatial resolution afforded by new MRI devices, visualization of both retinal and choroidal blood flow has become possible. In animals, using BOLD fMRI techniques, differential responses of the retinal and choroidal circulations to physiological stimuli (e.g., hyperoxia versus hypercapnia) have been demonstrated.63 In animal studies, BOLD fMRI responses have also been assessed in response to visual stimuli. The results of these studies suggest evidence that retinal vessels were very responsive to visual stimulation but choroidal vessels only showed small percentage changes.
Conclusions
Translation of retinal MRI from animal studies to human research and clinical practice faces a number of obstacles. The MRI scanners available in clinical environments currently have limited spatial resolutions and low signal-to-noise ratios. In addition, the issue of eye movements in awake humans is a major limiting factor. As a first step in addressing these issues, the feasibility of multimodal MRI has recently been tested on anesthetized large, nonhuman primates (baboons) using a standard clinical scanner.66 Studies of this nature allow optimization of MRI scanning parameters and represent a first step towards magnetic resonance-derived retinal imaging in humans. Zhang et al. have recently demonstrated, for the first time, the use of BOLD fMRI to examine the changes associated with oxygen and carbogen challenges in the unanesthetized human retina.67 Although much work has still to be done, such imaging may prove a useful adjunct to more established optical imaging methods, particularly when assessing the differential regulation of the retinal and choroidal circulations.
Nanotechnology
Nanotechnology involves the creation and use of materials and devices on a nanometer scale, i.e., at the size scale of intracellular structures and molecules.68 To comprehend the implications of nanotechnology adequately, it is necessary to appreciate the relative sizes of important biological structures. For example: macrophages are approximately 21 000 nm in diameter; red blood cells are approximately 7000 nm in diameter; cone photoreceptors measure between 500 and 4000 nm in diameter; the smallest single cellular organisms (bacteria of the genus Mycoplasma) are 200 nm in diameter; a strand of DNA is approximately 2 nm in diameter; and the smallest molecule, H2, is less than 1/10 of 1 nm in size. According to the National Nanotechnology Initiative, nanoparticles are those with a diameter ranging from 1 to 100 nm (within the biomedical community, slightly larger particles are often defined as nanoparticles owing to a similarity in size to important naturally occurring agents, such as viruses).69 At these dimensions, nanoparticles show unique properties that seem surprising but are, in fact, attributable to the principles of quantum mechanics. As a result of these effects, slight deviations in the size, shape, and organization of nanoparticles can have profound effects on their properties.
The engineering of nanomaterials and/or devices, and their application in “nanomedicine,” are likely to alter profoundly our approach to disease, with significant advances in biopharmaceuticals (e.g., drug design and delivery), implantable materials and devices (e.g., tissue regeneration scaffolds), and diagnostic tools (e.g., genetic testing and imaging).68,69 In ophthalmology, the use of nanoparticles shows particular promise for use as contrast agents in retinal imaging. Nanoparticles can be “functionalized” (i.e., conjugated with targeting ligands) to facilitate their precise and specific targeting. During their synthesis, the properties of nanoparticles can also be finely tuned for use with multiple imaging modalities. Finally, the biocompatibility of many nanoparticles has been established and, thus, the potential exists for their translation to clinical settings. In this section, we provide an overview of the properties and translation imaging potential for a number of nanoparticle groups.
Iron oxide nanoparticles
Magnetic nanoparticles are particularly attractive for magnetic resonance-derived imaging.68,69 MRI is based on the behavior, alignment, and interaction of protons in the presence of a magnetic field (see above). Within a strong magnetic field, protons are perturbed; magnetic nanoparticles can then be used to alter their longitudinal (T1) or transverse (T2) relaxation times and, thus, image contrast is generated. Superparamagnetic iron oxide (SPIO) nanoparticles have large magnetic moments and are well suited as T2 contrast agents in this context. A significant benefit associated with SPIO nanoparticles is their biocompatibility and ready detection at moderate concentrations; as a result, SPIO nanoparticles have been approved by the Food and Drug Administration for use in clinical practice and are now commercially available (e.g., ferucarbotran: Resovist, Bayer, Germany).
Gold nanoparticles
Due to the phenomenon of localized surface plasmon resonance – the collective oscillation of their conduction electrons in the presence of an incident light – gold nanoparticles can show strong extinction peaks in the visible and near-infrared regions of the electromagnetic spectrum (in simple terms, they are capable of scattering or absorbing large amounts of light when illuminated). As a result, gold nanoparticles are particularly well suited for use as contrast agents in optical imaging.70
Colloidal gold (suspensions of gold nanoparticles in fluid) has been used for hundreds of years to impart vibrant colors to the stained-glass windows of Gothic churches, and for many decades in the treatment of patients with rheumatoid arthritis.68 Since 1971, when Faulk and Taylor71 invented the immunogold staining procedure, colloidal gold has also been widely used in laboratory settings, with the optical (and electron beam) contrast qualities of gold providing excellent detection qualities for techniques such as immunoblotting, flow cytometry, and hybridization assays.72 More recently, the creation of a new form of nanoparticle – gold nanoshells – has reignited interest in gold nanoparticles as contrast agents for clinical imaging (Fig. 5.12).73 Gold nanoshells consist of a dielectric core (typically silica), surrounded by a thin gold shell. Unlike colloidal gold, the optical resonance of these nanoshells can be precisely and systematically varied over a broad range, extending from the near-ultraviolet to the mid-infrared. Thus, gold nanoshells can be designed and synthesized to demonstrate light-scattering peaks in the near-infrared region commonly utilized by ophthalmic imaging systems such as OCT. Conversely, gold nanoshells with large absorption cross-sections have been used for photothermal destruction of cancer cells, and may be useful in the future for photoacoustic ophthalmoscopy.74 In addition to their tunable spectral characteristics, and their putative biocompatibility, the same conjugation protocols used to functionalize colloidal gold can also be used for gold nanoshells. In addition to spherical gold nanoparticles and gold nanoshells, gold nanorods and gold nanocages have also been investigated as contrast agents for optical imaging in preclinical settings.75
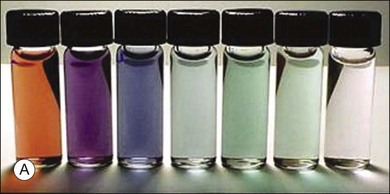
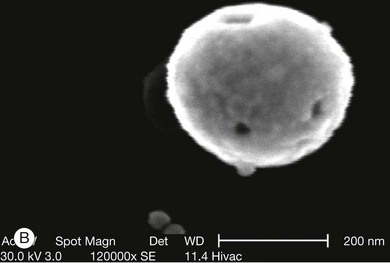
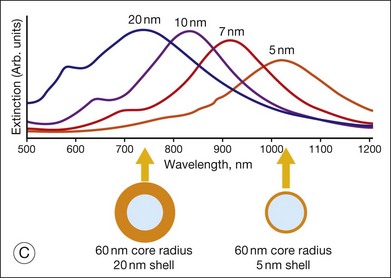
Fig. 5.12 Gold nanoparticles, such as nanoshells, may be of use as contrast agents for clinical imaging. (A) Visual demonstration of the tunability of metal nanoshells. (Reproduced with permission from Loo C, Lin A, Hirsch L, et al. Nanoshell-enabled photonics-based imaging and therapy of cancer. Technol Cancer Res Treat 2004;3:34.) (B) Scanning electron microscopy image of nanoshell with 291-nm core diameter and 15-nm shell thickness. (Reproduced with permission from Agrawal A, Huang S, Wei Haw Lin A, et al. Quantitative evaluation of optical coherence tomography signal enhancement with gold nanoshells. J Biomed Opt 2006;11:041121–2.) (C) Optical resonances of gold shell-silica core nanoshells as a function of their core/shell ratio. Respective spectra correspond to the nanoparticles depicted beneath. (Reproduced with permission from Loo C, Lin A, Hirsch L, et al. Nanoshell-enabled photonics-based imaging and therapy of cancer. Technol Cancer Res Treat 2004;3:34.)
Quantum dots
Quantum dots are fluorescent nanocrystals, 1–100 nm in size, with unique optical and electrical properties, and with a synthetic history of approximately 20 years.68,69 Quantum dots commonly consist of a metalloid crystalline core (e.g., cadmium selenide) surrounded by a shell (e.g., zinc sulfide). The fluorescent properties of quantum dots offer a number of advantages for their use in optical imaging. The brightness of quantum dots is 10–100 times greater than most organic dyes or proteins. Quantum dots also show broad absorption characteristics with narrow-emission spectra that are continuous and tunable due to quantum size effects. Quantum dots also possess a long fluorescence lifetime and undergo negligible photobleaching. Most importantly perhaps, quantum dots can be labeled to allow precise targeting of cellular structures. As a result of these features, quantum dots are increasingly being used for in vivo imaging in animal studies (Fig. 5.13), although concerns about cytotoxicity must be addressed before they will be suitable for use in humans.
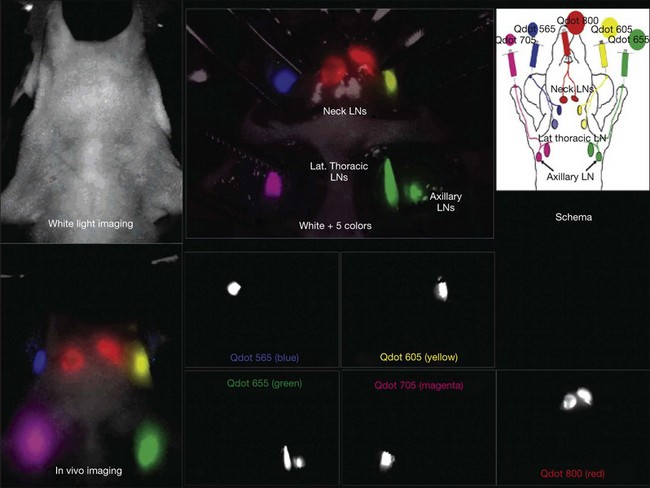
Fig. 5.13 In vivo and intrasurgical spectral fluorescence imaging of a mouse injected with five-carboxyl quantum dots (565, blue; 605, yellow; 655, green; 705, magenta; 800, red), intracutaneously into the middle digits of the bilateral upper extremities, the bilateral ears, and at the median chin, as shown in the schema. Five primary draining lymph nodes were simultaneously visualized with different colors through the skin in the in vivo image and are more clearly seen in the image taken at the surgery. (Reproduced with permission from Kobayashi H, Hama Y, Koyama Y, et al. Simultaneous multicolor imaging of five different lymphatic basins using quantum dots. Nano Lett 2007;7:1714.)
Conclusions
A large number of other nanoparticle groups are currently being investigated for their biomedical potential, with examples including carbon nanotubes, dendrimers, perfluorocarbons, and lipid-based nanoparticles.69 The unique and tunable optical properties of many nanoparticles, along with their small size and capacity for cellular targeting, make them strong candidates for use as contrast agents in retinal imaging. Using these agents in combination with techniques such as OCT may ultimately allow visualization of many retinal structures (e.g., Müller cells) and cellular processes (e.g., apoptosis) in clinical practice. While such usage has yet to be demonstrated in humans, the previous commercialization of magnetic nanoparticles for MRI and the early clinical trials of gold nanoparticle therapy in humans provide grounds for optimism in this regard.
Conclusions and future directions
In the past 25 years, advances in retinal imaging have revolutionized the diagnosis and management of retinal disease. As recently as 1990, the conventional wisdom held that axial image resolution was fundamentally constrained by geometric optics and the depth of focus.6 However, with the advent of OCT, axial resolution has now been improved 1000-fold over that previously thought possible. In the short to medium term, continued advances in OCT will be coupled with advances in adaptive optics technology to provide unprecedented noninvasive cellular imaging. In parallel with this, functional extensions of these and other imaging modalities will provide greatly enhanced information regarding parameters such as retinal blood flow and oxygenation. Increasing use of nanotechnology may provide “molecular” imaging capabilities, and allow evaluation of biochemical processes such as apoptosis. In the longer term, a number of fundamental limits will need to be overcome, including: (1) constraints imposed by maximum light exposure that can be delivered safely to the eye; (2) windows of spectral transmittance imposed by the cornea and lens; and (3) diffraction limits imposed by the wave nature of light.6 While many of these barriers seem impenetrable, early breakthroughs have already taken place in each area. In particular, the diffraction limit has already been surpassed in the field of microscopy,75 and the use of such techniques may allow a leap forward to much smaller spatial scales in future retinal imaging.
Disclosure: Dr Keane has received a proportion of his funding from the UK Department of Health’s National Institute for Health Research Biomedical Research Centre for Ophthalmology at Moorfields Eye Hospital and University College London Institute of Ophthalmology. The views expressed in the publication are those of the authors and not necessarily those of the Department of Health.
References
1. Keane, PA, Sadda, SR. Imaging chorioretinal vascular disease. Eye (Lond). 2010;24:422–427.
2. Yannuzzi, LA, Ober, MD, Slakter, JS, et al. Ophthalmic fundus imaging: today and beyond. Am J Ophthalmol. 2004;137:511–524.
3. Bennett, TJ, Barry, C. Ophthalmic imaging today: an ophthalmic photographer’s viewpoint – a review. Clin Exp Ophthalmol. 2009;37:2–13.
4. Yannuzzi, LA. Indocyanine green angiography: a perspective on use in the clinical setting. Am J Ophthalmol. 2011;151:745–751.
5. Roorda, A. Adaptive optics ophthalmoscopy. J Refract Surg. 2000;16:S602–S607.
6. Williams, DR. Imaging single cells in the living retina. Vision Res. 2011;51:1371–1396.
7. Liang, J, Williams, DR, Miller, DT. Supernormal vision and high-resolution retinal imaging through adaptive optics. J Opt Soc Am A. 1997;14:2884–2892.
8. Kitaguchi, Y, Fujikado, T, Bessho, K, et al. Adaptive optics fundus camera to examine localized changes in the photoreceptor layer of the fovea. Ophthalmology. 2008;115:1771–1777.
9. Roorda, A, Romero-Borja, F, Donnelly, W, III. Adaptive optics scanning laser ophthalmoscopy. Optics Express. 2002;10:405–412.
10. Drexler, W, Fujimoto, JG. State-of-the-art retinal optical coherence tomography. Progr Retinal eye res. 2008;27:45–88.
11. Miller, DT, Kocaoglu, OP, Wang, Q, et al. Adaptive optics and the eye (super resolution OCT). Eye (Lond). 2011;25:321–330.
12. Fernández, EJ, Hermann, B, Povazay, B, et al. Ultrahigh resolution optical coherence tomography and pancorrection for cellular imaging of the living human retina. Optics Express. 2008;16:11083–11094.
13. Zawadzki, RJ, Cense, B, Zhang, Y, et al. Ultrahigh-resolution optical coherence tomography with monochromatic and chromatic aberration correction. Optics Express. 2008;16:8126–8143.
14. Poonja, S, Patel, S, Henry, L, et al. Dynamic visual stimulus presentation in an adaptive optics scanning laser ophthalmoscope. J Refract Surg. 2005;21:S575–S580.
15. Vogel, CR, Arathorn, DW, Roorda, A, et al. Retinal motion estimation in adaptive optics scanning laser ophthalmoscopy. Optics Express. 2006;14:487–497.
16. Arathorn, DW, Yang, Q, Vogel, CR, et al. Retinally stabilized cone-targeted stimulus delivery. Optics Express. 2007;15:13731–13744.
17. Miller, DT, Williams, DR, Morris, GM, et al. Images of cone photoreceptors in the living human eye. Vision Res. 1996;36:1067–1079.
18. Roorda, A, Williams, DR. The arrangement of the three cone classes in the living human eye. Nature. 1999;397:520–522.
19. Chui, TY, Song, H, Burns, SA. Individual variations in human cone photoreceptor packing density: variations with refractive error. Invest Ophthalmol Vis Sci. 2008;49:4679–4687.
20. Doble, N, Choi, SS, Codona, JL, et al. In vivo imaging of the human rod photoreceptor mosaic. Optics lett. 2011;36:31–33.
21. Roorda, A, Zhang, Y, Duncan, JL. High-resolution in vivo imaging of the RPE mosaic in eyes with retinal disease. Invest Ophthalmol Vis Sci. 2007;48:2297–2303.
22. Gray, DC, Merigan, W, Wolfing, JI, et al. In vivo fluorescence imaging of primate retinal ganglion cells and retinal pigment epithelial cells. Optics Express. 2006;14:7144–7158.
23. Martin, J, Roorda, A. Direct and noninvasive assessment of parafoveal capillary leukocyte velocity. Ophthalmology. 2005;112:2219–2224.
24. Zhong, Z, Petrig, BL, Qi, X, et al. In vivo measurement of erythrocyte velocity and retinal blood flow using adaptive optics scanning laser ophthalmoscopy. Optics Express. 2008;16:12746–12756.
25. Doble, N. High-resolution, in vivo retinal imaging using adaptive optics and its future role in ophthalmology. Expert Rev Med Devices. 2005;2:205–216.
26. Gray, DC, Wolfe, R, Gee, BP, et al. In vivo imaging of the fine structure of rhodamine-labeled macaque retinal ganglion cells. Invest Ophthalmol Vis Sci. 2008;49:467–473.
27. Wolfing, JI, Chung, M, Carroll, J, et al. High-resolution retinal imaging of cone–rod dystrophy. Ophthalmology. 2006;113:1019.
28. Duncan, JL, Talcott, KE, Ratnam, K, et al. Cone structure in retinal degeneration associated with mutations in the peripherin/RDS gene. Invest Ophthalmol Vis Sci. 2011;52:1557–1566.
29. Duncan, JL, Zhang, Y, Gandhi, J, et al. High-resolution imaging with adaptive optics in patients with inherited retinal degeneration. Invest Ophthalmol Vis Sci. 2007;48:3283–3291.
30. Carroll, J. Adaptive optics retinal imaging: applications for studying retinal degeneration. Arch Ophthalmol. 2008;126:857–858.
31. Talcott, KE, Ratnam, K, Sundquist, SM, et al. Longitudinal study of cone photoreceptors during retinal degeneration and in response to ciliary neurotrophic factor treatment. Invest Ophthalmol Vis Sci. 2011;52:2219–2226.
32. Kitaguchi, Y, Bessho, K, Yamaguchi, T, et al. In vivo measurements of cone photoreceptor spacing in myopic eyes from images obtained by an adaptive optics fundus camera. Jpn J Ophthalmol. 2007;51:456–461.
33. Carroll, J, Neitz, M, Hofer, H, et al. Functional photoreceptor loss revealed with adaptive optics: an alternate cause of color blindness. Proc Natl Acad Sci U S A. 2004;101:8461–8466.
34. Marmor, MF, Choi, SS, Zawadzki, RJ, et al. Visual insignificance of the foveal pit: reassessment of foveal hypoplasia as fovea plana. Arch Ophthalmol. 2008;126:907–913.
35. Joeres, S, Jones, SM, Chen, DC, et al. Retinal imaging with adaptive optics scanning laser ophthalmoscopy in unexplained central ring scotoma. Arch Ophthalmol. 2008;126:543–547.
36. Choi, SS, Zawadzki, RJ, Keltner, JL, et al. Changes in cellular structures revealed by ultra-high resolution retinal imaging in optic neuropathies. Invest Ophthalmol Vis Sci. 2008;49:2103–2119.
37. Ciulla, TA, Regillo, CD, Harris, A. Retina and optic nerve imaging. Philadelphia: Lippincott Williams & Wilkins; 2003.
38. Williamson, TH, Harris, A. Ocular blood flow measurement. Br J Ophthalmol. 1994;78:939–945.
39. Schmetterer, L, Garhofer, G. How can blood flow be measured? Surv Ophthalmol. 2007;52(Suppl 2):S134–S138.
40. Harris, A, Chung, H, Ciulla, T, et al. Progress in measurement of ocular blood flow and relevance to our understanding of glaucoma and age-related macular degeneration. Prog Retin Eye Res. 1999;18:669–687.
41. Keyser, BJ, Flaharty, PM, Sergott, RC, et al. Color Doppler imaging of arterial blood flow in central retinal vein occlusion. Ophthalmology. 1994;101:1357–1361.
42. Ho, AC, Lieb, WE, Flaharty, PM, et al. Color Doppler imaging of the ocular ischemic syndrome. Ophthalmology. 1992;99:1453–1462.
43. Feke, G, Yoshida, A. Laser based instruments for ocular blood flow assessment. J Biomed Optics. 1998;3:415–422.
44. Yoshida, A, Feke, GT, Mori, F, et al. Reproducibility and clinical application of a newly developed stabilized retinal laser Doppler instrument. Am J Ophthalmol. 2003;135:356–361.
45. Sehi, M. Basic technique and anatomically imposed limitations of confocal scanning laser Doppler flowmetry at the optic nerve head level. Acta Ophthalmol. 2011;89:e1–11.
46. Huang, D, Swanson, E, Lin, C, et al. Optical coherence tomography. Science. 1991;254:1178–1181.
47. Mordant, DJ, Al-Abboud, I, Muyo, G, et al. Spectral imaging of the retina. Eye (Lond). 2011;25:309–320.
48. Harris, A, Dinn, RB, Kagemann, L, et al. A review of methods for human retinal oximetry. Ophthalm Surg Lasers Imaging. 2003;34:152–164.
49. Hickam, JB, Sieker, HO, Frayser, R. Studies of retinal circulation and A-V oxygen difference in man. Trans Am Clin Climatol Assoc. 1959;71:34–44.
50. Beach, JM, Schwenzer, KJ, Srinivas, S, et al. Oximetry of retinal vessels by dual-wavelength imaging: calibration and influence of pigmentation. J Appl Physiol. 1999;86:748–758.
51. Hardarson, SH, Harris, A, Karlsson, RA, et al. Automatic retinal oximetry. Invest Ophthalmol Vis Sci. 2006;47:5011–5016.
52. Mordant, DJ, Al-Abboud, I, Muyo, G, et al. Validation of human whole blood oximetry, using a hyperspectral fundus camera with a model eye. Invest Ophthalmol Vis Sci. 2011;52:2851–2859.
53. Schweitzer, D, Hammer, M, Kraft, J, et al. In vivo measurement of the oxygen saturation of retinal vessels in healthy volunteers. IEEE Trans Biomed Eng. 1999;46:1454–1465.
54. Hardarson, SH, Stefánsson, E. Oxygen saturation in central retinal vein occlusion. Am J Ophthalmol. 2010;150:871–875.
55. Hardarson, SH, Stefánsson, E. Oxygen saturation in branch retinal vein occlusion. Acta Ophthalmol. 2011.
56. Hardarson, SH, Gottfredsdottir, MS, Halldorsson, GH, et al. Glaucoma filtration surgery and retinal oxygen saturation. Invest Ophthalmol Vis Sci. 2009;50:5247–5250.
57. Hammer, M, Vilser, W, Riemer, T, et al. Diabetic patients with retinopathy show increased retinal venous oxygen saturation. Graefe’s Arch Clin Exp Ophthalmol. 2009;247:1025–1030.
58. Tiedeman, JS, Kirk, SE, Srinivas, S, et al. Retinal oxygen consumption during hyperglycemia in patients with diabetes without retinopathy. Ophthalmology. 1998;105:31–36.
59. Jiao, S, Jiang, M, Hu, J, et al. Photoacoustic ophthalmoscopy for in vivo retinal imaging. Optics Express. 2010;18:3967–3972.
60. Jiao, S, Xie, Z, Zhang, HF, et al. Simultaneous multimodal imaging with integrated photoacoustic microscopy and optical coherence tomography. Optics Lett. 2009;34:2961–2963.
61. Zhang, HF, Maslov, K, Stoica, G, et al. Functional photoacoustic microscopy for high-resolution and noninvasive in vivo imaging. Nature Biotechnol. 2006;24:848–851.
62. Zhang, X, Jiang, M, Fawzi, AA, et al. Simultaneous dual molecular contrasts provided by the absorbed photons in photoacoustic microscopy. Optics lett. 2010;35:4018–4020.
63. Duong, TQ. Magnetic resonance imaging of the retina: a brief historical and future perspective. Saudi J Ophthalmol. 2011;25:137–143.
64. Duong, TQ, Muir, ER. Magnetic resonance imaging of the retina. Jpn J Ophthalmol. 2009;53:352–367.
65. Li, Y, Cheng, H, Duong, TQ. Blood-flow magnetic resonance imaging of the retina. Neuroimage. 2008;39:1744–1751.
66. Zhang, Y, Wey, HY, Nateras, OS, et al. Anatomical, blood oxygenation level-dependent, and blood flow MRI of nonhuman primate (baboon) retina. Magn Resonance Med. 2011;66:546–554.
67. Zhang, Y, Peng, Q, Kiel, JW, et al. Magnetic resonance imaging of vascular oxygenation changes during hyperoxia and carbogen challenges in the human retina. Invest Ophthalmol Vis Sci. 2011;52:286–291.
68. Zarbin, MA, Montemagno, C, Leary, JF, et al. Nanomedicine in ophthalmology: the new frontier. Am J Ophthalmol. 2010;150:144–162.
69. Nune, SK, Gunda, P, Thallapally, PK, et al. Nanoparticles for biomedical imaging. Expert Opin Drug Deliv. 2009;6:1175–1194.
70. Arvizo, R, Bhattacharya, R, Mukherjee, P. Gold nanoparticles: opportunities and challenges in nanomedicine. Expert Opin Drug Deliv. 2010;7:753–763.
71. Faulk, WP, Taylor, GM. An immunocolloid method for the electron microscope. Immunochemistry. 1971;8:1081–1083.
72. Roth, J. The silver anniversary of gold: 25 years of the colloidal gold marker system for immunocytochemistry and histochemistry. Histochem Cell Biol. 1996;106:1–8.
73. Loo, C, Lin, A, Hirsch, L, et al. Nanoshell-enabled photonics-based imaging and therapy of cancer. Technol Cancer Res Treat. 2004;3:33–40.
74. Gobin, AM, Lee, MH, Halas, NJ, et al. Near-infrared resonant nanoshells for combined optical imaging and photothermal cancer therapy. Nano Lett. 2007;7:1929–1934.
75. Murphy, CJ, Gole, AM, Stone, JW, et al. Gold nanoparticles in biology: beyond toxicity to cellular imaging. Acc Chem Res. 2008;41:1721–1730.
76. Betzig, E, Patterson, GH, Sougrat, R, et al. Imaging intracellular fluorescent proteins at nanometer resolution. Science. 2006;313:1642–1645.