4 Advanced Imaging of Adult Brain Tumors with MRI and PET
Introduction
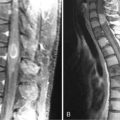
Knowledge of the conventional morphological MRI and CT appearance of brain tumor forms an essential foundation for the interpretation of advanced imaging. Although it is beyond the scope of this chapter, it seems reasonable to bring to the reader’s attention one recent morphologic imaging report that, pending prospective validation, suggests that in anaplastic astrocytoma an expansile growth pattern and lack of enhancement may predict longer survival.1 In addition, this clinical introduction will not review the more than half-century-long literature on MR physics, engineering, and basic tissue physiology that has preceded the recent clinical application of these techniques. This background understanding is not essential for the neurologist, oncologist, or surgeon caring for brain tumor patients, but is critical for the neuroimaging researcher and practitioner. Numerous other advanced MRI techniques are excluded from this review because they have not yet achieved widespread clinical application. Finally, the reader is cautioned that the rapid progress of commercial MRI hardware, software, and clinical literature necessitates frequent reevaluation of the conclusions of this review.
Increasingly widespread research use of advanced brain imaging techniques in humans and animal models is making a great contribution to scientific understanding of brain tumor pathophysiology, to evaluation of new therapies, and in discovery of predictive markers that promise to assist in HGG phenotyping for personalization of therapy. These vital and exciting efforts, should not be confused with the clinical goals of advanced brain tumor imaging, which primarily focus on four issues that present significant challenges for conventional MRI:2 (1) differentiation of primary infiltrative glioma from other primary brain tumors, metastatic tumors, strokes, infection, and tumefactive demyelination; (2) preoperative grading of primary glioma; (3) planning of biopsy, resection, and radiation therapy, including detection of tumor margin; (4) sensitive early detection of recurrence or progression in HGG, with distinction from radiation necrosis. In particular, in the last few years, the problem of detecting recurrence has become far more difficult because of the widespread use of temozolomide. This has increased both the incidence of postradiation enhancement mimicking progression (pseudoprogression) in approximately 20% of treated patients3 and that of angiogenesis inhibitors. The latter appear to alter the pattern of recurrence and progression by decreasing enhancement without definitely prolonging survival.4,5 Advanced MRI aims to address these challenges by characterizing and monitoring the four most important independent pathophysiologic attributes of each individual patient’s brain tumor: (1) hypercellularity, (2) high invasiveness, (3) hypermetabolism, (4) hypervascularity. These four attributes are known as the “4-Hs.” The pathophysiologic heterogeneity of brain tumors makes assessment of all 4-Hs crucial to a modern multiparametric brain tumor characterization. All HGGs have a least one of these attributes, and a few will have all four. Thus assessment of all 4-Hs is essential, at least at baseline.
Diffusion Weighted Imaging (DWI) of Cellularity
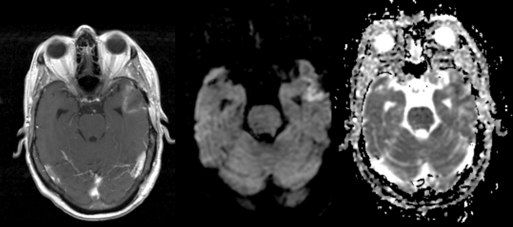
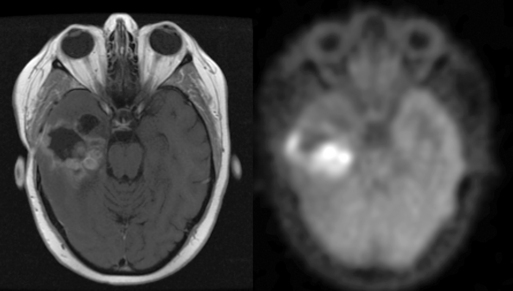
DWI image contrast is based on random thermal diffusion (Brownian motion) of water molecules in each voxel of brain tissue. In bulk water, the movement (diffusion) of a given water molecule is not constrained by boundaries, and the average diffusivity (diffusion per unit time) is proportional to the temperature. At higher temperatures, molecules have greater Brownian motion and therefore have greater diffusivity. In brain, the temperature is constant, and the distance water diffuses during a fixed time is mainly determined by physical constraints to water diffusion at the cellular and subcellular levels. Formally, diffusivity is determined by the fraction of tissue water in the intracellular compartment, where the tightly packed membranes of intracellular organelles hinders the free diffusion of water. In comparison, water in the extravascular extracellular space (EES) has a diffusivity (ADCe) that is an order of magnitude greater than the intracellular diffusivity (ADCi). Since the size of neurons is much smaller than the size of the DWI voxels, the average apparent diffusion coefficient (ADC) of each voxel is primarily influenced by the ratio of extracellular to intracellular water, referred to as the extracellular volume fraction (EVF) or local tissue “cellularity.”6,7 While this oversimplification of a very complex and technically heterogeneous literature may provoke controversy among imaging experts, it is generally accepted as a first approximation. See Figure 4-1.
CELLULARITY IN DIFFERENTIAL DIAGNOSIS
DWI can be crucial in helping to distinguish brain tumor from tumefactive nonneoplastic disorders. The use of DWI in ischemia is well known. This can be of significance in rare cases where mass-like presentations of embolic and vasculitic ischemia are difficult to distinguish from brain tumor.8 In addition, sensitivity and specificity of over 90% are routinely achieved using DWI to distinguish the low ADC of epidermoid (due to the presence of sloughed epithelial cells, cholesterol, and keratin) from the high ADC of pure CSF-containing arachnoid cyst. Similar accuracy is achieved in distinguishing the low ADC of abscess, filled with white blood cells, from the high diffusivity of CSF-filled necrotic tumor cavities. A rim of low diffusivity at the periphery of a lesion may also be helpful in suggesting tumefactive demyelination.9–12
DWI can also be useful in preoperative differential diagnosis of brain tumors. In intra-axial tumors, low ADC suggests that lymphoma, medulloblastoma, or metastasis should be considered; the high cellularity of these lesions typically results in a much lower ADC than for HGG.13,14 Similarly, low diffusivity in extra-axial masses suggests highly cellular meningioma or dural metastasis. Nevertheless, glioblastoma and gliosarcoma cannot be completely excluded; a small number are very cellular and present with a high ADC that overlaps with that of the other tumor types.13,15–17 This illustrates the most important biological insight and, at the same time, the most important caution critical to responsible clinical use of advanced imaging: because HGG genetics, pathophysiology, and imaging phenotypes are so diverse, no single image data subtype can reliably be interpreted in isolation from the other advanced imaging data, conventional imaging data, and clinical history.
CELLULARITY IN TUMOR GRADING AND THERAPEUTIC PLANNING
A number of studies support the correlation of low minimum ADC (ADCmin) with high cellularity in tumors, including low-grade glioma, high-grade glioma, medulloblastoma, lymphoma, meningioma, and metastasis.13,18–22 Lower ADC correlates with atypical and malignant pathologic subtypes of meningioma, but the ADC overlap between low and high grade populations is too great to allow reliable prediction of tumor pathology or behavior in individual patients.21 In part, this seems likely to reflect the importance of vasogenic edema produced by vascular endothelial growth factor (VEGF) secretion and tissue invasion in determining meningioma behavior. Several groups have reported that ADCmin less than 1.7 to 2.5 × 10⁻³ mm2/s within the cellular portion of glioma correlates with high grade.23,24 ADC varies significantly within each grade, especially among HGG.14,23,25–27 In addition to variation in cellularity, variation in the degree of necrosis, hemorrhage, and calcification likely contribute to this finding, as does variation in vascular permeability, related to angiogenesis and secretion of VEGF and other vasoactive paracrine factors. Although this variation reduces the likelihood that DWI alone can reliably predict histopathology, it suggests that ADC or other metrics derived from DWI may help in prediction of response to radiation.28
DWI MONITORING OF THERAPEUTIC RESPONSE
Detection of low ADC at the surgical resection margin on immediate postoperative imaging should suggest marginal ischemic necrosis rather than residual tumor.29,30 While persistently low or decreasing ADC within the cavity or extra-axial space should suggest the possibility of pyogenic infection, the temporal evolution of postoperative hematoma and necrotic debris often produces a complex DWI and ADC appearance, so careful correlation with changes over time in the imaging studies and clinical presentation is essential.31
Beyond detection of these postoperative complications, low ADC offers an independent parameter for predicting malignancy and aggressive behavior in gliomas. In patients whose preoperative MRI demonstrates an atypical MRI pattern, low ADC evidence of high cellularity predicts aggressive clinical behavior and may, in some cases, be a better predictor than histopathology.32 Although published thresholds vary, it has been shown that patients with minimum intratumoral ADC (minADC) less than 1.0 × 10⁻³ mm2/s have a much worse prognosis than those with higher-ADC tumors.33 Because EPI DWI-derived ADC estimates vary greatly with instrument, precise acquisition parameters, and postprocessing, investigations of normalized ADC ratios would seem to be indicated and, indeed, are beginning to be published.
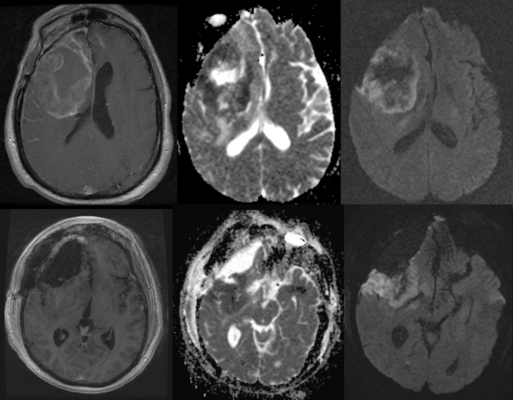
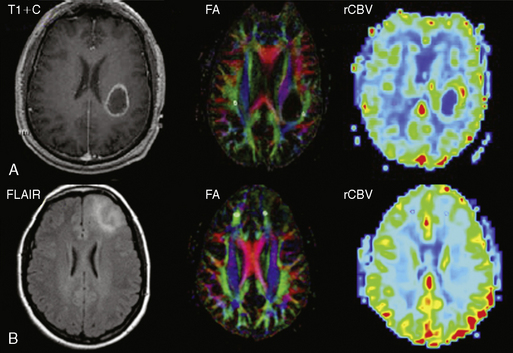
In tumors with high baseline cellularity, such as highly cellular GBM or medulloblastoma, ADC may aid in early detection of treatment response to chemoradiation, as cellularity decreases in response to cytotoxic chemoradiation.19,20,34–37 Because of interscan variation in ADC estimates, normalized ADC ratios (nADC) may prove more robust than absolute ADC measurements in separating radiation necrosis and pseudoprogression from recurrence after XRT. These measures are attracting increasing interest, since ADC in brain tumor seems relatively less affected by steroid use and angiogenesis inhibition than are enhancement, tumor edema, and permeability.38 As suppression of enhancement by angiogenesis inhibition makes follow-up with conventional enhanced imaging less reliable, ADC may offer an important complement to blood volume imaging for longitudinal follow-up. This promise justifies ongoing development of higher b-value and multiple b-value echoplanar (EPI) sequences as well as non-EPI techniques to improve estimates of ADC, estimates of cell volume fraction. and longitudinal registration. “Functional diffusion mapping” is one investigational method of quantifying longitudinal change in ADC, among a number of such methods under study.39,40 See Figure 4-2.
White Matter Invasion Assessment with Diffusion Tensor Imaging (DTI)
DWI, by imaging the motion of water in one to three spatial directions, acquires enough information to estimate the magnitude of random thermal diffusion. DTI acquires information in at least six directions, and completely defines a tensor (three-dimensional vector) describing both the magnitude and direction of water diffusion.41,42 A large number of techniques that acquire many more diffusion directions to much more precisely define local water diffusion direction have been published under various names (q-ball imaging, diffusion spectrum imaging, etc.). Precise detection of the preferred direction of water diffusion is of interest in brain imaging because the myelinated axon bundles assist water diffusion along white matter tracts and prevent water diffusion across the tracts, a tissue property referred to as “anisotropy.” The relative degree of white matter “diffusion anisotropy” in each voxel can be characterized by a number of derived scalar metrics comparing diffusivity in one direction with another, of which the most widely used is termed the fractional anisotropy (FA).
DTI TRACTOGRAPHY FOR SURGICAL GUIDANCE
In conjunction with blood oxygen level dependent (BOLD) functional MRI (fMRI) depiction of sensorimotor, visual, and primary language cortical activation, DTI tractography have evolved into robust techniques for detecting the location of critical white matter tracts that are next to, displaced by, or invaded by tumor, allowing avoidance of operative injury to functional tracts and prediction of postoperative disability that may result from their transection.43–47
DTI Assessment of White Matter Invasion
Interest in imaging the white matter infiltrative component of HGG continues to increase because temozolomide chemoradiation and angiogenesis inhibition have been shown to alter the pattern of recurrence4 by improving control of the enhancing solid component. FLAIR T2WI is very sensitive to the presence of vasogenic edema elicited by microscopic tumor invasion, but does not allow reliable distinction of direct tumor infiltration from peritumoral edema. A number of studies suggest that a decrease in FA or other DTI-derived measures of white matter anisotropy may be a marker for white matter disruption due to local glioma infiltration, as other causes of vasogenic edema would not be expected to actually disrupt white matter tracts. Observation of lower white matter anisotropy near to the high-grade tumor masses was encouraging; this remains an exciting research focus,43 although one not yet ready for translation to clinical use. Reports of widely different results from groups employing different combinations of angular resolution, b-value, and signal-to-noise ratio (SNR) illustrate that acquisition and postprocessing techniques will need to mature before clinical trials demonstrating effective detection of the margins of WM invasion are likely to be successful.27,48–54 Unfortunately, since no effective treatment for infiltrative tumor exists, biopsy of involved white matter is difficult to justify ethically. Many resections are performed with suction, which makes it difficult to track the origin of the tissue; also, no widespread robust method has been developed to correlate tissue with MRI on a millimeter scale. Therefore, human DTI translation research remains hampered by lack of a valid gold standard. A successful alternative strategy has been to use DTI to predict clinical outcome; classification of preoperative glioma margins as infiltrative or expansile by qualitative interpretation of DTI tractography correlates with survival.55 See Figure 4-3.
Another strategy may be to try to demonstrate the efficacy of DTI-derived anisotropy, in combination with ADC, as an early indicator of response or potential survival in patients undergoing chemoradiation.56 Such studies are ongoing using a large number of more sophisticated metrics of white matter coherence. These measures promise to achieve greater sensitivity and specificity by exploiting the tensor directional information from DTI and DSI more fully than simple FA.48,51,57–59
Spectroscopy of Tumor Metabolic Derangement
MR spectroscopy (MRS) and spectroscopic imaging (MRSI) essentially represent in vivo application of nuclear magnetic resonance (NMR). NMR revolutionized analytic chemistry in the 1940s by allowing chemists to nondestructively assay the chemical composition and bond structure of organic molecules. Differences in the spin density of the surrounding electron cloud produce a different degree of magnetic shielding at each chemically unique position in a molecule. This “chemical shift” alters the applied external magnetic field experienced by each proton in a molecule, causing it to precess at a slightly different frequency and emit a slightly different frequency of radio waves when excited. The radiofrequency is detected and plotted on a graph in which the x-axis displays the spectrum of frequencies emitted by the sample in parts per million (ppm) relative to a standard reference, and the y-axis displays the magnitude of each frequency in arbitrary units relative. The use of ppm rather than hertz (Hz) allows spectra acquired at different field strengths to be directly compared.60,61 Different chemical compounds are identified in the spectrum (“assigned”) by recognition of one or more peaks representing the resonance from distinct species of protons in that compound. The spectrum can be acquired from a single voxel (MRS), a two dimensional matrix of voxels from a single slice (2-D MRSI), or a rectangular three-dimensional matrix of voxels (3-D MRSI). MRSI data are sometimes displayed as color “metabolite maps” that give a qualitative impression of the anatomic distribution of the height, area, or ratio of height or area corresponding to important peaks or assigned compounds, but interpretation relies principally on inspection of the graphed spectra.
The most important assigned peaks observed with 1.5 T to 3.0 T in vivo MRS of brain tumor patients are: branch chain amino acids produced by lysosomal catabolism in activated polymorphonuclear leukocytes (PMN) (AA: 0.9–1.0 ppm), lipid products of necrosis (Lip: 0.9–1.5 ppm), lactate from anaerobic glycolysis (Lac: 1.3 ppm), alanine (Ala: 1.5 ppm), n-acetyl aspartate associated with intact neuronal membranes (NAA: 2.0 ppm), choline released during cell membrane synthesis or degradation (Cho: 3.2 ppm), energy storage creatine compounds (Cr: 3.0 ppm and 3.9 ppm) and myoinositol (mI: 3.6 ppm). Lipid and lactate peaks represent a number of compounds with similar structures and so produce broad peaks, and creatine produces two easily detectable peaks corresponding to two chemically nonequivalent species of protons. AA and Lac can be differentiated from the overlapping broad Lip peak, when needed, by acquiring spectra at different TEs, since the protons forming these two peaks precess out of phase with the Lip, NAA, Cr, and Cho peaks. Analysis of these major assigned peaks in brain spectra can provide important information about pathophysiology but not etiology. Decreased NAA is seen with neuronal injury of any cause, and increased Cho with glial growth or injury of any cause; Lac appears with all causes of anaerobic glycolysis, and increased Lip and decreased Cr with all causes of necrosis.62,63,64
Spectroscopy in Differential Diagnosis
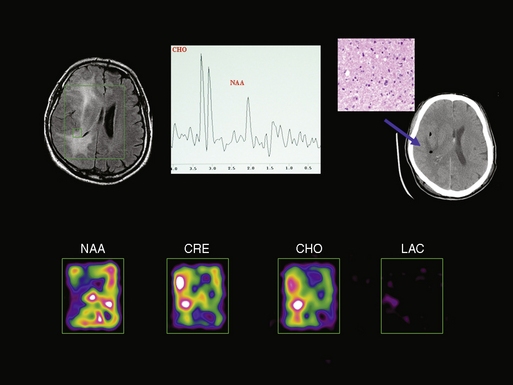
Elevated Cho and decreased NAA with variable occurrence of Lac and Lip represent the typical spectra seen in glioma, but identical abnormal spectra may be seen in ischemia, demyelination, infection, and other pathologies. For this reason, MRS is not generally useful in differential diagnosis of brain masses; however, it has been carefully studied in a number of niche applications, such as distinction of meningioma from dural metastasis and peripheral HGG. All three may have very high Cho, but because meningioma and metastases contain no neurons, the spectra demonstrate no detectable NAA. However, this signature is not definitive, since focal HGG may also contain no detectable NAA. The addition of Lac and Lip in this context favors HGG, but may also occur in metastasis. Similarly, the small ALA peak detected in 80% of meningioma spectra is found in roughly the same proportion of metastases and schwannomas.65 Nevertheless, observation of very high ALA in the context of characteristic PWI, DWI, and basic imaging patterns may help to distinguish meningioma, peripheral GBM, gliosarcoma or other intra-axial tumors. Similarly, extensive clinical research has failed to support early hopes that MRS would help to distinguish tumor from tumefactive ischemia and demyelination.66–69 As noted, the reason for this failure is that the principle peaks in MRS reflect pathophysiology rather than etiology: rapid breakdown of glial membranes in ischemia and demyelination releases as much choline as rapid membrane synthesis in HGG, neuronal injury reduces the NAA peak regardless of the cause, and Lac and Lip derived from anaerobic glycolysis and necrosis are common to many pathologies. Nevertheless, in adult neuroimaging there is one clinically useful application of MRS in differential diagnosis: distinction of bacterial, fungal, or parasitic abscesses from cystic necrosis due to tumor or radiation by detection of the AA peak specific for presence of activated PMNs.10,70 See Figure 4-4.
Spectroscopy in Glioma Grading and Biopsy Guidance
In clinical practice, MRS can help to suggest the presence of high-grade tumor in areas where Cho/NAA peak height ratios (CNR) are greater than 1.5.24,71,72–74 A number of derived semi-quantitative metrics, such as CNR R-values normalized to the contralateral white matter, can be helpful in accounting for anatomic and individual variation of these ratios. One important caution is that higher NAA/Cho ratios are more often found in grade III than in grade IV glioma. For this reason, detection of Lip and Lac evidence of necrosis and anaerobic metabolism in spectra of untreated glioma can add to suspicion of WHO grade IV tumor.24,75 MRS is a particularly useful adjunct to PWI for preoperative grading of oligodendroglioma, since high blood volumes on PWI may be misleading.76–79 Interpretation of MRS in the context of PWI and basic imaging characteristics is critical to avoiding this pitfall.
Targeting metabolically active tissue with high Cho/NAA ratios can decrease rates of “undergrading” and false negatives related to sampling error in biopsy of heterogeneous HGG.80,81 These successes have motivated application of MRS to guide radiosurgery,82–84 and suggest that wider utility may emerge as the automation, speed, resolution, and reproducibility of MRS gradually increases. Unfortunately, confirmation of the utility of MRS for guidance is hampered by the pathologic heterogeneity of HGG, the poor efficacy of current ablative therapies and the intractable problem of obtaining precise correlation with tissue samples.
More recent analyses have shown that whole brain ratios of NAA (WBNAA) may be decreased by up to 30%—far more than can be explained by focally detectable tumor.85 This approach seems particularly timely since whole brain markers of infiltrative tumor burden are becoming a more significant contributor to patient mortality as control of focal recurrence improves. MRS assessment of CH2/CH3 ratios within the lipid spectrum of normal-appearing white matter may offer a complementary nonlocalized tumor burden assay.86
MRS in Posttreatment Monitoring
Differentiation of recurrent or progressive HGG from early radiation effect and chemoradiation necrosis remains difficult, especially because a mixture of both processes is present in many patients. Here again MRS may prove a valuable adjunct to PWI, although its efficacy remains unproven.87 Since Lac and Lip are seen in both processes, observation of these peaks is not sufficient to exclude recurrence unless accompanied by absence of Cho and NAA peaks, or evidence of decreasing Cho over the course of MRSI follow-up. This is particularly convincing if corroborated by increasing ADC and decreasing CBV. Similarly, increasing Cho/NAA ratios over time are a sensitive sign for early tumor recurrence.81,83,88–90 Interpreted in the context of other basic and advanced imaging data, technically meticulous serial MRSI has been shown to be valuable in early detection of tumor recurrence. Unfortunately, because voxel to voxel variation in Cho, NAA, Lac, and Lip at each time point is usually greater than the change in spectra over time, minute differences in technique can render longitudinal comparison invalid. Similarly, very significant errors in interpretation can result from slight errors in MRS or MRSI voxel positioning resulting in accidental inclusion of small amounts of fat from skull marrow; scalp; choroid plexus; dural ossification; magnetic susceptibility artifact from bone or metal; or CSF in ventricles.
Perfusion and Permeability Imaging of Tumor Microvessels
DSC PWI
Although rapid cell division, extensive white matter invasion, and disordered metabolism are important pathophysiologic attributes, the most important attributes of infiltrative glioma biology may be the cooption of existing brain capillaries and the development of neovascularization (and the biological switch between these two states). In particular, the genetic and humoral mechanisms by which HGG induces neovascularization are the target of intensive research and of imaging biomarker, molecular biomarker, and chemotherapeutic agent development.91 Intermediate grade gliomas may produce varying degrees of upregulation of vascular growth factor/receptor signaling—including VEGF, PDGF, EGFR and IL-8 among others—and expression of AQP4 and other aquaporins that disrupt endothelial tight junctions. These factors act directly on existing brain capillaries to increase permeability of the blood-brain barrier (BBB), resulting in varying degrees of edema; they may produce mild contrast enhancement.92 On the other hand, high density, morphologically abnormal, tortuous, high-density neocapillaries are seen nearly exclusively in HGG and often result in markedly elevated local cerebral capillary blood volume (CBV). Because the endothelia of these tumor vessels express very low levels of occludins and other normal cell surface proteins, lack normal pericyte and basal lamina support, and have disordered intercellular tight junctions and large gaps in the neovessel wall, their permeability both to small molecules and to the much larger Gd chelate contrast agents (Gd) is markedly increased.93,94 This combination of abnormal blood volume and permeability is the basis of the oldest “advanced” tumor imaging method—delayed Gd-enhanced T1-weighted imaging. The degree of contrast enhancement reflects an admixture of CBV and permeability. In addition, it is strongly affected by contrast agent dose and imaging delay, making it a less reliable marker of tumor biology than semi-quantitative techniques for independently estimating CBV and permeability: dynamic susceptibility contrast (DSC) perfusion-weighted imaging (PWI) of CBV performed during the first pass of Gd, and DSC PWI dynamic contrast-enhanced (DCE) T1-weighted imaging of permeability (T1P) performed during the first 3 to 5 minutes of Gd recirculation.
First Pass Dynamic Susceptibility Contrast Perfusion Imaging (DSC PWI) of CBV
In DSC PWI a rapid intravenous power injection of Gd produces a concentrated bolus of paramagnetic Gd-infused blood that rapidly decreases tissue signal intensity during continuous fast susceptibility-weighted echoplanar (EPI) whole brain imaging. It should be understood that although Gd chelates are primarily described as T1 relaxation agents, at high concentration, such as during bolus administration, they are also very effective T2* agents. Thus, on first pass imaging in DSC PWI approaches, a time-intensity curve shows loss of signal during the wash-in phase, with recovery of signal demonstrated during wash-out. After estimation of Gd concentration from the dynamic time-intensity curve, the area under the Gd concentration curve during the bolus is computed. This area is proportional to the CBV and is thus referred to as relative CBV (rCBV); it is typically displayed as a color map in which the color of each pixel corresponds to the rCBV in arbitrary units (AU). Absolute quantitation is impractical because of the large number of variables that affect each image acquisition (injection rate, local contrast dose, contrast leakage, patient-MR coil coupling, radiofrequency preamplifier transmitter and receiver gain, etc.), so the measurements are typically normalized to the contralateral normal-appearing white matter (NAWM) producing a semi-quantitative normalized CBV (nCBV) ratio.95,96 Clinical interpretation of CBV maps requires careful quality assurance of the dynamic data in each acquisition to ensure that patient motion, bolus concentration, bolus timing, signal-to-noise ratios, susceptibility artifacts, and partial volume averaging of vessels and cortex do not lead to false positive or false negative interpretation. This involves careful inspection of the source images and time-intensity curves (TIC), window-level adjustment, placement of regions of interest (ROI) for rCBV and nCBV calculation, and correlation with basic MRI images, as well as inspection of the color maps themselves. Visual inspection and correlation with prior anatomic knowledge and basic sequences are essential. Normal gray matter CBV is approximately 2.7 times higher than white matter; therefore, inclusion of gray matter in an ROI or nCBV calculation can result in false positive detection of hypervascular tumor.
DSC PWI Contribution to Differential Diagnosis
Like DWI and MRS, DSC PWI can aid in distinguishing necrotic hypervascular tumor from brain abscess by demonstrating high CBV in the tissue around the cystic cavity.11 Because tumefactive demyelinating lesions, lymphoma, and many histologies of brain metastases have low blood volume on gradient-echo EPI (GE-EPI) DSC PWI, care must be taken to correlate with DWI and anatomical sequences.97–99 In contrast, observation of nCBV > 1.8-2.0 can help confirm the presence of HGG, as high nCBV is not seen in lymphoma, tumefactive demyelination, or abscess (although some cases will fall into the intermediate range).100 Further, although broad overlap between categories limits the clinical utility of these findings, nCBV is significantly higher in malignant than benign meningioma, and differs among histologic meningioma subtypes.101,102 While high nCBV is detected relatively commonly in metastases when GE-EPI DSC PWI technique is used, SE-EPI technique can provide much greater specificity, probably because of its greater selectivity for microvascular blood volume.103 Nevertheless, even GE-EPI PWI-derived nCBV has been shown to help differentiate dural metastasis from meningioma and parenchymal metastasis from HGG.104
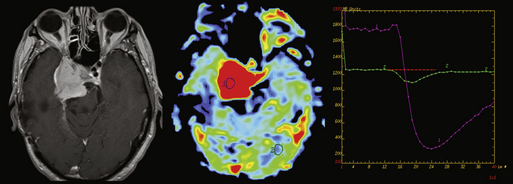
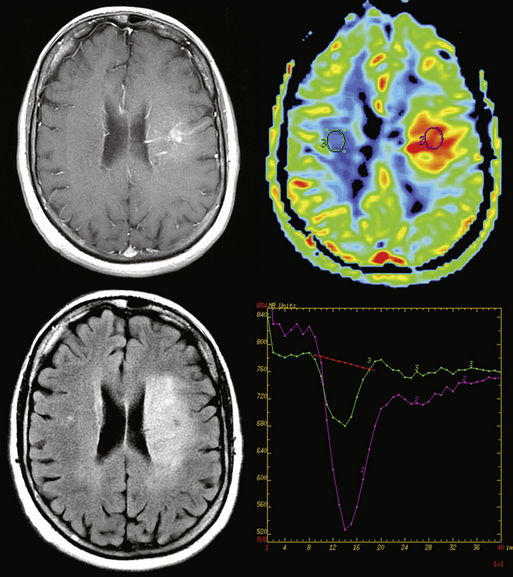
In addition, attention to the shape of the upslope of the TIC in PWI can give a crude qualitative assessment of the degree of contrast leakage from the intravascular space across the BBB during first pass. Lesions with no BBB—generally those derived from nonglial precursors such as meningioma, metastasis, lymphoma, or choroid plexus papilloma/carcinoma—usually have a higher first-pass permeability than HGG, which generates microvessels with grossly impaired but not completely absent BBB. The TIC in an ROI placed inside one of these lesions will often show minimal or no recovery of signal intensity after the minimum point of the TIC, whereas normal brain shows nearly complete recovery of signal intensity to baseline, and HGG, an intermediate degree of recovery. This crude “first-pass permeability” estimate can provide a clue to the nature of some enhancing lesions.14,105–107 When the differential diagnosis of a peripheral-enhancing tumor includes meningioma as well as HGG, or when the differential diagnosis of a periventricular tumor includes choroid plexus papillocarcinoma and GBM, attention to the TIC shape may help with differential diagnosis. See Figures 4-5 and 4-6.
Quantitative assessment of first pass leakage has also been investigated and a DSC PWI-based index of “relative recirculation” (rR) derived by estimating, with a gamma-variate curve, the shape of the curve that would be expected in a normal capillary bed with minimal recirculation and leakage, and subtracting this from the observed TIC. The hypothesis that rR in part reflects the degree of microvascular tortuosity in tumor microvessels is attractive but difficult to establish definitively, and so although rR has been demonstrated to correlate with tumor grade, it remains to be demonstrated that rR imaging provides significant hemodynamic or clinical information independent of better-established measures of CBV and permeability.108,109
Again, attention to DWI and conventional sequences can provide essential supportive evidence of high cellularity, location, and morphology. Likewise, when high nCBV is detected, attention to anatomical imaging morphology provides critical context for PWI interpretation. When a cortically based circumscribed tumor with little associated infiltration is detected, especially if it is coarsely calcified, oligodendroglioma and related low-grade primary brain tumors must be considered, as the “chicken-wire” neo-capillaries of oligodendroglioma have a much higher nCBV for a given grade than does infiltrative glioma.76–79 For this reason, pending advances in clinical use of quantitative PWI, MRS remains important in grading of oligodendroglioma. Similarly, observation of high nCBV in a mural tumor nodule within a circumscribed cyst does not indicate high tumor grade, because histologically benign hemangioblastoma tumor nodules generally have nCBV greater than 6.0.110 In contrast, as is expected for low-grade glioma, mural nodules in WHO grade I pilocytic astrocytoma have been reported to have nCBV less than 1.5.111 Thus, DSC PWI promises to be able to differentiate between these lesions, despite the fact that both have high vascular permeability leading to indistinguishably avid Gd enhancement on conventional imaging and both show an enhancing mural nodule and tumor cyst morphology.112
DSC PWI in Infiltrative Astrocytoma: Preoperative Grading, Prognosis, Treatment Planning and Follow-up
Notwithstanding the caveat discussed above for tumors of other histologies, in astrocytoma, a maximum nCBV within the tumor (nCBVmax) is unequivocally and strongly correlated with histologic grade.113–119 Areas of nCBVmax greater than 1.8 to 2.0 are strongly suggestive of foci of HGG and are an important target for biopsy, resection, or focal ablation.119–121 Furthermore, nCBV has been shown to predict survival in HGG, with nCBV greater than 2.3 correlating with particularly poor outcome.122
In low-grade glioma, an nCBV threshold of 1.8 has been reported to be strongly predictive of survival.123 The similarity of this threshold to published values for distinction of low and high grade tumor suggests the possibility that the effect could be due, at least in part, to identification of a subset of undergraded HGG. This is supported by the observation that increase in nCBV in LGG predicts high-grade transformation as much as a year before gadolinium enhancement.124 Most recently, a retrospective analysis has extended this literature by suggesting that high nCBV with a similar threshold can be used to predict outcome independent of tumor grade.125 Whether PWI nCBV is identifying a subset of LGG patients who are undergraded by standard histopathology because of surgical sampling error or revealing a limitation in the prognostic value of histopathology in LGG, there would seem to be an urgent need for formulation and validation of a combined histopathologic, molecular diagnostic, and advanced imaging-based prognostic sub-classification of glioma.
Use of DSC PWI during longitudinal follow-up to detect recurrence of HGG and distinguish it from chemoradiation effect is technically more challenging because of low spatial resolution, difficulties in longitudinal registration of EPI data, and susceptibility artifacts from blood products and metal that are often present in the postoperative setting. Nevertheless, increase in nCBV has been shown to predict recurrence in HGG following surgery and chemoradiation.126 As might be expected, especially in the setting of high ADC, low nCBV appears to be a useful indicator that recurrent enhancement represents radiation effect rather than recurrent HGG.36,127–129 Because nCBV correlates with angiogenesis, a decrease in nCBV during therapy may also offer a powerful marker of response to angiogenesis inhibition.116,130 Because of the heterogeneity of HGG hypervascularity between and within patients, careful comparison of follow-up PWI to baseline pretherapy and posttherapy time points is critical.120
In addition, careful attention to DSC PWI technique and correlation with steroid and antiangiogenic agent dosing are critical for accurate interpretation. There is evidence from animal models that high-dose steroids decrease CBV as measured by GE-EPI DSC PWI by up to 30% to 50%, but either do not significantly affect, or at some doses may increase CBV as measured by SE-EPI DSC PWI.38,131,132 This difference reflects the greater selectivity of SE-EPI PWI technique for neocapillaries smaller than 10 microns in diameter as compared to GE-EPI PWI technique, which is sensitive both to neocapillaries and to small arterioles and venules larger than 25 microns in diameter. A variant of PWI that exploits this difference by using interleaved gradient echo (GE) and spin echo (SE) echoplanar (EPI) DSC PWI data to semi-quantitatively estimate the relative size and/or density of tumor neovessels has been shown to be clinically practical and to correlate with tumor grade, although at press time it is not yet available as FDA-approved software for clinical scanners.133,134 Preliminary vessel-size imaging reports that both antiangiogenic and steroid therapy may decrease the average size of tumor microvessels, and preliminary reports from small-animal models suggesting equal or greater antiangiogenesis therapy change in nCBV estimated from SE-EPI DSC PWI nCBV suggest that vessel-size imaging and SE-EPI DSC nCBV may offer the most robust and promising surrogate markers for monitoring response to antiangiogenic therapy.130 These issues are not yet fully resolved but merit discussion, as the unequivocal effect of increasingly widespread antiangiogenic therapy to suppress permeability makes traditional Gd-enhanced T1WI ever less reliable for tumor follow-up.38,132,135 Intensive investigation of the effects of antiangiogenic therapy on the interdependent attributes of vessel size, CBV, and permeability in glioma in humans and animals will be required to clarify this critical issue.
Microvascular Permeability Imaging During Recirculation
Gliomas secrete angiogenic peptides and other factors that increase the permeability of the native brain capillary BBB to small molecules and electrolytes, resulting in vasogenic edema. GBM, in addition, induces formation of neovessels with large endothelial defects that allow virtually unimpeded passage of larger molecules including the “low molecular weight” Gd MR contrast agents. This leakage results in signal intensity enhancement on delayed T1-weighted images, which correlates roughly with increased permeability and imperfectly with tumor grade.2 Increased permeability in neovessels is due to abnormal morphology with the presence of large fenestrations in neovascular walls. This mechanism is qualitatively different from that giving rise to increased permeability in co-opted native vessels, which is likely due to the secondary effects of VEGF, also known as vascular permeability factor (VPF). Thus, permeability is a rational marker for tumor grade. Dynamic contrast-enhanced (DCE) T1-weighted permeability (T1P) imaging represents the best-established method of assessing tumor vessel microstructure. T1-weighted images of the whole brain are acquired continuously for 3 to 5 minutes, starting just before arrival of the contrast bolus. In contrast to DSC PWI, in which a decrease in signal intensity on T2*WI due to the initial pass of concentrated intravascular Gd is used to assess MTT, CBF, and CBV, in T1P an increase in signal intensity on T1WI due to the leakage of Gd into the extravascular extracellular space during recirculation is used to assess the pharmacokinetics of BBB integrity. Although many metrics have been derived to characterize permeability, the most widely accepted is the intravascular to extravascular leakage transfer constant [K(trans)] calculated from the two-compartment modeling equation. This is derived from the slope of the T1P TIC, after exclusion of first pass effects and correction for T2* effects, flow, and venous concentration. Other methods and metrics that have been proposed in order to characterize Gd leakage during the first pass of the bolus, rather than the delayed phase, are beyond the scope of this discussion, as their physiologic significance and utility remains unclear. These include controversial estimates of Ktrans derived from DSC PWI data, and measures such as max dI/dt, rR, etc., derived from T1P data.136–139
Permeability for Tumor Grading and Followup
Increase in permeability metrics derived from careful application of established DCE T1P technique correlates well with higher tumor grade,93,136,138–140 although not quite as well as Ncbv.141,142 These two measures are independent143 but strongly correlated,144 probably due to the prominent contribution of high-volume highly leaky tumor neovessels to glioma biology. The optimal combination of T1P and PWI for HGG imaging remains to be determined, but inflammation, ischemia, corticosteroids, chemotherapeutic agents, and radiation seem to affect permeability more directly than blood volume. T1P has not achieved widespread clinical acceptance, despite good evidence of its utility in distinguishing necrosis from tumor recurrence,137,140 because the technique requires longer acquisition time and more complicated postprocessing. As improvements in technique addresses both of these drawbacks, this may change in the years ahead.
Positron Emission Tomography in Brain Tumors
Positron emission tomography (PET) is based on the detection of annihilation photons (see Figure 4-7). An intravenously injected positron-emitting radiotracer distributes in the brain depending on its biochemical properties. The emitted positron combines with a negatively charged electron in tissue, resulting in two 511 keV annihilation photons. These two photons travel in opposite directions and are detected by two of multiple detector elements surrounding the patient. The origin of the annihilation event in the brain can be localized to the line between the two activated detectors, which allows the reconstruction of a three dimensional dataset reflecting the radionuclide concentration in individual brain voxels.
RADIOTRACERS
(18)F-fluorodeoxyglucose (FDG)
FDG is a glucose analogue that is actively transported across the blood-brain barrier (BBB) and phosphorylated within cells. FDG uptake reflects the tissue glucose metabolism and is usually high in high-grade tumors and relatively low in low-grade tumors. A significant drawback of FDG for brain tumor imaging is the high physiological FDG uptake of the brain (in particular of gray matter) resulting in a relatively low tumor-to-background ratio. FDG uptake of WHO II tumors is normally similar to that of white matter, while FDG uptake of WHO III and IV lesions is often less than or similar to that of gray matter.145 FDG uptake is also seen in inflammatory processes, limiting the specificity of FDG for tumor imaging in certain cases.
Amino acid tracers
Amino acid tracers are an emerging alternative to FDG for brain tumor imaging. The more commonly used amino acid tracers for brain tumor imaging are 11C-methionine (MET), 18F-fluoroethyltyrosine (FET) and 18F-fluorodihydroxyphenylalanine (DOPA). Cell uptake of amino acids occurs via carrier-mediated transport mechanisms, which are in general upregulated in malignant cells.146,147 Background uptake of amino acids in normal brain tissue is generally low, resulting in better tumor-to-background contrast as compared to FDG.148 MET has been more extensively investigated, but requires an on-site cyclotron because of the short half-life of 11C (20 minutes). FET and DOPA are labeled with 18F, which has a more favorable halftime of 110 minutes, and are likely to gain wider acceptance because of the lack of requirement for an on-site cyclotron.
Detection of recurrence
FDG is useful for detecting growing high-grade gliomas, but is insensitive for detection of low-grade tumor recurrence because of the often low tumor-to-background contrast.149 Nevertheless, FDG can provide useful information when used in the surveillance of low-grade tumors, as a new finding of high FDG uptake in a known low-grade glioma that previously showed low FDG-avidity is strongly suggestive of anaplastic transformation and has prognostic value.150
Amino acid tracers are a promising means of detection of recurrent brain tumors, in particular for low-grade gliomas because of their higher uptake as compared to normal brain uptake. Amino acid tracer uptake of low-grade and high-grade glioma is generally very similar, and amino acid tracer cannot reliably differentiate low-grade from high-grade tumors. Chen and Silverman compared DOPA to FDG in 81 patients with various brain tumors and demonstrated the superiority of DOPA over FDG for imaging of low-grade tumors and recurrence evaluation, with sensitivity for DOPA of 98% and specificity of 86%.151
Differentiation of recurrence from treatment effects
A particularly challenging clinical question is the differentiation of tumor progression and/or recurrence from the benign changes that follow multi-modality treatment. PET has been considered a promising modality, overcoming the limited specificity of MRI for this distinction. The first study, including five patients, reported in 1982 that FDG PET was able to reliably distinguish between radiation necrosis and recurrent glioma.152 Subsequent studies at first supported the accuracy of FDG.153,154 More recent studies have been less favorable; the specificity of FDG was reported to be as low as 40% and comparable to the specificity of 201Thallium-SPECT.155 The low FDG specificity might be explained by FDG uptake in inflammatory cells in radiation necrosis. The importance of co-registering FDG images with MRI for more accurate interpretation has been emphasized.156
There has been hope that amino acid tracers might improve the specificity of PET in the differentiation of recurrence from treatment-related changes, based on the good tumor-to-background contrast and the assumption that amino acid tracer uptake is upregulated in neoplasm and to a much lesser degree in inflammatory processes. In a recent study, Terakawa et al. evaluated PET with MET in 77 patients with glioma or metastatic brain tumor and found a sensitivity and specificity of 75% for MET.157 The false-positive cases showed high uptake of MET in necrotic tissue; previous reports have raised the concern that the value of MET is limited in cases of disrupted blood-brain barrier.158
Very promising results have been published for PET using FET in selected patients with MRI-based suspicion of glioma. A sensitivity of 92% and specificity of 100% have been reported, with that specificity being superior to conventional MRI.159–161 A recently published prospective study that included 31 patients with glioma and suspicion for recurrence based on MRI and FET-PET found a positive predictive value of FET for recurrence of 84%.162 The conclusion was made that the positive predictive value of FET-PET is high, but not quite high enough to replace stereotactic biopsy.
Summary
The past few years have seen an explosion in the ability of advanced MRI and PET techniques to directly image elements of brain tumor pathophysiology and genetics including the critical HGG attributes of hypercellularity, hypoxia, necrosis, white matter invasion, neoangiogenesis, and induced microvessel permeability. The pace of basic tumor imaging research continues to accelerate, and the advent of disease-altering chemotherapy is demanding clinical translation of advanced techniques. Even today, novel computer-assisted image analysis, data-reduction, and multiparametric classification systems are desperately needed to allow full exploitation of the imaging data explosion. The most important hindrance to widespread clinical translation and validation of these techniques is the fact that current advanced imaging sequences are EPI-based. EPI-based sequences suffer from susceptibility artifacts, low spatial resolution, and anatomic distortion that decrease reproducibility and require meticulous attention for valid reliable longitudinal and quantitative use. Furthermore, the most widely used and easily implemented method for quantitation—the hot spot method—is subject to well documented problems with reproducibility and bias. Nevertheless, as the use of these new techniques to differentiate between genetically-valid tumor subcategories and, especially, to predict prognosis and treatment response, is validated, a profound revision of the current brain tumor classification and treatment algorithms may be underway.116,119,163,164 With careful correlation with basic imaging, multimodality physiologic brain tumor imaging can play an important complementary role to histopathology and molecular markers in guiding brain tumor diagnosis and therapy.
1. H.D. Moulding, D.P. Friedman, M. Curtis, L. Kenyon, A.E. Flanders, S.H. Paek, et al. Revisiting anaplastic astrocytomas I: an expansive growth pattern is associated with a better prognosis. J Magn Reson Imaging. 2008;28(6):1311-1321.
2. L.E. Ginsberg, G.N. Fuller, M. Hashmi, et al. The significance of lack of MR contrast enhancement of supratentorial brain tumors in adults: histopathological evaluation of a series. Surg Neurol. 1998;49(4):436-440.
3. D. Brandsma, L. Stalpers, W. Taal, P. Sminia, M.J. van den Bent. Clinical features, mechanisms, and management of pseudoprogression in malignant gliomas. Lancet Oncol. 2008;9(5):453-461. Review
4. A.D. Norden, G.S. Young, K. Setayesh, A. Muzikansky, R. Klufas, G.L. Ross, et al. Bevacizumab for recurrent malignant gliomas: efficacy, toxicity, and patterns of recurrence. Neurology. 2008;70(10):779-787.
5. J. Dietrich, A.D. Norden, P.Y. Wen. Emerging antiangiogenic treatments for gliomas—efficacy and safety issues. Curr Opin Neurol. 2008;21(6):736-744.
6. J. Provenzale, S. Mukundan, D.P. Barboriak. Diffusion-weighted and Perfusion MR Imaging for Brain Tumor Characterization and Assessment of Treatment Response. Radiology. 2006;239(3):632-649.
7. Y. Mardor, R. Pfeffer, R. Spiegelmann, et al. Early detection of response to radiation therapy in patients with brain malignancies using conventional and high b-value diffusion-weighted magnetic resonance imaging. J Clin Oncol. 2003;21:1094-1100.
8. E.S. Molly, L.H. Calabrese. Tumor-like mass lesion (ML): an under-recognized presentation of primary angiitis of the central nervous system (PACNS). Arthritis Rheum. 2006;54:486.
9. J.S. Reddy, A.M. Mishra, S. Behari, et al. The role of diffusion-weighted imaging in the differential diagnosis of intracranial cystic mass lesions: a report of 147 lesions. Surg Neurol. 2006;66(3):246-250.
10. A.M. Mishra, R.K. Gupta, R.S. Jaggi, et al. Role of diffusion-weighted imaging and in vivo proton magnetic resonance spectroscopy in the differential diagnosis of ring-enhancing intracranial cystic mass lesions. J Comput Assist Tomogr. 2004;28(4):540-547.
11. C. Erdogan, B. Hakyemez, N. Yildirim, et al. Brain abscess and cystic brain tumor: discrimination with dynamic susceptibility contrast perfusion-weighted MRI. J Comput Assist Tomogr. 2005;29(5):663-667.
12. E.Y. Tsui, W.H. Leung, J.H. Chan, et al. Tumefactive demyelinating lesions by combined perfusion-weighted and diffusion weighted imaging. Comput Med Imaging Graph. 2002;26(5):343-346.
13. A.C. Guo, T.J. Cummings, R.C. Dash, et al. Lymphomas and high-grade astrocytomas: comparison of water diffusibility and histologic characteristics. Radiology. 2002;224:177-183.
14. C. Calli, O. Kitis, N. Yunten, et al. Perfusion and diffusion MR imaging in enhancing malignant cerebral tumors. Eur J Radiol. 2006;58(3):394-403.
15. K. Okamoto, J. Ito, K. Ishikawa, et al. Diffusion-weighted echo-planar MR imaging in differential diagnosis of brain tumors and tumor-like conditions. Eur Radiol. 2000;10:1342-1350.
16. C.H. Toh, Y.L. Chen, T.C. Hsieh, et al. Glioblastoma multiforme with diffusion-weighted magnetic resonance imaging characteristics mimicking primary lymphoma. Case report. J Neurosurg. 2006;105:132-135.
17. K. Krabbe, P. Gideon, P. Wagn, et al. MR diffusion imaging of human intracranial tumours. Neuroradiology. 1997;39(7):483-489.
18. A.L. Kotsenas, T.C. Roth, W.K. Manness, et al. Abnormal diffusion-weighted MRI in medulloblastoma: does it reflect small cell histology? Pediatr Radiol. 1999;29(7):524-526.
19. T.L. Chenevert, L.D. Stegman, J.M. Taylor, et al. Diffusion magnetic resonance imaging: an early surrogate marker of therapeutic efficacy in brain tumors. J Natl Cancer Inst. 2000;92(24):2029-2036.
20. T.L. Chenevert, P.E. McKeever, B.D. Ross. Monitoring early response of experimental brain tumors to therapy using diffusion magnetic resonance imaging. Clin Cancer Res. 1997;3(9):1457-1466.
21. C.G. Filippi, M.A. Edgar, A.M. Ulug, et al. Appearance of meningiomas on diffusion-weighted images: correlating diffusion constants with histopathologic findings. AJNR Am J Neuroradiol. 2001;22(1):65-72.
22. Y. Hayashida, T. Hirai, S. Morishita, et al. Diffusion-weighted imaging of metastatic brain tumors: comparison with histologic type and tumor cellularity. AJNR Am J Neuroradiol. 2006;27(7):1419-1425.
23. T. Sugahara, Y. Korogi, M. Kochi, et al. Usefulness of diffusion-weighted MRI with echo-planar technique in the evaluation of cellularity in gliomas. J Magn Reson Imaging. 1999;9:53-60.
24. I. Catalaa, R. Henry, W.P. Dillon, et al. Perfusion, diffusion and spectroscopy values in newly diagnosed cerebral gliomas. NMR Biomed. 2006;19(4):463-475.
25. D. Yang, Y. Korogi, T. Sugahara, et al. Cerebral gliomas: prospective comparison of multivoxel 2D chemical-shift imaging proton MR spectroscopy, echoplanar perfusion and diffusion-weighted MRI. Neuroradiology. 2002;44:656-666.
26. N. Bulakbasi, M. Kocaoglu, F. Ors, et al. Combination of single-voxel proton MR spectroscopy and apparent diffusion coefficient calculation in the evaluation of common brain tumors. AJNR Am J Neuroradiol. 2003;24:225-233.
27. M. Castillo, J.K. Smith, L. Kwock, et al. Apparent diffusion coefficients in the evaluation of high-grade cerebral gliomas. AJNR Am J Neuroradiol. 2001;22:60-64.
28. Y. Mardor, Y. Roth, A. Ochershvilli, et al. Pretreatment prediction of brain tumors’ response to radiation therapy using high b-value diffusion-weighted MRI. Neoplasia. 2004;6(2):136-142.
29. R.B. Khan, P.H. Gutin, S.N. Rai, et al. Use of diffusion weighted magnetic resonance imaging in predicting early postoperative outcome of new neurological deficits after brain tumor resection. Neurosurgery. 2006;59(1):60-66.
30. J.S. Smith, S. Cha, M.C. Mayo, M.W. McDermott, A.T. Parsa, S.M. Chang, et al. Serial diffusion-weighted magnetic resonance imaging in cases of glioma: distinguishing tumor recurrence from postresection injury. J Neurosurg. 2005;103(3):428-438.
31. P.W. Schaefer, P.E. Grant, R.G. Gonzalez. Diffusion-weighted MR imaging of the brain. Radiology. 2000;217:331-345.
32. J.M. Baehring, W.L. Bi, S. Bannykh, J.M. Piepmeier, R.K. Fulbright. Diffusion MRI in the early diagnosis of malignant glioma. J Neurooncol. 2007;82(2):221-225.
33. R. Murakami, T. Sugahara, H. Nakamura, T. Hirai, M. Kitajima, Y. Hayashida, et al. Malignant supratentorial astrocytoma treated with postoperative radiation therapy: prognostic value of pretreatment quantitative diffusion-weighted MR imaging. Radiology. 2007;243(2):493-499.
34. P.A. Hein, C.J. Eskey, J.F. Dunn, et al. Diffusion-weighted imaging in the follow-up of treated high-grade gliomas: tumor recurrence versus radiation injury. AJNR Am J Neuroradiol. 2004;25:201-209.
35. Y.L. Chan, D.K. Yeung, S.F. Leung, et al. Diffusion-weighted magnetic resonance imaging in radiation-induced cerebral necrosis. Apparent diffusion coefficient in lesion components. J Comput Assist Tomogr. 2003;27(5):674-680.
36. E.Y. Tsui, J.H. Chan, R.G. Ramsey, et al. Late temporal lobe necrosis in patients with nasopharyngeal carcinoma: evaluation with combined multi-section diffusion weighted and perfusion weighted MR imaging. Eur J Radiol. 2001;39(3):133-138.
37. M.I. Schubert, M. Wilke, S. Müller-Weihrich, D.P. Auer. Diffusion-weighted magnetic resonance imaging of treatment-associated changes in recurrent and residual medulloblastoma: preliminary observations in three children. Acta Radiol. 2006;47(10):1100-1104.
38. M.E. Bastin, T.K. Carpenter, P.A. Armitage, et al. Effects of dexamethasone on cerebral perfusion and water diffusion in patients with high-grade glioma. AJNR Am J Neuroradiol. 2006;27(2):402-408.
39. B.A. Moffat, T.L. Chenevert, T.S. Lawrence, et al. Functional diffusion map: a noninvasive MRI biomarker for early stratification of clinical brain tumor response. Proc Natl Acad Sci U S A. 2005;102(15):5524-5529.
40. D.A. Hamstra, T.L. Chenevert, B.A. Moffat, et al. Evaluation of the functional diffusion map as an early biomarker of time-to-progression and overall survival in high-grade glioma. Proc Natl Acad Sci U S A. 2005;102(46):16759-16764.
41. T. Inoue, K. Ogasawara, T. Beppu, et al. Diffusion tensor imaging for preoperative evaluation of tumor grade in gliomas. Clin Neurol Neurosurg. 2005;107(3):174-180.
42. A.S. Field, Y.C. Wu, A.L. Alexander. Principal diffusion direction in peritumoral fiber tracts: Color map patterns and directional statistics. Ann N Y Acad Sci. 2005;1064:193-201.
43. E. Goebell, J. Fiehler, X.Q. Ding, et al. Disarrangement of fiber tracts and decline of neuronal density correlate in glioma patients—a combined diffusion tensor imaging and 1H-MR spectroscopy study. AJNR Am J Neuroradiol. 2006;27(7):1426-1431.
44. C.S. Yu, K.C. Li, Y. Xuan, et al. Diffusion tensor tractography in patients with cerebral tumors: a helpful technique for neurosurgical planning and postoperative assessment. Eur J Radiol. 2005;56(2):197-204.
45. C. Nimsky, P. Grummich, A.G. Sorensen, et al. Visualization of the pyramidal tract in glioma surgery by integrating diffusion tensor imaging in functional neuronavigation. Zentralbl Neurochir. 2005;66(3):133-141.
46. M. Lazar, A.L. Alexander, P.J. Thottakara, et al. White matter reorganization after surgical resection of brain tumors and vascular malformations. AJNR Am J Neuroradiol. 2006;27(6):1258-1271.
47. T. Schonberg, P. Pianka, T. Hendler, et al. Characterization of displaced white matter by brain tumors using combined DTI and fMRI. Neuroimage. 2006;30(4):1100-1111.
48. J.M. Provenzale, P. McGraw, P. Mhatre, et al. Peritumoral brain regions in gliomas and meningiomas: investigation with isotropic diffusion-weighted MR imaging and diffusion-tensor MR imaging. Radiology. 2004;232(2):451-460.
49. S.J. Price, N.G. Burnet, T. Donovan, et al. Diffusion tensor imaging of brain tumours at 3 T: a potential tool for assessing white matter tract invasion? Clin Radiol. 2003;58:455-462.
50. S. Lu, D. Ahn, G. Johnson, et al. Peritumoral diffusion tensor imaging of highgrade gliomas and metastatic brain tumors. AJNR Am J Neuroradiol. 2003;24:937-941.
51. S. Lu, D. Ahn, G. Johnson, et al. Diffusion-tensor MR imaging of intracranial neoplasia and associated peritumoral edema: introduction of the tumor infiltration index. Radiology. 2004;232(1):221-228.
52. I.C. Chiang, Y.T. Kuo, C.Y. Lu, et al. Distinction between high-grade gliomas and solitary metastases using peritumoral 3-T magnetic resonance spectroscopy, diffusion, and perfusion imagings. Neuroradiology. 2004;46:619-627.
53. K. Kono, Y. Inoue, K. Nakayama, et al. The role of diffusion-weighted imaging in patients with brain tumors. AJNR Am J Neuroradiol. 2001;22:1081-1088.
54. T.W. Stadnik, C. Chaskis, A. Michotte, et al. Diffusion-weighted MR imaging of intracerebral masses: comparison with conventional MR imaging and histologic findings. AJNR Am J Neuroradiol. 2001;22:969-976.
55. X. Guan, S. Lai, J. Lackey, J. Shi, U. Techavipoo, H.D. Moulding, et al. Revisiting anaplastic astrocytomas II: further characterization of an expansive growth pattern with visually enhanced diffusion tensor imaging. J Magn Reson Imaging. 2008;28(6):1322-1336.
56. P.C. Sundgren, X. Fan, P. Weybright, et al. Differentiation of recurrent brain tumor versus radiation injury using diffusion tensor imaging in patients with new contrast-enhancing lesions. Magn Reson Imaging. 2006;24(9):1131-1142.
57. B. Stieltjes, M. Schluter, B. Didinger, et al. Diffusion tensor imaging in primary brain tumors: reproducible quantitative analysis of corpus callosum infiltration and contralateral involvement using a probabilistic mixture model. Neuroimage. 2006;31(2):531-542.
58. X.J. Zhou, N.E. Leeds, A.J. Kumar, et al. Differentiation of Tumor Recurrence from Treatment-Induced Necrosis Using Quantitative Diffusion MRI. Proceedings ISMRM. 2001:726.
59. D. van Westen, J. Latt, E. Englund, et al. Tumor extension in high-grade gliomas assessed with diffusion magnetic resonance imaging: values and lesion-to-brain ratios of apparent diffusion coefficient and fractional anisotropy. Acta Radiol. 2006;47(3):311-319.
60. I. Marshall, J. Wardlaw, J. Cannon, et al. Reproducibility of metabolite peak areas in 1 H MRS of brain. Magn Reson Imaging. 1996;14(3):281-292.
61. J.A. Calvar. Accurate (1)H tumor spectra quantification from acquisitions without water suppression. Magn Reson Imaging. 2006;24(9):1271-1279.
62. D.L. Birken, W.H. Oldendorf. N-acetyl-L-aspartic acid: a literature review of a compound prominent in 1H-NMR spectroscopic studies of brain. Neurosci Biobehav Rev. 1989;13(1):23-31.
63. J.R. Moffett, B. Ross, P. Arun, et al. N-Acetylaspartate in the CNS: From neurodiagnostics to neurobiology. Prog Neurobiol. 2007;81(2):89-131.
64. M. Wyss, R. Kaddurah-Daouk. Creatine and creatinine metabolism. Physiol Rev. 2000;80(3):1107-1213.
65. Y.D. Cho, G.H. Choi, S.P. Lee, et al. (1)H-MRS metabolic patterns for distinguishing between meningiomas and other brain tumors. Magn Reson Imaging. 2003;21(6):663-672.
66. W. Gajewicz, W. Papierz, W. Szymczak, et al. The use of proton MRS in the differential diagnosis of brain tumors and tumor like processes. Med Sci Monit. 2003;9(9):MT97-M105.
67. M.C. Preul, Z. Caramanos, D.L. Collins, et al. Accurate, noninvasive diagnosis of human brain tumors by using proton magnetic resonance spectroscopy. Nat Med. 1996;2:323-325.
68. A. Del Sole, A. Falini, L. Ravasi, et al. Anatomical and biochemical investigation of primary brain tumours review. Eur J Nucl Med. 2001;28(12):1851-1872.
69. S. Delorme, M.A. Weber. Applications of MRS in the evaluation of focal malignant brain lesions. Cancer Imaging. 2006;22(6):95-99.
70. P.H. Lai, J.T. Ho, W.L. Chen, et al. Brain abscess and necrotic brain tumor: discrimination with proton MR spectroscopy and diffusion-weighted imaging. AJNR Am J Neuroradiol. 2002;23(8):1369-1377.
71. A. Devos, L. Lukas, J.A. Suykens, et al. Classification of brain tumours using short echo time 1H MR spectra. J Magn Reson. 2004;170:164-175.
72. M. Law, S. Yang, H. Wang, et al. Glioma grading: sensitivity, specificity, and predictive values of perfusion MR imaging and proton MR spectroscopic imaging compared with conventional MR imaging. AJNR Am J Neuroradiol. 2003;24(10):1989-1998.
73. N. Fayed, H. Morales, P.J. Modrego, et al. Contrast/Noise ratio on conventional MRI and choline/creatine ratio on proton MRI spectroscopy accurately discriminate low-grade from high-grade cerebral gliomas. Acad Radiol. 2006;13(6):728-737.
74. J. Chen, S.L. Huang, T. Li, et al. In vivo research in astrocytoma cell proliferation with 1H-magnetic resonance spectroscopy: correlation with histopathology and immunohistochemistry. Neuroradiology. 2006;48(5):312-318.
75. X. Li, D.B. Vigneron, S. Cha, et al. Relationship of MR-derived lactate, mobile lipids, and relative blood volume for gliomas in vivo. AJNR Am J Neuroradiol. 2005;26(4):760-769.
76. M.D. Jenkinson, T.S. Smith, K. Joyce, et al. MRS of oligodendroglial tumors: correlation with histopathology and genetic subtypes. Neurology. 2005;64(12):2085-2089.
77. M.L. White, Y. Zhang, P. Kirby, T.C. Ryken. Can tumor contrast enhancement be used as a criterion for differentiating tumor grades of oligodendrogliomas? Am J Neuroradiol. 2005;26:784-790.
78. M.H. Lev, Y. Ozsunar, J.W. Henson, et al. Glial tumor grading and outcome prediction using dynamic spin-echo MR susceptibility mapping compared with conventional contrast-enhanced MR: confounding effect of elevated rCBV of oligodendrogliomoas [sic]. Am J Neuroradiol. 2004;25:214-221.
79. M. Xu, S.J. See, W.H. Ng, et al. Comparison of magnetic resonance spectroscopy and perfusion-weighted imaging in presurgical grading of oligodendroglial tumors. Neurosurgery. 2005;56:919-924.
80. W. Gajewicz, P. Grzelak, M. Gorska-Chrzastek, et al. The usefulness of fused MRI and SPECT images for the voxel positioning in proton magnetic resonance spectroscopy and planning the biopsy of brain tumors: presentation of the method. Neurol Neurochir Pol. 2006;40(4):284-290.
81. W.A. Hall, A. Martin, H. Liu, et al. Improving diagnostic yield in brain biopsy: coupling spectroscopic targeting with real-time needle placement. J Magn Reson Imaging. 2001;13(1):12-15.
82. G.S. Payne, M.O. Leach. Applications of magnetic resonance spectroscopy in radiotherapy treatment planning. Br J Radiol. 2006;79(Special Issue 1):S16-S26.
83. E.E. Graves, S.J. Nelson, D.B. Vigneron, et al. A preliminary study of the prognostic value of 1H-spectroscopy in gamma knife radiosurgery of recurrent malignant gliomas. Neurosurgery (Baltimore). 2000;46:319-328.
84. E.E. Graves, A. Pirzkall, S.J. Nelson, et al. Registration of magnetic resonance spectroscopic imaging to computed tomography for radiotherapy treatment planning. Med Phys. 2001;28:2489-2496.
85. B.A. Cohen, E.A. Knopp, H. Rusinek, et al. Assessing global invasion of newly diagnosed glial tumors with whole-brain proton MR spectroscopy. AJNR Am J Neuroradiol. 2005;26(9):2170-2177.
86. L. Matulewicz, M. Sokol, J. Wydmanski, et al. Could lipid CH2/CH3 analysis by in vivo 1 H MRS help in differentiation of tumor recurrence and post-radiation effects? Folia Neuropathol. 2006;44(2):116-124.
87. M. Chernov, M. Hayashi, M. Izawa, et al. Differentiation of the radiation-induced necrosis and tumor recurrence after gamma knife radiosurgery for brain metastases: importance of multi-voxel proton MRS. Minim Invasive Neurosurg. 2005;48(4):228-234.
88. E.E. Graves, S.J. Nelson, D.B. Vigneron, et al. Serial proton MR spectroscopic imaging of recurrent malignant gliomas after gamma knife radiosurgery. AJNR. 2001;2:613-624.
89. M. Plotkin, J. Eisenacher, H. Bruhn, et al. 123I-IMT SPECT and 1 H MR-spectroscopy at 3.0 T in the differential diagnosis of recurrent or residual gliomas: a comparative study. J Neurooncol. 2004;70(1):49-58.
90. W. Hollingworth, L.S. Medina, R.E. Lenkinski, et al. A systematic literature review of magnetic resonance spectroscopy for the characterization of brain tumors. AJNR Am J Neuroradiol. 2006;27(7):1404-1411. Review
91. B. Kaur, C. Tan, D.J. Brat, et al. Genetic and hypoxic regulation of angiogenesis in gliomas. J Neurooncol. 2004;70(2):229-243. Review
92. P.S. Manoonkitiwongsa, R.L. Schultz, E.F. Whitter, et al. Contraindications of VEGF-based therapeutic angiogenesis: effects on macrophage density and histology of normal and ischemic brains. Vascul Pharmacol. 2006;44(5):316-325.
93. S. Liebner, A. Fischmann, G. Rascher, et al. Claudin-1 and claudin-5 expression and tight junction morphology are altered in blood vessels of human glioblastoma multiforme. Acta Neuropathol (Berl). 2000;100(3):323-331.
94. D.C. Davies. Blood-brain barrier breakdown in septic encephalopathy and brain tumours. J Anat. 2002;200(6):639-646. Review
95. T. Nakagawa, R. Tanaka, S. Takeuchi, et al. Haemodynamic evaluation of cerebral gliomas using XeCT. Acta Neurochir (Wien). 1998;140(3):223-233.
96. J.P. Muizelaar, P.P. Fatouros, M.L. Schroder. A new method for quantitative regional cerebral blood volume measurements using computed tomography. Stroke. 1997;28(10):1998-2005.
97. M. Essig, M. Waschkies, F. Wenz, et al. Assessment of brain metastases with dynamic susceptibility-weighted contrast-enhanced MR imaging: initial results. Radiology. 2003;228(1):193-199.
99. S. Kremer, S. Grand, C. Remy, et al. Contribution of dynamic contrast MR imaging to the differentiation between dural metastasis and meningioma. Neuroradiology. 2004;46(8):642-648.
100. S. Cha, S. Pierce, E.A. Knopp, G. Johnson, C. Yang, A. Ton, et al. Dynamic contrast-enhanced T2*-weighted MR imaging of tumefactive demyelinating lesions. AJNR Am J Neuroradiol. 2001;22(6):1109-1116.
101. H. Zhang, L.A. Rödiger, T. Shen, J. Miao, M. Oudkerk. Perfusion MR imaging for differentiation of benign and malignant meningiomas. Neuroradiology. 2008;50(6):525-530.
102. H. Zhang, L.A. Rödiger, T. Shen, J. Miao, M. Oudkerk. Preoperative subtyping of meningiomas by perfusion MR imaging. Neuroradiology. 2008;50(10):835-840.
103. G.S. Young, K. Setayesh. Spin-Echo Echo-Planar Perfusion MR Imaging in the Differential Diagnosis of Solitary Enhancing Brain Lesions: Distinguishing Solitary Metastases from Primary Glioma. AJNR Am J Neuroradiol. 2008.
104. S. Kremer, S. Grand, C. Rémy, B. Pasquier, A.L. Benabid, S. Bracard, et al. Contribution of dynamic contrast MR imaging to the differentiation between dural metastasis and meningioma. Neuroradiology. 2004;46(8):642-648.
105. S. Yang, M. Law, D. Zagzag. Dynamic contrast-enhanced perfusion MR imaging measurements of endothelial permeability: differentiation between atypical and typical meningiomas. AJNR Am J Neuroradiol. 2003;24:1554-1559.
106. M. Hartmann, S. Heiland, I. Harting, et al. Distinguishing of primary cerebral lymphoma from high-grade gliomas with perfusion-weighted magnetic resonance imaging. Neurosci Lett. 2003;338:119-122.
107. N. Rollin, J. Guyotat, N. Streichenberger, et al. Clinical relevance of diffusion and perfusion magnetic resonance imaging in assessing intra-axial brain tumors. Neuroradiology. 2006;48(3):150-159.
108. A. Kassner, D.J. Annesley, X.P. Zhu, et al. Abnormalities of the contrast re-circulation phase in cerebral tumors demonstrated using dynamic susceptibility contrast-enhanced imaging: a possible marker of vascular tortuosity. J Magn Reson Imaging. 2000;11:103-113.
109. A. Jackson, A. Kassner, X.P. Zhu, K.L. Li. Reproducibility of T2* blood volume and vascular tortuosity maps in cerebral gliomas. J Magn Reson Imaging. 2001;14:510-516.
110. Neuroradiology, 49. 2007;7:5. B. Hakyemez, C. Erdogan, N. Bolca, N. Yildirim, G. Gokalp, M. Parlak. Evaluation of different cerebral mass lesions by perfusion-weighted MR imaging. J Magn Reson Imaging. 2006 Oc;24(4):817-824.
111. S.D. Grand, S. Kremer, I.M. Tropres, D.M. Hoffmann, S.J. Chabardes, V. Lefournier, et al. Perfusion-sensitive MRI of pilocytic astrocytomas: initial results. Neuroradiology. 2007;49(7):545-550.
112. F. Bing, S. Kremer, L. Lamalle, S. Chabardes, A. Ashraf, B. Pasquier, et al. Value of perfusion MRI in the study of pilocytic astrocytoma and hemangioblastoma: Preliminary findings. J Neuroradiol. 2008. Oct 17—Abstract only (Article in French)
113. B. Hakyemez, C. Erdogan, I. Ercan, et al. High-grade and low-grade gliomas: differentiation by using perfusion MR imaging. Clin Radiol. 2005;60(4):493-502.
114. E.A. Knopp, S. Cha, G. Johnson, et al. Glial neoplasms: dynamic contrast-enhanced T2*-weighted MR imaging. Radiology. 1999;211:791-798.
115. T. Sugahara, Y. Korogi, M. Kochi, et al. Correlation of MR imaging-determined cerebral blood volume maps with histologic and angiographic determination of vascularity of gliomas. AJR Am J Roentgenol. 1998;171:1479-1486.
116. A.C. Maia, S.M. Malheiros, A.J. da Rocha, et al. MR cerebral blood volume maps correlated with vascular endothelial growth factor expression and tumor grade in nonenhancing gliomas. AJNR Am J Neuroradiol. 2005;26(4):777-783.
117. J.H. Shin, H.K. Lee, B.D. Kwun, et al. Using relative cerebral blood flow and volume to evaluate the histopathologic grade of cerebral gliomas: preliminary results. AJR Am J Roentgenol. 2002;179(3):783-789.
118. H.J. Aronen, I.E. Gazit, D.N. Louis, et al. Cerebral blood volume maps of gliomas: comparison with tumor grade and histologic findings. Radiology. 1994;191(1):41-51.
119. C. Chaskis, T. Stadnik, A. Michotte, et al. Prognostic value of perfusion-weighted imaging in brain glioma: a prospective study. Acta Neurochir (Wien). 2006;148(3):277-285. comment 285
120. J.M. Lupo, S. Cha, S.M. Chang, et al. Dynamic susceptibility-weighted perfusion imaging of high-grade gliomas: characterization of spatial heterogeneity. AJNR Am J Neuroradiol. 2005;26(6):1446-1454.
121. A.C. Maia, S.M. Malheiros, A.J. da Rocha, et al. Stereotactic biopsy guidance in adults with supratentorial nonenhancing gliomas: role of perfusion-weighted magnetic resonance imaging. J Neurosurg. 2004;101(6):970-976.
122. T. Hirai, R. Murakami, H. Nakamura, M. Kitajima, H. Fukuoka, A. Sasao, et al. Prognostic value of perfusion MR imaging of high-grade astrocytomas: long-term follow-up study. AJNR Am J Neuroradiol. 2008;29(8):1505-1510.
123. M. Law, S. Oh, J.S. Babb, E. Wang, M. Inglese, D. Zagzag, et al. Low-grade gliomas: dynamic susceptibility-weighted contrast-enhanced perfusion MR imaging—prediction of patient clinical response. Radiology. 2006;238(2):658-667.
124. N. Danchaivijitr, A.D. Waldman, D.J. Tozer, C.E. Benton, G. Brasil Caseiras, P.S. Tofts, et al. Low-grade gliomas: do changes in rCBV measurements at longitudinal perfusion-weighted MR imaging predict malignant transformation? Radiology. 2008;247(1):170-178.
125. M. Law, R.J. Young, J.S. Babb, N. Peccerelli, S. Chheang, M.L. Gruber, et al. Gliomas: predicting time to progression or survival with cerebral blood volume measurements at dynamic susceptibility-weighted contrast-enhanced perfusion MR imaging. Radiology. 2008;247(2):490-498.
126. S. Cha, E.A. Knopp, G. Johnson, et al. Dynamic contrast-enhanced T2-weighted MR imaging of recurrent malignant gliomas treated with thalidomide and carboplatin. AJNR Am J Neuroradiol. 2000;21:881-890.
127. E.Y. Tsui, J.H. Chan, T.W. Leung, et al. Radionecrosis of the temporal lobe: dynamic susceptibility contrast MRI. Neuroradiology. 2000;42(2):149-152.
128. T. Siegal, R. Rubinstein, T. Tzuk-Shina, et al. Utility of relative cerebral blood volume mapping derived from perfusion magnetic resonance imaging in the routine follow up of brain tumors. J Neurosurg. 1997;86(1):22-27.
129. T. Sugahara, Y. Korogi, S. Tomiguchi, et al. Posttherapeutic intraaxial brain tumor: the value of perfusion-sensitive contrast-enhanced MR imaging for differentiating tumor recurrence from nonneoplastic contrast-enhancing tissue. AJNR Am J Neuroradiol. 2000;21(5):901-909.
130. C.C. Quarles, K.M. Schmainda. Assessment of the morphological and functional effects of the anti-angiogenic agent SU11657 on 9 L gliosarcoma vasculature using dynamic susceptibility contrast MRI. Magn Reson Med. 2007;57(4):680-687.
131. M.A. Badruddoja, H.G. Krouwer, S.D. Rand, K.J. Rebro, A.P. Pathak. Schmainda KM. Antiangiogenic effects of dexamethasone in 9 L gliosarcoma assessed by MRI cerebral blood volume maps. Neuro Oncol. 2003;5(4):235-243.
132. I.D. Wilkinson, D.A. Jellineck, D. Levy, et al. Dexamethasone and enhancing solitary cerebral mass lesions: alterations in perfusion and blood-tumor barrier kinetics shown by magnetic resonance imaging. Neurosurgery. 2006;58(4):640-646.
133. K.M. Schmainda, S.D. Rand, A.M. Joseph, R. Lund, B.D. Ward, A.P. Pathak, et al. Characterization of a first-pass gradient-echo spin-echo method to predict brain tumor grade and angiogenesis. AJNR Am J Neuroradiol. 2004;25(9):1524-1532.
134. V.G. Kiselev, R. Strecker, S. Ziyeh, O. Speck, J. Hennig, Vessel size imaging in humans. Magn Reson Med, 53. 2005;3:553-563. J.H. Jensen, H. Lu, M. Inglese. Microvessel density estimation in the human brain by means of dynamic contrast-enhanced echo-planar imaging. J Magn Reson Med.. 2006 No;56(5):1145-1150.
135. L. Ostergaard, F.H. Hochberg, J.D. Rabinov, et al. Early changes measured by magnetic resonance imaging in cerebral blood flow, blood volume, and blood-brain barrier permeability following dexamethasone treatment in patients with brain tumors. J Neurosurg. 1999;90(2):300-305.
136. H.C. Roberts, T.P. Roberts, S. Ley, et al. Quantitative estimation of microvascular permeability in human brain tumors: correlation of dynamic Gd-DTPA-enhanced MR imaging with histopathologic grading. Acad Radiol. 2002;9(1, Suppl 1):S151-S155.
137. J.D. Hazle, E.F. Jackson, D.F. Schomer, et al. Dynamic imaging of intracranial lesions using fast spin-echo imaging: differentiation of brain tumors and treatment effects. J Magn Reson Imaging. 1997;7(6):1084-1093.
138. H. Uematsu, M. Maeda, N. Sadato, et al. Vascular permeability: quantitative measurement with double-echo dynamic MR imaging-theory and clinical application. Radiology. 2000;214:912-917.
139. H.C. Roberts, T.P.L. Roberts, R.C. Brasch, et al. Quantitative measurement of microvascular permeability in human brain tumors achieved using dynamic contrast-enhanced MR imaging: correlation with histologic grade. AJNR Am J Neuroradiol. 2000;21:891-899.
140. J.M. Provenzale, G.R. Wang, T. Brenner, et al. Comparison of permeability in high-grade and low-grade brain tumors using dynamic susceptibility contrast MR imaging. AJR Am J Roentgenol. 2002;178:711-716.
141. M. Law, S. Yang, J.S. Babb, et al. Comparison of cerebral blood volume and vascular permeability from dynamic susceptibility contrast enhanced perfusion MR imaging with glioma grade. AJNR Am J Neuroradiol. 2003;25:746-755.
142. M. Law, R. Young, J. Babb, et al. Comparing perfusion metrics obtained from a single compartment versus pharmacokinetic modeling methods using dynamic susceptibility contrast-enhanced perfusion MR imaging with glioma grade. AJNR Am J Neuroradiol. 2006;27(9):1975-1982.
143. A. Jackson, A. Kassner, D. Annesley-Williams, et al. Abnormalities in the recirculation phase of contrast agent bolus passage in cerebral gliomas: comparison with relative blood volume and tumor grade. AJNR Am J Neuroradiol. 2002;23(1):7-14.
144. J.M. Provenzale, G. York, M.G. Moya, et al. Correlation of relative permeability and relative cerebral blood volume in high-grade cerebral neoplasms. AJR Am J Roentgenol. 2006;187(4):1036-1042.
145. W. Chen, D.H. Silverman. Advances in Evaluation of Primary Brain Tumors. Semin Nucl Med. 2008;38(4):240-250.
146. K.J. Isselbacher. Sugar and amino acid transport by cells in culture: differences between normal and malignant cells. N Engl J Med. 1972;286:929-933.
147. H. Busch, J.R. Davis, G.R. Honig, D.C. Anderson, P.V. Nair, W.L. Nyhan. The uptake of a variety of amino acids into nuclear proteins of tumors and other tissues. Cancer Res. 1959;19:1030-1039.
148. P.L. Jager, W. Vaalburg, J. Pruim, E.G. de Vries, K.J. Langen, D.A. Piers. Radiolabeled amino acids: basic aspects and clinical applications in oncology. J Nucl Med. 2001;42(3):432-445.
149. W. Chen, D.H. Silverman. Advances in Evaluation of Primary Brain Tumors. Semin Nucl Med. 2008;38(4):240-250.
150. O. De Witte, M. Levivier, P. Violon, et al. Prognostic value of positron emission tomography with 18F. Fluoro-2-D-glucose in the low-grade glioma. J Neurosurg. 1996;39:470-477.
151. W. Chen, D.H.S. Silverman, S. Delaloye, et al. 18F-FDOPA PET imaging of brain tumors: Comparison study with 18F-FDG PET and evaluation of diagnostic accuracy. J Nucl Med. 2006;47:904-911.
152. N.J. Patronas, G. Di Chiro, R.A. Brooks, R.L. DeLaPaz, P.L. Kornblith, B.H. Smith, et al. Work in progress: [18F] fluorodeoxyglucose and positron emission tomography in the evaluation of radiation necrosis of the brain. Radiology. 1982;144(4):885-889.
153. E.E. Kim, S.K. Chung, T.P. Haynie, C.G. Kim, B.J. Cho, D.A. Podoloff, et al. Differentiation of residual or recurrent tumors from post-treatment changes with F-18 FDG PET. Radiographics. 1992;12(2):269-279.
154. G. Di Chiro, E. Oldfield, D.C. Wright, D. De Michele, D.A. Katz, N.J. Patronas, et al. Cerebral necrosis after radiotherapy and/or intraarterial chemotherapy for brain tumors: PET and neuropathologic studies. AJR Am J Roentgenol. 1988;150(1):189-197.
155. D. Kahn, K.A. Follett, D.L. Bushnell, M.A. Nathan, J.G. Piper, M. Madsen, et al. Diagnosis of recurrent brain tumor: value of 201Tl SPECT vs 18F-fluorodeoxyglucose PET. AJR Am J Roentgenol. 1994;163(6):1459-1465.
156. S.T. Chao, J.H. Suh, S. Raja, S.Y. Lee, G. Barnett. The sensitivity and specificity of FDG PET in distinguishing recurrent brain tumor from radionecrosis in patients treated with stereotactic radiosurgery. Int J Cancer. 2001;96(3):191-197.
157. Y. Terakawa, N. Tsuyuguchi, Y. Iwai, K. Yamanaka, S. Higashiyama, T. Takami, et al. Diagnostic accuracy of 11C-methionine PET for differentiation of recurrent brain tumors from radiation necrosis after radiotherapy. J Nucl Med. 2008;49(5):694-699.
158. U. Roelcke, E.W. Radü, K. von Ammon, O. Hausmann, R.P. Maguire, K.L. Leenders. Alteration of blood-brain barrier in human brain tumors: comparison of [18F] fluorodeoxyglucose, [11C] methionine and rubidium-82 using PET. J Neurol Sci. 1995;132(1):20-27.
159. G. Pöpperl, C. Gotz, W. Rachinger, et al. Value of O-(2-[18F] fluoroethyl)-L-tyrosine PET for the diagnosis of recurrent glioma. Eur J Nucl Med Mol Imaging. 2004;31:1464-1470.
160. G. Pöpperl, C. Götz, W. Rachinger, O. Schnell, F.J. Gildehaus, J.C. Tonn, et al. Serial O-(2-[(18)F] fluoroethyl)-L-tyrosine PET for monitoring the effects of intracavitary radioimmunotherapy in patients with malignant glioma. Eur J Nucl Med Mol Imaging. 2006;33(7):792-800.
161. W. Rachinger, C. Goetz, G. Popperl, et al. Positron emission tomography with O-(2-[18F]fluoroethyl)-L-tyrosine versus magnetic resonance imaging in the diagnosis of recurrent gliomas. Neurosurgery. 2005;57:505-511.
162. J.H. Mehrkens, G. Pöpperl, W. Rachinger, J. Herms, K. Seelos, K. Tatsch, et al. The positive predictive value of O-(2-[18F] fluoroethyl)-L-tyrosine (FET) PET in the diagnosis of a glioma recurrence after multimodal treatment. J Neurooncol. 2008;88(1):27-35.
163. M. Preusser, C. Haberler, J.A. Hainfellner. Malignant glioma: neuropathology and neurobiology. Wien Med Wochenschr. 2006;156(11–12):332-337. Review
164. M. Law, S. Oh, J.S. Babb, et al. Low-grade gliomas: dynamic susceptibility-weighted contrast-enhanced perfusion MR imaging—prediction of patient clinical response. Radiology. 2006;238(2):658-667.