CHAPTER 19 Acute lymphoblastic leukemia/lymphoma and mixed phenotype acute leukemias
Introduction
Acute leukemias are clonal malignant diseases of early hematopoietic progenitor cells. The lymphoblastic forms (acute lyphoblastic leukemia, ALL) are characterized by homogeneous blast cell populations. The accurate diagnosis and classification of acute lymphoblastic and mixed phenotype acute leukemias requires multiple diagnostic techniques1 including:
Acute lymphoblastic leukemia/lymphoma
Clinical presentation
Symptoms may be of abrupt onset, or more insidiously, occurring over a period of weeks or even months. Patients usually present clinical signs of BM failure. Tiredness and pallor are induced by anemia. Infections are linked to the underlying neutropenia. Purpura, bruising or gum bleeding are related to thrombocytopenia. Fever may be present, and half of affected children have bony pain. Differential diagnosis will include infections, immune diseases, macrophage disorders, congenital BM diseases, aplastic anemia and secondary infiltration of other tumors.2 Less commonly, lymphadenopathy, splenic or liver involvement, the symptoms associated with a mediastinal mass or CNS disease may be the presenting features of ALL. Rarely, testicular or other tumor-forming presentation may be the first sign of the disease.
Most patients present with anemia and/or thrombocytopenia. Approximately 25% of patients have a leukocyte count of <5 × 10⁹/l, 50% between 5 and 50 × 109/l, and 25% >50 × 109/l. Leukocyte counts >100 × 109/l may lead to leukostasis and should be treated as a medical emergency.3 High blast counts are more commonly found in T-ALL patients.
At the time of diagnosis the BM is usually hypercellular, with replacement of normal hematopoiesis by the blast cells. Rare patients present marrow hypoplasia, before developing a typical leukemic picture.4 Such patients may improve spontaneously or respond transiently to aplasia-directed immunosuppressive treatment before leukemia becomes apparent.
The term lymphoblastic lymphoma (LBL) is used when the disease is confined to an extramedullary infiltrate with no or minimal involvement of PB and BM. Patients with T-LBL constitute above 90% of LBL cases and usually present with signs associated with a mediastinal mass.5 Patients with B-LBL often present skin or head and neck lesions and are usually asymptomatic.
Classification
The French-American-British (FAB) classification of acute lymphoblastic leukemia introduced in 1976 was based on morphology alone and recognized three types of blast cells in ALL, namely: small homogeneous blasts with round nuclei and scanty cytoplasm (L1), larger blasts with irregular nuclei, prominent nucleoli and more abundant cytoplasm (L2) and basophilic cells with prominent cytoplasmic vacuoles (L3).6 The L3 type included most cases previously termed B-ALL and expressing surface-immunoglobulin (SIg). However, some other types of ALL, particularly those with t(1;19), could also present with this cytology. The morphological FAB classification did not have any clinical significance.
The WHO classification in 2001 largely adopted the 1994 revised European–American classification of lymphoid neoplasms (REAL).7 Thus, the WHO classification recognized precursor T- and B-cell neoplasms corresponding to ALL, but excluded cases with the t(8;14)(q24;q32), (and the rarer variants with t(2;8)(p12;q24) and t(8;22)(q24;q11)), which have undergone immunoglobulin gene rearrangement and express surface immunoglobulins. These cases correspond to leukemic presentation of Burkitt’s lymphoma, which in the WHO system was classified with mature B-cell neoplasms. Such cases, if present with peripheral blood involvement, were termed Burkitt cell leukemia.
In the WHO 2008 classification, B-cell lymphoblastic leukemia/lymphomas are defined as neoplasms of precursor cells committed to B-lineage.1 They include B-ALL and B-LBL and are further subdivided by the presence or absence of specific recurring cytogenetic abnormalities (Table 19.1). The following cytogenetic entities have been recognized in B-lymphoblastic leukemia/lymphoma: t(9;22)(q34;q11), t(1;19)(q23;p13), t(12;21)(p12;q22), t(various;11q23 rearranged), hyperdiploid ALL, hypodiploid ALL and B-lymphoblastic leukemia/lymphoma not otherwise specified (NOS). T-lymphoblastic leukemia/lymphomas are defined as neoplasms of precursor cells committed to the T-lineage and include T-ALL and T-LBL.
Table 19.1 WHO 2008 classification of precursor lymphoid neoplasms
Cytology, cytochemistry and histopathology
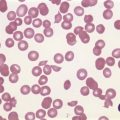
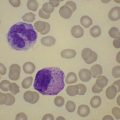
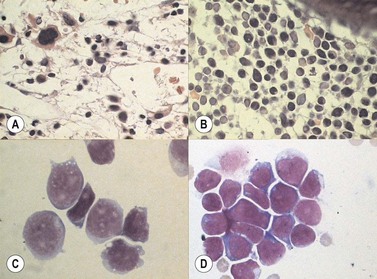
The morphology of lymphoid blasts should be evaluated on well-prepared May–Grünewald–Giemsa or Romanowsky-stained smears of PB or BM. Cytological appearance is variable (Fig. 19.1). In most cases, the blasts are small to medium-sized with round nuclei and fine but densely packed homogeneous chromatin. Nucleoli are small and usually single or absent. In some patients, blasts can have rather condensed chromatin making distinction from chronic lymphocytic leukemia difficult. The cytoplasm is scanty and weakly basophilic. Cytoplasmic vacuoles may be present. In 10–15% of cases, blasts are larger, with irregular nuclei showing clefting or indentation. Nucleoli are more prominent, often large and occasionally multiple. The cytoplasm is relatively abundant and may be finely reticulated. Basophilia is variable. Scanty azurophil granules are rarely present and usually readily distinguished from granules in myeloid precursors but sometimes similar to those of large granular lymphocytes. A ‘hand-mirror’ variant has been described but is probably of no clinical significance.8
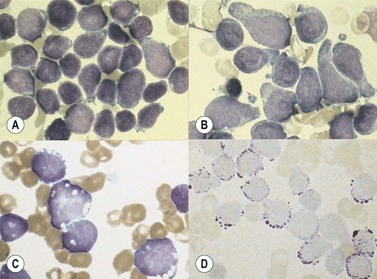
There are no discriminant diagnostic cytochemical stains that distinguish ALL. Lymphoblasts are negative when stained for myeloperoxidase. Very rarely, coarse granular or globular positivity with Sudan Black B may be present. T-lineage ALL frequently shows localized or polar staining of acid phosphatase, but these appearances are not specific. The periodic acid-Schiff (PAS) reaction is useful in identifying lymphoblasts, which usually show fine granules or blocks of positivity (Fig. 19.1). These are found in up to 95% of cases, although they may be very rare, occurring in less than 1% of blasts. The distinctive feature of positivity in lymphoblasts is the absence of any diffuse PAS cytoplasmic staining, which is present in myeloid lineage cells. Lymphoblasts show a clear-glass cytoplasm in which positive granules and blocks are sharply defined. Neutrophils stain strongly and serve as an internal control for the quality of the PAS stain.
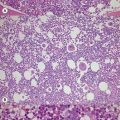
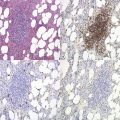
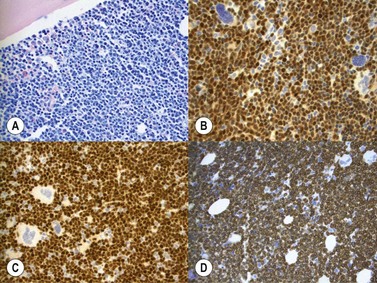
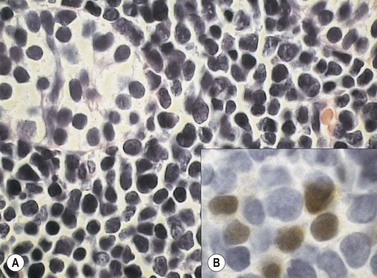
Marrow trephine biopsies usually show maximal cellularity due to the diffuse invasion of sinuses by blast cells (Fig. 19.2A). The lymphoblastic population is usually homogeneous. In the majority of cases, the cells are small with scanty cytoplasm. Nuclei show finely stippled chromatin, often with peripheral condensation. Nucleoli are small and seldom multiple. A minority of cases show larger cells with irregular nuclei and increased cytoplasm. T-lineage ALL may show some degree of nuclear irregularity, and the nuclei may be small and hyperchromatic. Varying degrees of reticulin fibrosis (reversible on successful treatment) may be present in more than half the cases, which can lead to ‘dry-tap’ aspirations of BM. This is more common in B-lineage compared to T-lineage ALL and has been shown to be of poor prognostic significance.9 Areas of marrow necrosis, usually patchy, but occasionally extensive, may be present, and can delay diagnosis if no circulating blasts are present. Cases presenting as aplastic anemia (Fig. 19.3A, B) may show a degree of reticulin fibrosis not generally seen in true aplasia, and are usually of common-B-lineage ALL phenotype. If no material has been submitted for flow cytometry, immunophenotyping can be performed on bone marrow biopsy using antibodies to terminal deoxynucleotidyl transferase (TdT), PAX-5 to show B-cell lineage and CD3 to show T-cell lineage (Fig. 19.2B, C, D).
At both presentation or relapse, almost any organ system can be infiltrated by leukemia (Fig. 19.3D). The CNS (Fig. 19.3C) and the testis (Fig. 19.4) are favored sites of relapse.
Immunophenotypic diagnosis
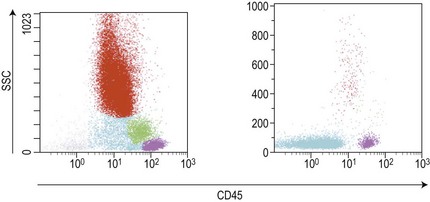
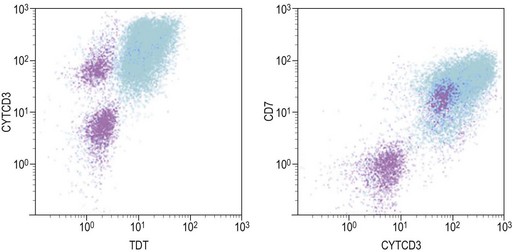
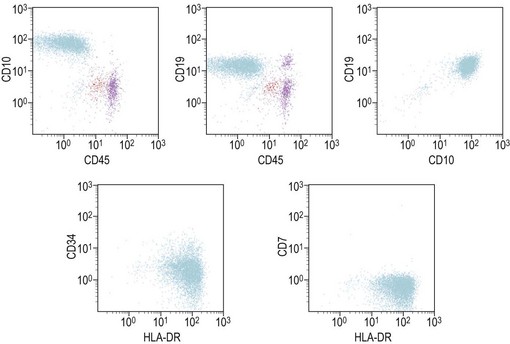
Similar to morphology, the immunophenotypic study of suspected acute leukemia cases is an essential component of diagnosis, allowing further definition of the lineage and maturation stage of blast cells. Immunophenotyping results by flow cytometry can be obtained within a few hours after sampling and are very important in the first stages of therapy initiation. Even if the initial (cytologic) investigations strongly suggest a diagnosis of ALL, a comprehensive immunophenotyping should be carried out, including non-lymphoid lineage markers to exclude undifferentiated acute myeloid leukemia or mixed phenotype acute leukemia (MPAL). Multiparameter flow cytometry on whole BM or PB has now become the standard procedure. A sound strategy should make use of CD45-gating combined with the side scatter (SSC) signal of flow cytometry, which allows to better identify the blast population. In most ALL cases, blasts display low CD45 expression and low SSC characteristics (Fig. 19.5). There is currently no recommended set of immunophenotyping combinations, but a mandatory panel of markers has been proposed by the European Leukemia Net (www.leukemia-net.org). The best orientation combination towards B-lineage, T-lineage or myeloid lineage leukemia relies on the intracytoplasmic detection of relevant antigens. Concomitant labeling, after permeabilization, for cytoplasmic CD79a, CD3 and myeloperoxidase will usually display positivity for only one of these markers, therefore pointing at the relevant lineage. However, in some cases of T-ALL/LBL a weak expression of cytoplasmic CD79a has been reported.10,11 Nuclear labeling for TdT may further differentiate between precursor (positive) and mature (negative) lymphoproliferations (Fig. 19.6). This step should be followed or accompanied by extensive cell surface marker investigation.
B-cell lymphoblastic leukemia/lymphoma (B-LBL)
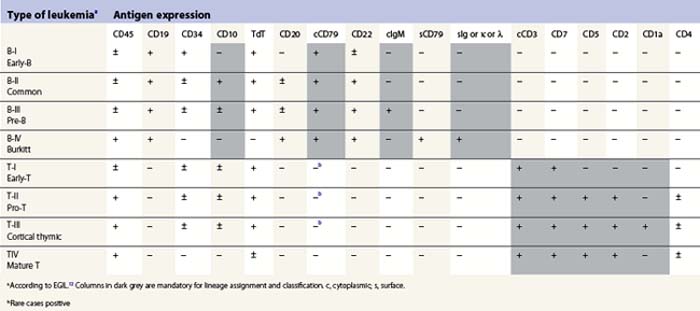
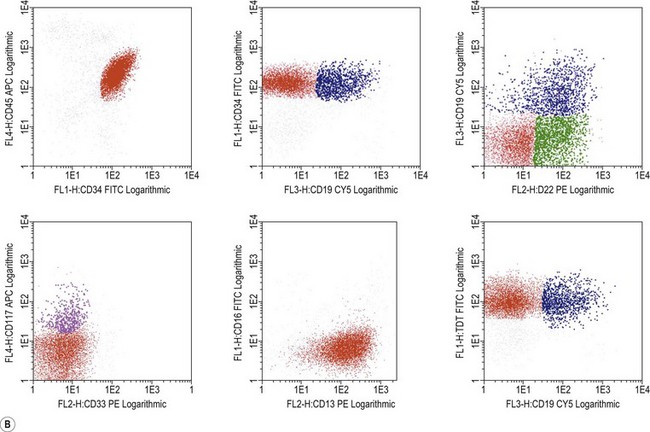
The maturation steps of normal B-precursor cells in the bone marrow have been well characterized immunophenotypically, mostly through extensive analyses of leukemias. The initial step of stem-cell committment towards the B-lineage is characterized by the surface expression of CD19 and intracytoplasmic expression of CD79, which will be ultimately used to carry the B-cell receptor (or surface immunoglobulin, SIg) towards the cell membrane. This is followed by transient expression of CD22 in the cytoplasm and acquisition of CD20 and CD21. An ectopeptidase expressed on most childhood ALLs and thus initially dubbed common-acute lymphoblastic leukemia antigen or cALLA (CD10) is then present transiently. During these steps, the immunoglobulin heavy (IgH) chain genes begin rearranging in order to customize the future variable (V) domain of the IgH. Once a functional rearrangement has been acquired, the new gene is transcribed together with the adjacent constant domains of the µ-chain (IgM heavy chain) and translates in cytoplasmic µ-chains characteristic of the pre-B stage. A transient pre-BCR can then be detected on the surface of the cell, and rearrangement of Ig light chains genes begin until a functional VJ rearrangement gives rise to a potential new variable light chain domain. Both heavy and light chains are then translated and the cell expresses whole immunoglobulins with the newly defined specificity, together with surface CD79. A peculiar long transcript allows such cells to co-express µ and δ-chains of the same specificity as surface IgM and IgD. These naive cells are dubbed ‘µδ‘. According to that scheme, the European Group for Immunophenotyping of Leukemia (EGIL) proposed in 1995, to classify B-lineage ALL according to the order of appearance of CD10, cµ and sIg, into four classes dubbed B-I (or pro-pro-B), B-II (pro-B or common-B), B-IIII (or pre-B) and B-IV (or mature B)12 (Table 19.2). The latter can be identified either by the presence of surface µ-chains or cytoplasmic expession of a light chain (either κ or λ, defining the proliferating clone). Besides these classification markers, B-lineage ALLs often retain expression of the stem-cell marker CD34 and HLA-DR (Fig. 19.7). They may also express the activation markers CD38 and CD71, and co-expression of the myeloid markers CD33, CD13, CD15 of CD65 may be seen. CD10-negative B-I and B-III cases have been shown to have a worse prognosis than B-II ALL. Co-expression of myeloid antigens was previously considered of poor prognosis probably due to overrepresentation of cases with t(9;22). Myeloid markers remain a good indicator of cytogenetic anomalies and are potentially useful in studies of minimal residual disease (MRD) (see below). Investigation for the expression of targets to therapeutic monoclonal antibodies is strongly recommended before initiating such treatment schedules.
T-cell lymphoblastic leukemia/lymphoma (T-LBL)
The maturation of T-cells is initiated in the bone marrow but undergoes its terminal and most crucial stages in the thymus. Committed T-lineage progenitors also begin expressing in their cytoplasm the CD3 complex, later to be used to carry the rearranged T-cell receptor on the cell surface. The expression of CD3 is usually investigated using antibodies directed to the epsilon chain of the CD3 complex. While still in the bone marrow, T-lineage cells first express CD7. However, this molecule may also be displayed on cells engaged in myeloid differentiation. It seems that microenvironmental signals can revert the differentiation of early progenitors (usually co-expressing CD34 and HLA-Class II) towards T-lineage or myeloid lineage, indicating some residual plasticity of these cells. Shortly after CD7 expression, CD5 and CD2 appear on the cell surface signing the end of medullary maturation and migration of the cells towards the thymic epithelium. In normal T-cell differentiation, cortical thymocytes begin transiently expressing CD1a and rearranging the T-cell receptor (TCR). This series of rearrangements will first involve the γ (G) chain of the γδ (D) receptor, and then, in case of failure, proceed towards αβ rearrangements. This important feature explains why TCRG and TCRD rearrangements are good clonality markers. After losing CD1a, the maturing T-cells briefly co-express CD4 and CD8. Then they become naive TCR+ T-cells expressing CD3 on the cell surface, together with either CD4 or CD8, depending on the type of MHC molecule (class II or class I) that they will later use for peptide recognition. EGIL also proposed a classification of T-ALL based on this maturation sequence. T-cells with only cytoplasmic CD3 and CD7 are designated as T-I (pro-T) and those that co-express only additional CD5 and/or CD2 are T-II (or early-T). CD1a+ corticothymocyte-like cells are designated T-III (independent of the CD4 or CD8 status) and mature CD1-negative/surface CD3-positive cells are T-IV.12 The co-expression of myeloid markers is not uncommon on T-ALL of the earliest stages T-I or T-II, and weak expression of CD10 is also not unusual on T-lineage ALL cells (Table 19.2). Investigation for TCR molecules expression on the cell surface is an additional marker of maturity for T-IV, and cytoplasmic expression of TCRB with the 8A3 antibody has been suggested to allow for further classification of T-ALL.13
Cytogenetic abnormalities
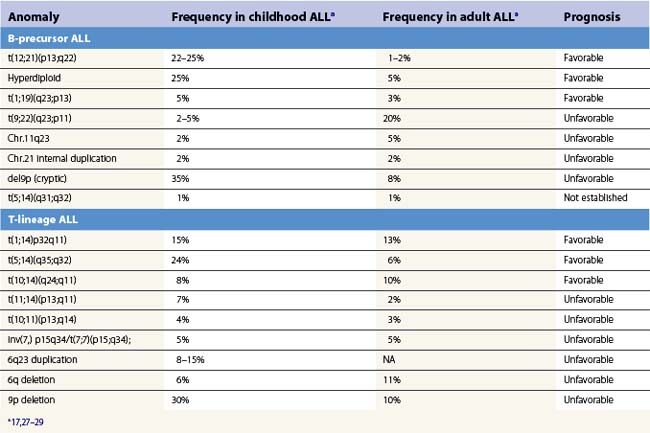
Various cytogenetic anomalies can be identified in ALL after succesful examination of metaphases or further investigation via fluorescence in situ hybridization (FISH) or variant techniques applicable to cells in interphase. Normal karyotypes should also be further explored by such techniques, as some anomalies are not obvious when using chromosomal banding techniques. Table 19.3, which is not exhaustive, summarizes the significance and approximate frequencies of the main chromosomal abnormalities in ALL.
Cytogenetic investigations can also be guided by the immunophenotype.14 For instance, B-I ALL are frequently associated to the t(4;11) translocation and anomalies of the MLL gene can be suspected upon expression of CD15 or CD65. The Philadelphia chromosome or t(9;22) has been reported to be associated to CD34 and CD10 expression with low CD38 and aberrant CD13 and/or CD33 expression. A similar immunophenotype may be indicative also of t(12;21), but these cases are uniformly CD66c negative. Overexpression of the IL-3 receptor (CD123) has been found in many hyperdiploid cases of ALL.15
Several chromosomal abnormalities are of prognostic significance in B-LBL (Table 19.3). The t(9;22) carried a poor prognosis in both children and adults until the advent of tyrosine kinase inhibitors (TKI). The t(4;11) carries a poor prognosis, particularly in infants, and overall 11q23 abnormalities involving disruption of the MLL gene are of adverse clinical significance in ALL. Adverse prognosis has been linked to resistance to L-asparaginase and glucocorticoids.16 The t(1;19), initially thought to be adverse, is on current treatment protocols of neutral significance, except for increased risk of CNS relapse.17,18 The t(12;21) is found in 25–30% of pediatric B-LBL cases and confers a good prognosis.17
Ploidy changes are also of prognostic importance, with hypodiploid and near-haploid karyotypes carrying an adverse prognosis.19 Conversely, hyperdiploidy carries a favorable prognosis.17 Of note, ploidy can also be explored by flow cytometry using propidium iodide intercalation in permeabilized cells pretreated by RNAse or using image analysis of the DNA staining with cell cycle analysis software.
T-LBL have fewer clinically significant chromosomal groups (Table 19.3). The t(10;14) has been identified as a favorable finding in children. Cases with normal karyotypes fare better than those with any chromosomal abnormality.16
Molecular genetics
Genomic alterations are common in ALL. They can result from the translocation of genomic material generating new fusion genes or from mutations. Fusion genes can be translated in mRNA accessible to reverse transcription and further amplification by polymerase chain reaction, using primers of both initial genes. Very recently, monoclonal antibodies targeting the fusion proteins resulting from chromosomal translocations have opened a new promising field for the identification of molecular anomalies using a bead assay available for semi-quantitative assessment in flow cytometry after preparation of a protein extract of bone marrow cells.20
The upcoming technology of gene expression microarrays also allows rapid screening for a multitude of potential mRNA transcripts, and has allowed the identification of new anomalies.21 Even newer technologies, still at the stage of clinical research, investigate anomalies of DNA methylation, microRNAs (miRNA) or single nucleotide polymorphism (SNP), many of them appearing to be involved in the pathogenesis of ALL. These studies may also have therapeutic relevance if the molecular changes can be targeted.22 A number of molecular anomalies have been reported in B- and T-lineage ALL with variable, often not yet fully established prognostic value. Those associated to known genes are summarized in Table 19.4.16,23
Table 19.4 Examples of genes frequently involved in molecular anomalies of acute lymphoblastic leukemias
| B-cell precursor acute leukemia | T-lineage leukemia |
|---|---|
| TEL/AML1 | TAL1, TAL2,SIL/TAL |
| E2A/PBX1 | LMO1, LMO2 |
| BCR/ABL1 | TLX1 (HOX11), TLX3( HOX11L2) |
| MLL | HOXA |
| CDKN2A/B | NOTCH1 |
| PAX5 | PTEN |
| FLT3 | CALM/AF10 |
| PTPN11 | CDKN2A/2B |
| kRAS or nRAS | NUP/ABL |
| RAS |
Minimal residual disease monitoring
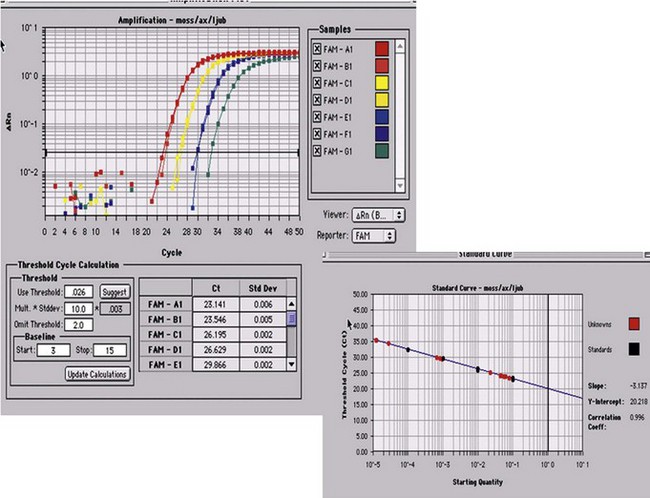
Minimal residual disease is defined as the tumor mass still remaining after chemotherapy or hematopoietic stem-cells transplantation (autologous or more frequently allogeneic in ALL). Upon clinical and hematologic (morphologic) remission, it is suspected that some residual, potentially resistant cells remain, liable to generate a relapse upon regrowth. It has been important to establish reliable means to detect such remaining cells, using molecular or immunophenotypic tools.24 In ALL, molecular studies have been more readily established in comparison to immunophenotypic ones, essentially due to the progress of molecular amplification instruments. The gold standard for molecular MRD monitoring currently relies on real-time quantitative polymerase reaction (RQ-PCR). Through the generation of fluorescent signals proportional to the amount of amplified sequences, RQ-PCR allows to accurately quantify representative material accessible to amplification (Fig. 19.8). This has been successfully applied to the unique rearrangements of IGH or TCR genes characteristic of specific clones, and to specific fusion-genes or mutations. Using RQ-PCR it is necessary to identify and generate patient-specific probes or primers, test them for their efficiency, and compare serial dilutions of the DNA from diagnosis to follow-up BM material. This complex methodology nonetheless may yield sensitivities of 10−4 to 10−6.
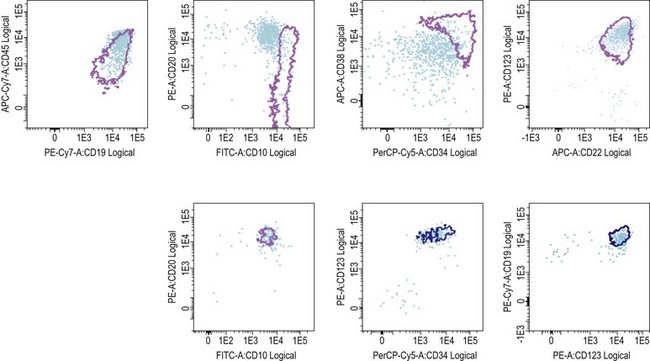
The recent sophistication of multiparameter flow cytometry instruments, fluorochromes, and software has been responsible for a renewed interest for this methodology, initially applied to track abnormal cytoplasmic CD3+/TdT+ blasts in the early 1980s.25 In B-lineage ALL, the differential expression of CD19, CD34, CD10, and CD38 on blast cells and hematogones allows for a successful identification of MRD in a large number of cases. Additional markers such as CD123, when present at diagnosis have been reported to be useful and stable in MRD cells after treatment (Fig. 19.9). Aberrant immunophenotypes noted at diagnoses are called leukemia associated immunophenotypic patterns (LAIP), which can be either aberrant co-expression of other lineage markers (notably myeloid) or, more subtly, differences in fluorescence intensity (under- or over-expression) of marker expression, or asynchronous expression of markers normally associated to different maturation stages.
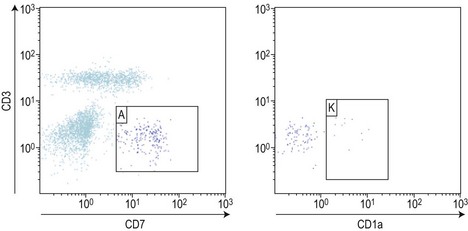
In T-lineage ALL, the most reliable combination remains the co-expression of cytoplasmic CD3 and nuclear TdT, but requires permeabilization and therefore the potential loss of some cells. An additional marker of interest seems to be the aberrant over-expression of CD99. Markers of T-lineage immaturity are especially useful when combined with CD99 or for minimal residual disease assessment of T-III ALL expressing CD1a (Fig. 19.10).
Of note, both molecular and flow methods can also be applied to PB, usually yielding one log lower cell numbers compared to the bone marrow.26 MRD studies in blood can certainly be useful in the early stages of therapy for more frequent investigations with less discomfort for the patients.
Mixed phenotype acute leukemias
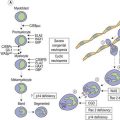
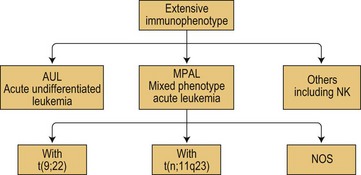
According to WHO 2008, mixed phenotype acute leukemias (MPAL) belong to acute leukemias of ambiguous lineage that show no clear evidence of differentiation towards one single lineage as summarized in Fig. 19.11. Of note, this figure also takes into account, in this subgroup of ambiguous lineage leukemias, the existence of acute undifferentiated leukemias (AUL) and of other forms of AL difficult to classify such as the rare NK-cell leukemias.
Cytology and histopathology
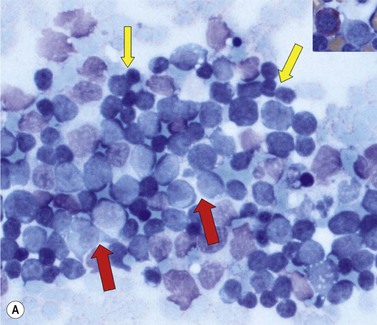
In most cases MPALare characterized by the presence of blasts with no specific features, most often resembling ALL. In some cases, dimorphic populations are present, one of small lymphoblasts and one of larger myelo- or monoblasts. (Fig. 19.12). Cytochemistry may be of use to show populations positive for myeloperoxidase or nonspecific esterases. Bone marrow biopsies show diffuse infiltrations of blasts. Immunhistochemical stainings for myeloperoxidase and lysozyme may be of help in establishing a diagnosis of MPAL.
Immunophenotypic diagnosis of MPAL
The immunophenotypic characteristics allowing the assignment of an acute leukemia to the MPAL group now relies on very strong markers of each lineage. In the initial scoring system published by EGIL in 1995, relevant markers were given respective score points allowing to assign cells with more than two points in more than two lineages to the biphenotypic category of acute leukemias. According to WHO 2008, cells are considered to display myeloid features either if they are positive for intracytoplasmic myeloperoxidase (in cytochemistry or in immunostaining) or display clear signs of monocytic maturation (nonspecific esterase activity in cytochemistry, presence of intracytoplasmic lysozyme and/or surface expression of CD14, CD11c, CD36 or CD64). Engagement in the B-lineage would be considered in two circumstances: 1) if CD19 expression is bright and associated to at least one of the markers CD10, intracytoplasmic CD79a or CD22 (intracytoplasmic or surface); or, 2) if CD19 is dimly expressed but associated with at least two of these additional markers. T-lineage commitment mostly relies on bright expression of intracytoplasmic CD3, explored with strong fluorochromes such as PE or APC. Demonstration of features characteristic to more than one of these three subgroups is significant for MPAL assignment (Figs. 19.11 and 19.12).
Cytogenetics and molecular genetics of MPAL
The two major cytogenetic groups of MPAL depend on the identification of the Philadelphia chromosome and/or BCR/ABL as described above, or of anomalies involving the MLL gene at 11q23. This can be achieved by classical cytogenetics, FISH or molecular studies. The more recent technology of microarray may help in identifying mRNA transcripts of these fusion genes. The next step would be to identify the molecular anomalies potentially associated to the various subgroups of MPAL as summarized in Fig. 19.11.
1 Vardiman JW, Thiele J, Arber DA, et al. The 2008 revision of the World Health Organization (WHO) classification of myeloid neoplasms and acute leukemia: rationale and important changes. Blood. 2009;114:937-951.
2 Chessells JM. Pitfalls in the diagnosis of childhood leukaemia. Br J Haematol. 2001;114:506-511.
3 Majhail NS, Lichtin AE. Acute leukemia with a very high leukocyte count: confronting a medical emergency. Cleve Clin J Med. 2004;71:633-637.
4 Hasle H, Heim S, Schroeder H, et al. Transient pancytopenia preceding acute lymphoblastic leukemia (pre-ALL). Leukemia. 1995;9:605-608.
5 Borowitz MJ, Falletta JM. Leukemias and lymphomas of thymic differentiation. Clin Lab Med. 1988;8:119-134.
6 Bennett JM, Catovsky D, Daniel MT, et al. Proposals for the classification of the acute leukaemias. French-American-British (FAB) co-operative group. Br J Haematol. 1976;33:451-458.
7 Harris NL, Jaffe ES, Diebold J, et al. World Health Organization classification of neoplastic diseases of the hematopoietic and lymphoid tissues: report of the Clinical Advisory Committee meeting – Airlie House, Virginia, November 1997. J Clin Oncol. 1999;17:3835-3849.
8 Kebriaei P, Anastasi J, Larson RA. Acute lymphoblastic leukaemia: diagnosis and classification. Best Pract Res Clin Haematol. 2002;15:597-621.
9 Noren-Nystrom U, Roos G, Bergh A, et al. Bone marrow fibrosis in childhood acute lymphoblastic leukemia correlates to biological factors, treatment response and outcome. Leukemia. 2008;22:504-510.
10 Pilozzi E, Pulford K, Jones M, et al. Co-expression of CD79a (JCB117) and CD3 by lymphoblastic lymphoma. J Pathol. 1998;186:140-143.
11 Asnafi V, Beldjord K, Garand R, et al. IgH DJ rearrangements within T-ALL correlate with cCD79a expression, an immature/TCRgammadelta phenotype and absence of IL7Ralpha/CD127 expression. Leukemia. 2004;18:1997-2001.
12 Bene MC, Castoldi G, Knapp W, et al. Proposals for the immunological classification of acute leukemias. European Group for the Immunological Characterization of Leukemias (EGIL). Leukemia. 1995;9:1783-1786.
13 Asnafi V, Beldjord K, Boulanger E, et al. Analysis of TCR, pT alpha, and RAG-1 in T-acute lymphoblastic leukemias improves understanding of early human T-lymphoid lineage commitment. Blood. 2003;101:2693-2703.
14 Hrusak O, Porwit-MacDonald A. Antigen expression patterns reflecting genotype of acute leukemias. Leukemia. 2002;16:1233-1258.
15 Djokic M, Bjorklund E, Blennow E, et al. Overexpression of CD123 correlates with the hyperdiploid genotype in acute lymphoblastic leukemia. Haematologica. 2009;94:1016-1019.
16 Meijerink JP, den Boer ML, Pieters R. New genetic abnormalities and treatment response in acute lymphoblastic leukemia. Semin Hematol. 2009;46:16-23.
17 Pui CH, Campana D, Pei D, et al. Treating childhood acute lymphoblastic leukemia without cranial irradiation. N Engl J Med. 2009;360:2730-2741.
18 Garg R, Kantarjian H, Thomas D, et al. Adults with acute lymphoblastic leukemia and translocation (1;19) abnormality have a favorable outcome with hyperfractionated cyclophosphamide, vincristine, doxorubicin, and dexamethasone alternating with methotrexate and high-dose cytarabine chemotherapy. Cancer. 2009;115:2147-2154.
19 Heerema NA, Nachman JB, Sather HN, et al. Hypodiploidy with less than 45 chromosomes confers adverse risk in childhood acute lymphoblastic leukemia: a report from the children’s cancer group. Blood. 1999;94:4036-4045.
20 Weerkamp F, Dekking E, Ng YY, et al. Flow cytometric immunobead assay for the detection of BCR-ABL fusion proteins in leukemia patients. Leukemia. 2009;23:1106-1117.
21 Bacher U, Kohlmann A, Haferlach T. Current status of gene expression profiling in the diagnosis and management of acute leukaemia. Br J Haematol. 2009;145:555-568.
22 Mullighan CG, Downing JR. Genome-wide profiling of genetic alterations in acute lymphoblastic leukemia: recent insights and future directions. Leukemia. 2009;23:1209-1218.
23 Harrison CJ. Cytogenetics of paediatric and adolescent acute lymphoblastic leukaemia. Br J Haematol. 2009;144:147-156.
24 Campana D. Minimal residual disease in acute lymphoblastic leukemia. Semin Hematol. 2009;46:100-106.
25 Bradstock KF, Janossy G, Tidman N, et al. Immunological monitoring of residual disease in treated thymic acute lymphoblastic leukaemia. Leuk Res. 1981;5:301-309.
26 Coustan-Smith E, Sancho J, Hancock ML, et al. Use of peripheral blood instead of bone marrow to monitor residual disease in children with acute lymphoblastic leukemia. Blood. 2002;100:2399-2402.
27 Marks DI, Paietta EM, Moorman AV, et al. T-cell acute lymphoblastic leukemia in adults: clinical features, immunophenotype, cytogenetics and outcome from the large randomised prospective trial (UKALL XII/ECOG 2993). Blood. 2009 Dec 10;114(25):5136-5145.
28 Moorman AV, Chilton L, Wilkinson J, et al. A population based cytogenetic study of adults with acute lymphoblastic leukaemia (ALL). Blood. 2010 Jan 14;115(2):206-214.
29 Calero Moreno TM, Gustafsson G, Garwicz S, et al. Deletion of the Ink4-locus (the p16ink4a, p14ARF and p15ink4b genes) predicts relapse in children with ALL treated according to the Nordic protocols NOPHO-86 and NOPHO-92. Leukemia. 2002;16:2037-2045.