Chapter 84 Acid–base balance and disorders
THEORETICAL CONSIDERATIONS
The structural integrity of intracellular enzymes is essential for survival. Proton activity at enzymatic sites of action in cytosol and organelles must be tightly controlled. In critical illness, with survival under threat, direct monitoring of any intracellular site remains an impractical ideal. Clinicians are obliged to track extracellular data, usually from tests on arterial blood, knowing that plasma pH exceeds intracellular pH by 0.6 pH units on average.
WATER DISSOCIATION AND ACID–BASE
Stewart reminded us of the central role of water in aqueous acid–base equilibria.1 Mammals are approximately 60% water. It follows that the behaviour of water is fundamental to our understanding of acid–base physiology. Water (simplistically) dissociates as follows:


THE PaCO2/PH RELATIONSHIP – THE ACID–BASE ‘WINDOW’ FOR CLINICIANS
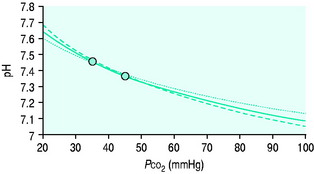
Clinicians use the relationship between arterial PCO2 (PaCO2) and arterial pH as the acid–base assessment platform. This is appropriate, because the PaCO2/pH curve is a fundamental physiological property (Figure 84.1). Several factors determine the shape and position of this curve.
THE PaCO2/pH RELATIONSHIP IS DEFINED BY SEVERAL SIMULTANEOUS EQUATIONS
Therefore apart from Equation 1, several other equations must be satisfied simultaneously at any equilibrium. They relate to:


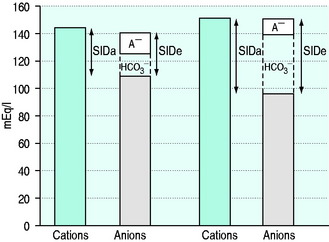
The trapped anions have weak acid properties. Any pH shift alters their negative charge, driving further ionic redistributions, particularly chloride, between compartments. The net effect is that plasma SID goes up and down with PaCO2 (Figure 84.2), the origin of the so-called Hamburger effect. Importantly, ionic shifts are confined within the total extracellular space, so that extracellular SID does not alter with PCO2. This is fortuitous for clinicians, forming the basis of the CO2 invariance of standard base excess (see below).
Thus it can be seen that for any individual the PaCO2/pH relationship is a unique acid–base ‘signature’ (Figure 84.1) and ultimately a complex function of extracellular SID and ATOT.
WEAK IONS AND BUFFER BASE
SID is a charge space. Weak ions, which arise from variably dissociating conjugate bases, occupy this space. These include H+, OH−, HCO3−, CO32− and A−. Their total net charge must always equal SID. However, HCO3− and A−, together known as the ‘buffer base’ anions, take up virtually the entire space on their own (Figure 84.2) since the other ions are measured in either micromoles/l or, in the case of protons, nanomoles/l. SID therefore not only dictates the buffer base concentration but is also numerically identical to it. In other words, SID = [HCO3−] + [A−]. This fact, plus Figge’s linear approximations2 for calculating A−, allows us to simplify Stewart’s equations in plasma, reducing them to three without sacrificing accuracy.3


[Alb] is albumin concentration expressed in g/l. [Pi] is phosphate concentration in mmol/l. PCO2 is in mmHg. SIDe is effective SID, also known as ‘buffer base’ (Figure 84.2).
SID calculated from measured plasma concentrations of strong ions is termed the ‘apparent’ SID, or SIDa (Figure 84.2). Discrepancies between SIDe and SIDa imply the presence of unmeasured ions in plasma (see below).
ISOLATED CHANGES IN SID AND ATOT
At any given PaCO2, a falling SID or a rising ATOT reduce pH, moving the equilibrium towards a metabolic acidosis. Conversely, a rising SID or a falling ATOT create a metabolic alkalosis. Many argue that SID and ATOT act individually and should therefore be regarded as independent metabolic acid–base variables. By this argument we could have a strong ion acidosis or alkalosis combined with either a hyperalbuminaemic (high ATOT) acidosis or a hypoalbuminaemic (low ATOT) alkalosis.4 However, SID and ATOT do appear to be linked, with the SID set-point adjusting to ATOT. In particular, SID seems to fall in hypoalbuminaemia, presumably by renal chloride adjustment.5,6
HOW ACID–BASE DISTURBANCES AFFECT THE PACO2/PH RELATIONSHIP
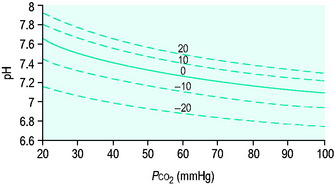
Acute respiratory disturbances move data points along the prevailing PaCO2/pH curve, to the left in respiratory alkalosis, and to the right in respiratory acidosis (Figure 84.1). In contrast, metabolic disturbances (altered extracellular SID and/or ATOT) shift the entire curve up or down (Figure 84.3). A down-shifted curve means that the pH at any given PaCO2 is lower than normal, which – depending on the PaCO2 – represents either a primary metabolic acidosis or else metabolic compensation for a respiratory alkalosis. With an up-shifted curve, the pH at any given PaCO2 is higher than normal, signifying either a primary metabolic alkalosis or else compensation for a respiratory acidosis.
TEMPERATURE CORRECTION OF BLOOD GAS DATA – ‘ALPHA-STAT’ VERSUS ‘PH-STAT’ APPROACHES
Blood gas analysers operate at 37 °C. Their software can convert pH and gas tensions to values corresponding to the patient core temperature for interpretation and action. This is the ‘pH-stat’ approach. The alternative isto act on values as measured at 37 °C – the ‘alpha-stat’ approach.
Hence, a simple way to keep alpha at 0.55 in hypothermia is to maintain uncorrected PaCO2 and pH measurements in their 37 °C reference ranges.7,8 This mimics the hypothermic physiology of ectothermic (cold-blooded) animals. Similar arguments apply in fever, the more common intensive care unit (ICU) scenario. Many intensivists follow the alpha-stat approach, whatever the core temperature.
Those who favour the pH-stat approach argue that it is more consistent with the physiology of hibernating endothermic mammals, and that it allows better maintenance of cerebral perfusion in hypothermia.9 This approach was used during an influential trial of mild hypothermia following out-of-hospital cardiac arrest.10
RENAL PARTICIPATION IN ACID–BASE
In the absence of renal function, there is a progressive metabolic acidosis. About 60 mEq of strong anions, particularly sulphate, but also hippurate and others, are produced daily as metabolic end-products. These accumulate in renal failure, reducing extracellular SID. So does free water, which brings sodium concentrations closer to chloride, again reducing SID. Hyperphosphataemia contributes by increasing ATOT, although in acute renal failure this is commonly offset by coexistent hypoalbuminaemia.11
Traditionally, renal acid–base homeostasis is described in terms of resorption of filtered bicarbonate primarily in the proximal tubule, and excretion of fixed acids through titration of urinary buffers, particularly phosphate, and through excretion of ammonium, primarily in the distal tubule.12
From the physical chemical perspective, the traditional analysis of renal acid–base homeostasis is misleading, since it is based on H+ or HCO3− ‘balances’. H+ and HCO3− are dependent variables, responsive exclusively to PCO2, SID and ATOT, and not subject to ‘in versus out’ balance sheets. The physical chemical explanation is simple. The kidneys regulate extracellular SID via urinary SID, the principal tool being tubular NH4+ acting as an adjustable cationic partner for tubular Cl− and other urinary strong anions.13 The kidneys also modify ATOT via phosphate excretion, which is a totally different concept from that of ‘titratable acidity’.
ACID–BASE ASSESSMENT – THE TWO ‘SCHOOLS’
By convention, acid–base disorders are divided into respiratory (PaCO2) and metabolic (non-PaCO2). PaCO2 is the undisputed index of respiratory acid–base status. Two ‘schools’, Boston and Copenhagen, separated by a large ocean,14 have formed around the identification and quantification of metabolic acid–base disturbances. Both succeed as navigation systems, if used correctly.
Stewart’s concepts neither invalidate nor supplant the traditional approaches,15–17 but rather help us to understand their physiological basis, evaluate their relative merits, and extend their utility.18 SID by itself is not a reliable measure of metabolic acid–base status, for three reasons:
BASE EXCESS AND STANDARD BASE EXCESS
In 1960, Siggaard-Andersen introduced ‘base excess’ (BE).19 BE was defined as zero when pH = 7.4, PCO2 = 40 mmHg (both at 37 °C). If pH ≠ 7.4 or PCO2 ≠ 40 mmHg, BE was defined as the concentration of titratable hydrogen ion required to return the pH to 7.4 while maintaining PCO2 at 40 mmHg.
In the lead-up, Astrup, Siggaard-Andersen, Engel and others had equilibrated the blood of Danish volunteers with known CO2 tensions at varying haemoglobin concentrations, after first adding known amounts of acid or base. The data were then used to create an ‘alignment nomogram’ which allowed the determination of BE from simultaneous measurements of pH, PCO2 and haemoglobin concentration.
Seventeen years later, Siggaard-Andersen published the Van Slyke equation for calculating BE.20 It was derived from known physical chemical relationships, and was claimed to match the empiric nomogram. The Van Slyke equation computes (Δ[HCO3−] + Δ[A−]) – in other words, the deviation from normal of the buffer base concentration in whole blood. From the Stewart perspective, buffer base and SID are interchangeable terms. Hence Stewart would describe BE as the abnormality in whole blood SID at the prevailing ATOT.
It became clear that BE loses its CO2 invariance in vivo, where Gibbs Donnan forces drive ions between intravascular and interstitial compartments. As a result, a primary change in PaCO2 shifts BE in the opposite direction. The solution was to calculate BE at a haemoglobin concentration of approximately 50 g/l, replicating the mean extracellular haemoglobin concentration and thus more closely modelling the extracellular environment.21 This is standard base excess (SBE).
As a metabolic acid–base index, SBE is close to ideal, being both quantitative and demonstrably independent of PacO2.22 A useful formula is:

with SBE and [HCO3−] values in mEq/l. This formula can be further refined to allow for changes in plasma ATOT due to variations in albumin and phosphate.23 However, because haemoglobin is the predominant weak acid, the end result is very similar.
A typical SBE reference range (in mEq/l) is −3.0 to +3.0. If SBE < −3.0 mEq/l, there is a down-shifted PaCO2/pH curve. This could represent either a primary metabolic acidosis or else compensation for a primary respiratory alkalosis, depending on the PaCO2 and the pH (see below). SBE quantifies the increase in extracellular SID (in mEq/l) needed to shift the curve back to the normal position without changing ATOT (Figure 84.3). In terms of the original BE definition, this is roughly the required dose of sodium bicarbonate in mmol per litre of extracellular fluid. Similarly, if SBE is > 3.0 mEq/l, there is an up-shifted curve, either a metabolic alkalosis or compensation for a respiratory acidosis. The SBE is the decrease in extracellular SID needed to shift the curve back to the normal position at the prevailing ATOT. Conceptually, it approximates the dose of HCl required per litre of extracellular fluid. SBE is thus ‘extracellular SID excess’ or ‘SIDex’.24
THE BICARBONATE-BASED APPROACH TO METABOLIC ACID–BASE – THE BOSTON ‘Rules Of Thumb’
Boston ‘school’ devotees calculate the plasma [HCO3−] from the measured pH and PaCO2, and match this value with the [HCO3−] deemed appropriate for the measured PaCO2, using empiric ‘rules of thumb’ derived from clinical and experimental data (Table 84.1).25 An offset denotes a metabolic acid–base disturbance.
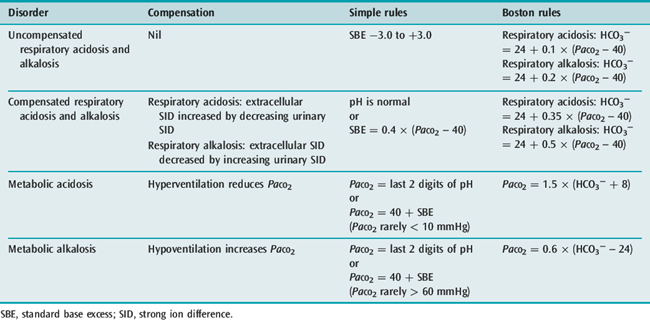
The Boston method is largely qualitative, since by focusing on plasma bicarbonate alone it ignores the A− component of the buffer base (SIDe) concentration (Figure 84.2). The Boston rules of thumb can only tell us whether the PaCO2/pH curve is shifted up or down. Unlike SBE, they cannot tell us how much.
ACID–BASE DISORDERS – CLASSIFICATION
PRIMARY ACID–BASE DISORDERS
Primary acid–base disorders dictate the direction of the pH disturbance. They are designated by the suffix ‘osis’, and can be either respiratory (PaCO2) or metabolic. Hence we can have a respiratory or metabolic acidosis or alkalosis. The final pH abnormality (if any) is designated by the suffix ‘aemia’. In acidaemia, plasma pH is < 7.35; in alkalaemia, plasma pH is > 7.45. The pH in opposing primary acid–base disturbances can be normal.
COMPENSATION AND ITS EFFECT ON pH
Metabolic compensation
In respiratory acid–base disturbances, the kidneys adjust extracellular SID by regulating urinary SID, primarily via urinary chloride. In prolonged hypocapnia, there is a compensatory fall in extracellular SID, achieved by increasing urinary SID. In sustained hypercapnia, the kidneys decrease urinary SID and thereby increase extracellular SID. Renal compensation for chronic respiratory acid–base disturbances takes time, but is ultimately very effective. Over the PaCO2 range 25–80 mmHg, which encompasses most chronic respiratory disturbances, full compensation will normalise the arterial pH.22,26,27 However, this can take up to 5 days.
Respiratory compensation
A normal pH combined with an abnormal PaCO2 can mean one of two things. Either there are two primary opposing acid–base disorders, one respiratory and one metabolic, or else there is a fully compensated respiratory acid–base disturbance. A ‘normal’ PaCO2 combined with an abnormal pH always represents two primary acid–base disturbances (see Table 84.1).
ACID–BASE ‘SCANNING TOOLS’
ELECTRICAL GAPS (Table 84.2)28
Table 84.2 Factors affecting the anion gap (AG), the albumin-corrected anion gap (AGc) and the strong ion gap (SIG)
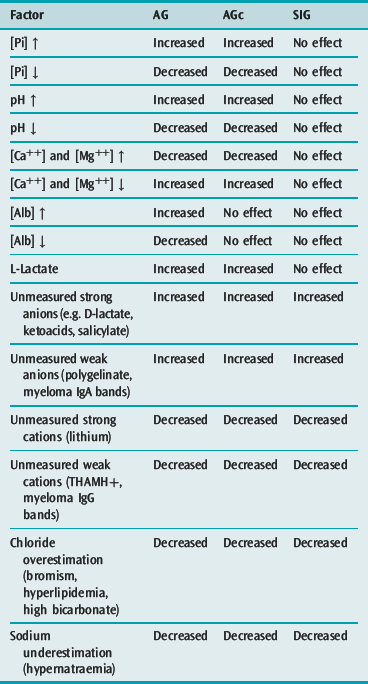
Anion gap (AG)
The plasma AG is calculated (in mEq/l) as [Na+] + [K+] – [Cl−] – [HCO3−], although [K+] is omitted in many laboratories. A typical reference range is 7–17 mEq/l. The AG quantifies [unmeasured anions] – [unmeasured cations], both strong and weak. The AG is increased by unmeasured anions, and reduced by unmeasured cations. In health, most of the AG consists of A−, the negative charge on albumin and phosphate. The AG is altered by ATOT fluctuations, which affect A− directly, and by severe pH disturbances, which act via the A− component (Table 84.2). When used for its primary purpose, which is scanning for unmeasured strong anions, AG sensitivity and specificity are low.
Strong ion gap (SIG)
The SIG concept was proposed by Jones in 1990,29 and progressed by others.2,30 It is calculated as SIDa – SIDe, where SIDa = [Na+] + [K+] + [Ca++] + [Mg++] – [Cl−] – [L-lactate], and SIDe = [A−] + [HCO3−]. The unmeasured ions creating the ‘gap’ can be either strong or weak, but the term ‘strong ion gap’ has persisted.
In the absence of measurement error, the SIG should be zero unless there are unmeasured ions, the list of which is smaller than with AG and AGc (Table 84.2).28 SIG is under evaluation as a scanning tool. Its signal is subject to the summated variability of multiple analytes. In many centres, the normal SIG is 4 mEq/l or more, the positive bias presumably due to locally adopted measurement technologies and variations in analytic reference standards. A refinement, ‘net unmeasured ions’ (NUI), has been successfully incorporated into an acid–base diagnostic module and linked to a laboratory information system.31
PRACTICAL CONSIDERATIONS
THE DIAGNOSTIC SEQUENCE
SECONDARY SURVEY
CLINICAL ACID–BASE DISORDERS
METABOLIC ACIDOSIS
In metabolic acidosis, the extracellular SID is low relative to ATOT. This can represent a narrowing of the difference between [Na+] and [Cl−] (normal AGc, Table 84.4), or an accumulation of other anions (elevated AGc, Table 84.4). Although a normal AGc acidosis is often hyperchloraemic, the absolute [Cl−] is not important, just its value relative to [Na+].
| Normal AGc | Raised AGc |
|---|---|
| Saline infusions | L-Lactate acidosis |
| Organic anion excretion | Ketoacidosis |
| Ketoacidosis | β-Hydroxybutyrate, acetoacetate |
| Glue sniffing (hippurate, benzoate) | Renal failure |
| Loss high SID enteric fluid | Sulphate, hippurate, urate, other organic anions |
| Small intestinal, pancreatic, biliary | Phosphate accumulation increases ATOT |
| Urinary/enteric diversions | Ethylene glycol poisoning |
| High urinary SID | Glycolate, oxalate |
| Renal tubular acidosis | Methanol poisoning |
| High urinary SID | Formate |
| Post hypocapnia | Pyroglutamic acidosis |
| High urinary SID | Pyroglutamate |
| TPN and NH4Cl administration | Toluene (glue sniffing) |
| Hippurate, benzoate | |
| Short bowel syndrome | |
| D-lactate |
AGc, albumin-corrected anion gap; SID, strong ion difference; TPN, total parenteral nutrition.
Clinical features
Clinical features are those of acidaemia itself (Table 84.5), combined with specific toxicities of individual anions. These include blindness and cerebral oedema (formate),33 crystalluria, renal failure and hypocalcaemia (oxalate),34 and tinnitus, hyperventilation and fever due to uncoupling of oxidative phosphorylation (salicylate).35
| Reduced myocardial contractility, tachy- and bradydysrhythmias, systemic arteriolar dilatation, venoconstriction, centralization of blood volume |
| Pulmonary vasoconstriction, hyperventilation, respiratory muscle failure |
| Reduced splanchnic and renal blood flow |
| Increased metabolic rate, catabolism, reduced ATP synthesis, reduced 2,3-DPG synthesis |
| Confusion, drowsiness |
| Increased inducible nitric oxide synthase (iNOS) expression, proinflammatory cytokine release |
| Hyperglycaemia, hyperkalaemia |
| Cell membrane pump dysfunction |
| Bone loss, muscle wasting |
The adverse effects of acidaemia (Table 84.5) are more prominent at pH < 7.2. Acidaemia also has potential benefits. For example, the Bohr effect increases tissue oxygen availability, although this is rapidly counteracted by reduced 2,3-diphosphoglycerate concentrations. Lowering pH is protective in a number of experimental hypoxic stress models.36,37 During mild acidaemia therefore, the net result of harm versus benefit can be debated.
Infusion-related acidosis38,39
To balance saline, some Cl− must be replaced with HCO3−, or else with strong anions which undergo metabolic ‘disappearance’, such as lactate, gluconate or acetate. Enough chloride must be replaced to balance the fall in extracellular SID against the ATOT dilution effect. Experimentally this value is 24 mEq/l.38
Renal tubular acidosis (RTA)
In RTA, urinary SID is inappropriately high in the setting of a low extracellular SID. The disturbance is in renal tubular Cl− handling, either from reduced ammonium production proximally (Type 4) or distally (Type 1), or increased proximal tubular chloride resorption (Type 2). Causes are legion (Table 84.6).
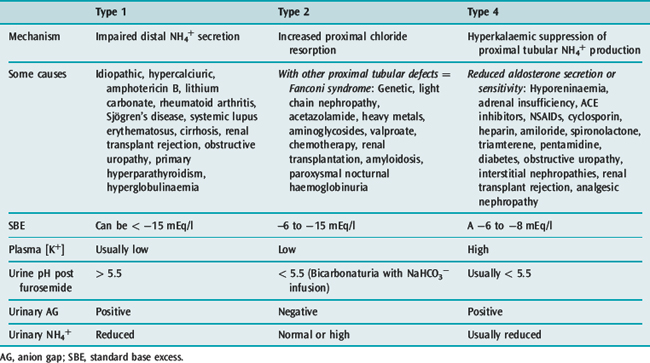
Apart from treating underlying causes and preventing hypercalciuria, management in Types 1 and 2 RTA is based on administering sodium bicarbonate or citrate to correct extracellular SID, and preventing and treating hypokalaemia using potassium citrate (not chloride). In Type 4 RTA, inciting agents are ceased where relevant, and adrenal insufficiency treated with mineralocorticoid replacement. Alkali supplements and furosemide are occasionally necessary.12
Administration of buffers – sodium bicarbonate, ‘carbicarb’ and sodium lactate
In lactic acidosis and organic acidoses in general, it is difficult to justify the administration of buffers (see Chapter 15).40 However, infusing NaHCO3 to correct a severe normal AGc acidosis may be appropriate. Other conditions where NaHCO3 administration is often indicated include severe hyperkalaemia, methanol and ethylene glycol poisoning, and tricyclic and salicylate overdose. A NaHCO3 dose of 1 mmol/kg increases SBE approximately 3 mEq/l.
When administering NaHCO3, the aim is to increase SID. The active agent is therefore sodium, not bicarbonate. The only reason NaOH is not used is its alkalinity (pH 14). However, two problems arise from the high CO2 content (CO2TOT) of NaHCO3 (approximately 1028 mmol/l in a 1 M solution): one is the need for CO2 impermeable storage; the other is the potential to create paradoxical intracellular respiratory acidosis, which can be demonstrated in vitro by adding NaHCO3 to cultured cells.41
Adding a weak base (BTOT) will also shift the PaCO2/pH curve upward. THAM (tris-hydroxymethyl aminomethane, or tris buffer) is a weak base with a pKa of 7.7 at 37 °C. THAM-H+ allows buffer base and thus SBE to increase without changing extracellular SID or ATOT. THAM is CO2 consuming, with good cell penetration, and causes an immediate intracellular metabolic and respiratory alkalosis. Presumably in CSF this phenomenon is behind its propensity to cause sudden apnoea. THAM accumulates in renal failure. Other problems include hyperosmolality, coagulation and potassium disturbances, and hypoglycaemia. The use of THAM requires further evaluation.
Finally, it should be recognised that to cause an appreciable increase in PaCO2, NaHCO3 has to be administered very rapidly (e.g. over 5 minutes).42 Even then the rise is transient, and usually less than 10 mmHg. With slow administration, over 30–60 minutes, NaHCO3 should have minimal effects on CO2 production and intravascular PCO2. The exception is when pulmonary perfusion is massively reduced, such as in cardiac arrest.
METABOLIC ALKALOSIS
Causes (Table 84.7)
| Low urinary SID | Enteric losses of low SID fluid | Gain of high SID fluid |
|---|---|---|
| Loop or thiazide diuretics | Pyloric stenosis, vomiting, nasogastric suction | NaHCO3 administration |
| Post hypercapnia | Villous adenoma | Sodium citrate (plasma exchange, > 8 units stored blood) |
| Corticosteroids | Laxative abuse | Renal replacement fluids with high SID (> 35 mEq/l) |
| Cushing’s syndrome Primary mineralocorticoid excess Carbenoxolone Glycyrrhetinic acid (liquorice) | Milk-alkali syndrome | |
| Hypercalcaemia | ||
| Milk-alkali syndrome | ||
| Magnesium deficiency | ||
| Bartter’s and Gitelman’s syndromes |
SID, strong ion difference.
Clinical features
A high plasma pH (> 7.55) has a number of adverse effects (Table 84.8). Mortality in critical illness escalates as the pH rises above 7.55, although how much is causation versus association is unclear.
| Central nervous system |
| Vasospasm |
| Seizures |
| Confusion, drowsiness |
| Neuromuscular |
| Weakness, tetany, muscle cramps |
| Cardiovascular |
| Arrhythmias – supraventricular and ventricular |
| Decreased contractility |
| Respiratory |
| Decreased alveolar ventilation |
| Atelectasis, hypoxaemia |
| Metabolic |
| Hyperlactaemia |
| Low [Pi], [Ca++], [Mg++] and [K+] |
| Haemoglobin–oxygen affinity |
| Initially increased (until counteracted by increased 2,3-DPG) |
Treatment
RESPIRATORY ACIDOSIS
Causes (Table 84.9)
| Mechanism/affected site | Acute | Chronic |
|---|---|---|
| Respiratory centre suppression | Sedative and narcotic drugs, CNS injury, CNS infection, brainstem vasculitis or infarction | Obesity hypoventilation syndrome |
| Airway obstruction | Inhalational injury, Ludwig’s angina, laryngeal trauma | Obstructive sleep apnoea, vocal cord paresis, subglottic and tracheal stenosis |
| Mechanical ventilation | Permissive hypercapnia | |
| Neural/neuromuscular | Spinal cord injury, Guillain–Barré syndrome, myasthenia gravis, muscle relaxants, envenomation, acute poliomyelitis, critical illness weakness syndromes | Phrenic nerve damage, paraneoplastic syndromes, post-polio syndrome |
| Muscle | Myopathy, low [K+], high [Mg+], low [Pi], diaphragmatic injury, shock | Muscular dystrophies, motor neurone disease |
| Decreased chest wall compliance | Abdominal distension, burns, pneumothorax, large pleural effusions | Obesity, kyphoscoliosis, ankylosing spondylitis |
| Loss of chest wall integrity/geometry | Flail segment | Thoracoplasty |
| Increased small airways resistance | Asthma, bronchiolitis | Chronic obstructive pulmonary disease |
| Deceased lung compliance | Acute lung injury, pneumonia, pulmonary oedema, vasculitis, haemorrhage | Pulmonary fibrosis |
Clinical features
These include the effects of acidaemia (Table 84.5). However, acute hypercapnia has important central nervous effects, including confusion, drowsiness, asterixis, fitting and raised intracranial pressure. Hypercapnia also activates the sympathetic–adrenal and renin–angiotensin systems, reducing renal blood flow, glomerular filtration rate and urine output.
RESPIRATORY ALKALOSIS
Causes
Respiratory alkalosis arises in a number of clinical scenarios (Table 84.10).
Table 84.10 Conditions predisposing to respiratory alkalosis
| Acute | Chronic |
|---|---|
| Hypoxaemia | Pregnancy |
| Hepatic failure | High altitude |
| Sepsis | Chronic lung disease |
| Asthma | Neurotrauma |
| Pulmonary embolism | Chronic liver dysfunction |
| Pneumonia, acute lung injury | |
| CNS disorders – stroke, infection, trauma | |
| Drugs – salicylates, selective serotonin reuptake inhibitors | |
| Opiate and benzodiazepine withdrawal | |
| Mechanical hyperventilation – intentional or inadvertent | |
| Pain, anxiety, psychosis |
1 Stewart PA. How to understand acid–base. In: Stewart PA, editor. A Quantitative Acid–Base Primer for Biology and Medicine. New York: Elsevier, 1981.
2 Figge J, Mydosh T, Fencl V. Serum proteins and acid–base equilibria: a follow-up. J Lab Clin Med. 1992;120:713-719.
3 Anstey CM. Comparison of three strong ion models used for quantifying the acid–base status of human plasma with special emphasis on the plasma weak acids. J Appl Physiol. 2005;98:2119-2125.
4 Fencl V, Jabor A, Kazda A, et al. Diagnosis of metabolic acid–base disturbances in critically ill patients. Am J Respir Crit Care Med. 2000;162:2246-2251.
5 Wilkes P. Hypoproteinemia, strong-ion difference, and acid–base status in critically ill patients. J Appl Physiol. 1998;84:1740-1748.
6 Wooten EW. Analytic calculation of physiological acid–base parameters in plasma. J Appl Physiol. 1999;86:326-334.
7 Patel RL, Turtle MR, Chambers DJ, et al. Alpha-stat acid–base regulation improves neuropsychologic outcome in patients undergoing coronary artery bypass grafting. J Thorac Cardiovasc Surg. 1996;111:1267-1279.
8 Stephan H, Weyland A, Kazmaier S, et al. Acid–base management during hypothermic cardiopulmonary bypass does not affect cerebral metabolism but does affect blood flow and neurological outcome. Br J Anaesth. 1992;69:51-57.
9 Sakamotot T, Kurosawa H, Shin’oka T, et al. The influence of pH strategy on cerebral and collateral circulation during hypothermic cardiopulmonary bypass in cyanotic patients with heart disease: results of a randomised trial and real-time monitoring. J Thorac Cardiovasc Surg. 2004;127:12-19.
10 Bernard SA, Gray TW, Buist MD, et al. Treatment of comatose survivors of out-of-hospital cardiac arrest with induced hypothermia. N Engl J Med. 2002;346:557-563.
11 Rocktäschel J, Morimatsu H, Uchino S, et al. Impact of continuous veno-venous haemofiltration on acid–base balance. Int J Artif Organs. 2003;26:19-25.
12 Soriano JR. Renal tubular acidosis; the clinical entity. J Am Soc Nephrol. 2002;13:2160-2170.
13 Kellum JA. Determinants of plasma acid–base balance. Crit Care Clin. 2005;21:329-346.
14 Severinghaus JW. Siggaard-Andersen and the ‘Great Trans-Atlantic Acid-Base Debate’. Scand J Clin Lab Invest. 1993;214(Suppl):99-104.
15 Gluck SJ. Acid–base. Lancet. 1998;352:474-479.
16 McNamara J, Worthley LI. Acid–base balance: part I. Physiology. Crit Care Resusc. 2001;3:181-187.
17 McNamara J, Worthley LI. Acid–base balance: part II. Pathophysiology. Crit Care Resusc. 2001;3:188-201.
18 Kellum JA. Clinical review: reunification of acid–base physiology. Crit Care. 2005;9:500-507.
19 Siggaard-Andersen O, Engel K. A micro method for determination of pH, carbon dioxide tension, base excess and standard bicarbonate in capillary blood. Scand J Clin Lab Invest. 1960;12:172-176.
20 Siggaard-Andersen O. The Van Slyke equation. Scand J Clin Lab Invest. 1977;37(Suppl 146):15-20.
21 Siggaard-Andersen O, Fogh-Andersen N. Base excess or buffer base (strong ion difference) as measure of a non-respiratory acid–base disturbance. Acta Anesth Scand. 1995;39(Suppl 107):123-128.
22 Schlichtig R, Grogono AW, Severinghaus JW. Human PaCO2 and standard base excess compensation for acid–base imbalance. Crit Care Med. 1998;26:1173-1179.
23 Wooten EW. Calculation of physiological acid–base parameters in multicompartment systems with application to human blood. J Appl Physiol. 2003;95:2333-2344.
24 Schlichtig R, Grogono AW, Severinghaus JW. Current status of acid–base quantitation in physiology and medicine. Int Anesthesiol Clin. 1998;16:211-233.
25 Narins RB, Emmett M. Simple and mixed acid–base disorders: a practical approach. Medicine. 1980;59:161-187.
26 Martinu T, Menzies D, Dial S. Re-evaluation of acid–base prediction rules in patients with chronic respiratory acidosis. Can Respir J. 2003;10:311-315.
27 Lim VS, Katz AI, Lindheimer MD. Acid–base regulation in pregnancy. Am J Physiol. 1976;231:1764-1770.
28 Morgan TJ. What exactly is the strong ion gap, and does anybody care? Crit Care Resusc. 2004;6:155-159.
29 Jones NL. A quantitative physicochemical approach to acid–base physiology. Clin Biochem. 1990;23:189-195.
30 Kellum JA, Kramer DJ, Pinsky MR. Strong ion gap: a methodology for exploring unexplained anions. J Crit Care. 1995;10:51-55.
31 Lloyd P, Freeborn R. Using quantitative acid–base analysis in the ICU. Crit Care Resusc. 2006;8:19-30.
32 Dempsey GA, Lyall HJ, Corke CF, et al. Pyroglutamic acidemia: a cause of high anion gap metabolic acidosis. Crit Care Med. 2000;28:1803-1807.
33 Gonda A, Gault H, Churchill D, et al. Hemodialysis for methanol intoxication. Am J Med. 1978;64:749-757.
34 Peterson CD, Collins AJ, Himes MJ, et al. Ethylene glycol poisoning. N Engl J Med. 1981;304:21-23.
35 Chapman BJ, Proudfoot AT. Adult salicylate poisoning: deaths and outcome in patients with high plasma salicylate concentrations. Q J Med. 1989;72:699-707.
36 Bonventre JV, Cheung JY. Effects of metabolic acidosis on viability of cells exposed to anoxia. Am J Physiol. 1985;249:C149-C159.
37 Heijnen BH, Elkhaloufi Y, Straatsburg IH, et al. Influence of acidosis on liver ischemia and reperfusion injury in an in vivo rat model. J Appl Physiol. 2002;93:319-323.
38 Morgan TJ, Venkatesh B, Hall J. Crystalloid strong ion difference determines metabolic acid–base change during acute normovolaemic haemodilution. Intensive Care Med. 2004;30:1432-1437.
39 Morgan TJ. The meaning of acid–base abnormalities in ICU Part III: Effects of fluid administration. Crit Care. 2005;9:204-211.
40 Levraut J, Grimaud D. Treatment of metabolic acidosis. Curr Opin Crit Care. 2003;9:260-265.
41 Levraut J, Giunti C, Ciebiera JP, et al. Initial effect of sodium bicarbonate on intracellular pH depends on the extracellular nonbicarbonate buffering capacity. Crit Care Med. 2001;29:1033-1039.
42 Levraut J, Garcia P, Giunti C, et al. The increase in CO2 production induced by NaHCO3 depends on blood albumin and hemoglobin concentrations. Intensive Care Med. 2000;26:558-564.
43 Bellomo R, Morimatsu H, French C, et al. The effects of saline or albumin resuscitation on acid–base status and serum electrolytes. Crit Care Med. 2006;34:2891-2897.
44 Worthley LI. Intravenous hydrochloric acid in patients with metabolic alkalosis and hypercapnia. Arch Surg. 1986;121:1195-1198.
45 Brimioulle S, Berre J, Dufaye P, et al. Hydrochloric acid infusion for treatment of metabolic alkalosis associated with respiratory acidosis. Crit Care Med. 1989;17:232-236.