History
Comments
Current Medications
Comments
Current Symptoms
Physical Examination
Comments
Laboratory Data
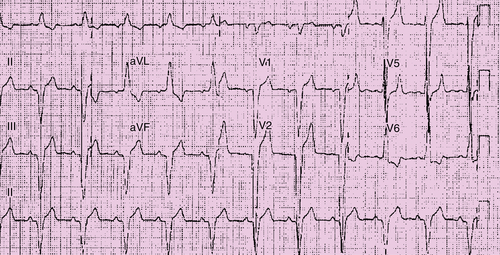
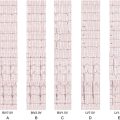
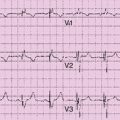
Electrocardiogram
Findings
Comments
Echocardiogram
Findings

Comments

Findings
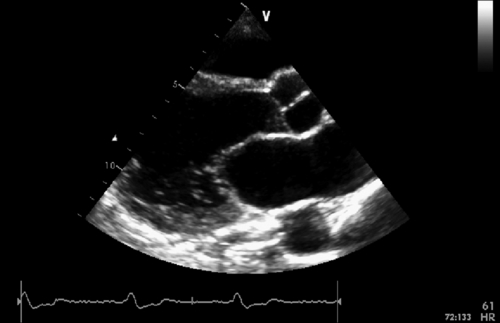
FIGURE 39-2 Parasternal long axis view. See expertconsult.com for video. 
Comments

Comments

Findings
Comments
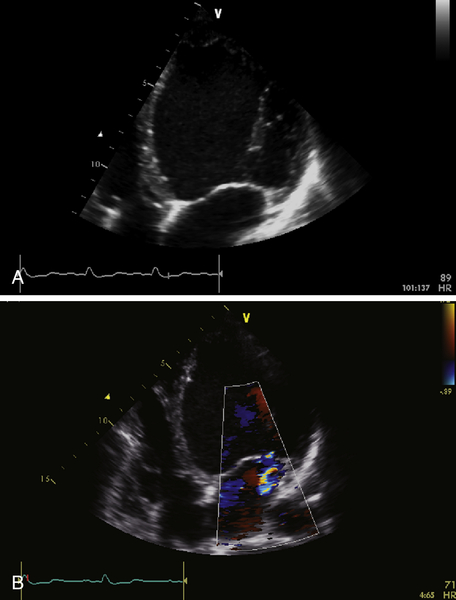
FIGURE 39-3 A, Apical four-chamber view. B, Mitral regurgitation. See expertconsult.com for video. 
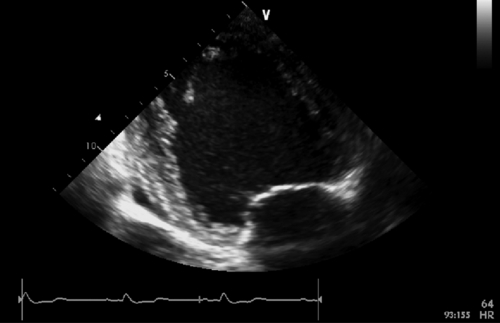
FIGURE 39-4 Apical two-chamber view. See expertconsult.com for video. 
Magnetic Resonance Imaging
Findings

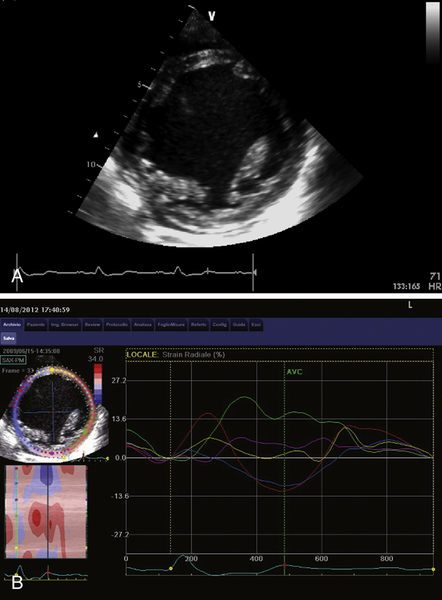
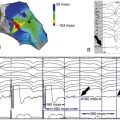
FIGURE 39-5 A, Short-axis view at the level of papillary muscles. B, Speckle-tracking radial strain analysis. See expertconsult.com for video. 
Comments
Findings
Comments
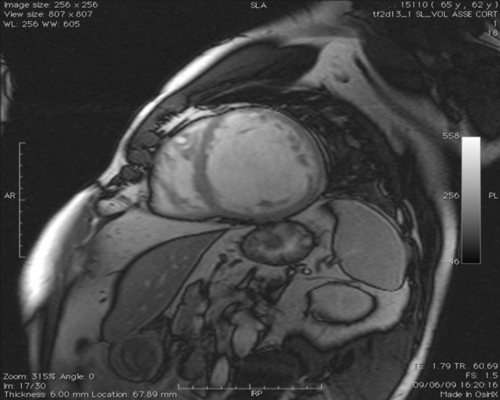
FIGURE 39-6 Cine steady-state free precession sequences. Short-axis stack from the left ventricular base to the apex. See expertconsult.com for video. 
Findings
Comments
Dobutamine Stress Echocardiography
Findings

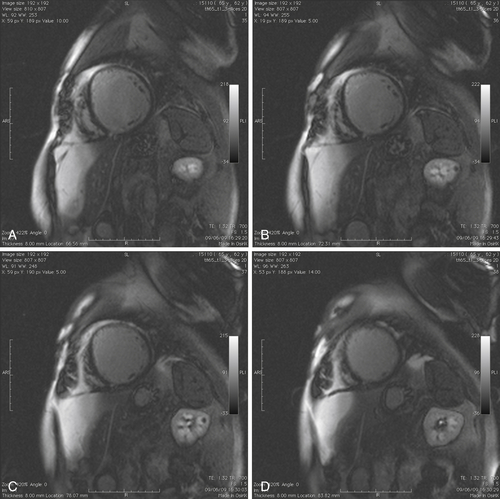
FIGURE 39-7 Late gadolinium (gadopentetate dimeglumine 0.15 mmol/kg) images in short-axis view from the left ventricle base to apex.
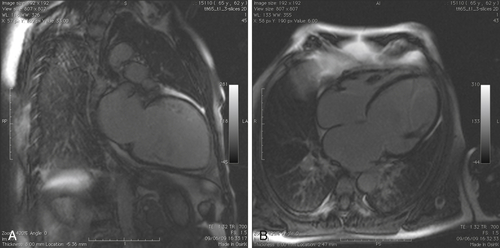
FIGURE 39-8 A, Late gadolinium image in two-chamber long-axis view. B, Late gadolinium image in four-chamber long-axis view.
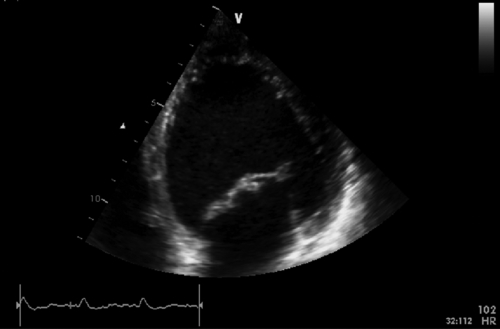
FIGURE 39-9 Apical four-chamber view during dobutamine infusion at 20 mcg/kg/min. See expertconsult.com for video. 
Comments

Findings
Comments

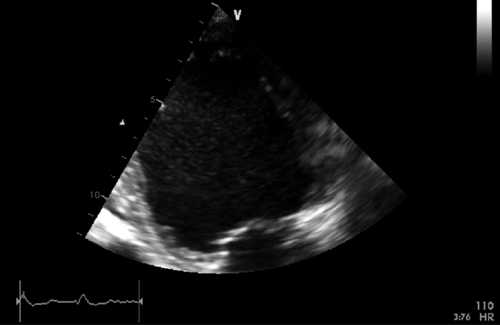
FIGURE 39-10 Apical two-chamber view during dobutamine infusion at 20 mcg/kg/min. See expertconsult.com for video. 
Findings
Comments
Catheterization
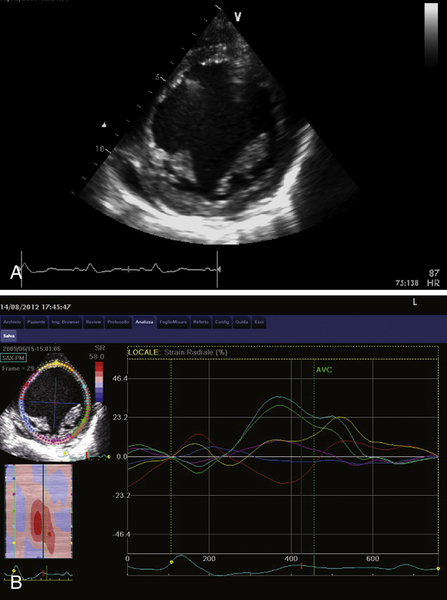
FIGURE 39-11 A, Short-axis view at the level of papillary muscles during dobutamine infusion at 20 mcg/kg/min. B, Speckle-tracking radial strain analysis during dobutamine infusion. See expertconsult.com for video. 
Findings
Comments
Focused Clinical Questions and Discussion Points
Question
Discussion
Question
Discussion
Question
Discussion
Final Diagnosis
Outcome
Intervention
Comments
Selected References
1. Muto C., Gasparini M., Peraldo Neja C. et al. Presence of left ventricular contractile reserve predicts midterm response to cardiac resynchronization therapy: results from the LOw dose DObutamine Stress-Echo Test in Cardiac Resynchronization Therapy (LODO-CRT) trial. Heart Rhythm. 2010;7:1600–1605.
2. Rocchi G., Bertiniv M., Biffi M. et al. Exercise stress echocardiography is superior to rest echocardiography in predicting left ventricular reverse remodelling and functional improvement after cardiac resynchronization therapy. Eur Heart J. 2009;30:89–97.
3. Suffoletto M.S., Dohi K., Cannesson M. et al. Novel speckle-tracking radial strain from routine black-and-white echocardiographic images to quantify dyssynchrony and predict response to cardiac resynchronization therapy. Circulation. 2006;113:960–968.
4. White J.A., Yee R., Yuan X. et al. Delayed enhancement magnetic resonance imaging predicts response to cardiac resynchronization therapy in patients with intraventricular dyssynchrony. J Am Coll Cardiol. 2006;48:1953–1960.