[level-membership-for-endocrinology-diabetes-and-metabolism-category]CHAPTER 34
Investigation of cerebrospinal fluid
Geoffrey Keir; Carrie Chadwick
CHAPTER OUTLINE
CEREBROSPINAL FLUID PHYSIOLOGY
Analysis of cisternal or ventricular fluid
INVESTIGATIONS RELEVANT TO PHYSIOLOGY AND PATHOPHYSIOLOGY
Cerebrospinal fluid oto- and rhinorrhoea
Non-biochemical investigations
BIOCHEMICAL INVESTIGATIONS IN CNS DISORDERS
INTRODUCTION
Spinal paracentesis (lumbar puncture) was introduced at the end of the 19th century for the therapeutic relief of raised intracranial pressure secondary to tuberculous meningitis. Within a few years, however, it was being used to sample lumbar cerebrospinal fluid (CSF) to aid clinical diagnosis. Analyses that were undertaken in these early days included microscopy for cells and chemical tests to measure reducing substances, protein and chloride. Even today, counting cells and measuring total protein and glucose remain the mainstay analyses routinely carried out on CSF specimens. Yet, modern analytical techniques make possible the quantitative and qualitative detection of a vast range of biochemical substances. It is the purpose of this chapter to assess critically the role of laboratory studies of CSF in the investigation of central nervous system (CNS) disorders. The results of these analyses must be considered both in the clinical context and in conjunction with the findings of other investigations, including neuroimaging and neurophysiological measurements.
A few points should be kept in mind when handling CSF. Despite the fact that well-documented procedures exist that will minimize discomfort, including that of post-lumbar puncture headache, the anticipation of a lumbar puncture (LP) is something that causes distress to many patients. This is not helped by the fact that, occasionally, even when carried out by an experienced practitioner, performing a satisfactory LP can prove difficult and uncomfortable and is not without the risk of epidural or subdural bleeding or infection. In many instances, only one spinal tap can be carried out. One reason is that the introduction of a needle into the lumbar sac to sample the CSF can lead to blood contamination of the remaining CSF. This can invalidate the taking of further samples for several days, the exact time being dependent upon the analyte being studied and the degree of blood contamination. There are also ethical reasons against repeating an invasive procedure for trivial reasons. Furthermore, in the very young, the volumes of CSF that can safely be taken are small. Collectively, this places a heavy burden of responsibility on laboratories to make sure that the maximum relevant information is achieved from the available fluid, and that none is wasted or prematurely discarded. Also, the analysis of CSF is multidisciplinary, and it behoves laboratories to ensure that there is the necessary cooperation among pathology specialties. It is strongly recommended that laboratories produce guidelines for doctors indicating sample requirements, and establish procedures to ensure that all CSF samples surplus to immediate analytical requirements are correctly stored. Like all body fluids, CSF is a potentially hazardous material and must be handled appropriately.
CEREBROSPINAL FLUID PHYSIOLOGY
Formation
In the normal adult, the total volume of CSF is about 150 mL. Cerebrospinal fluid is formed at a rate of approximately 500 mL/day, so the fluid is typically exchanged about four times daily (every 6 h). Infants and children have smaller CSF volumes that range from 30–60 mL in a neonate to 100 mL in a pre-teen.
While the choroid plexuses that line the ventricles are the major site of CSF production, as much as 30% of CSF is formed by fluid shifts across various vascular beds within the CNS, such as the cerebral capillaries and dorsal root ganglia. Unlike choroidal CSF, interstitial fluid forms throughout the brain and spine, and then diffuses into the CSF.
Cerebrospinal fluid formed in the lateral ventricles passes through the third and fourth ventricles into the cisterna magna, from where it circulates out into the cerebral and spinal subarachnoid spaces. The subarachnoid space lies between the two leptomeninges, the outer (arachnoid) mater and inner (pia) mater, which cover the whole brain and spinal canal down to the level of the second sacral vertebra. The flow of CSF from the cisterna magna is mainly upward and outward over the cerebral hemispheres to the main site of reabsorption through the arachnoid villi, which drain into the major dural sinuses. Flow down the cul-de-sac of the spinal cord is relatively sluggish. Thus, while the average turnover time of CSF is ~ 6 h, radiolabelled plasma albumin can continue to equilibrate with lumbar CSF for 1–2 days.
Composition
Solutes enter the CSF by a variety of processes, including active transport via specific transporter mechanisms present in choroidal epithelial cells, facilitated diffusion and passive diffusion.
Cerebrospinal fluid constituents may be derived from plasma, from the metabolic activities of cells normally present in the CNS or from cells and organisms present in the CSF as a result of pathological processes.
Analysis of cisternal or ventricular fluid
While the most common fluid obtained for analysis is lumbar CSF, there are occasions when CSF is taken from other regions, for example from one of the lateral ventricles (usually via a ventriculo-peritoneal or ventriculo-extracorporeal shunt), the 4th ventricle (by cisternal puncture) and even from around the cortex. It is extremely important that the anatomical site of the fluid is recorded, as the reference ranges for many constituents vary according to the anatomical source of the CSF.
INVESTIGATIONS RELEVANT TO PHYSIOLOGY AND PATHOPHYSIOLOGY
Sampling and pressure
Details of CSF sampling techniques are well described in standard textbooks of practical medical procedures. The initial hydrostatic pressure is between 80 and 180 mmH2O when the patient is in the lateral recumbent position. Ideally, four sequential fractions of CSF should be collected into sterile polypropylene containers. In an adult, a total of 10–12 mL of fluid should be withdrawn, but as little as 3 mL or less in the case of a neonate. The containers must be numbered in the order of collection. Typically, fraction 1, taken into a fluoride tube, is used for glucose (this fraction may also be suitable for protein measurement by some methods), fractions 2 and 3 are used for cell counts and microbiological examinations, i.e. Gram stain and culture, and fraction 4 is used for the assay of specific proteins and oligoclonal bands and, if required, spectrophotometry (in which case the tube must be protected from light from the moment of collection). Blood for glucose and, in the case of spectrophotometry, for total protein and bilirubin should be taken at the same time.
Appearance
Cerebrospinal fluid is normally crystal clear and colourless. The fluid appears turbid when there are more than 200 × 106 white cells/L (200/mm3) or 400 × 106 red cells/L (400/mm3). The presence of bacteria or contamination by epidural fat may also cause turbidity of the specimen. Clot formation may occur when protein concentrations are markedly elevated; where the source of the protein is blood then at least 1 000 000 × 106 red cells/L (106/mm3) are required for clotting to occur. Cerebrospinal fluid may be coloured yellow by bilirubin or, rarely, by carotenoids, red (or more usually pink/orange) by oxyhaemoglobin or brown by methaemoglobin. Yellow discolouration of CSF is called xanthochromia, a term that has often been used to encompass the colours imparted by both bilirubin and oxyhaemoglobin. Because the presence of oxyhaemoglobin and bilirubin is most appropriately detected by spectrophotometry, where this technique is used, the term xanthochromia should be avoided to minimize confusion.
Cells
The total leukocyte count in normal adult CSF is rarely > 5 × 10⁶/L mononuclear cells (lymphocytes and monocytes). The presence of even one polymorphonuclear leukocyte (neutrophil, polymorph) in the CSF should be a cause for concern in an adult. In neonates, however, the normal cell count is < 30 × 106/L (predominantly polymorphs), with < 10 × 106/L lymphocytes. Changes that occur in the presence of CNS infections form an important part of the initial diagnosis and will be considered later.
Erythrocytes are not normally present in CSF. They appear either following trauma to blood vessels during LP or after an intracranial bleed. A traumatic LP occurs when the needle damages a blood vessel while passing through the vascular epidural space, thereby introducing blood directly into the lumbar sac, and is estimated to occur in 15–20% of all LPs. Traumatic contamination complicates interpretation in two ways.
• The second is in the interpretation of the CSF white cell count (WCC). Usually an increase in the number of white cells is an indication of infection, but following a traumatic tap, white cells are more likely to be from the contaminating blood. When a CSF leukocytosis is suspected in spite of a traumatic tap, the predicted white cell count can be compared with that observed, as follows:
A ratio of observed (O) to predicted (P) WCC > 1 implies CSF leukocytosis. There is a significant overlap of causes for O:P values between 0.75 and 1.0. However, an O:P ratio of < 0.1 is highly predictive in terms of excluding infection.
Glucose
The brain has no significant glycogen store and is therefore wholly dependent upon the blood supply of glucose to satisfy its requirements. Although the brain is only about 5% of the total body mass, it uses 20% of the glucose available from the blood. Cerebrospinal fluid glucose concentrations can only meaningfully be interpreted in relation to the plasma concentration, measured on a sample ideally taken within 15 min of LP. Cerebrospinal fluid glucose is derived solely from plasma glucose and is normally 60–80% of the concentration in the latter, although, for the first six months of life, the CSF glucose concentration may equal that of plasma. The CSF:plasma glucose ratio falls below 0.6 in a number of conditions, and this finding can be used as a diagnostic aid. The most notable reductions are observed in bacterial, tuberculous and some fungal meningitides, and in hypoxia, whereas ratios are usually normal in viral meningitis. The exact cause of the lowered CSF:plasma glucose ratio is still unresolved and will be discussed below. Whatever the cause, a lowered ratio usually indicates a diffuse generalized meningeal disease. A false negative result may be obtained if the patient has been given prior treatment with antibiotics.
Glucose is transferred into the CSF by a specific membrane carrier transport system. In the adult, the usual ratio is maintained up to plasma glucose concentrations of 20 mmol/L. For plasma glucose concentrations higher than this, the CSF glucose concentration does not rise further, probably due to saturation of the transport system. In severe hyperglycaemia, therefore, the CSF glucose may seem disproportionately low relative to that in the blood. It is important that this is not misinterpreted as evidence for infection. Furthermore, the CSF typically takes 2–4 h to equilibrate fully with a change in blood glucose. In a diabetic patient who has recently taken either insulin or an oral hypoglycaemic agent, it is therefore possible to have the paradoxical finding of a CSF glucose concentration that is higher than that in a paired blood sample.
Lactate
Cerebrospinal fluid lactate concentration is normally < 2.5 mmol/L; concentrations are controlled independently of those in arterial blood, indicating that it is a product of metabolism within the CNS. An increased CSF lactate concentration is observed in cerebral hypoxia (for example, following a cerebral infarction) and, most notably, in bacterial meningitis, when it is often associated with a decreased CSF glucose concentration. Elevated CSF concentrations of lactate have been demonstrated in patients with inherited disorders of the mitochondrial electron transport chain involving the pyruvate dehydrogenase complex, which give rise to the mitochondrial myopathies. In those with predominantly neurological symptoms, lactate concentrations may be increased only in the CSF.
Proteins
Two-dimensional protein electrophoresis of CSF reveals 200–300 spots, of which about half correspond to 34 unambiguously identified proteins. Nearly all proteins give rise to multiple spots owing to heterogeneity arising from various combinations of glycosylation, phosphorylation and splice variants. Proteins in CSF can be grouped as follows:
• those arising from plasma proteins that have crossed the blood–CSF barriers
• those synthesized in the brain and secreted into the CSF
• those usually present inside CNS cells that have leaked into the CSF following cell damage. Proteins within this group are generally present in only trace amounts.
Table 34.1 lists the ten proteins with the highest concentrations in CSF and plasma.
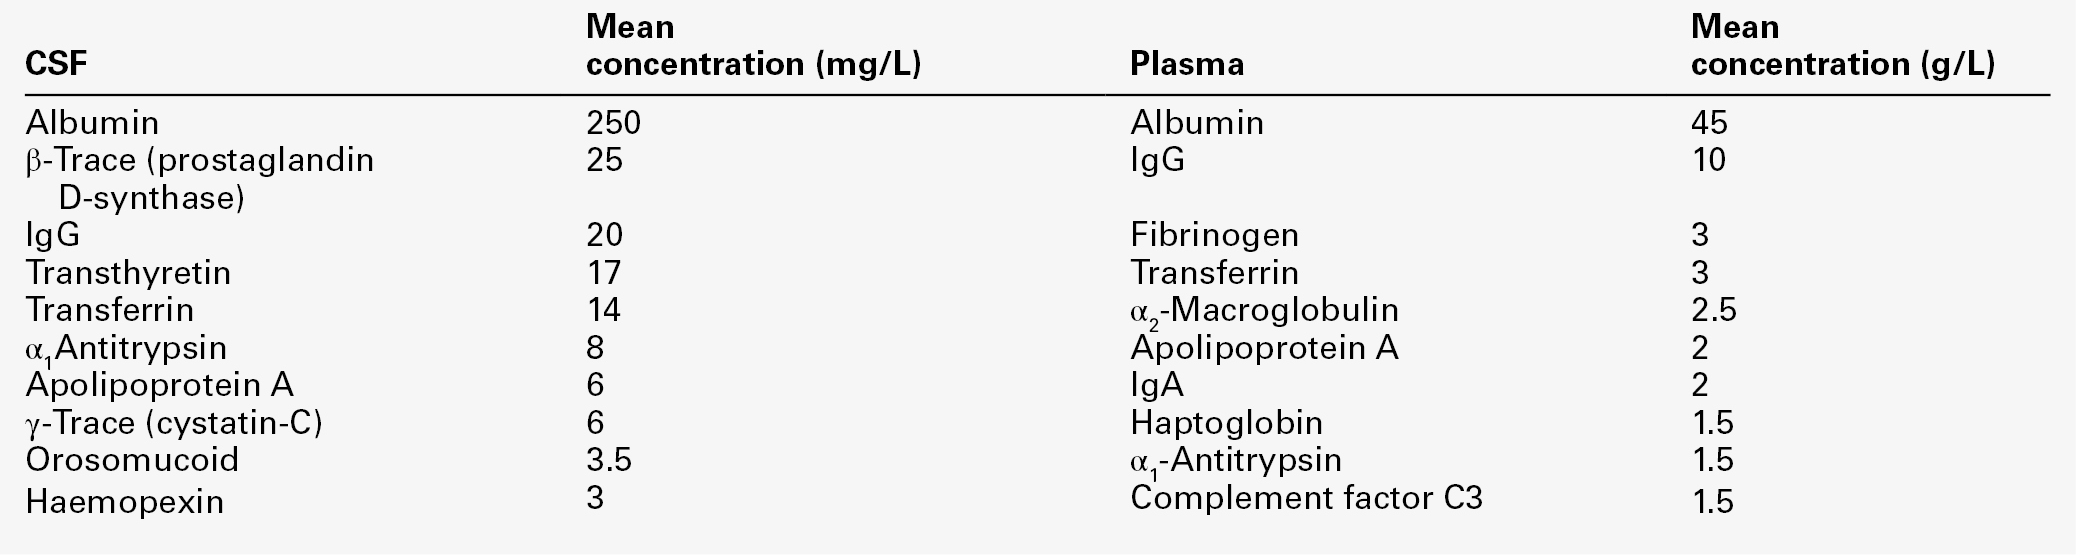
Some 80% of the total CSF protein concentration is derived from plasma proteins that have diffused passively across the various blood–CSF barriers. The remainder comprises proteins that are synthesized within the CNS (Fig. 34.1). Some plasma proteins, such as transferrin, undergo receptor-mediated transfer. The cells of the choroid plexus also synthesize transferrin and prealbumin, so the CSF concentration is a function of several factors. In health, two factors influence the CSF concentrations of the individual plasma-derived CSF proteins. One is the degree of permeability of the combined blood–CSF barriers to the protein, which is inversely proportional to the Stokes radius of the protein. The other is the plasma concentration of the protein: in general, the CSF concentration is directly proportional to that in plasma, and inversely proportional to molecular size.
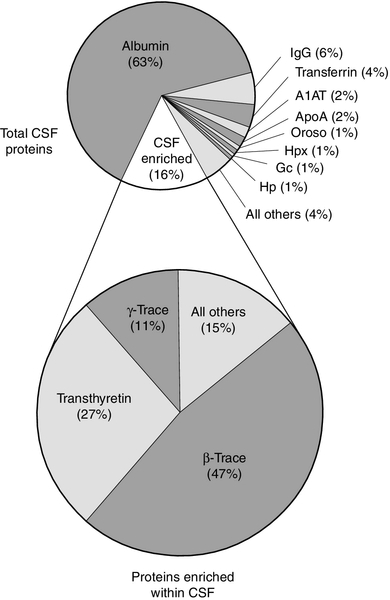
FIGURE 34.1 Protein composition of CSF showing those proteins that are plasma derived and those whose synthesis occurs within the CNS.
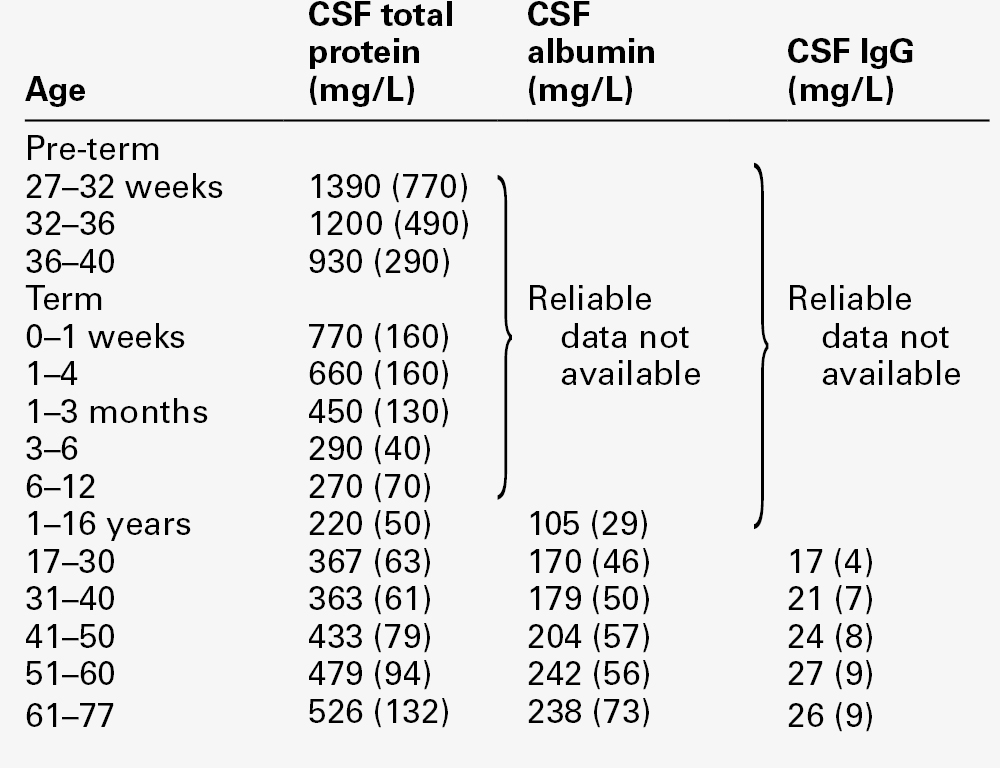
All the frequently measured plasma proteins are present in CSF, demonstrating the lack of an upper limit for molecular size exclusion by the blood–CSF barriers. In health, all CSF albumin and immunoglobulin come from the plasma. Albumin accounts for 50–60% of total lumbar CSF protein and is present at a concentration of about 1/250 of that of the plasma. Permeability of the barrier alters with age; total CSF protein and albumin concentrations reflect this (Table 34.2). The albumin concentration (and thus that of total protein) also increases from ventricle to lumbar regions, reflecting both a change in the permeabilities of the blood–CSF barriers along the CNS axis and the longer time for equilibration of lumbar CSF with plasma.
Cerebrospinal fluid total protein concentrations may increase in two circumstances:
• when there is reduced flow of spinal CSF, such as occurs with a partial or complete blockage of CSF flow down the spine (e.g. owing to a prolapsed intervertebral disc, an abscess or a spinal tumour). In this circumstance there is increased equilibration of CSF with plasma, often accompanied by an inflammatory increase in permeability. In Froin syndrome, there is complete spinal block of CSF flow, usually due to a spinal tumour; cerebrospinal fluid distal to the block stagnates, and this eventually allows complete equilibration of the CSF with plasma leading to protein concentrations that are similar in both fluids.
A comprehensive review of the role of CSF protein analysis in the investigation of CNS disorders is included in the Further reading list.
Assessment of blood–brain barrier permeability and reduced fluid flow
Measurements of total protein, albumin and α2-macroglobulin concentrations, and electrophoresis have all been advocated as investigations appropriate to the assessment of barrier permeability. Total protein has been the most widely used and must be interpreted against age-related reference intervals. Some authors have advocated a correction when blood is present due to a traumatic tap, recommending the subtraction of 10 mg/L for every 1000 × 106 erythrocytes/L. The cell count and protein determination must be performed on the same sample of CSF and there should not be any degree of cell lysis, which would otherwise render the correction void. The correction assumes a normal plasma total protein and haematocrit and, while it should be used with caution, provides an approximate measure of the degree to which the CSF protein concentration may be increased following addition of blood from whatever source.
Albumin is a better indicator of barrier dysfunction, for three reasons:
• it is a homogeneous protein, unlike total protein, which is a composite of variable proportions of multiple proteins
• its concentration has a lesser degree of age dependency than that of total protein.
Despite CSF protein concentrations reflecting plasma concentrations, there is generally no discriminatory advantage to be obtained by relating CSF values to those of plasma. The choice between total protein and albumin will depend both on which assay is available at an appropriate analytical standard and cost. Quality assurance programmes indicate similar overall analytical imprecision for total protein and albumin. Experience of using albumin as an alternative to total protein is, as yet, limited.
Intrathecal immunoglobulin synthesis
Intrathecal synthesis of immunoglobulins occurs where B lymphocytes are induced to migrate from the blood into the brain. Once these cells are sequestered in the brain, local cytokine production results in clonal expansion and differentiation into plasma cells, which then start secreting immunoglobulins intrathecally. Intrathecal synthesis of immunoglobulins occurs in a wide variety of neurological diseases, but is most commonly associated with multiple sclerosis and other autoimmune conditions, and infections of the CNS. The immunoglobulin most widely studied is IgG, and this is associated mainly with subacute and chronic conditions.
Cerebrospinal fluid protein index
The general approach to detecting intrathecal synthesis relies upon the fact that it is possible to calculate the expected CSF concentration for any protein if the plasma concentration of that protein and the integrity of the blood–CSF barriers are known. The integrity of the blood–CSF barrier is given by the CSF/plasma quotient for albumin. If the blood–CSF barriers are intact, the albumin quotient is typically < 7 × 10− 3; as the barriers become progressively impaired, so the quotient rises, owing to passage of albumin from blood into CSF. Impairment of the barriers will also cause the protein in question to leak from plasma to CSF – but the CSF/plasma quotient for that protein remains roughly in proportion to that of albumin, assuming there is no local synthesis. If local synthesis of protein occurs, then the protein quotient will be increased relative to that of albumin. Thus the ratio of protein quotient to albumin quotient will be increased when local synthesis occurs.
The ratio of quotients is known as the protein index and is given by:
This method has been widely used in the past to evaluate intrathecal IgG synthesis, but has now been superseded by examining CSF for IgG oligoclonal bands.
Oligoclonal bands
Locally synthesized IgG demonstrates qualitative differences from that which is normally present. Following serum electrophoresis, the normal gamma globulin region is revealed as a diffuse smear. As CSF gammaglobulins are normally derived from the plasma, they show a similar pattern on electrophoresis. When local synthesis is present, however, electrophoresis of CSF shows multiple discrete bands that are superimposed on the diffuse IgG background. These bands are not seen in the serum. The bands are thought to represent the products of the limited number of clones of plasma cells that are present in the CNS. The pattern is referred to as oligoclonal IgG banding. Due to its higher resolution, isoelectric focusing (IEF) is the method of choice for detecting oligoclonal bands (Fig. 34.2). Oligoclonal bands of IgM and free κ and λ light chains may be detected in a manner analogous to that of IgG.
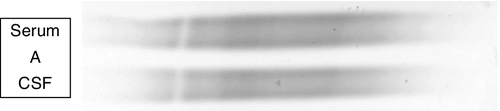
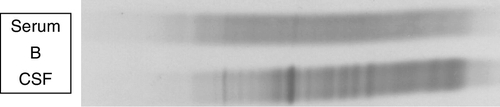
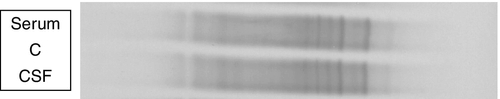
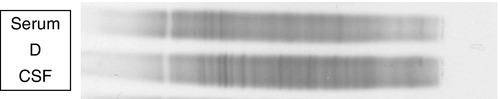
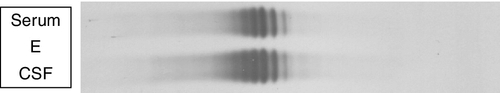
FIGURE 34.2 Isoelectric focusing (IEF) of serum and CSF showing the five basic patterns. (A) normal polyclonal pattern in both CSF and serum. (B) oligoclonal IgG in CSF, absent from serum, typical of local (intrathecal) IgG synthesis. (C) oligoclonal bands in both CSF and serum with an identical band distribution (spectrum). this is termed a ‘mirror’ pattern and is indicative of a systemic, but not intrathecal, limited clonal IgG synthesis. (D) here, there are oligoclonal bands in both CSF and serum, but there are additional bands in the CSF which are not present in the serum, indicative of both systemic and additional intrathecal limited clonal IgG synthesis. (E) there are identical bands in both CSF and serum. The pattern shows a striking ladder appearance with an identical spacing between adjacent bands. This is highly characteristic of a monoclonal gammopathy.
Papers discussing the relative merits of these approaches (qualitative versus quantitative) are provided in the Further reading list. All the evidence indicates that detection of oligoclonal bands is significantly more sensitive than measuring the IgG index in detecting intrathecal synthesis. The reason is simple: owing to population variation and the compounded imprecision of the four immunoassays necessary to calculate the IgG index, the CSF IgG concentration needs to increase substantially before the index becomes abnormal. Oligoclonal bands, by contrast, can be detected when individual bands constitute only 1–2% of the total IgG concentration in CSF. A serum sample must be analysed concurrently with the CSF so that oligoclonal immunoglobulins present in the CSF may be shown to be unique to the CSF, as opposed to those that have originated in the plasma and diffused across the blood–CSF barriers (see Fig. 34.2).
Brain-specific proteins
Measurements of concentrations of proteins synthesized by cells within the CNS and released into the CSF during inflammation or cell destruction are now firmly established tools in the diagnosis of neurological disease. Often described as brain-specific proteins, they are more correctly referred to as brain-enriched proteins. They include proteins such as glial fibrillary acid protein (GFAP), a product of astrocytes; S100, a product of glial cells; 14-3-3, a neuronal cytoplasmic protein; tau and phosphorylated tau, products of the neuronal cytoskeleton; and the amyloid components Aβ1-40 and Aβ1-42.
Glial fibrillary acid protein is a component of the astrocyte cytoskeleton. When astrocytes are damaged or undergo activation in response to a variety of cytokine messengers, GFAP may be released into the extracellular compartment from where it diffuses into the CSF. A raised CSF GFAP concentration generally indicates astrocyte damage and/or reactive astrocytosis.
All cells in the body differentially express the S100 family of proteins, of which 14 are currently known. They are found in the cytoplasm and all undergo conformational changes in response to binding calcium. They also interact with key enzymes in a variety of metabolic pathways. In this way, calcium fluxes within the cell can modulate metabolic activity. In the brain, the S100ββ homodimer, produced by microglial cells, is the most important member. A high CSF concentration of S100ββ is associated with gliosis. In addition, the monomer S100β acts as a cytokine and is released by microglial cells in response to inflammatory mediators. It is of note that in high concentrations, S100β can induce apoptosis in cells. As the CSF concentration represents a global average of the production throughout the brain, there may be regional high concentrations causing cell death, which may not always be detected by examining lumbar CSF.
14-3-3 Proteins derive their name from a classification scheme based upon separation by a combination of chromatography and the coordinates of the original protein spot on two-dimensional gel electrophoresis. Once again there is a family of at least ten members, of which 14-3-3γ is the most important isoform in the CNS. 14-3-3 Proteins are cytosolic and they interact reversibly with a wide range of ligands. Their main physiological role is to connect the cytoplasmic region of cell-surface receptors with their intracellular effector molecules (usually enzyme precursors). 14-3-3 Proteins are ubiquitous in cells, and can make up as much as 1% of the total intracellular protein concentration. Thus 14-3-3 proteins are useful markers of cell disruption, and 14-3-3γ is particularly helpful in neurology as it is associated primarily with neurons. 14-3-3γ is a reliable marker of neuronal cell loss when such loss occurs rapidly and extensively, and high CSF values are found in paraneoplastic neurological syndromes, viral encephalitis and neurodegenerative conditions (such as sporadic Creutzfeldt–Jakob disease, CJD). It is not useful in conditions in which neuronal cell loss occurs slowly but progressively (e.g. in Alzheimer disease), because the rate at which it is released is no faster than that by which it is cleared from the CSF.
Tau protein and phosphorylated tau are components of the neuronal cytoskeleton. The phosphorylation of tau is enzymatic and controls the extent to which the protein is incorporated into the cytoskeleton. Tau can be phosphorylated at multiple sites, and in certain conditions, hyperphosphorylated tau is found. It is not yet clear whether the hyperphosphorylation is the cause or a consequence of the underlying conditions. Increased concentrations of total tau and hyperphosphorylated tau are associated with the formation of the neurofibrillary tangles that are seen in several neurodegenerative conditions, especially Alzheimer disease.
Aβ1-40 and Aβ1-42 are two proteolytic fragments of protein Aβ (which stands for amyloid protein β). Aβ is a constitutive protein that is expressed by nearly all cells of the CNS. The normal metabolism of Aβ requires it to undergo highly specific proteolytic cleavage to form products that are highly soluble and readily removed. In some neurodegenerative conditions, however, the proteolysis is aberrant, giving rise to larger fragments that are insoluble, and which accumulate in the form of an extracellular amyloid. Aβ1-40 and Aβ1-42 are two of the normal fragments containing 40 and 42 amino acids, respectively. In some dementias, including Alzheimer disease, there is a decrease in the CSF concentration of both Aβ1-40 and Aβ1-42, which reflects the fact that these components, rather than being in the soluble form (and hence measurable in the CSF), are present as insoluble fragments that are deposited within the CNS.
Cerebrospinal fluid oto- and rhinorrhoea
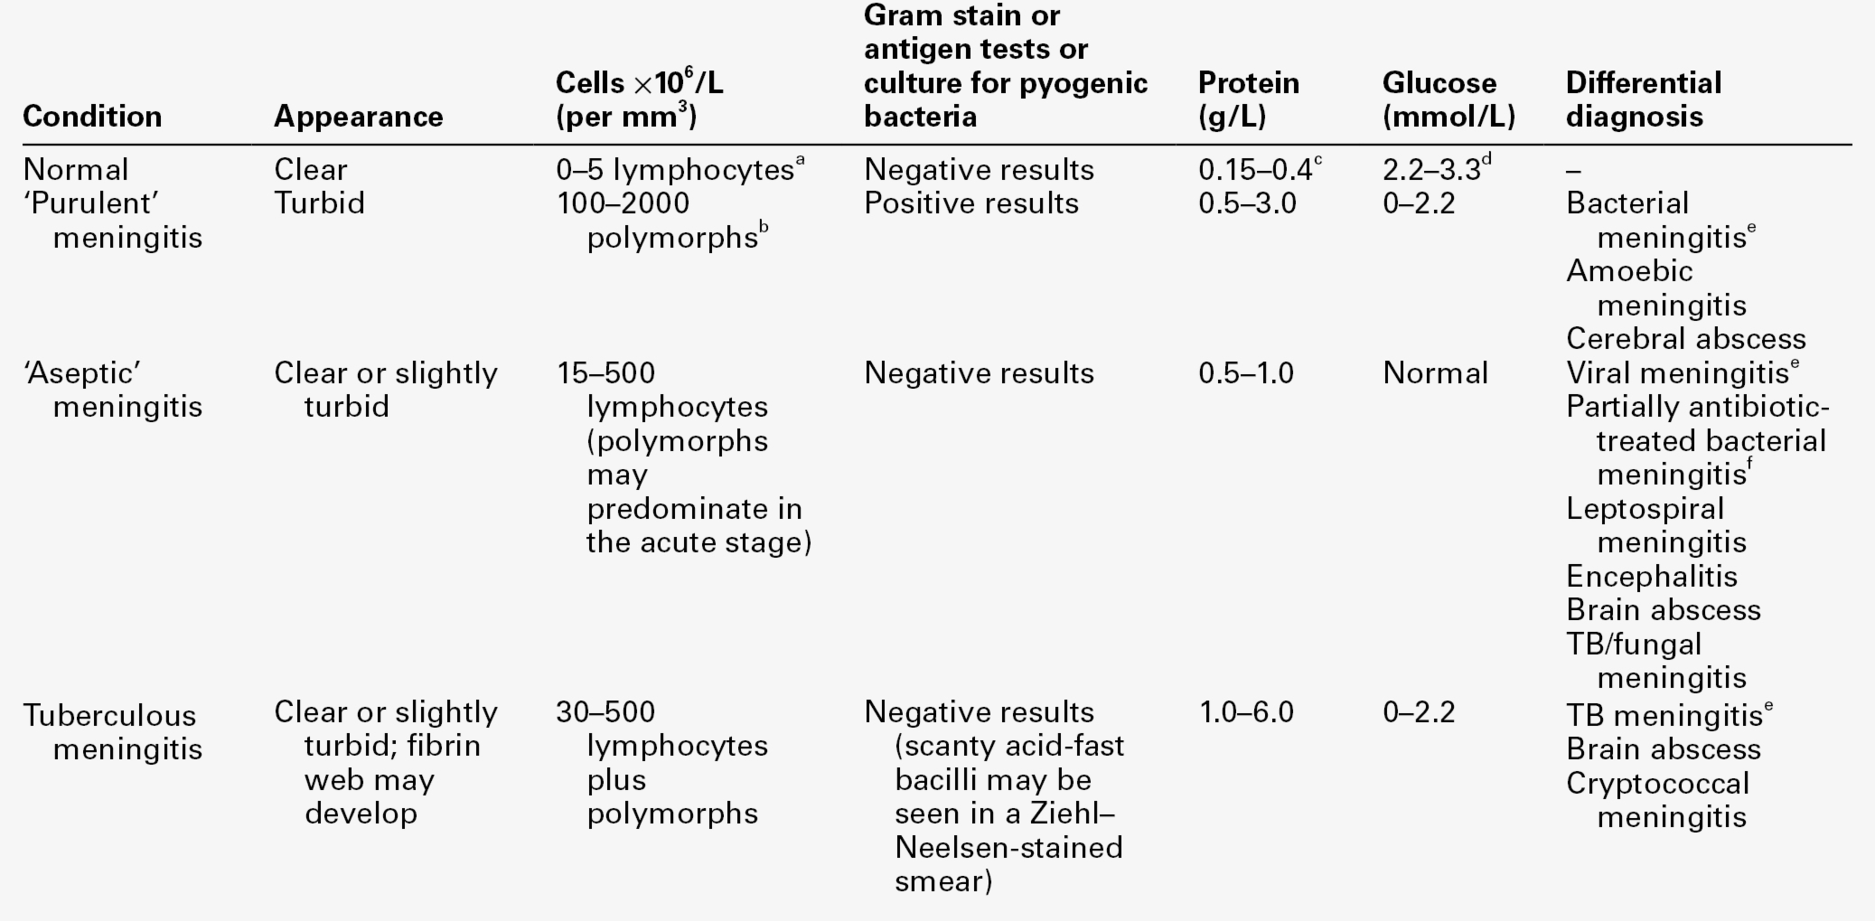
The leakage of CSF from the intracranial cavity can potentially be serious and usually occurs following skull fractures, although it can be a complication of intracranial surgery, infection or neoplasia, and can also occur spontaneously. Cerebrospinal fluid is characterized by the presence of a β2-transferrin band. This is often termed tautransferrin but, as there is a risk of confusion with the other tau proteins (see above), the use of the name asialotransferrin is preferred. Asialotransferrin is a desialylated form of transferrin. In the blood, desialylated transferrin is rapidly removed (half-life 20 min) by the asialoglycoprotein receptor that is present on the cells of the liver and reticuloendothelial system. The asialoglycoprotein receptor is not expressed in the CNS, so asialotransferrin accumulates in CSF. In normal CSF, asialotransferrin constitutes about 25% of the total transferrin. Asialotransferrin is not present to any great extent in plasma, nasal secretions, tears, saliva or other potentially confounding fluids. Asialotransferrin is easily detected by immunofixation or immunoblotting following electrophoresis (Fig. 34.3). Other proteins that have been used include transthyretin (prealbumin), β-trace (prostaglandin D-synthase) and γ-trace (cystatin-C) proteins. These are not CSF specific, detectable amounts of all occurring in normal plasma, so interpretation of fluid concentrations is difficult. Measurements of both glucose and chloride concentrations have been shown to lack the discriminatory power of asialotransferrin and should be discontinued.
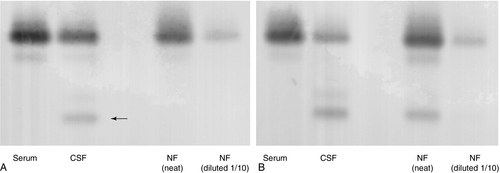
FIGURE 34.3 Transferrin glycoforms in the detection of CSF rhinorrhoea. (A) lane 1, control serum; lane 2, control CSF; lanes 3 and 4, a sample of nasal fluid (NF) which does not contain CSF. The asialotransferrin band is indicated by the arrow. (B) lane 1, control serum; lane 2, control CSF; lanes 3 and 4, nasal fluid containing CSF. In each case, the nasal fluid samples were applied undiluted and diluted 1/10.
Haem pigments and ferritin
Oxyhaemoglobin and bilirubin appear in the CSF in a time-dependent manner following an intracranial bleed. Oxyhaemoglobin is released during in vivo cell lysis, appearing within a few hours. Following a split into haem and globin, haem is then metabolized to biliverdin by an inducible haem oxygenase followed by reduction to bilirubin by biliverdin reductase; both enzymes are present in cells of the CNS. While animal studies indicate that enzyme induction is maximal by 12 h, this will not necessarily equate to the certainty that an increase in CSF bilirubin will be observable in all patients 12 h after a bleed, given the inevitable biological variation that occurs and possible interspecies differences. Evidence from one apparently definitive study, that CSF bilirubin concentrations were increased by 12 h in all of 111 patients after a proven intracranial bleed, has to be viewed with caution owing to the ambiguous definition of xanthochromia used in this study. Oxyhaemoglobin is also released as a result of in vitro lysis of red cells. While initial studies indicated that the degree of lysis is proportional to both red cell count and time delay before separation of supernatant from cells by centrifugation, more recent studies have indicated that the in vitro formation of oxyhaemoglobin cannot be reliably predicted. The very low concentration of bilirubin normally present in CSF arises from the passage of albumin-bound bilirubin from plasma into CSF and, hence, will be increased if either or both of the plasma albumin-bound bilirubin and CSF albumin is increased. Under certain circumstances, allowance can be made for this when determining if an intracranial bleed has occurred.
Release of iron from haem also stimulates CNS synthesis of ferritin, with subsequent passage of ferritin into the CSF.
Examination of CSF for haem and bilirubin
The currently recommended method for detecting haem and bilirubin in CSF is spectrophotometry, which should cover the range 350–600 nm. An accumulating body of evidence now indicates that visual inspection of CSF for xanthochromia is an unreliable method of confirming an intracranial bleed, because it is insensitive, subjective, non-quantitative, does not distinguish between oxyhaemoglobin and bilirubin and provides no objective record of detection. Direct chemical methods of measuring bilirubin concentration in CSF need to be evaluated rigorously, as does the measurement of CSF ferritin concentration in the investigation of intracranial bleeds.
Enzymes in CSF
Measuring enzyme activities in CSF used to be popular. For example, increased lactate dehydrogenase (LDH) activity has been reported to be a more sensitive and earlier marker than CSF glucose concentration in detecting bacterial meningitis. Unfortunately, however, there is significant overlap between cases diagnosed with bacterial and aseptic/viral meningitis. In addition, false elevations of LDH activity occur in erythrocyte-contaminated CSF. Lactate dehydrogenase activity is also increased in the presence of various primary CNS tumours and when there is meningeal metastatic spread, when the increase involves predominantly the LDH4 and LDH5 isoenzymes.
β-Glucuronidase, creatine kinase BB (CKBB), neuron-specific enolase (NSE), glucose 6-phosphate isomerase (G6PI) and alanine aminotransferase (ALT) are other intracellular enzymes known to be released into CSF by various primary and metastatic tumours. Creatine kinase BB and NSE are also increased during cerebral ischaemia and various meningoencephalitides, thereby limiting their specificities. Ischaemic brain damage can either be reversible or permanent. Although patients suffering major ischaemic events tend to have higher CSF activities of CKBB, LDH, NSE and ALT, the discrimination between recoverable and permanent damage usually requires serial sampling of CSF, and even then the predictive value is low.
Angiotensinogen-converting-enzyme (ACE) is a putative marker of neurological involvement in sarcoidosis. Care must be taken to correct for serum ACE activity, which may be increased in systemic sarcoidosis, and to correct for blood–CSF barrier leakage using either albumin or CSF total protein. The sensitivity of the test is low and the diagnosis of neurosarcoidosis, in the absence of positive CNS histology, remains a presumptive one based on the evidence of CNS inflammation, systemic sarcoidosis and exclusion of alternative diagnoses.
In recent times, measurement of enzyme activities in CSF has generally given way to quantitative immunoassays that measure the enzymes in terms of protein mass. The use of antibodies also means that isoform-specific immunoassays, which offer significant advantages in terms of determining the tissue of origin over the more crude measurement of overall enzyme activity, can be developed.
Markers of inflammation
Neopterin
is the oxidized form of D-7,8-dihydroneopterin, which is produced by macrophages when stimulated by γ-interferon released by activated T cells. Increased concentrations in body fluids are observed following viral, bacterial and fungal infections, as well as other cell-mediated immunopathologies, such as coeliac disease. Cerebrospinal fluid neopterin concentrations are normally very low, as pterins do not readily cross the blood–brain barrier. Increased neopterin concentrations in the CSF thus reflect the presence of activated microglia, the CNS equivalents of macrophages.
There is interest in the measurement of CSF concentrations of neopterin (and dihydroneopterin, which may be the dominant form in CSF, but is more difficult to measure) as a non-specific marker of CNS cellular immune activity. Particular applications have included monitoring the response of multiple sclerosis patients to treatment, detecting possible CNS infections in immunocompromised subjects, such as those with acquired immune deficiency syndrome (AIDS), and establishing evidence of infections when the aetiological agents are difficult to isolate.
β2-Microglobulin (β2M)
is an 11 800 Da protein that is non-covalently bound to the class 1 molecules of the major histocompatibility complex (MHC). While expressed on the surface of virtually all nucleated cells, it is present in highest concentrations on activated lymphocytes and macrophages. Cerebrospinal fluid concentrations of β2M increase with age and appear not to be correlated with plasma concentrations in diseases affecting the CNS. Increased concentrations of CSF β2M occur in conditions associated with the presence of activated lymphocytes within the CNS or with increased proliferation and turnover. Measurement of CSF β2M concentration has been shown to be of value in the early detection of metastatic lymphomas and the spread of leukaemias to the CNS. While both neopterin and β2M are potentially valuable markers of CNS inflammatory responses, their use as markers of specific pathologies is likely to be limited by the non-specific nature of the inflammatory response.
C-reactive protein (CRP)
is a protein synthesized by hepatocytes. Synthesis is increased by several cytokines, but principally interleukin-6, which is released from macrophages that become activated during inflammatory events; this is most notable in bacterial infections, and occurs only to a much smaller degree in viral infections. The inflammatory cells themselves do not synthesize CRP. As with other plasma-derived proteins, the concentration of CRP in the CSF roughly parallels that in the plasma, and is normally < 50 μg/L. Increased serum concentrations are observed in patients with bacterial meningitis. Measuring CSF CRP concentrations in bacterial meningitis is of limited value, however, as they are highly variable and are often not as high as might be expected. This is most likely due to CRP binding by bacteria.
Non-biochemical investigations
The investigation of CNS disorders involves many disciplines (Box 34.1). While the naked eye examination of the CSF is a simple test to perform, it is vital to appreciate that it is subjective and unreliable, and that significant abnormalities may be present when the CSF appears to be clear and colourless. The diagnosis of bacterial meningitis is a medical emergency and prompt treatment may mean the difference between complete recovery and severe morbidity or even death. Infections cause characteristic changes in the differential white cell count, and sometimes in a Gram stain of a spun deposit (Table 34.3). It is worth noting, however, that white blood cells do not appear in the CSF of patients with bacterial meningitis until ~ 12 h after the bacteria. These investigations, together with simple biochemical tests (glucose, protein and, if possible, serum CRP and CSF lactate concentrations) should be available as ‘stat’ tests offering results within 1 h of sampling. Most bacterial infections can be confirmed by standard culture techniques within 24 h. Antigen tests for a number of infective agents are also in use. A particular problem is the positive and rapid identification of viral and fungal infections. With most microbiological infections, polymerase chain reaction (PCR) is the analytical technique of choice in the acute stage of infection. In the subacute and chronic stages, however, PCR tests may be negative. In these instances, recourse to detection of specific antibody responses is necessary. Newer techniques include the detection of antigen-specific oligoclonal bands.
TABLE 34.3
Characteristic CSF changes in meningitis and the differential diagnosis
From Shanson DC. Microbiology in Clinical Practice, 3rd edn. Oxford: Butterworth Heinemann, 1999, with permission.
a In a neonate, up to 30 × 106 cells/L, mainly polymorphs.
b A few cases of pyogenic meningitis may have 5–100 × 106/L polymorphs.
c In neonates, protein concentration up to 1.5 g/L.
Modern imaging techniques, for example spiral computerized tomography (CT), magnetic resonance imaging (MRI) and positron emission tomography (PET), are important in the diagnosis of many CNS lesions, in conjunction with laboratory investigations of CSF. In some instances, for example intracranial tumours, imaging has largely replaced the need for CSF cytology. Nevertheless, CSF cytology still plays an important role in investigating raised white cell counts in inflammatory conditions and also in detecting and monitoring CNS invasion by leukaemias. Background information on neuroradiological methods and clinical neurophysiological techniques may be obtained from the Further reading list.
BIOCHEMICAL INVESTIGATIONS IN CNS DISORDERS
Acute infections
Infections of the CNS that can present acutely include viral meningitis, bacterial meningitis, cerebral abscess, subdural empyema and viral encephalitis. Acute bacterial meningitis is a life-threatening infection that needs urgent treatment, whereas viral meningitis is generally a less severe disease that is usually followed by complete recovery.
The cellular and microbiological examination of CSF plays a central role in the investigation of suspected infection, and a full description can be found in the Further reading list. Nevertheless, there are occasions when this does not provide a definitive answer; biochemical tests are useful as adjuncts in the diagnosis of infection and need to be available on an urgent basis. Two tests widely employed have been measurement of CSF protein and glucose concentrations, and these have for many years been considered to be essential in the investigation of cases of suspected meningitis. Protein concentration is usually raised, more so in bacterial than in viral meningitis, but there is considerable overlap; rarely, it may be normal. The presence of protein is simply a marker of barrier impairment. Glucose concentrations are usually depressed in bacterial meningitis but often remain normal in viral meningitis. However, CSF glucose concentration may be reduced in some non-bacterial causes of meningitis. Concentrations < 1.0 mmol/L are usually found only in severe bacterial meningitis. A CSF:plasma glucose concentration ratio of < 0.4 is typical of bacterial meningitis, although a normal value does not exclude the diagnosis.
Cerebrospinal fluid lactate concentrations are raised in bacterial meningitis, but are usually normal (< 2.5 mmol/L) in viral meningitis. Concentrations > 3.5 mmol/L have been considered indicative of bacterial meningitis, with values < 3 mmol/L being more consistent with a viral aetiology. Rapid measurement of CSF lactate has proved of particular value in cases of diagnostic difficulty, for example partially treated bacterial meningitis (when Gram stain and culture are negative and cell counts may be atypical), and early in some viral meningitides when there may be a predominance of polymorphs and variably depressed glucose concentrations. With a threshold of 3.5 mmol/L, the sensitivity and specificity of CSF lactate are greater than those of either CSF glucose or protein concentration, in terms of discriminating between bacterial and viral meningitis.
Measurement of serum CRP concentration may be of value in patients presenting with equivocal CSF findings, with concentrations > 100 mg/L being consistent with a bacterial infection. Serum procalcitonin may provide even better discrimination between bacterial and viral infections. Measurement of serum CRP concentration also enables a rational decision to be made on the duration of antibiotic therapy in patients with brain abscesses or subdural empyemata.
The most reliable indicator of acute infection remains the CSF cell count and differential, with measurement of CSF lactate concentration being used for diagnostically difficult cases. Measurement of cerebrospinal fluid protein appears to add nothing to the diagnosis. Chloride estimation, once widely advocated for the diagnosis of tuberculous meningitis, has been shown to be of no value.
Chronic infections
Chronic infection of the CNS may be caused by viruses, bacteria, spirochaetes, parasites and fungi. In patients who are immunocompromised, most commonly due to cytotoxic drug therapy for cancer, fungal infections and reactivation of latent viral infections are particularly troublesome. In all of these situations, the interpretation of standard PCR techniques can be difficult, as the mere presence of viral or bacterial nucleic acid alone does not always represent a causal relationship. Quantitative PCR, which measures the amount of nucleic acid and so gives an indication of the numbers of organisms present, is superior but still not definitive.
Serological tests for the presence of antibodies are based on the premise that the continued presence of the causative organisms will maintain production of specific antibodies. These tests can suffer from memory effects – the immune system generally maintains a vast memory bank of B cells that manufacture antibodies to individual target antigens. The immune system is frequently upregulated in many inflammatory conditions and this can lead to increased production of antibodies by some or many of these memory cells. If the upregulation occurs in response to a particular infectious agent, then the antibody production will be more specific towards that organism. Antibody production can be measured by enzyme-linked immunosorbent assay (ELISA) or similar technology. However, this approach can make it difficult to distinguish antibodies that vary in affinity from those that vary in quantity, for example a small amount of high-affinity antibody can give the same signal in an ELISA as a larger amount of low-affinity antibody. An alternative approach is to use immunoblotting after isoelectric focusing. This relies on coating a nitrocellulose or similar membrane with the target microorganism. This is then used to immunoblot the CSF and serum following isoelectric focusing. The membrane is subsequently tested for bound immunoglobulin. In this way, oligoclonal bands against the organism in question can be identified. The pattern can then be compared with that found in standard isoelectric focusing (which reveals total IgG oligoclonal bands). If the spectrum of bands seen on the antigen-specific blot resembles that on the total IgG blot, then the causative organism is identified. If, however, the antigen-specific pattern bears no resemblance to the total IgG pattern, then it is unlikely that the organism under study is causally related to the disease. Although the antigen-immunoblotting technique can be extremely powerful, it is still under development and should be used as an adjunct to classic serological assays.
Haemorrhage and obstruction
Intracranial haemorrhage can occur due to spontaneous rupture of cerebral blood vessels, as a result of injury, malignancy-associated necrosis or as a consequence of bacterial meningitis leading to a diffuse vascular haemorrhage. All may result in the passage of blood into the CSF, with consequent formation of oxyhaemoglobin and bilirubin. By far the most important cause of an intracranial bleed is spontaneous rupture of a cerebral aneurysm into the subarachnoid space, termed a subarachnoid haemorrhage (SAH). In the majority of patients, diagnosis presents no problem. However, a number of studies have shown an initial misdiagnosis rate of up to 30%, often in patients presenting in a good clinical condition with no focal neurological signs, leading to a significantly poorer outcome than in those in whom the correct initial diagnosis has been made.
Following SAH, blood is usually visible on a computerized tomography (CT) scan, and this is the test of choice in the initial examination. This will be positive in over 95% of patients within the first 24 h, but in only 50% one week after the bleed. It is in those patients in whom the CT scan is negative or not available that CSF should be examined for oxyhaemoglobin and bilirubin, preferably waiting for 12 h after the onset of symptoms prior to puncture to allow for the formation of bilirubin. Wherever possible, CSF should be examined by spectrophotometry with analysis and interpretation provided according to the guidelines cited in the Further reading list.
Hydrocephalus is a common complication of trauma and obstruction and is best investigated by CT scanning. Shunts inserted to drain CSF into the systemic circulation or peritoneal cavity may become obstructed with a subsequent increase in CSF protein concentration, which may provide an indication that obstruction has occurred.
Inherited metabolic diseases
Biochemical examination of CSF is of value in the diagnosis of certain inherited metabolic diseases.
Patients with primary defects of pyruvate metabolism, for example pyruvate dehydrogenase deficiency or mitochondrial disorders, present with a variety of clinical features. Some, when symptomatic, have a systemic metabolic acidosis with elevated blood lactate concentrations; some may have a near-normal hydrogen ion concentration, mild elevations only of blood lactate concentration but elevated CSF lactate concentration. Measurement of CSF lactate may thus be helpful when such defects are suspected, although normal concentrations do not exclude them. Cerebrospinal fluid lactate determination may also be helpful in certain organic acidaemias.
Cerebrospinal fluid amino acid measurement is of established value in confirming the diagnosis of glycine encephalopathy (non-ketotic hyperglycinaemia) in neonates and infants. In this disorder, the CSF glycine concentration is high whereas the blood glycine concentration may be only mildly elevated or within the reference range for age. The most sensitive discriminator is the CSF:plasma glycine molar ratio, which is increased from the normal 0.025–0.1.
In patients with defects in biopterin metabolism, measurement of CSF biopterin concentrations and the concentrations of the biogenic amine metabolites, homovanillic and 5-hydroxyindoleacetic acids, may be of value in confirming the diagnosis.
Malignancy
In space-occupying lesions of the brain that may be germ cell tumours, the initial approach is to measure serum human chorionic gonadotrophin (hCG) and α-fetoprotein (AFP) concentrations. Pointers to a possible germ cell tumour are a space-occupying lesion in the pineal or suprasellar regions in a male under 15 years of age. The nature of the tumour is usually defined from tissue obtained during surgery. Where operation is contraindicated and serum hCG and AFP concentrations provide no information as to tumour type, there may be a need to measure hCG and AFP concentrations in the CSF.
Rarely, there may be the requirement to examine CSF for monoclonal IgG, IgM, κ or λ when a CNS lymphoma is suspected.
Dementia
Dementia is defined as a global impairment or loss of intellectual function. There are over 50 identified causes of dementia, including various neurodegenerative diseases, such as Alzheimer disease and Parkinson disease; cerebrovascular diseases; infectious diseases; demyelinating disorders; metabolic disorders, such as Wilson disease and the leukodystrophies; malignancies; epilepsies; traumatic brain disease; systemic disorders, such as endocrine disease and vitamin deficiencies, and toxic disorders, including alcohol dependency and drug toxicity. Mental illnesses, such as depression and schizophrenia, may also present with features of dementia. With the increasing life expectancy in developed nations, neurodegenerative diseases, such as Alzheimer disease, are becoming major social burdens. As several types of dementia are treatable, it is important that a diagnosis can be made reliably. Many of these diagnoses are relatively straightforward and require laboratory blood tests that are covered elsewhere in this book. Few involve CSF analysis.
Unfortunately, there are no specific CSF tests for any of the dementias. The differential diagnosis is generally made using a combination of clinical features, CSF findings and the exclusion of other diagnoses. Recent developments in neurogenetics are particularly helpful where there is a familial predisposition, but may not be useful in the majority of cases, which are sporadic in nature.
Cerebrospinal fluid analysis in dementia is generally intended to exclude an infective or demyelinating disorder, as described elsewhere. In specific cases, CSF analysis is intended to detect evidence of neurodegeneration – the death of neurons. Examples include the neuronal cytoplasmic proteins 14-3-3, neuron-specific enolase (NSE) and neurofilament proteins. Unfortunately, while the intracellular amounts of these proteins are quite high, for example 14-3-3 protein constitutes ~ 1% of the total cytoplasmic protein of neurons, CSF concentration is generally only raised when there is extensive neuronal loss occurring over a short time period. They can be useful markers in conditions such as sporadic Creutzfeldt–Jakob disease (CJD), paraneoplastic neurological disease and chronic viral infections such as subacute sclerosing panencephalitis (SSPE), but generally they are of little use in detecting slowly progressive neurodegeneration conditions, such as Alzheimer disease or Parkinson disease. In (new) variant CJD, 14-3-3 is a less sensitive marker than in sporadic CJD. The best markers currently available for Alzheimer disease are a combination of Aβ1-40 and total tau (see above, Brain-specific proteins). Some dementias are associated with gliosis or astrocytosis, for example Pick disease, and this may lead to an increase in CSF concentrations of S100ββ protein and/or glial fibrillary acidic protein (GFAP).
Cerebrovascular disease is second only to Alzheimer disease as a cause of dementia. The usual pathology is subcortical infarcts secondary to embolism or disease of small blood vessels (microangiopathy). Unfortunately, there are no reliable CSF diagnostic tests, although a comprehensive examination of blood haemostatic factors including platelet count, specific clotting factors and antiphospholipid antibodies may be helpful. A strong clinical clue is that cerebrovascular dementia, in contrast to other types, tends to be of acute onset and usually progresses in a stepwise manner.
Cerebrospinal fluid analysis in demyelinating diseases
There are many diseases that affect the myelin sheaths of neurons. One of the most significant is multiple sclerosis (MS), which affects ~ 125 per 100 000 young adults in the UK, with an annual incidence of ~ 5 per 100 000. The condition affects twice as many women as men, and usually first presents between the ages of 20 and 40. Autoimmunity is involved in the pathogenesis, but whether as a primary or secondary event is uncertain. Multiple sclerosis is a progressive disorder, typically presenting with a relapsing remitting clinical picture (relapsing remitting MS, RRMS). Some patients have a relentless progressive form of the disease, so-called primary progressive MS (PPMS), while the overwhelming majority of patients who start with RRMS eventually develop a progressive form of the condition, and these are classed as having secondary progressive MS (SPMS). This clinical stratification is important as a guide to choosing an appropriate therapeutic strategy.
The acute lesion of MS is the plaque, which is characteristically a demarcated area of demyelination associated with swelling of axonal cylinders and infiltration by inflammatory cells. This is followed by gliosis and disappearance of the inflammatory infiltrate leading to the formation of a chronic plaque, largely devoid of myelin. Some remyelination can occur during remissions, but this is generally incomplete. The cause of MS is unknown, but epidemiological evidence suggests an environmental influence, possibly coupled to a genetic predisposition. There is a higher concordance of MS in monozygotic twins compared with dizygotic twins.
Clinical diagnosis of MS can be extremely difficult, particularly in the early stages of the disease when only an isolated focal region of the brain may be affected (this is sometimes termed clinically isolated syndrome). As more of the CNS becomes affected and the symptoms reflect this, then clinical diagnosis becomes easier. The diagnosis depends upon demonstrated clinical evidence for demyelination affecting different areas of the brain at different times. This spatial and temporal separation of lesions is the hallmark of RRMS, and clearly distinguishes MS from similar disorders of myelin, such as acute disseminated encephalomyelitis, in which the clinical presentation of symptoms is typically monophasic. Multiple sclerosis can also be distinguished on MRI by the characteristic individual lesions that are scattered throughout the CNS. Unfortunately, the brain accumulates small areas of damage as part of normal ageing, and it can be difficult to differentiate the lesions of MS from those of age.
While current guidelines, published in 2001 and reviewed in 2005, admit a more prominent role for MRI in the diagnosis of MS than previously, biochemically, the hallmark of MS remains the presence of oligoclonal IgG bands in the CSF that are absent from paired serum. These locally synthesized oligoclonal bands are found in at least 98% of patients with MS and are so indicative of MS that they are incorporated into the pathological definitions of the disease: a clinical diagnosis of MS, based in part on MRI findings has to be called into doubt if there are no oligoclonal bands in the CSF. Oligoclonal bands are not, however, specific for MS and can be found in many other inflammatory and autoimmune conditions affecting the brain. The presence of oligoclonal bands and a CSF protein of > 1 g/L points to a diagnosis other than MS. The current gold standard method for detecting oligoclonal IgG is isoelectric focusing coupled to nitrocellulose immunoblotting. This approach is significantly more sensitive at detecting abnormalities of CSF IgG than any of the quantitative measurements (see p. 664).
Additional supportive evidence for MS may be provided by evoked potentials. These are electrical signals generated in response to sensory stimuli. Lesions affecting the optic nerve, the most common isolated site, may be detected by visual evoked potentials, which demonstrate attenuation of amplitude and prolonged latency.
CONCLUSION
Measurement of CSF lactate and glucose concentrations plays a limited but important role in the differential diagnosis of suspected acute CNS infection, particularly when the immediate microbiological examination of the CSF sediment does not provide a diagnosis.
Determination of CSF protein concentration is of limited value in the detection and differential diagnosis of acute infection. Indeed, it may be misleading, as some have used a normal result as an indication not to proceed with a search for organisms. Protein analysis is of value in suspected Guillain–Barré syndrome and MS, when a value > 1 g/L in the presence of oligoclonal bands points to an alternative diagnosis.
In most other disorders of the CNS, routine estimation of protein (and glucose) concentrations, although relatively cheap and apparently simple, does not appear justifiable unless it would truly influence patient management. This rarely appears to be the case where modern imaging techniques are available. The remainder of the tests described have a role appropriate to particular diagnostic problems.
The detection of locally synthesized oligoclonal IgG bands remains crucial in the investigation of suspected demyelinating disease, such as multiple sclerosis. Polymerase chain reaction (PCR) with an appropriate detection system is now the technique of choice in diagnosing acute viral infections, but antibody assays still have a role in chronic infections. At the same time, with increasing emphasis on ameliorating the harmful effects of inflammation, there may emerge a role for the measurement of concentrations of cytokines and other components of the inflammatory response. Continuing research into the various dementias has highlighted several useful biochemical markers that provide diagnostic information.
ACKNOWLEDGEMENT
We would like to acknowledge the contribution of Robert Beetham, who was a co-author of this chapter in previous editions of this book.
Further reading
[/level-membership-for-endocrinology-diabetes-and-metabolism-category][not-level-membership-for-endocrinology-diabetes-and-metabolism-category]CHAPTER 34
Investigation of cerebrospinal fluid
Geoffrey Keir; Carrie Chadwick
CHAPTER OUTLINE
CEREBROSPINAL FLUID PHYSIOLOGY
Analysis of cisternal or ventricular fluid
INVESTIGATIONS RELEVANT TO PHYSIOLOGY AND PATHOPHYSIOLOGY
Cerebrospinal fluid oto- and rhinorrhoea
Non-biochemical investigations
BIOCHEMICAL INVESTIGATIONS IN CNS DISORDERS
INTRODUCTION
Spinal paracentesis (lumbar puncture) was introduced at the end of the 19th century for the therapeutic relief of raised intracranial pressure secondary to tuberculous meningitis. Within a few years, however, it was being used to sample lumbar cerebrospinal fluid (CSF) to aid clinical diagnosis. Analyses that were undertaken in these early days included microscopy for cells and chemical tests to measure reducing substances, protein and chloride. Even today, counting cells and measuring total protein and glucose remain the mainstay analyses routinely carried out on CSF specimens. Yet, modern analytical techniques make possible the quantitative and qualitative detection of a vast range of biochemical substances. It is the purpose of this chapter to assess critically the role of laboratory studies of CSF in the investigation of central nervous system (CNS) disorders. The results of these analyses must be considered both in the clinical context and in conjunction with the findings of other investigations, including neuroimaging and neurophysiological measurements.
A few points should be kept in mind when handling CSF. Despite the fact that well-documented procedures exist that will minimize discomfort, including that of post-lumbar puncture headache, the anticipation of a lumbar puncture (LP) is something that causes distress to many patients. This is not helped by the fact that, occasionally, even when carried out by an experienced practitioner, performing a satisfactory LP can prove difficult and uncomfortable and is not without the risk of epidural or subdural bleeding or infection. In many instances, only one spinal tap can be carried out. One reason is that the introduction of a needle into the lumbar sac to sample the CSF can lead to blood contamination of the remaining CSF. This can invalidate the taking of further samples for several days, the exact time being dependent upon the analyte being studied and the degree of blood contamination. There are also ethical reasons against repeating an invasive procedure for trivial reasons. Furthermore, in the very young, the volumes of CSF that can safely be taken are small. Collectively, this places a heavy burden of responsibility on laboratories to make sure that the maximum relevant information is achieved from the available fluid, and that none is wasted or prematurely discarded. Also, the analysis of CSF is multidisciplinary, and it behoves laboratories to ensure that there is the necessary cooperation among pathology specialties. It is strongly recommended that laboratories produce guidelines for doctors indicating sample requirements, and establish procedures to ensure that all CSF samples surplus to immediate analytical requirements are correctly stored. Like all body fluids, CSF is a potentially hazardous material and must be handled appropriately.
CEREBROSPINAL FLUID PHYSIOLOGY
Formation
In the normal adult, the total volume of CSF is about 150 mL. Cerebrospinal fluid is formed at a rate of approximately 500 mL/day, so the fluid is typically exchanged about four times daily (every 6 h). Infants and children have smaller CSF volumes that range from 30–60 mL in a neonate to 100 mL in a pre-teen.
While the choroid plexuses that line the ventricles are the major site of CSF production, as much as 30% of CSF is formed by fluid shifts across various vascular beds within the CNS, such as the cerebral capillaries and dorsal root ganglia. Unlike choroidal CSF, interstitial fluid forms throughout the brain and spine, and then diffuses into the CSF.
Cerebrospinal fluid formed in the lateral ventricles passes through the third and fourth ventricles into the cisterna magna, from where it circulates out into the cerebral and spinal subarachnoid spaces. The subarachnoid space lies between the two leptomeninges, the outer (arachnoid) mater and inner (pia) mater, which cover the whole brain and spinal canal down to the level of the second sacral vertebra. The flow of CSF from the cisterna magna is mainly upward and outward over the cerebral hemispheres to the main site of reabsorption through the arachnoid villi, which drain into the major dural sinuses. Flow down the cul-de-sac of the spinal cord is relatively sluggish. Thus, while the average turnover time of CSF is ~ 6 h, radiolabelled plasma albumin can continue to equilibrate with lumbar CSF for 1–2 days.
Composition
Solutes enter the CSF by a variety of processes, including active transport via specific transporter mechanisms present in choroidal epithelial cells, facilitated diffusion and passive diffusion.
Cerebrospinal fluid constituents may be derived from plasma, from the metabolic activities of cells normally present in the CNS or from cells and organisms present in the CSF as a result of pathological processes.
Analysis of cisternal or ventricular fluid
While the most common fluid obtained for analysis is lumbar CSF, there are occasions when CSF is taken from other regions, for example from one of the lateral ventricles (usually via a ventriculo-peritoneal or ventriculo-extracorporeal shunt), the 4th ventricle (by cisternal puncture) and even from around the cortex. It is extremely important that the anatomical site of the fluid is recorded, as the reference ranges for many constituents vary according to the anatomical source of the CSF.
INVESTIGATIONS RELEVANT TO PHYSIOLOGY AND PATHOPHYSIOLOGY
Sampling and pressure
Details of CSF sampling techniques are well described in standard textbooks of practical medical procedures. The initial hydrostatic pressure is between 80 and 180 mmH2O when the patient is in the lateral recumbent position. Ideally, four sequential fractions of CSF should be collected into sterile polypropylene containers. In an adult, a total of 10–12 mL of fluid should be withdrawn, but as little as 3 mL or less in the case of a neonate. The containers must be numbered in the order of collection. Typically, fraction 1, taken into a fluoride tube, is used for glucose (this fraction may also be suitable for protein measurement by some methods), fractions 2 and 3 are used for cell counts and microbiological examinations, i.e. Gram stain and culture, and fraction 4 is used for the assay of specific proteins and oligoclonal bands and, if required, spectrophotometry (in which case the tube must be protected from light from the moment of collection). Blood for glucose and, in the case of spectrophotometry, for total protein and bilirubin should be taken at the same time.
Appearance
Cerebrospinal fluid is normally crystal clear and colourless. The fluid appears turbid when there are more than 200 × 106 white cells/L (200/mm3) or 400 × 106 red cells/L (400/mm3). The presence of bacteria or contamination by epidural fat may also cause turbidity of the specimen. Clot formation may occur when protein concentrations are markedly elevated; where the source of the protein is blood then at least 1 000 000 × 106 red cells/L (106/mm3) are required for clotting to occur. Cerebrospinal fluid may be coloured yellow by bilirubin or, rarely, by carotenoids, red (or more usually pink/orange) by oxyhaemoglobin or brown by methaemoglobin. Yellow discolouration of CSF is called xanthochromia, a term that has often been used to encompass the colours imparted by both bilirubin and oxyhaemoglobin. Because the presence of oxyhaemoglobin and bilirubin is most appropriately detected by spectrophotometry, where this technique is used, the term xanthochromia should be avoided to minimize confusion.
Cells
The total leukocyte count in normal adult CSF is rarely > 5 × 10⁶/L mononuclear cells (lymphocytes and monocytes). The presence of even one polymorphonuclear leukocyte (neutrophil, polymorph) in the CSF should be a cause for concern in an adult. In neonates, however, the normal cell count is < 30 × 106/L (predominantly polymorphs), with < 10 × 106/L lymphocytes. Changes that occur in the presence of CNS infections form an important part of the initial diagnosis and will be considered later.
Erythrocytes are not normally present in CSF. They appear either following trauma to blood vessels during LP or after an intracranial bleed. A traumatic LP occurs when the needle damages a blood vessel while passing through the vascular epidural space, thereby introducing blood directly into the lumbar sac, and is estimated to occur in 15–20% of all LPs. Traumatic contamination complicates interpretation in two ways.
• The second is in the interpretation of the CSF white cell count (WCC). Usually an increase in the number of white cells is an indication of infection, but following a traumatic tap, white cells are more likely to be from the contaminating blood. When a CSF leukocytosis is suspected in spite of a traumatic tap, the predicted white cell count can be compared with that observed, as follows:
A ratio of observed (O) to predicted (P) WCC > 1 implies CSF leukocytosis. There is a significant overlap of causes for O:P values between 0.75 and 1.0. However, an O:P ratio of < 0.1 is highly predictive in terms of excluding infection.
Glucose
The brain has no significant glycogen store and is therefore wholly dependent upon the blood supply of glucose to satisfy its requirements. Although the brain is only about 5% of the total body mass, it uses 20% of the glucose available from the blood. Cerebrospinal fluid glucose concentrations can only meaningfully be interpreted in relation to the plasma concentration, measured on a sample ideally taken within 15 min of LP. Cerebrospinal fluid glucose is derived solely from plasma glucose and is normally 60–80% of the concentration in the latter, although, for the first six months of life, the CSF glucose concentration may equal that of plasma. The CSF:plasma glucose ratio falls below 0.6 in a number of conditions, and this finding can be used as a diagnostic aid. The most notable reductions are observed in bacterial, tuberculous and some fungal meningitides, and in hypoxia, whereas ratios are usually normal in viral meningitis. The exact cause of the lowered CSF:plasma glucose ratio is still unresolved and will be discussed below. Whatever the cause, a lowered ratio usually indicates a diffuse generalized meningeal disease. A false negative result may be obtained if the patient has been given prior treatment with antibiotics.
Glucose is transferred into the CSF by a specific membrane carrier transport system. In the adult, the usual ratio is maintained up to plasma glucose concentrations of 20 mmol/L. For plasma glucose concentrations higher than this, the CSF glucose concentration does not rise further, probably due to saturation of the transport system. In severe hyperglycaemia, therefore, the CSF glucose may seem disproportionately low relative to that in the blood. It is important that this is not misinterpreted as evidence for infection. Furthermore, the CSF typically takes 2–4 h to equilibrate fully with a change in blood glucose. In a diabetic patient who has recently taken either insulin or an oral hypoglycaemic agent, it is therefore possible to have the paradoxical finding of a CSF glucose concentration that is higher than that in a paired blood sample.
Lactate
Cerebrospinal fluid lactate concentration is normally < 2.5 mmol/L; concentrations are controlled independently of those in arterial blood, indicating that it is a product of metabolism within the CNS. An increased CSF lactate concentration is observed in cerebral hypoxia (for example, following a cerebral infarction) and, most notably, in bacterial meningitis, when it is often associated with a decreased CSF glucose concentration. Elevated CSF concentrations of lactate have been demonstrated in patients with inherited disorders of the mitochondrial electron transport chain involving the pyruvate dehydrogenase complex, which give rise to the mitochondrial myopathies. In those with predominantly neurological symptoms, lactate concentrations may be increased only in the CSF.
Proteins
Two-dimensional protein electrophoresis of CSF reveals 200–300 spots, of which about half correspond to 34 unambiguously identified proteins. Nearly all proteins give rise to multiple spots owing to heterogeneity arising from various combinations of glycosylation, phosphorylation and splice variants. Proteins in CSF can be grouped as follows:
• those arising from plasma proteins that have crossed the blood–CSF barriers
• those synthesized in the brain and secreted into the CSF
• those usually present inside CNS cells that have leaked into the CSF following cell damage. Proteins within this group are generally present in only trace amounts.
Table 34.1 lists the ten proteins with the highest concentrations in CSF and plasma.
Some 80% of the total CSF protein concentration is derived from plasma proteins that have diffused passively across the various blood–CSF barriers. The remainder comprises proteins that are synthesized within the CNS (Fig. 34.1). Some plasma proteins, such as transferrin, undergo receptor-mediated transfer. The cells of the choroid plexus also synthesize transferrin and prealbumin, so the CSF concentration is a function of several factors. In health, two factors influence the CSF concentrations of the individual plasma-derived CSF proteins. One is the degree of permeability of the combined blood–CSF barriers to the protein, which is inversely proportional to the Stokes radius of the protein. The other is the plasma concentration of the protein: in general, the CSF concentration is directly proportional to that in plasma, and inversely proportional to molecular size.
FIGURE 34.1 Protein composition of CSF showing those proteins that are plasma derived and those whose synthesis occurs within the CNS.
All the frequently measured plasma proteins are present in CSF, demonstrating the lack of an upper limit for molecular size exclusion by the blood–CSF barriers. In health, all CSF albumin and immunoglobulin come from the plasma. Albumin accounts for 50–60% of total lumbar CSF protein and is present at a concentration of about 1/250 of that of the plasma. Permeability of the barrier alters with age; total CSF protein and albumin concentrations reflect this (Table 34.2). The albumin concentration (and thus that of total protein) also increases from ventricle to lumbar regions, reflecting both a change in the permeabilities of the blood–CSF barriers along the CNS axis and the longer time for equilibration of lumbar CSF with plasma.
Cerebrospinal fluid total protein concentrations may increase in two circumstances:
• when there is reduced flow of spinal CSF, such as occurs with a partial or complete blockage of CSF flow down the spine (e.g. owing to a prolapsed intervertebral disc, an abscess or a spinal tumour). In this circumstance there is increased equilibration of CSF with plasma, often accompanied by an inflammatory increase in permeability. In Froin syndrome, there is complete spinal block of CSF flow, usually due to a spinal tumour; cerebrospinal fluid distal to the block stagnates, and this eventually allows complete equilibration of the CSF with plasma leading to protein concentrations that are similar in both fluids.
A comprehensive review of the role of CSF protein analysis in the investigation of CNS disorders is included in the Further reading list.
Assessment of blood–brain barrier permeability and reduced fluid flow
Measurements of total protein, albumin and α2-macroglobulin concentrations, and electrophoresis have all been advocated as investigations appropriate to the assessment of barrier permeability. Total protein has been the most widely used and must be interpreted against age-related reference intervals. Some authors have advocated a correction when blood is present due to a traumatic tap, recommending the subtraction of 10 mg/L for every 1000 × 106 erythrocytes/L. The cell count and protein determination must be performed on the same sample of CSF and there should not be any degree of cell lysis, which would otherwise render the correction void. The correction assumes a normal plasma total protein and haematocrit and, while it should be used with caution, provides an approximate measure of the degree to which the CSF protein concentration may be increased following addition of blood from whatever source.
Albumin is a better indicator of barrier dysfunction, for three reasons:
• it is a homogeneous protein, unlike total protein, which is a composite of variable proportions of multiple proteins
• its concentration has a lesser degree of age dependency than that of total protein.
Despite CSF protein concentrations reflecting plasma concentrations, there is generally no discriminatory advantage to be obtained by relating CSF values to those of plasma. The choice between total protein and albumin will depend both on which assay is available at an appropriate analytical standard and cost. Quality assurance programmes indicate similar overall analytical imprecision for total protein and albumin. Experience of using albumin as an alternative to total protein is, as yet, limited.
Intrathecal immunoglobulin synthesis
Intrathecal synthesis of immunoglobulins occurs where B lymphocytes are induced to migrate from the blood into the brain. Once these cells are sequestered in the brain, local cytokine production results in clonal expansion and differentiation into plasma cells, which then start secreting immunoglobulins intrathecally. Intrathecal synthesis of immunoglobulins occurs in a wide variety of neurological diseases, but is most commonly associated with multiple sclerosis and other autoimmune conditions, and infections of the CNS. The immunoglobulin most widely studied is IgG, and this is associated mainly with subacute and chronic conditions.
Cerebrospinal fluid protein index
The general approach to detecting intrathecal synthesis relies upon the fact that it is possible to calculate the expected CSF concentration for any protein if the plasma concentration of that protein and the integrity of the blood–CSF barriers are known. The integrity of the blood–CSF barrier is given by the CSF/plasma quotient for albumin. If the blood–CSF barriers are intact, the albumin quotient is typically < 7 × 10− 3
[/not-level-membership-for-endocrinology-diabetes-and-metabolism-category]
