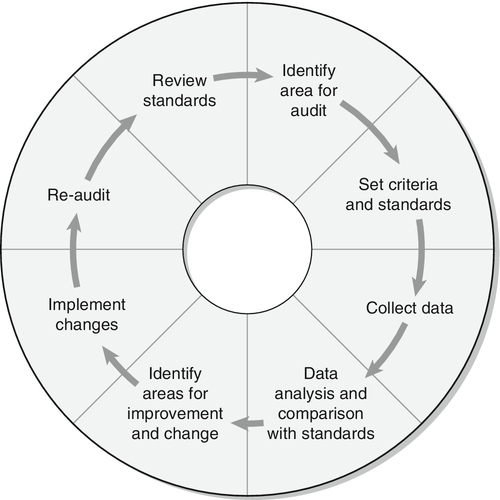
CHAPTER 13
Assessment of hepatic function and investigation of jaundice
Roy A. Sherwood; Adrian Bomford
CHAPTER OUTLINE
Bile, bile ducts and biliary drainage
Biotransformation and excretion
Bilirubin and bile pigment metabolism
Quantitative evaluation of liver function
Differential diagnosis of jaundice
The inherited hyperbilirubinaemias
Monitoring response to therapy
ABNORMAL LIVER FUNCTION TESTS IN ASYMPTOMATIC PATIENTS
NORMAL LIVER FUNCTION TESTS IN THE PRESENCE OF OVERT LIVER DISEASE
INTRODUCTION
It is widely accepted that the term ‘liver function tests’, as currently used in clinical practice, is a misnomer. Certainly this is true as compared with pulmonary or renal function tests. These describe the measurement of distinct physiological and biochemical organ functions that have meaning in the absence of any organ pathology. In marked contrast, most of the parameters that comprise the standard liver ‘function’ tests, such as the plasma activities of certain aminotransferases, which have major and well-defined roles within the cell, have no functional significance at all in plasma, where they are simply markers of hepatocyte disruption. Their measurement is only of any significance when applied to liver pathology. To this extent, understanding of the conventional liver function tests relies on a broad grasp of the principles of liver disease, and the present chapter should, therefore, be read in conjunction with Chapter 14.
This is not to say that the function of the liver is not well understood. But, while it is conventional to list the functions that the liver can perform, this detracts from gaining a broad conceptual picture of what the liver ‘does’. Essentially, the liver is a regulatory barrier between the systemic circulation and the organism’s environment experienced via the gut. The job of the acinus, the functional unit of the liver, is to regulate the concentrations of solutes entering the systemic circulation via the terminal hepatic venules or being excreted in the bile. It is the principal organ of metabolic homoeostasis, that is, maintenance of blood composition within physiologically acceptable limits by the conversion, synthesis and release of components required by other organs and by removal of toxic substances that may be injurious to tissues.
This chapter reviews briefly the anatomy, physiology and biochemistry of the normal liver as a basis for understanding the tests currently applied in clinical practice and those that may be developed in the future.
ANATOMY OF THE LIVER
The macroscopic and microscopic anatomy of the liver is difficult to understand, partly because of its inherently complicated three-dimensional structure and partly because of the recent trend to replace simple (but misleading) morphological descriptions with more accurate, but less obvious, functional descriptions.
The hepatic circulation
The liver has a dual blood supply. Arterial blood, direct from the aorta, is supplied via the hepatic artery from the coeliac axis. The second source is the portal vein, which is formed by the joining of the superior mesenteric and splenic veins and which collects blood from the gut. After passage through the sinusoids (see below), blood drains from the liver via the hepatic veins at the posterior aspect of the liver into the inferior vena cava and thence to the right side of the heart. The portal venous system delivers about 80% of the blood and 20% of the oxygen supplied to the liver. A major cause of abnormal function in chronic liver disease is disturbance of blood flow through the liver, consequent on the fibrosis that follows chronic liver cell damage, but if the portal vein is blocked, relatively normal liver function can be maintained for many years. Arterial occlusion occurring suddenly, for example as a result of trauma, leads to acute liver failure, but more gradual occlusion by a tumour mass is compatible with normal liver function for quite long periods.
Macroscopic structure
The liver is a wedge-shaped organ located in the right upper quadrant of the abdomen. Its mass varies with that of the individual, being in the order of 22 g/kg body weight. In a typical 70 kg subject, the liver weighs about 1.5 kg. It has a large right lobe, a smaller left lobe anteriorly and two further small lobes, the quadrate and the caudate lobes. These lobes relate to the venous drainage, not to the portal distribution (see below). Thus, the left hepatic vein drains the left hepatic lobe and the right and middle hepatic veins drain the right hepatic lobe. In terms of the portal structures, there are two functional lobes defined by the right and left portal veins. The division is marked by a line joining the inferior vena cava and the gallbladder bed (Fig. 13.1).
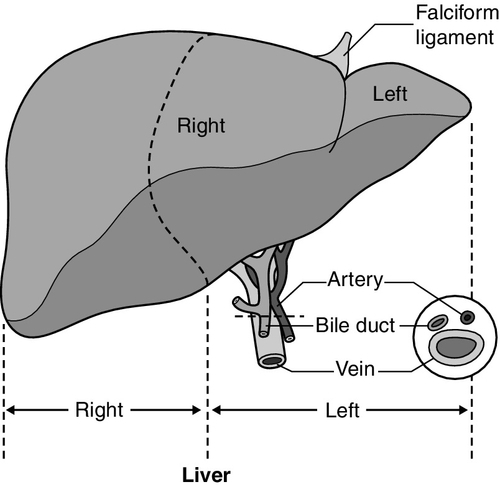
FIGURE 13.1 The anterior surface of the liver. The labelling in the upper part of the figure represents the conventional description into a right and left lobe separated by the falciform ligament. The lower part of the labelling refers to the right and left lobes defined by distribution of the portal structures. The right and left portal structures (portal vein, hepatic artery and bile ducts) enter the functional right and left lobes, respectively.
Microscopic structure
Hepatocytes, the hepatic parenchymal cells, comprise about 80% of the total cell mass of the liver. As viewed under the microscope, the functional unit of the liver appears to be the acinus, often termed the lobule, and it is in terms of this structure that pathological changes are described. Since liver biopsy has, under many circumstances, become the de facto ‘gold standard’ of liver disease diagnosis, it is important to understand this terminology. It is also important to understand that this unit does not comprise a homogeneous collection of hepatocytes and that there is marked functional heterogeneity across the acinus, with different zones having different physiological and biochemical functions (see below).
The acinus
The acinar/lobular concept of the structure of the liver is based on a central efferent terminal hepatic venule surrounded by radially oriented plates of hepatocytes and sinusoidal channels. Three to five portal tracts (or ‘triads’), containing branches of the portal vein, hepatic artery and bile duct, are situated around the periphery of each acinus (Fig. 13.2A).
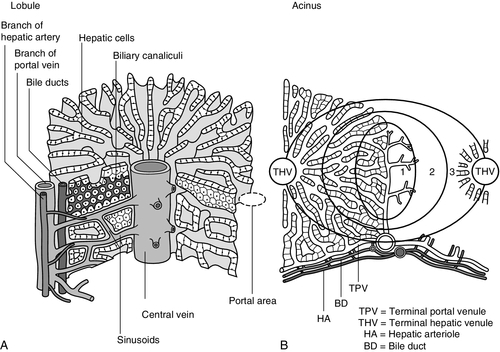
FIGURE 13.2 (A) The conventional hepatic acinus (lobule) based on the central vein with surrounding portal tracts. (B) The hepatic acinus and its three functional zones. The axis is formed by the terminal portal venule, hepatic arteriole and bile duct. Blood flows from the periphery of the acinus to the terminal hepatic venule.
The acini represent microcirculatory units comprising groups of liver cells, each fed by a single terminal portal venule and hepatic arteriole, the blood from which passes via the sinusoids into a terminal hepatic vein (Fig. 13.2B). Flow is unidirectional, from portal tract to hepatic vein. The 20 or so hepatocytes that separate the portal tracts from the terminal hepatic vein in an acinus have been arbitrarily separated into three zones, through which the portal blood passes sequentially. Zone 1 is conventionally used to describe hepatocytes nearest the afferent arteriole in the portal tract (the periportal area), and those surrounding the terminal hepatic vein, in the ‘centrilobular’ or ‘perivenular’ area, are described as zone 3. Between these two zones is an ill-defined area (zone 2), which is intermediate in terms of the composition of the perfusing blood. It must be emphasized that there are no anatomical boundaries between these three zones but, clearly, as blood perfuses each zone sequentially, its composition is altered and this leads to the functional heterogeneity of hepatocytes across the acini in response to the changes in their microenvironment. Zone 1 hepatocytes receive blood rich in oxygen and have a high level of metabolic activity. It is not surprising, therefore, that oxidative functions of the liver tend to be performed mainly by hepatocytes in zone 1, with metabolic processes that can operate at lower oxygen tensions occurring mainly in zone 3.
A detailed discussion of the functional heterogeneity of the three zones is not undertaken here, but we mention some examples that could be important if damage to the liver is not uniform. Thus, oxidative metabolism (the respiratory chain, citric acid cycle and fatty acid oxidation), gluconeogenesis, urea synthesis and the production and excretion of bile all occur mainly in zone 1, while glycolysis, glutamine synthesis from ammonia, and xenobiotic metabolism occur predominantly in zone 3. It is not difficult to appreciate that different pathological insults may differentially damage the various zones. Perhaps blood tests may eventually be developed to investigate the integrity of the different zones and thereby reduce the need for histological examination in the diagnosis of different liver disorders.
Ultrastructure
Hepatocytes are arranged in single-cell sheets or ‘plates’, supported by a fine mesh of a collagenous material (reticulin) and separated from overlying fenestrated endothelial lining cells by the space of Disse (Fig. 13.3). The hepatocytes are exposed to blood flowing through the sinusoids on each side of the plates. Their sinusoidal surfaces have a microvillar structure that greatly increases the surface area of the cell membrane, thereby facilitating efficient exchange of solutes between the blood and the cells. Bile produced by the hepatocytes is excreted via specific transporters located in the membrane of the biliary canaliculi (see below). The latter are formed by invaginations of the smooth basolateral membranes between adjacent hepatocytes, and also have a microvillar structure. Direct communication between the blood and bile is prevented by tight junctions in the basolateral membranes on either side of the biliary canaliculi. In addition to the endothelial cells that filter fluid exchanged between the sinusoidal lumen and the space of Disse, the sinusoids also contain Kupffer cells (a major part of the reticuloendothelial system), hepatic stellate cells (vitamin A-storing, fat-storing cells, also known as Ito cells, that produce several connective tissue components) and liver-resident natural killer cells with antitumour activity. These non-parenchymal cells are an area of intensive research; current evidence suggests that they play a major role in synthesis of growth factors responsible for control of liver regeneration and development of fibrosis in liver disorders (see below).
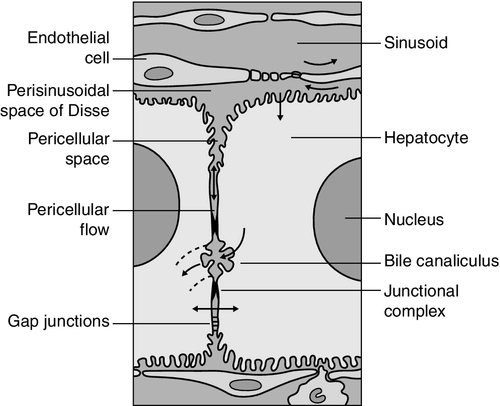
FIGURE 13.3 Ultrastructure of the liver. Solutes can pass out of the sinusoid, which does not have a conventional basement membrane, and across the space of Disse. Here they may be taken up across the hepatocyte membrane and subsequently across the canalicular membrane, or enter the canaliculus through the ‘paracellular pathway’ via the intercellular junctions.
Bile, bile ducts and biliary drainage
The biliary canaliculi formed between adjacent hepatocytes are continuous with canaliculi between other hepatocytes within the plane of the liver cell plates, and eventually drain into ductules lined by specific biliary epithelial cells and ultimately into the major bile ducts, thence to the common bile duct and the gut. Interruption of the flow of bile, the exocrine secretion of the liver, is responsible for many of the signs of hepatobiliary disease. Bile pigment and bile acid metabolism are described below, and the pathological anatomy of the liver and biliary tract is described in Chapter 14.
HEPATIC REGENERATION
The fact that the liver has a great capacity for regeneration is the rationale for much of the practice of clinical hepatology, particularly for undertaking prolonged periods of liver- intensive care during acute liver failure and for the feasibility of extensive resection, particularly for the management of primary and, less commonly, secondary malignant liver tumours.
Hepatic regeneration has been studied mainly in animals, most extensively the rodent model, after partial hepatic resection. Twenty-four hours after liver resection, there is extensive division of the remaining cells accompanied by a surge in DNA synthesis; this is followed 24 h later by increased replication of the non-parenchymal cells. The initiation of these events is by growth factors that are now being identified. Epidermal growth factor (EGF), transforming growth factor α (TGFα) and hepatocyte growth factor (HGF) are all involved in switching on regeneration, and transforming growth factor β (TGFβ) is involved in switching it off. Normally quiescent differentiated hepatocytes replicate rapidly after resection, while intrahepatic precursor cells, termed oval cells, proliferate and generate lineage only in situations where hepatocyte proliferation is blocked or delayed. Bone marrow cells can generate oval cells, but such transdifferentiation is now known to be inefficient and occurs only rarely.
PHYSIOLOGICAL FUNCTIONS
Because the various functions of the liver may fail at different times, creating differing clinical pictures, it is necessary to consider each function separately. The physiology and biochemistry of the liver subsume most of intermediary metabolism and, as such, are clearly beyond the scope of this chapter. Other than giving a brief outline, emphasis is placed on those functions whose measurement or disturbance is important in liver tests or pathology, respectively.
Carbohydrate metabolism
As has been known for many years, removal of the liver in an animal leads to death from hypoglycaemia. A major metabolic function of the liver is to store sugar and reduce the variations in blood glucose consequent upon the human habit of eating intermittently. Thus, during a meal, the liver stores glucose as glycogen and then releases it (glycogenolysis) slowly when food is not being eaten. This is particularly important for those organs such as the brain and red blood cells that have an obligatory requirement for glucose. Specific glucose transporter molecules located in the sinusoidal membrane that mediate facilitated diffusion are involved in both processes. Between meals, as the supply of glycogen decreases (only about 75 g can be stored), the liver starts to make glucose (gluconeogenesis) from other sources, particularly lactate, but also pyruvate, glycerol and alanine, although only from alanine is there a significant net production of glucose. During more prolonged periods of starvation, the total body requirement for glucose falls and energy demand is increasingly met by production of ketone bodies, derived mainly from fatty acids via acetyl-CoA. Apart from being stored, glucose is used by the liver as an energy substrate via glycolysis and the citric acid cycle, or for the synthesis of fatty acids and triglycerides.
Insulin is secreted in response to the rise in blood glucose concentration after a meal and promotes an increase in peripheral glucose uptake and a decrease in gluconeogenesis. In acute liver failure, the liver may not be able to maintain an adequate concentration of blood glucose and hypoglycaemia may become a life-threatening complication; in chronic liver disease, hyperglycaemia is more common, most likely because of a failure of the liver to store glycogen and failure of peripheral tissues to take up glucose adequately. The liver also metabolizes other dietary sugars including fructose and galactose, converting them to glucose phosphates (see Chapter 14).
Lipid metabolism
After a meal, dietary triglycerides are hydrolysed to free fatty acids and monoglycerides by pancreatic lipases and dissolved in an aqueous medium, facilitated by the detergent action of bile salts excreted by the liver into the gut. The liver meets its own metabolic energy requirements, and those of the body as a whole, by mitochondrial β-oxidation of short chain fatty acids. The resultant acetyl-CoA either enters the citric acid cycle or reacts with another molecule of acetyl-CoA to form ketone bodies. Although the role of the liver is central to the oxidation of fatty acids, most tissues contain the enzymes required to undertake complete oxidation. The liver also synthesizes fatty acids, triglycerides, cholesterol, phospholipids and lipoproteins. Disturbances of fatty acid metabolism, including decreased oxidation (as in excessive alcohol consumption), increased hepatic fatty acid synthesis and decreased breakdown of triglycerides to fatty acids and glycerol, may all be involved in the development of fatty liver (‘steatosis’), an increasingly prevalent problem found in obesity and as an additional or incidental histological finding in many liver disorders.
Protein metabolism
Hepatic protein metabolism is central to the assessment of liver function, and its disturbance underlies many of the clinical complications that occur in severe liver cell dysfunction.
Synthesis
Other than the immunoglobulins, most circulating proteins are synthesized wholly or largely by the liver, and the concentrations of several are used as a measure of hepatic synthetic function. Apart from albumin, transcobalamin II and C-reactive protein, all are glycoproteins. Glycosylation (often with terminal sialic acid residues on the carbohydrate moieties) has several functions. In some instances (e.g. fibronectin), it serves to make the protein resistant to proteolysis; in others it affects function. In yet others (e.g. caeruloplasmin), it affects the half-life of the protein in the blood, because hepatocytes possess receptors that can bind galactose and some other carbohydrate residues exposed after removal of sialic acid and remove the desialylated glycoproteins from the circulation. Disturbance in glycosylation produces some specific defects in protein structure that may be useful clinically in the diagnosis of alcoholic (see p. 242) and malignant liver disease (see Chapter 14).
Metabolism of amino acids and disposal of urea
A 70 kg man on a normal diet needs to excrete between 10 and 20 g of nitrogen per 24 h. This derives, in the form of ammonia, from amino acids that are surplus to requirements (and cannot be stored) and those that are not reutilized after normal turnover. The ammonia is converted into urea in the liver and excreted by the kidneys. The liver processes dietary amino acids arriving via the portal vein and from breakdown of muscle proteins, both for its own requirements and for export to peripheral tissues. Aromatic amino acids (AAA: phenylalanine, tyrosine and tryptophan) are metabolized by the liver, but hepatic extraction of branched chain amino acids (BCAA: leucine, isoleucine and valine) is small and these are taken up largely by muscle. The ratio of BCAA/AAA is decreased in acute liver failure and this alteration forms the basis of one theory of the pathogenesis of hepatic encephalopathy, namely that it is due to the toxic effects of increased concentrations of ammonia on the brain.
The major pathways of ammonia production and clearance are shown in Figure 13.4. Amino acids first undergo transamination to glutamate, followed by oxidative deamination with the formation of ammonia. The resultant ammonia is fed into the Krebs–Henseleit (urea) cycle and excreted as urea or stored transiently as glutamine (through the action of glutamine synthase). Additional ammonia is produced by the action of intestinal bacteria on dietary protein and urea present in gut contents. Plasma ammonia concentration is measured in many laboratories and a raised concentration is taken as evidence that an encephalopathic state is due to hepatic pathology. Measurement of the various enzymes involved in the urea cycle is increasingly undertaken for diagnosis of inherited abnormalities of urea synthesis.
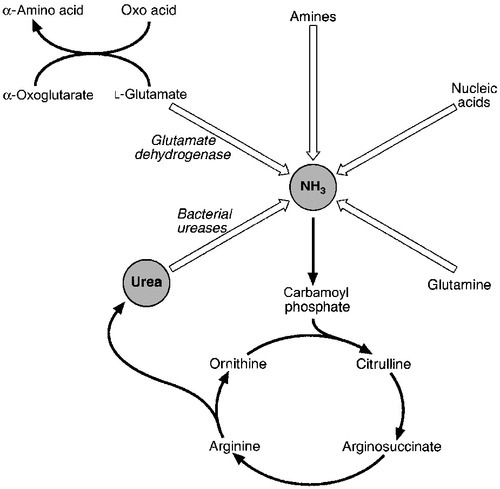
FIGURE 13.4 Production and disposal of ammonia.
Biotransformation and excretion
The lungs and kidneys are effective in excreting volatile and water-soluble substances, respectively, but many compounds, both exogenous (such as drugs) and endogenous, including end products of metabolism, are lipid soluble and non-volatile. Many of these compounds are toxic, and a vital function of the liver is to render such substances more water soluble so that they can be excreted in urine or bile.
Two phases of biotransformation of metabolites by the liver are recognized. In phase I, a suitable polar group is made available, which is conjugated in phase II. Phase I reactions occur in the smooth endoplasmic reticulum and are mediated mainly by the mixed function oxidase system (cytochrome P450 isoenzymes) that utilize atmospheric oxygen, typically generating hydroxylated or carboxylated compounds. Phase II reactions involve their subsequent conjugation by the action of glucuronyl transferases with glucuronic acid, acetyl or methyl radicals or, in the case of bile acids, with glycine, taurine or sulphate (see below). There is considerable functional heterogeneity of the glucuronyl transferases, of which there are several isoenzymes that have varied substrate specificities, particularly for exogenous compounds. An alternative, non-oxidative pathway for biotransformation of both endogenous and exogenous substances is by conjugation with reduced glutathione by glutathione S-transferases.
Bile secretion
The constituents of bile, the exocrine secretion of the liver, are conjugated bile salts, cholesterol, phospholipids (mainly lecithin), bilirubin mono- and diglucuronides, electrolytes and small amounts of protein. The liver is the major site of cholesterol biosynthesis and the sole site of conversion of cholesterol into bile acids, which are the major organic anions excreted by the liver. The primary bile acids, cholic and chenodeoxycholic acid, are conjugated with either glycine or taurine to form bile salts, which enhances their solubility at the pH of body fluids (Fig. 13.5). This facilitates their main function of solubilizing both biliary cholesterol and the products of dietary fat digestion resulting from lipid hydrolysis. Secondary bile acids, deoxycholic and lithocholic acids, are derived from primary bile acids by the action of intestinal bacterial 7α-dehydroxylase, either as bile salts or deconjugated bile acids. Most of the bile acids reaching the gut are reabsorbed in the terminal ileum and return via the portal vein to the liver (enterohepatic circulation) where, as free acids, they are again conjugated and excreted. A third metabolite, ursodeoxycholate (a stereoisomer of chenodeoxycholic acid), is found in trace amounts and has been classified as a tertiary bile acid. This enterohepatic circulation is regulated by the activities of distinct bile salt transport proteins, including the canalicular bile salt export pump, the ileal sodium-dependent bile salt transporter and the hepatic sinusoidal sodium–taurocholate co-transporting polypeptide. Several other bile salt transporters and organic anion-transporting polypeptides have been characterized (see below). During bile secretory failure (cholestasis), bile salt transport proteins undergo adaptive responses that serve to protect the liver from retention of toxic bile salts and facilitate non-hepatic routes of bile salt excretion. The measurement of serum bile acids has been extensively investigated as a test of liver function (see p. 243).
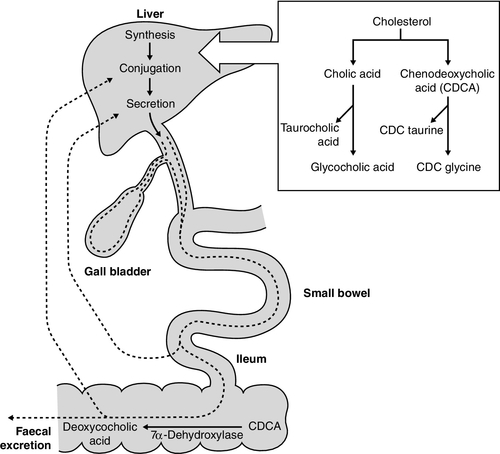
FIGURE 13.5 Synthesis and enterohepatic circulation of bile acids.
LIVER FUNCTION TESTS
Liver function tests have four potential applications.
2. As an aid to making a specific diagnosis. While functional tests are clearly distinct from diagnostic tests, it is still reasonable to assume that certain patterns of dysfunction may be characteristic of particular diseases.
3. To establish the severity of liver dysfunction or damage once a specific diagnosis has been established. This is important from a prognostic point of view, although the standard biochemical ‘liver function tests’ do not always reflect accurately the severity of tissue damage.
4. To monitor the progression of the disease and any response to therapeutic intervention.
Within this framework, two classes of tests will be considered. The first are the standard liver function tests – a group of tests often applied irrespectively of the suspected diagnosis and to which all the caveats about lack of true functional assessment apply. The second group includes those biochemical assays used for assessment of liver disease in specific situations, for example α1-antitrypsin in suspected deficiency of this protein and α-fetoprotein in suspected primary hepatic cancer (hepatocellular cancer). The latter are described briefly here, for the sake of completeness, and in more detail in the next chapter in the context of their diagnostic application. The standard liver function tests are usually considered to include the plasma total bilirubin concentration, the activities in plasma of certain enzymes (particularly alanine and/or aspartate aminotransferases, alkaline phosphatase and γ-glutamyltransferase), and the total plasma protein, albumin and globulin concentrations. The prothrombin time (discussed later) also provides useful information about the synthetic capacity of the liver in the short term, as it is a functional measure of factor VII (among others) concentration and this clotting factor has a short half-life in plasma (see below). It has been estimated that this group of tests will correctly allocate patients to a liver disease/non-liver disease category in about 75% of cases.
Bilirubin and bile pigment metabolism
Although bilirubin has been characterized as a non-toxic metabolic product of a relatively minor metabolic pathway, marked elevation in its plasma concentration leads to the alarming sign of jaundice and usually suggests the presence of underlying liver or biliary tract disease that may range from trivial to life-threatening, especially in neonates (see below). Accurate interpretation of the laboratory tests associated with bile pigment metabolism in the jaundiced individual requires a clear understanding of the physiology and biochemistry of the bile pigments. Most bilirubin is derived from the breakdown of haem, itself derived from senescent red blood cells (Fig. 13.6). A much smaller proportion comes from other haemoproteins such as catalase, myoglobin and the cytochromes. An even smaller fraction comes from ‘ineffective erythropoiesis’, although this may represent a significant source of bilirubin in haematological conditions such as thalassaemia and pernicious anaemia. The initial and rate-limiting step is the oxidation of haem to biliverdin by haem oxygenase; this is followed by reduction (catalysed by biliverdin reductase) to bilirubin, with the production of an equimolar amount of carbon monoxide and ferric (Fe3 +) iron. These reactions take place in the macrophages of the reticuloendothelial system, predominantly in the liver, spleen and bone marrow. The resultant ‘unconjugated’ bilirubin is tightly bound to albumin in a 1:1 molar ratio, but additional binding sites of lower affinity are recruited in hyperbilirubinaemic states. This binding limits extrahepatic uptake of the potentially toxic unconjugated bilirubin and facilitates transport to the liver. Other molecules, such as thyroxine and certain drugs, can compete for albumin binding sites and thereby displace bilirubin, although the clinical relevance of this displacement is limited, except possibly in neonates.
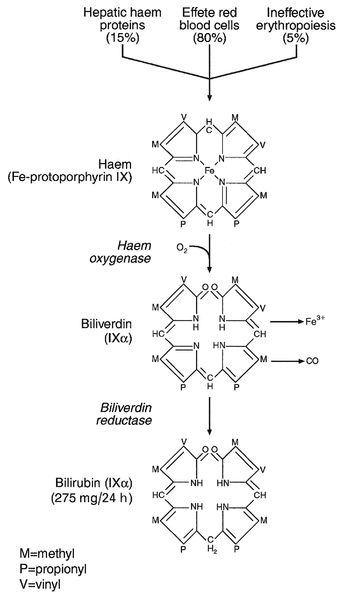
FIGURE 13.6 Formation of bilirubin.
Bilirubin, tightly bound to albumin, is actively transported across the hepatocyte sinusoidal membrane and binds to ligandin (glutathione transferase B). It is then conjugated with glucuronic acid by the action of uridine diphosphate (UDP)-glucuronosyltransferase (glucuronyl transferase) to form mono- and diglucuronides and thereby rendered water soluble (Fig. 13.7). Glucuronidated bilirubin is secreted via an active transport mechanism into the biliary canaliculi and thence reaches the gut. The components of this transport pathway have been identified as products of genes encoding multidrug resistance (MDR) proteins (MRPs) and MDR-associated proteins. The protein MDR3 is known to transport phosphatidylcholine to chaperone bile salts, while MRP2 pumps glucuronidated compounds, that is, conjugated bilirubin as well as organic anions. Secretion is probably rate limiting in the overall transport of bilirubin from plasma to bile. In the gut, some bilirubin is deconjugated by bacterial glucuronidases and (being fat soluble again) is reabsorbed, but most is oxidized to urobilinogen; this is further metabolized to other pigments, particularly stercobilin, and excreted (Fig. 13.8). A small amount of urobilinogen is reabsorbed and undergoes an enterohepatic circulation. Conjugated bilirubin also circulates bound to albumin, but with low affinity, such that the unbound fraction can be filtered by the glomeruli and excreted by the kidneys, giving rise to pigmented urine. A small fraction is reabsorbed by the renal tubules.
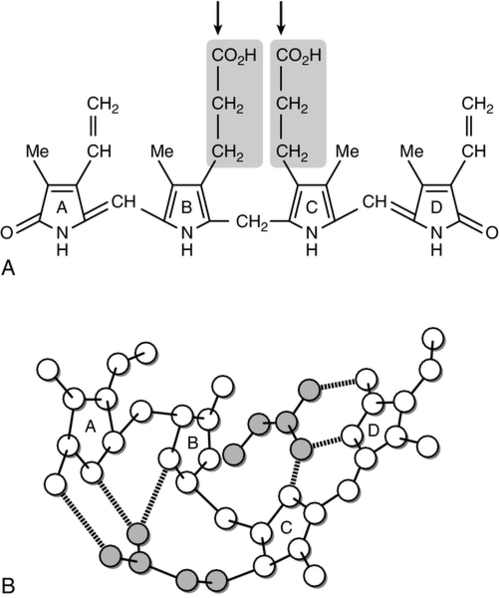
FIGURE 13.7 (A) The unfolded structure of bilirubin showing the site of glucuronic acid conjugation (arrows), which breaks the hydrogen bonding and results in the molecule becoming soluble. (B) The folded structure showing the extensive hydrogen bonding.
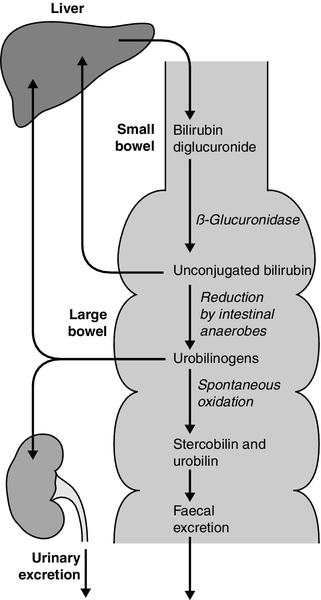
FIGURE 13.8 Enterohepatic circulation of bilirubin and urobilinogen.
The significance of hyperbilirubinaemia
Less than 500 mg of bilirubin is produced each day, but the normal liver can conjugate up to 1500 mg/day. This large functional reserve is one reason why the plasma bilirubin concentration is an insensitive test for liver disease, since it begins to rise only after significant liver damage has occurred. In more than 95% of the apparently healthy adult population, the plasma bilirubin concentration is < 25 μmol/L and this can be considered the upper limit of the reference range (Fig. 13.9). It is virtually all unconjugated. Jaundice can be detected by experienced observers when the plasma concentration exceeds 50 μmol/L and, when it rises above 100 μmol/L, it will be apparent to lay observers.
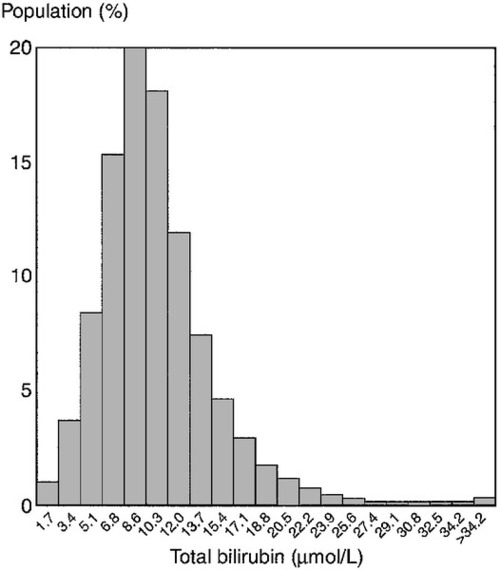
FIGURE 13.9 Distribution of serum bilirubin concentrations in 18 454 apparently healthy men. (From Bailey A, Robinson D, Dawson M 1977 Does Gilbert’s disease exist? Lancet i:931–933, with permission).
The absolute concentration of plasma bilirubin is of little help in establishing a diagnosis. Its measurement is, however, important in monitoring the progress of diseases such as primary biliary cirrhosis, where changes are of prognostic significance (see p. 248), neonatal jaundice (with respect to the need for exchange transfusion), for assessing response to treatment (such as surgical relief of bile duct obstruction) and to detect hyperbilirubinaemia that is suspected, but not clinically apparent. In addition, the absolute concentration of bilirubin is important in prescribing the correct dose of certain cytotoxic agents, especially if they are normally excreted in bile. For example, in patients treated with doxorubicin for malignant liver disease, the dose must be decreased in the presence of hyperbilirubinaemia to avoid drug-induced myelosuppression. The highest concentrations of bilirubin (sometimes approaching 1000 μmol/L) are seen when conjugated hyperbilirubinaemia of any cause is complicated by renal failure.
Tests for quantitation of bilirubin and its conjugated and unconjugated fractions
Current methods for the determination of plasma bilirubin are based on the diazo coupling of the pigments first described by Ehrlich in 1883. Two molecules of azodipyrrole, which can be measured spectrophotometrically, are formed per molecule of bilirubin. In 1916, van den Berg and Muller noted that bilirubin from patients with obstructive jaundice reacted ‘directly’, whereas bilirubin from patients with haemolytic jaundice reacted ‘indirectly’, that is, an accelerator such as alcohol was required. The direct reacting pigment was later identified as conjugated bilirubin (CB) and the indirect reacting pigment as unconjugated bilirubin (UCB).
Although the distinction was found to be useful clinically, it soon became apparent that there is not, in fact, a precise relationship between indirectly reacting bilirubin and UCB, and directly reacting bilirubin and CB, respectively. In particular, direct measurements overestimate CB at low concentrations and underestimate it at high concentrations. To overcome these limitations, the alkaline methanolysis method was developed. The bilirubin mono- and diglucuronide conjugates are converted to the corresponding mono- and dimethyl esters by treatment with alkaline methanol. Unconjugated bilirubin is not affected by the reaction and is extracted into chloroform with the methyl ester derivatives. The pigments can then be separated and quantified by high performance liquid chromatography (HPLC). This approach shows that CB is virtually undetectable in plasma from healthy subjects or from patients with Gilbert syndrome. Techniques permitting accurate estimation of the two fractions at low bilirubin concentrations may become available routinely, and the detection of CB might then become the most specific and sensitive test of hepatobiliary function. Bilirubin bound to albumin (bili-albumin, delta bilirubin), probably covalently, is a third form of bilirubin. It may account for up to 90% of total bilirubin in both hepatocellular and cholestatic jaundice, although both impaired excretion and an intact conjugation mechanism are required for its formation. It is not detectable in healthy subjects or patients with unconjugated hyperbilirubinaemias, including Gilbert syndrome. It is this form of bilirubin that persists in the plasma of patients recovering from jaundice after bilirubin has ceased to be detectable in the urine. The precise mechanism by which jaundice occurs in patients with severe, long-term liver dysfunction has still not been firmly established. Both conjugated and unconjugated bilirubin are present, but the former predominates. Clinically, most patients retain the ability to conjugate bilirubin but have pigmented, bilirubin-containing urine. It is likely that conjugated bilirubin refluxes retrogradely across the sinusoidal poles of hepatocytes because excretion via the biliary canalicular membrane becomes rate-limiting in the severely damaged liver. Leakage from damaged canaliculi via the paracellular pathway may also occur.
Plasma enzyme activities
As noted above, the enzymes used as liver tests, have little or no physiological function in the plasma: rather, they are empirical markers of some type of liver damage.
Alkaline phosphatase
The term alkaline phosphatase (ALP) describes a group of enzymes that hydrolyse phosphate esters at alkaline pH, although the physiological substrate within the body is not known. Alkaline phosphatase is present in several tissues, but the plasma component comprises mainly contributions from liver, bone, intestine and (during pregnancy) the placenta. There are two liver-derived isoenzymes. One derives from the hepatocyte and the other from the exterior surface of the biliary canalicular membrane. The latter probably enters the bloodstream via the paracellular pathway (see Fig. 13.3), although, in the presence of obstruction, it becomes distributed throughout the cytoplasm and may enter the plasma directly from across the plasma membrane. The function of hepatic ALP is unknown, but it may be involved in the transport of bile acids into bile.
The activity of plasma ALP rises when there is any form of obstruction to the biliary tract, whether mechanical or otherwise. The original assumption that this was due to failure of clearance by the obstructed liver was shown in the 1960s to be false. It was found that the clearance of ALP is not dependent on a patent biliary system and that during cholestasis only the liver ALP increases in activity, not the bone and intestinal isoenzymes. Subsequent studies have shown that this increase is from de novo synthesis of alkaline phosphatase, and it is possible in rat models to show that this is due to increased translation of the ALP mRNA rather than to increased transcription. The activity is definitely of biliary origin and the rise can be inhibited by blocking RNA synthesis. Biliary tract obstruction on its own is not sufficient to give rise to increased plasma activity of liver ALP; it appears that a high concentration of bile acids is also required, perhaps to solubilize the ALP bound to the canalicular membrane.
In cholestatic diseases due to biliary tract obstruction, the site of the obstruction may be at any level, from high in the small intrahepatic bile ducts (e.g. in primary biliary cirrhosis) down to the common bile duct (e.g. with gallstones). A rise in ALP activity usually predates the onset of clinical jaundice and, in those situations where surgical relief is possible, the return of plasma bilirubin to within the reference range usually precedes that of ALP. In a patient with symptoms of pain over the liver, an elevated ALP activity in the presence of a normal plasma bilirubin concentration is strongly suggestive of a hepatic space-occupying lesion, such as an intrahepatic tumour or an infiltrative disorder.
Overcoming the lack of tissue specificity
Increases in the activity of plasma ALP are not specific for liver disease. Modest increases occur in pregnancy, during periods of rapid bone growth in childhood and adolescence, and because of disease at other sites, particularly bone disease in which there is increased osteoblastic activity. While bone disease (hepatic osteodystrophy) may be a complication of longstanding cholestatic liver disease, the predominant form is osteoporosis, not osteomalacia, and the increased ALP activity is not due to the coexistent bone disease.
The specificity of the test can be enhanced by measuring specific ALP isoenzymes. Early studies used starch or polyacrylamide gel electrophoresis on the serum sample followed by specific staining of the gels for ALP; agarose gel electrophoresis is now more commonly used. In normal serum, two or three distinct bands can usually be identified, corresponding to the liver, bone and intestinal ALP isoenzymes. The liver band moves most rapidly towards the anode, with a more diffuse bone band closely behind. When present, the intestinal band lies behind the bone band. Additional bands are seen during pregnancy (the same isoenzyme is also detected occasionally in patients with malignancy, and is known as the Regan isoenzyme). In subjects with hepatocellular carcinoma, occasionally there is an additional, fast-running, band. The technique is semiquantitative, but it is usually visually obvious which of the isoenzymes is responsible for the increase in total activity.
An alternative approach is to repeat the standard ALP assay after first heating the serum at 56°C for 15 min. The liver and bone isoenzymes are sensitive to this treatment, and if the increased total activity is owing to either one of these, it will be reduced to about 40% or 15% of the original value, respectively. The placental isoenzyme activity remains unaffected by heating. This method is not as discriminatory as electrophoretic separation of the isoenzymes, but is easier to perform and can be used as a rough guide.
In practice, however, when there is doubt about the origin of an increased plasma ALP activity, it is customary to examine the results in relation to other enzymes, elevations in the activities of which are more liver specific. Thus, if the γ-glutamyltransferase (γGT, see below) is also elevated, it may be inferred that the increase in ALP activity is probably of hepatic origin. In a few situations, elevation of ALP activity, apparently with hepatic specificity, may be seen in patients without overt liver disease, particularly those with Hodgkin lymphoma and some infections.
One specific situation in which isoenzyme analysis is of particular benefit is in patients with benign transient hyperphosphatasaemia (see Fig 13.10). First identified in children, it is now recognized also in adults. Serum ALP activity is typically > 1000 U/L, with normal plasma activities of the aminotransferases and γGT. It is usually associated with recent or intercurrent infection, often of the gastrointestinal tract. The mechanism is thought to be removal of sialic acid residues from circulating ALP by bacterial endotoxin or other substances released by the infecting organism. This alters the recognition of ALP by clearance receptors, prolonging its half-life in the circulation. The isoenzyme pattern is characteristic, showing the presence of two bands for each of the liver and bone isoforms. Treatment of the sample with neuraminidase, which removes terminal sialic acids from the carbohydrate side-chains of ALP, results in a pattern identical to that seen in a normal sample treated with neuraminidase. The importance of recognizing benign transient hyperphosphatasaemia is that invasive investigations such as endoscopic retrograde cholangiopancreatography are unnecessary.
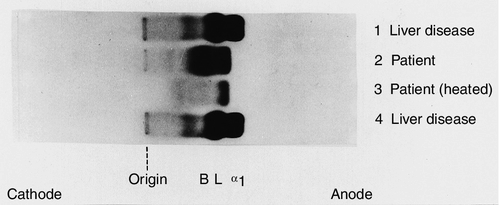
FIGURE 13.10 Alkaline phosphatase isoenzymes in benign transient hyperphosphatasaemia. Separation of plasma ALP isoenzymes on cellulose acetate membrane. The positions of bone (B), liver (L) and biliary (α1) isoenzymes are indicated. The electrophoretic pattern and heat stability of transient hyperphosphatasaemia are illustrated in lanes 2 and 3. (Courtesy of Dr S. B. Rosalki).
The aminotransferases
These enzymes, previously designated (and still frequently referred to) as ‘transaminases’, catalyse the transfer of an amino group from an α-amino acid to an α-oxo acid. This is their intracellular function. An increase in their activity in the plasma is simply a marker of hepatocyte disruption and, presumably, has no useful function. The two most widely measured for clinical purposes are aspartate aminotransferase (AST) and alanine aminotransferase (ALT) both of which have a wide tissue distribution. Aspartate aminotransferase is found in liver, heart, skeletal muscle, kidney, brain, erythrocytes and lung. Alanine aminotransferase has a similar tissue distribution, but activities are much lower in extrahepatic tissue so that an increase in plasma ALT is more specific for liver disease. In view of this wide tissue distribution, it is not surprising that increased activities are seen in extrahepatic disease such as rhabdomyolysis, where the enzymes are released from damaged muscle cells. However, distinction between increased aminotransferase activities due to liver disease and those due to skeletal or cardiac muscle damage can usually be made by measurement of creatine kinase or the cardiac-specific troponins, respectively.
The increased plasma activities of these enzymes seen in patients with liver disease are presumed to originate from necrotic or damaged hepatocytes, although actual necrosis is not a prerequisite. It should not be assumed that the enzyme content of hepatocytes in patients with liver disease is necessarily the same as in normal hepatocytes; in patients with metastatic liver disease, hepatocyte enzyme concentrations may be several times higher than normal.
The aminotransferases are sensitive tests of hepatocellular dysfunction. This is particularly well demonstrated by the observation that during epidemics of viral hepatitis, aminotransferase activities may be markedly elevated in asymptomatic individuals with subclinical hepatitis. Generally speaking, the specificity of the test increases with enzyme activity. Activities above ten times the upper limit of the reference range are most frequently due to primary hepatocyte damage, so that the hepatic pathology will be some form of acute (viral or drug-induced) or chronic (such as autoimmune) hepatitis. Occasionally, acute cardiac failure or hypovolaemic shock may cause AST activities within this range, presumably from a combination of increased hepatic venous pressure, low cardiac output and arterial hypoxia. Exceptionally, such elevated activities may also be found in obstructive jaundice, particularly when there is acute biliary tract obstruction or where cholangitis supervenes on biliary tract obstruction.
Values below ten times the upper limit of the reference range are non-specific and no aetiological inference can be drawn. Importantly, a plasma ALT or AST activity within the reference range does not necessarily exclude significant hepatocellular damage, as assessed histologically in some forms of chronic liver disease (e.g. autoimmune hepatitis). In several liver disorders, more discrimination can be gained by considering the aminotransferase activities in relation to the ALP or to each other. In general, the higher the AST/ALP ratio, the more likely the underlying condition is to be some form of hepatitis. Conversely, the lower this ratio, the more it is indicative of a cholestatic disorder. Plasma ALT activity tends to be only modestly raised in patients with alcoholic hepatitis compared with other forms of hepatitis, whereas the AST activity is often more markedly elevated. Thus, an AST/ALT ratio of > 2, in a patient who appears on clinical grounds to have a hepatitic illness, strongly suggests that alcohol is involved.
The mitochondrial isoenzyme of AST (mAST)
There are two forms of AST, one cytosolic and the other mitochondrial (mAST). The latter is synthesized under control of nuclear DNA as a precursor (pre-mAST), which is rapidly transferred across the mitochondrial membrane and then converted into mature mAST. The mitochondrial isoenzyme of AST accounts for about 80% of total AST activity within the liver cells. With the development of immunochemical methods for measurement of this enzyme in serum, there has been considerable interest in the use of the mAST/total AST ratio as a marker of chronic alcohol consumption. While preliminary studies suggested that this test adequately distinguishes between those who consume excess alcohol and healthy subjects, irrespective of the presence or absence of liver disease, and is only elevated in association with chronic abuse, this test has not been adopted into routine laboratory practice.
γ-Glutamyltransferase
This is a microsomal enzyme responsible for transfer of glutamyl groups from γ-glutamyl peptides to other peptides or amino acids. It may be involved in the transport of peptides across cell membranes as γ-glutamyl peptides. Although widely distributed throughout most body organs except muscle, the plasma activity is mainly attributable to the liver isoenzyme. γ-Glutamyltransferase has poor specificity for liver disease and, especially in a patient with jaundice, it adds little to the information gained from measurement of AST and ALP. However, its measurement can be useful in two particular circumstances. First, when the origin of an elevated serum ALP is uncertain, a concomitant elevation in γGT suggests that the ALP is of hepatic origin. The second relates to the controversial area of the relationship of γGT to chronic alcohol consumption.
The laboratory tests for chronic alcoholism are discussed in the next chapter. Here, we attempt to summarize what is accepted about γGT and excessive alcohol consumption. In those who consume excess alcohol and who have chronic liver disease, the absolute plasma activity of γGT is higher than in those without significant liver disease, and there is a tendency for activities to remain high after abstinence. This suggests that the elevated plasma γGT activities in such individuals may be due to induction of the enzyme by the alcohol and/or because of the liver damage. In contrast, among alcoholic patients without liver disease, only about half will have a raised γGT and this will usually fall to normal after eight weeks of abstinence. The extent of the increase in γGT activity above normal is not directly related to either the amount of alcohol consumed or the duration of its consumption. It is evident from the above that the efficiency of using γGT for screening populations for excessive alcohol consumption will be poor. False positive results occur in those taking enzyme-inducing drugs (including some herbal remedies) and false negative results occur in those who do not have liver disease. Nonetheless, the finding of a markedly raised γGT (greater than five times the upper limit of the reference range) provides good reason to enquire diligently about possible alcohol abuse. γ-Glutamyltransferase remains the best of the simple laboratory screening tests and, depending on the population studied, the sensitivity is in the order of 50% and the specificity is about 85%.
Glutathione S-transferase (GST)
Isoenzymes of GST are involved in the detoxification and conjugation of several electrophilic compounds with glutathione. As noted above, bilirubin and bile acids bind strongly to GST, which is also involved in the metabolism of endogenous compounds such as some of the prostaglandins. Various isoenzymes exist; virtually all the plasma GST-α activity is of hepatic origin and its measurement seems to be a sensitive test of acute hepatocellular damage. It has a half-life in blood of only about 90 min and is, therefore, a rapidly responding marker of liver injury. However, the currently available immunoassay does not lend itself to large-scale routine screening and is therefore not widely used in clinical practice.
Plasma proteins
The concentrations of proteins in plasma reflect the balance between availability of their precursors and their rates of synthesis, release and clearance, as well as their volumes of distribution. It is, therefore, not surprising that in patients with liver disease, the concentrations are very variable. Measurements of some plasma proteins (e.g. albumin, coagulation proteins) can provide useful information about general hepatic function; measurements of others (e.g. α1-antitrypsin, caeruloplasmin) are used in the diagnosis of specific conditions affecting the liver.
Albumin
This is the major protein in plasma and it is synthesized exclusively by the liver. The liver produces about 12 g of albumin each day; of the total body pool of 300 g, about 60% is in the extravascular pool and 40% in the intravascular pool. The plasma half-life is about 21 days. Albumin is responsible for maintaining plasma oncotic pressure and binds several hormones, anions, drugs and fatty acids. There is no doubt that as chronic liver disease progresses, the plasma albumin concentration tends to fall and, in this context, it is a major prognostic factor (see p. 248). Nonetheless, it must not be assumed that plasma albumin concentration is simply an indicator of hepatic synthetic function.
The rate of hepatic albumin synthesis falls in the face of inadequate protein intake. This is a frequent occurrence in patients with advanced liver disease, and particularly those in whom excessive alcohol consumption is implicated. However, even when the rate of synthesis falls, plasma concentrations may remain within the reference range because of a compensatory reduction in the rate of degradation. Furthermore, hypoalbuminaemia may occur in the face of normal, or even increased, rates of synthesis when protein ‘leaks’ into lymph, ascites or otherwise into the extravascular compartment. Hypoalbuminaemia may also be the result of renal loss of albumin in the nephrotic syndrome, gastrointestinal tract loss in protein losing enteropathy or loss through the skin in burns patients.
Prothrombin time and coagulation factors
The prothrombin time (PT) is a test that has become widely used in hepatology. Quick’s one-step prothrombin time measures the rate at which prothrombin is converted to thrombin in the presence of thromboplastin, calcium, fibrinogen and other coagulation factors (V, VII and X). In turn, the thrombin leads to the conversion of fibrinogen to fibrin. Prothrombin and factors VII, IX and X all require vitamin K to become active. In the UK, the use of the PT has been widely replaced by the use of the international normalized ratio (INR). This is derived by dividing the PT of the patient by that of the control. Thus, healthy individuals will have an INR of 1 (< 1.2 is the accepted normal value), while a patient with a PT of 120 s where the control is 12 s would have an INR of 10 (see Chapter 26).
There are two reasons why patients with liver disease may have a prolonged PT, each with different diagnostic implications. First, the liver may be so damaged that it cannot adequately synthesize the clotting factors that require vitamin K for their activation. The half-life of factor VII is about 6 h, so that a prolonged INR is a reliable indicator of the presence of acute liver failure caused by a recent, overwhelming insult to the liver. Second, since vitamin K is a fat-soluble vitamin, it may be deficient because of impaired fat absorption when there is obstructive jaundice. The latter situation is remediable by parenteral administration of vitamin K. Thus, return of the INR to the normal range within 18 h may be taken as evidence of obstructive jaundice, whereas failure to respond implies severe parenchymal disease.
The concentration of factor V is becoming a widely-used test in assessing the severity of acute liver failure, particularly in continental Europe; low factor V concentration is associated with a poor prognosis.
α-Fetoprotein
Under normal circumstances, the synthesis of this protein, the fetal equivalent of albumin, virtually ceases shortly after birth. However, the protein is synthesized in large amounts (and becomes detectable in plasma) in about 70% of patients with hepatocellular carcinoma, and to lesser degrees in certain other tumours and benign liver diseases (see Chapter 42).
α1-Antitrypsin
This protein is the major α1-globulin and responsible for 90% of plasma tryptic inhibitory capacity. α1-Antitrypsin deficiency is a major cause of chronic liver disease in children (see Chapter 14) and, less commonly, of chronic liver disease presenting in adulthood.
Transferrin
Transferrin is the major circulating iron-binding protein, and its concentration correlates with the total iron-binding capacity of plasma. In states of iron overload, such as hereditary haemochromatosis (see Chapter 14), the concentration is modestly reduced, but the saturation is 55–100% compared with the reference range of 30–40%. Plasma transferrin has also been suggested to be a more appropriate overall indicator of protein synthesis by the liver in view of its shorter half-life, as compared with albumin.
Transferrin is a glycoprotein that exists in the circulation in various forms, containing up to six terminal sialic acid residues on its carbohydrate side chains. In healthy individuals, the trisialo-, tetrasialo- and pentasialo- forms predominate. Alcohol appears to inhibit the glycosylation of several glycoproteins, including transferrin, and in subjects consuming excessive amounts of alcohol, plasma transferrin often lacks up to four of these sialic acid residues, resulting in asialo- and disialotransferrins, which are now collectively termed carbohydrate-deficient transferrin (CDT). Consumption of more than 80 g of alcohol/day leads to an increase in the plasma CDT concentration, irrespective of any underlying liver disease. This returns to normal concentrations within two weeks of abstinence. Carbohydrate-deficient transferrin measurement has been proposed as a marker of excessive alcohol consumption, although it is not in widespread use; sensitivity is approximately 80% and specificity somewhat higher, but results do not reflect the nature or severity of any liver disease (see Chapter 14).
Caeruloplasmin
This protein, the principal copper-containing protein in the plasma, has oxidase activity including the ferroxidase activity essential for the oxidation of Fe(II) to Fe(III). It consists of a single polypeptide chain containing six copper atoms, but there is minimal turnover of the copper, suggesting that it does not act as a copper transporter in the manner that transferrin is the circulating iron carrier. In the context of liver disease, it plays an important role in the diagnosis of Wilson disease since it is virtually absent from plasma in this condition.
Acute phase reactants
In response to tissue damage, there is an increase in hepatic synthesis of several plasma proteins, notably C-reactive protein, α1-antitrypsin, antichymotrypsin, fibrinogen and caeruloplasmin. These are an integral part of the inflammatory response, which is described in greater detail in Chapter 30.
Immunoglobulins
Measurement of immunoglobulins is useful in the diagnosis of several liver disorders and for monitoring response to therapy in some. Elevated plasma concentrations often indicate an underlying inflammatory process. An indication of elevation in the immunoglobulins can be obtained by subtracting the plasma albumin concentration from the total protein concentration. This gives a rough measure of the total globulin fraction, of which the immunoglobulins are the major component. Concentrations of the individual immunoglobulin types (IgG, IgA, IgM) can then be determined by various techniques. This can provide helpful information, because different liver disorders are associated with selective elevations in the concentrations of the three immunoglobulin types. Thus, the IgG fraction is usually markedly elevated in autoimmune hepatitis, IgM in primary biliary cirrhosis, and IgA in alcoholic liver disease. Repeated measurement of IgG concentration is also useful in monitoring response to therapy in autoimmune hepatitis. This topic is discussed in more detail in Chapter 30.
Bile acids
In healthy individuals, the concentrations of plasma bile acids (PBAs) are determined by the difference between the amount absorbed from the gut and that taken up by the liver. The latter is fairly constant and, normally, it is the amount absorbed from the gut that determines plasma concentrations. Under pathological conditions, hepatic blood flow and clearance become the determining factors. In this situation, measurement of PBA may be considered as an endogenous clearance test. Accumulation of bile acids in the skin is thought to be associated with the development of the pruritis that is a relatively common feature of cholestatic liver disease.
Measurement of total plasma bile acids using simple automated enzymatic assays has proved to be of value in the diagnosis and monitoring of intrahepatic cholestasis of pregnancy. Total PBA measurement has also been used in the investigation of pruritis in children and adults with cholestatic liver disease, although interference in the assay from ursodeoxycholic acid, which may be used in treating these conditions, has limited its application. Fractionated bile acid analysis using high performance liquid chromatography and mass spectrometry is needed for the diagnosis of the rare inborn errors of bile acid metabolism (e.g. oxosteroid 5β-reductase deficiency and amidation defects). The role of bile acids in carbohydrate and lipid metabolism is currently a subject of considerable interest.
Quantitative evaluation of liver function
The very limited extent to which standard liver tests give any quantitative measurement of hepatic function has already been discussed. To overcome these deficiencies, several tests that measure the efficacy of hepatic clearance of certain compounds, exogenous or endogenous, have been investigated over the past 20–30 years. To date, none has entered routine clinical practice. The main reason is that they require administration of the test substance and then subsequent collection of blood or other body fluids, sometimes over a protracted period. Despite some simplification of these tests, the information gained is seldom seen as justifying the necessary expenditure of time and effort.
However, with the advent of liver transplantation as a realistic therapeutic option in many forms of liver disease, it is becoming increasingly important to obtain more precise prognoses based on an accurate assessment of liver function. Also, many liver diseases are of such chronicity that a test that could reliably assess the efficacy of new drugs, in terms of their ability to improve liver function, would provide a real advance in clinical management of these conditions.
Pharmacological basis and practical requirements of clearance tests
The concept of ‘clearance’ as a test of hepatic function is analogous to the more familiar use of clearance as an index of renal function. The substance chosen should be non-toxic, exclusively eliminated by the liver and easily measurable. The principle of these tests is as follows:
Thus:
Clearance is thus a function of plasma (and hence blood) flow and the second term in the above equation, known as the hepatic extraction ratio (E). When the extraction ratio approaches 1, the clearance equates to liver plasma flow. In healthy subjects, the value of E for indocyanine green is about 0.9 and the clearance of this substance is, indeed, a good indicator of blood flow. In liver disease, however, E may fall to as low as 0.2 and the clearance is no longer dependent on blood flow but more on the ability of the liver to clear the compound. Compounds such as aminopyrine, antipyrine and caffeine have extraction ratios of < 0.25 in healthy subjects and, providing that saturating doses are given, clearance is largely independent of blood flow.
Indocyanine green is not conjugated in the liver, although its removal from the plasma depends on hepatic function. Ten milligrams per kilogram body weight is administered intravenously and samples taken at 3 min intervals between 3 and 15 min. The percentage disappearance rate (PDR) is calculated as:

where t1⁄2 is the half-life of indocyanine green. The reference range is 17–22%; values below this range are considered abnormal.
Other tests of liver function
Serum tests for hepatic fibrosis
Fibrosis, leading ultimately to cirrhosis, is a characteristic feature of progressive chronic liver disease and is responsible for much of the associated functional disturbance and portal hypertension. In chronic liver disease, collagen is laid down in the perisinusoidal space (see Fig. 13.3) and the space of Disse, to the extent that the fenestrations are lost and the sinusoids become capillarized with a true basement membrane. Hepatic stellate cells are likely to play a determining role in the fibrotic process and, increasingly, therapy is aimed at reversing, or at least inhibiting, this process. Until recently, the only method of assessing the extent of fibrosis or response to therapy was by histological examination of liver tissue but, because the fibrosis is often not uniformly distributed throughout the liver, there is a risk of sampling error. Transient elastography (Fibroscan®), a technique that measures liver stiffness, correlates with histological staging of fibrosis. A low amplitude shear wave is generated from a probe applied to the thoracic wall at the level of the right lobe of the liver. The velocity of propagation is directly proportional to liver stiffness. This estimates existing fibrosis but cannot provide any information on whether the fibrotic process is historical or ongoing. For this reason, biochemical markers of fibrogenesis have been sought for many years.
Several biochemical candidates have been proposed as markers of fibrosis either in isolation or combined together in a scoring system. Some of these incorporate standard biochemical tests whilst others involve measurement of compounds involved in the fibrogenic process (Table 13.1). The increasing prevalence of liver disease due to infection with the hepatitis C virus has provided focus to the search for non-invasive markers of clinically significant fibrosis.
TABLE 13.1
Scoring systems for assessing fibrogenesis
| Score | Components |
| PGA index | Prothrombin time, γGT, apolipoprotein A1 (± α2-macroglobulin) |
| Fibro Test® | Haptoglobin, α2-macroglobulin, apolipoprotein A1, γGT, bilirubin, (± ALT) |
| Fibrometer™ test | Platelets, prothrombin time, AST, α2-macroglobulin, hyaluronate, urea, age |
| Hepa Score® | Bilirubin, γGT, α2-macroglobulin, hyaluronate, age, sex |
| ELF score | PIIINP, hyaluronate, TIMP-1 |
ALT, alanine aminotransferase; AST, aspartate aminotransferase; PIIINP, amino-terminal procollagen type III; TIMP-1, Tissue inhibitor of metalloproteinase 1.
Collagen metabolites
Quantitatively, types I and III collagen are involved in hepatic fibrosis but type IV is also important in basement membranes. Measurement of the concentration of the amino-terminal procollagen type III (PIIINP) in plasma is a non-invasive marker of collagen type III metabolism. The PIIINP concentration reflects fibrinogenesis (i.e. the rate of ongoing fibrosis) rather than the absolute amount of fibrosis present in the liver. Nonetheless, PIIINP measurements are of value for indicating the development of fibrosis in patients receiving potentially hepatic fibrogenic drugs such as methotrexate. Other approaches, such as measurement of the carboxy-terminal cross-linking domain of type IV collagen, are being actively investigated.
Hyaluronate
Hyaluronate is a high molecular weight glycosaminoglycan with a structural role in the extracellular matrix. It is synthesized by hepatic stellate cells and cleared by specific uptake by endothelial cells. Increased plasma concentrations may be linked to endothelial dysfunction that occurs as fibrosis progresses.
Tissue inhibitor of metalloproteinase 1
Tissue inhibitor of metalloproteinase 1 (TIMP-1) is a member of the tissue inhibitors of metalloproteinases (MMP) family. These MMPs are secreted by fibroblasts and Kupffer cells and MMP-2 in particular is upregulated by type 1 collagen: MMP-2 is probably involved in the breakdown of normal extracellular matrix. Tissue inhibitor of metalloproteinase 1, which inhibits MMP-2, may also promote cell proliferation and have apoptotic properties. It is used in the calculation of the European liver fibrosis score (see below).
European liver fibrosis score (ELF)
A combination of PIIINP, hyaluronate and TIMP-1 has been proposed as a better marker of fibrogenesis than the component parts on their own. The ELF score is produced from the equation below:

All measurements are expressed as μg/L. Normal scores fall between − 1.3 and + 0.3.
The first major study of 1021 subjects with chronic liver disease of various causes showed a sensitivity of 90% and specificity of 92% for the presence of hepatic fibrosis. Further investigations into potential applications of the ELF score are ongoing.
USES OF LIVER FUNCTION TESTS
Differential diagnosis of jaundice
The differential diagnosis of jaundice is an exercise in applied physiology and anatomy. Provided the reader accepts that there is seldom a single mechanism, the traditional classification into pre-hepatic, hepatic and post-hepatic remains useful. In each case, bilirubin is being produced faster than it can be cleared.
Pre-hepatic jaundice
In pre-hepatic jaundice, an increased bilirubin load is presented to the liver and the plasma bilirubin concentration reaches a steady state at a higher concentration, typically in the range 50–75 μmol/L. A haemolytic process due either to fragile red cells (e.g. sickle cell disease, congenital spherocytosis) or an autoimmune attack on the red cells is usually implicated. The bilirubin is unconjugated and bound to albumin and thus does not appear in the urine, hence the term ‘acholuric jaundice’ is used to describe the jaundice accompanying haemolysis. Since there is no liver disease, the liver can conjugate and excrete the increased bilirubin load, but the amounts of urinary and faecal urobilinogen will be increased. As the haemoglobin concentration starts to fall as a result of the haemolytic process, the bone marrow will attempt to compensate by increasing the output of red cells. The maximum increase that the marrow can achieve (about eight times the normal rate) corresponds to a plasma bilirubin concentration of ~ 75 μmol/L.
If, however, haemolysis occurs at such a rate that compensatory marrow hyperactivity cannot keep pace, then the haemoglobin concentration will fall and higher plasma bilirubin concentrations may be seen. On the other side of the equation, if the liver is damaged, then its ability to take up the bilirubin will be limited and concentrations of bilirubin > 75 μmol/L may occur. Thus, when a patient is found to have mild jaundice and there is no bilirubin in the urine, examination of the haematological indices will usually be sufficient to make the diagnosis of some form of haemolytic anaemia, especially as other liver tests will, by contrast, be normal. If there is no evidence of haemolysis, the cause will usually be Gilbert syndrome (see below). Estimation of the conjugated and unconjugated fractions becomes of particular importance in determining if, in a patient already known to have chronic liver disease, haemolysis is contributing to deepening jaundice.
Urinary bilirubin and urobilinogen
The presence of bilirubin in urine (usually detected by commercially available dip-sticks) is always pathological and indicative of hepatic or biliary tract disease. Bilirubinuria may precede hyperbilirubinaemia and, therefore, be a very sensitive test of impending liver damage, for example in the early, presymptomatic stage of viral hepatitis.
If bile pigments reach the gut in reduced amounts (as in obstructive jaundice), the amount of urobilinogen in the urine will decrease accordingly. If no urobilinogen can be detected on repeated testing over several days, complete biliary tract obstruction, the most common cause of which is pancreatic carcinoma, may be assumed. Although urine urobilinogen can be assessed qualitatively using dipsticks, testing is now rarely performed as there are much more reliable and accurate ways of diagnosing biliary obstruction.
Hepatic (hepatocellular) jaundice
This type of jaundice occurs in conditions characterized by primary damage to the hepatocytes, that is, acute and chronic hepatitis of any cause. The excess bilirubin is mainly conjugated.
Post-hepatic (cholestatic) jaundice
Cholestasis means failure of biliary secretion. As originally defined, the term referred to failure at the level of the hepatocytes, but in clinical practice it is more broadly defined to include obstruction to bile flow occurring anywhere between the biliary canalicular membrane of the hepatocyte and the gut. In cholestatic jaundice, the hyperbilirubinaemia is due to conjugated bilirubin.
Further investigation
The crucial decision for the clinician to make in a patient with conjugated hyperbilirubinaemia is whether or not a surgical approach is appropriate, as misdiagnoses can have grave consequences. The role of the liver function tests is clear: it is to suggest the most appropriate second-line investigation. In general, if the plasma aminotransferases are elevated and there is only slight increase in ALP activity, the picture is regarded as ‘hepatitic’. The approach is primarily medical management, possibly guided by the result of a liver biopsy and other investigations. On the other hand, if the predominant rise is in ALP, the picture is regarded as ‘cholestatic’ and it is important to determine the level at which there is failure of bile flow. This is achieved using imaging techniques, for example ultrasound examination, endoscopic retrograde cholangiography or magnetic resonance cholangiography. Obstruction to bile flow outside the liver is usually an indication for surgical intervention.
Imaging techniques have become so widely available and reliable that the great majority of patients with jaundice of unknown origin will have at least an ultrasound or radiological examination irrespective of the liver function tests. Perhaps only in the primary care setting, if the clinical picture and ‘hepatitic’ liver function tests suggest acute hepatitis, will imaging not be undertaken.
The inherited hyperbilirubinaemias
The inherited hyperbilirubinaemias, manifested mainly in childhood, are considered here because they illustrate specific disturbances of the pathways of bile pigment metabolism. Other than the specific defect, the liver functions normally and, apart from the plasma bilirubin, the results of most of the standard biochemical liver tests are within their reference ranges. Conventionally, these disorders are classified as conjugated and unconjugated types. Unconjugated hyperbilirubinaemia is said to be present when < 25 μmol/L or < 20% of an increased bilirubin concentration is in the conjugated form.
Unconjugated types
Crigler–Najjar syndrome
This is an extremely rare condition, caused by a complete absence (type 1) or considerable reduction (type 2) of UDP-glucuronosyl transferase activity with respect to bilirubin glucuronidation. It is inherited in an autosomal recessive manner. The condition shows considerable heterogeneity. There is a failure to conjugate bilirubin and the child becomes very deeply jaundiced within the first few days of life, most of the plasma bilirubin being in the unconjugated state. The unconjugated bilirubin can cross the blood–brain barrier and be deposited in the basal ganglia, leading to characteristic neurological abnormalities termed kernicterus, which can include extrapyramidal-type movement disorders, visual defects and hearing problems. In the most severe form (type 1), death usually ensues within the first year of life, although repeated phototherapy has been used successfully to reduce bilirubin concentrations and liver transplantation is now a viable option. In Crigler–Najjar syndrome type 2, the activity of UDP-glucuronosyl transferase can be increased by giving phenobarbital (which induces synthesis of the enzyme) in addition to phototherapy. Survival into adulthood is now well described.
Gilbert syndrome
This, in contrast to Crigler–Najjar syndrome, is a common (occurring in approximately 7% of the population) and entirely benign condition, characterized by recurrent episodes of mild jaundice, the plasma bilirubin concentration being < 100 μmol/L and the only abnormality in the standard liver tests. Jaundice tends to be more pronounced when the affected individual is tired, has an intercurrent illness (e.g. influenza) or has been fasting. It should be remembered that caloric deprivation often occurs during hospital admission for any reason, and the resultant jaundice in an individual with Gilbert syndrome may be regarded as indicating a significant hepatic complication if the diagnosis is not made.
Gilbert syndrome is caused by a reduction in the concentration of the isoform of UDP-glucuronosyltransferase, UGT-1A, responsible for bilirubin conjugation, owing to polymorphisms in the promoter region of the UGT-1A gene that reduces its expression. A two base-pair addition (TA) in the TA(6) TAA element of the UGT-1A promoter sequence, when present in the homozygous state (TA(7)/TA(7)), results in an inability to produce sufficient UGT-1A to respond to increases in demand for bilirubin conjugation. Genotyping for the defect is now available as a routine test for the syndrome, and has superseded other tests.
Conjugated types
Dubin–Johnson syndrome
This is an uncommon, benign condition inherited in an autosomal recessive manner and characterized by decreased biliary canalicular transport of conjugated bilirubin and organic anions. Dubin–Johnson syndrome is caused by mutations in MRP2, the gene encoding multidrug resistance-associated protein 2, and presents with mild fluctuating jaundice at any age from the neonatal period to adult life, usually with normal aminotransferase and ALP activities. It is often precipitated by use of the contraceptive pill or during pregnancy and, with the increasing availability of mutational analysis, is now frequently revealed during screening of family members with the condition. The liver biopsy shows black coarse inclusions of an as yet unidentified pigment.
A second characteristic finding in this syndrome is that most of the urinary coproporphyrin is type I, whereas in unaffected subjects it is mainly type III. The total amount of urinary coproporphyrin is normal and the abnormality is probably related to a differential excretory capacity for the two isomers.
Rotor syndrome
Like Dubin–Johnson syndrome, this is an autosomal recessive condition characterized by a moderate fluctuating jaundice, few symptoms and having a good prognosis. However, several differences from Dubin–Johnson syndrome are evident: in particular there is no pigment in the liver. The total urine coproporphyrin content is high but with a normal ratio of isomers. The gene mutation causing this syndrome has not yet been identified.
Monitoring response to therapy
Liver biopsy, sophisticated imaging tests and specific biochemical tests, outlined in Chapter 14, are helpful in establishing a precise diagnosis in liver disease, but they have limited utility in repeated appraisal of disease progression or monitoring response to treatment over short periods. This reflects both their cost (in the case of imaging) and safety aspects (in the case of liver biopsy). Herein lies the major role of the standard liver function tests.
There are three broad situations in which frequent monitoring is useful.
2. Monitoring response to treatment of chronic conditions. Good examples here are in the immunosuppressive treatment of autoimmune hepatitis and antiviral therapy in chronic viral hepatitis; other examples are described in Chapter 14. Specifically, monitoring of changes in aminotransferase activities is a useful (and cheap) means of assessing response in autoimmune hepatitis (along with measurement of plasma IgG concentration), and as an adjunct to detection of the reduction in (or clearance of) viral genomic material from the blood in chronic viral hepatitis.
3. Detecting hepatotoxicity caused by drugs. Monitoring of liver function tests is undertaken for all drugs during clinical trials prior to licensing; any abnormalities are taken as evidence of hepatotoxicity (see Chapter 14). In some instances, where a drug is licensed, but an acceptable risk of toxicity (mild and reversible) has been identified, monitoring may be recommended as a part of continuing surveillance.
Neonatal jaundice
Healthy full-term babies may be jaundiced from the 2nd to the 8th day of life, and premature babies from the 2nd to the 10th, or even the 14th day. This so-called ‘physiological’ jaundice seldom exceeds 100 μmol/L and is predominantly unconjugated, reflecting a combination of increased red cell destruction, decreased hepatic uptake and reabsorption from the gut. Jaundice detectable on the first day of life, or outside the range described above, is pathological, as is the finding of conjugated hyperbilirubinaemia at any time.
When the concentration of bilirubin is very high (> 300 μmol/L in full-term infants, but lower in premature babies), the fat-soluble unconjugated bilirubin may cross the blood–brain barrier and cause brain damage (kernicterus). While measurement of plasma bilirubin is not indicated as routine in jaundiced babies, it does become important when the jaundice is deepening so that treatment by phototherapy and/or exchange transfusion can be instituted and kernicterus prevented.
The neonatal hepatitis syndrome
This syndrome, of which there are several causes, describes a neonate usually less than one month old with pale stools, dark urine and hepatomegaly, who is failing to thrive. In common with adult practice, the major problem is to identify those patients that are amenable to effective surgical intervention, particularly those having congenital biliary atresia (see Chapter 25). It is crucial to confirm that the biliary tract is atretic before embarking on surgery.
Tests of bile duct patency
The Rose Bengal dye test has proved useful in the past for identifying patients with extrahepatic neonatal obstruction. If < 10% of an intravenously administered dose is excreted in the stools over a 72 h period, this is strong evidence for biliary obstruction. Currently, technetium-labelled hepatobiliary imaging agents such as hydroxyindolediacetic acid (HIDA) are more often used than Rose Bengal. In combination with liver biopsy, accurate results are achieved in the great majority of cases.
ABNORMAL LIVER FUNCTION TESTS IN ASYMPTOMATIC PATIENTS
With the use of large automated analysers, health screening programmes and medical examinations for insurance purposes, clinical biochemists are increasingly consulted about the significance of abnormal liver tests in patients who are entirely asymptomatic. While the potential for generating needless anxiety is great and not all conditions diagnosed are treatable, much evidence suggests that such abnormalities should be taken seriously, and that referral for a specialist opinion for further investigation is often indicated and justifiable.
Bilirubin
Isolated increases in plasma bilirubin usually indicate Gilbert syndrome. The concentration is < 100 μmol/L and usually in the range 20–50 μmol/L. This hyperbilirubinaemia is unconjugated and other standard liver function tests are normal (see p. 246). Measurement of haemoglobin, reticulocyte count and, if necessary, haptoglobin will eliminate haemolysis as a cause. Genetic testing is available.
Alkaline phosphatase
In young people, an isolated increase in the activity of this enzyme is often physiological. Increased activity occurs during periods of rapid bone growth and during pregnancy. In older females, the finding of isolated raised ALP activity of hepatic origin may be the first manifestation of primary biliary cirrhosis and estimation of antimitochondrial antibody (see Chapter 14) will speed the diagnostic process. Alternatively (more commonly in males), it may be suggestive of primary sclerosing cholangitis. Subclinical malignant liver disease (primary or secondary), usually found to be a space-occupying mass within the liver, may also produce an isolated rise in plasma alkaline phosphatase activity. Benign transient hyperphosphatasaemia (see p. 240) is an important condition to recognize, as ALP will return to normal over a 6–8-week period after any infection has cleared and invasive investigations can be avoided.
Aminotransferases
In about 60% of patients, isolated increases in the activities of these enzymes will be attributable to fatty infiltration of the liver associated with obesity, diabetes mellitus or excessive alcohol consumption. However, they may also be due to certain drugs and herbal remedies. Once coexistent drug administration has been excluded, most remaining individuals who have persistently elevated enzyme activities will prove to have some form of chronic hepatitis. Many of these, particularly subjects born outside the UK or those with a history of drug abuse, may have occult chronic viral hepatitis (B or C) – although subclinical hepatitis A is also a possibility. Others will have elevated plasma immunoglobulin concentrations and high plasma titres of autoantibodies (see Chapter 14); on histological examination, cirrhosis will often be present. A small proportion will have other conditions such as haemochromatosis, Wilson disease or α1-antitrypsin deficiency.
γ-Glutamyltransferase
Marked and persistent elevation in γGT activity may be an indicator of unrecognized excessive alcohol consumption, but it is by no means specific and may also be found in most subclinical liver diseases, or be a result of induction of the enzyme by a number of drugs, components of herbal remedies or environmental agents. Some non-hepatic conditions, including pancreatic disease, hypothyroidism and certain neurological disorders, may also give rise to isolated increases in γGT activity. The increasing prevalence of obesity, type 2 diabetes mellitus and non-alcoholic fatty liver disease (NAFLD) has meant that an isolated increase in γGT is most commonly a consequence of fat deposition in the liver.
NORMAL LIVER FUNCTION TESTS IN THE PRESENCE OF OVERT LIVER DISEASE
Standard liver function tests within the reference range do not exclude chronic liver disease. Entirely normal test results may be present in patients with ‘inactive’ cirrhosis, that is, where there is little or no ongoing liver damage or inflammation. Common examples include alcoholic cirrhosis after abstention from drinking and autoimmune hepatitis that is well controlled on immunosuppressive therapy. In the presence of normal standard liver function tests, signs of portal hypertension (such as oesophageal varices, which are usually indicators of chronic liver disease) should also raise the possibility of portal vein thrombosis. In this situation, the INR is often modestly prolonged.
ROLE OF LIVER FUNCTION TESTS IN ASSESSING PROGNOSIS
Orthotopic liver transplantation for liver failure is now a well-established form of management in severe acute and chronic liver disease. Nonetheless, the operation is not without risk and precise timing of the procedure is still difficult. Ideally, it should be undertaken only when the patient’s life expectancy is less than what might be expected after the operation. Several models that aim to permit calculation of likely survival without transplantation have been developed. Some ‘standard’ liver function tests figure prominently among the variables considered in these models.
Chronic liver disease
An early system, still widely applied, is the Child–Turcotte classification, which was later modified by Pugh et al. (Table 13.2). This was an entirely empirical formula designed primarily to assess the degree of risk of liver failure in patients undergoing surgical operations, but has since been used as a general measure of severity of liver disease and hence likely survival. The Child–Turcotte–Pugh (CTP) classification has been criticized on the grounds that two of the measures (ascites and encephalopathy) are subjective, and that the patient is assigned one of three scores that do not reflect a spectrum of overall impairment of liver function and hence the need for transplantation. In addition, a ‘ceiling effect’ occurs when patients with laboratory values greater than the defined upper limits are not scored as being more ill than those falling within these limits. Furthermore, the CTP classification does not take into account the terminal stages of liver impairment when renal failure supervenes, a complication that indicates a very poor outcome.

The need for more robust and objective criteria on which to base selection for liver transplantation has prompted the recent development of a Model for End Stage Liver Disease (MELD) scoring system. This prognostic model for cirrhosis draws on the analysis of prospective datasets using logistic regression analysis and receiver operating characteristics, and uses serum total bilirubin and creatinine concentrations and INR.
The equation used to calculate the MELD score is:
MELD scores derived from many patients in a wide range of institutions dealing with the selection of patients for liver transplantation, fall within a range of values that vary from 6 (less ill) to 40 (gravely ill). The scores are used to decide whether an individual needs an urgent liver transplant within the next three months, with patients that have a MELD score of > 16 being prioritized for transplantation.
Acute liver failure
Liver transplantation for acute liver failure is now routinely performed but, again, laboratory investigations are important in assessing the likelihood of survival without transplantation. For example, in patients with paracetamol-induced acute liver failure, an arterial hydrogen ion concentration of > 50 nmol/L (pH < 7.3) or, if this feature is absent, the combination of grade 3 encephalopathy, an INR > 6.5 and serum creatinine of > 300 μmol/L, indicate a very slight chance of spontaneous recovery and represent a strong indication to proceed to transplantation.
CONCLUSION
There are three categories of liver function tests. These are: the standard tests, for example plasma bilirubin and albumin concentrations and the activities of various enzymes; clearance tests, and tests used in the management of specific liver diseases.
In general, the standard liver function tests are poor indicators of hepatic function and seldom provide a specific diagnosis; it is important not to over-interpret their results. They may, however, provide a guide to further investigations that may give a specific diagnosis, for example imaging by isotopes, ultrasound or radiography or histological examination of liver biopsy material. The standard liver function tests can be of value prognostically and in screening for liver disease, and are vital in the monitoring of liver disease and its response to treatment.
Tests for specific liver disease, for example plasma α-fetoprotein, copper and caeruloplasmin, can be diagnostic and are also used in management.