Chapter 196 Imaging for Peripheral Nerve Disorders
Diffusion neurography and the closely related diffusion tensor tractographic technique were the first methods reported.1–3 These methods have extremely high selectivity for nerves and should be very sensitive to a variety of types of more subtle pathology. However, the technical demands necessary to perform diffusion neurography have delayed its clinical application.4–6 In addition, diffusion images tend to degrade in detail at locations of more severe pathology.
Diffusion and Diffusion Tensor Neurography Techniques
When a strong diffusion gradient is applied in the appropriate direction along with fat suppression and heavy T2 weighting, it is possible to produce a relatively pure nerve image. This is a method that has been applied to produce whole-body neurography images.7,8
For both peripheral and central nervous system (CNS) neural tissue, Filler and colleagues9–12 pointed out that it was possible to measure each voxel (three-dimensional pixel) in an image volume using three or more gradients in order to calculate both the magnitude and the direction in three-dimensional space of the anisotropy. These two data components could then be used to depict actual curving neural tracts rather than to simply display two-dimensional contrast differences in cross section. When six or more gradient directions are used, the vector processing can be accomplished using a tensor model and the result becomes very robust across any curve or angle of progression. Vector models are used with as many as 256 directions of data acquisition. The end result is to determine the orientation of the primary characteristic vectors (eigenvector in tensor models) in a voxel. This can be done to determine more than one axonal direction in a voxel (crossing fibers) when large numbers of acquisition directions are used in vector methods.
When diffusion images are obtained in multiple different directions for a DTI study, the raw diffusion images can be helpful for identifying the nerve. This step can be done using the original images because they suppress signal from vessels and other structures that are bright on T2-weighted fat-suppressed images, leading to relatively pure nerve images depending on the orientation of the nerve and the image at a given location. Unlike fully processed DTI images, the raw diffusion component images remain embedded in the original DICOM (Digital Imaging and Communications in Medicine) format spatial grid and can be precisely correlated with T2 neurographic images obtained in the same imaging session (Fig. 196-1).
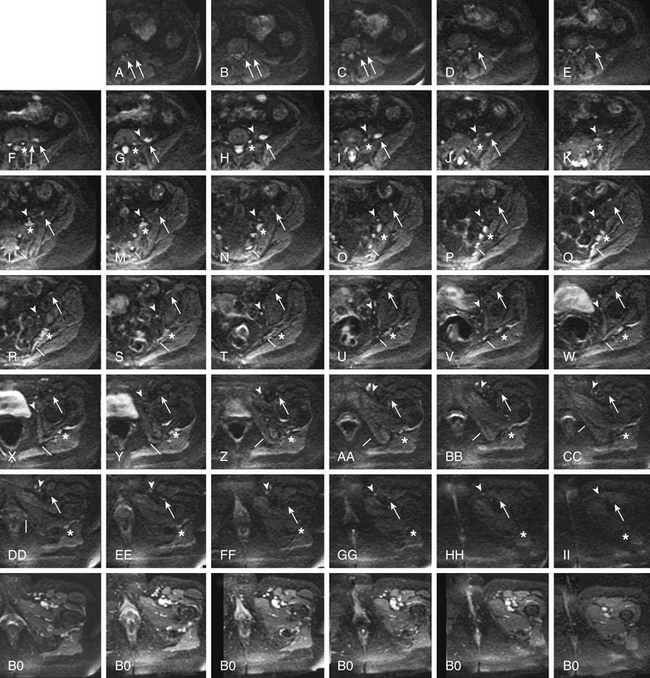
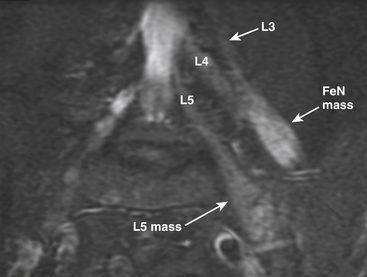
FIGURE 196-1 Use of diffusion tensor image (DTI) data for nerve identification. This series of images demonstrates the use of diffusion-weighted components of a DTI acquisition (a-ii) for nerve identification in the same patient as in Figure 196-4. The asterisks track the L5 spinal nerve as it progresses through to the sciatic nerve (f to ii). The arrows track the L3 spinal nerve (left arrow) and L4 spinal nerve (right arrow) as they progress into the femoral nerve (a to f) and then mark the femoral nerve (f to ii). The arrowheads (g to ii) show the progress of the obturator nerve as it forms from anterior L4 and L5 branches then descends through the obturator foramen. The lines track the S2 contribution to the pudendal nerve (l to dd). Appropriately selected DTI component images contain relatively pure nerve images with very significant suppression of vessels and other structures that are bright on T2-weighted images. Note that the matched B0 (non-diffusion) component of the DTI acquisition obtained a few seconds earlier in the same patient shows numerous bright structures at the inguinal ligament that make identification of the femoral nerve and obturator nerve impossible without reference to the diffusion image.
T2-Based Neurography
Once the diffusion method was understood, it was possible to show that structures with long decay times (imaged at a relatively long echo time) in fat-suppressed spin-echo images were, in fact, nerves. Previously, nerves had been misinterpreted as exhibiting short decay times on T2 imaging.13 This was because nerves are a mixture of different tissues including protein-laden axoplasmic water, myelin, fatty interfascicular epineurium, and connective tissues. Older methods allowed the image signal from these various component tissues to mix. In a variety of different imaging techniques, the result of the image signal mixing was a featureless gray image of the nerve that left nerves difficult to distinguish clearly in an image and caused confusion about the fundamental imaging characteristics of nerve.
In a number of settings, MR neurography has proved to be more efficacious than electrodiagnostic studies for identifying nerve compressions that will improve with surgical treatment. This is true both in diagnoses that are typically evaluated by electrodiagnostics, such as carpal tunnel syndrome,14,15 and in diagnoses in which electrodiagnostics have proved difficult to rely on, such as thoracic outlet syndrome, piriformis syndrome, and related sciatic nerve entrapments and pudendal nerve entrapment syndromes.11,16–18
Utility of MR neurography has now been established in evaluation of entrapment syndromes,16,19–22 nerve injury and evaluation of repair,23 and assessment of nerve tumors,24–26 as well as in the setting of neuritis and a variety of neuropathies.27 It has also proved effective for evaluating nerve disorders affecting young pediatric patients such as obstetric brachial plexus palsy.28
Classes of Image Findings
Image findings in MR neurography studies include regions of nerve hyperintensity or nerve swelling, which result from edema at the fascicular level (Fig. 196-2). Distortions of normal nerve course, abnormal contours, and alterations of nerve caliber are also readily seen, any of which can be classed by the degree or severity of the abnormality. These findings can indicate entrapment or adhesions as well as post-traumatic effects.
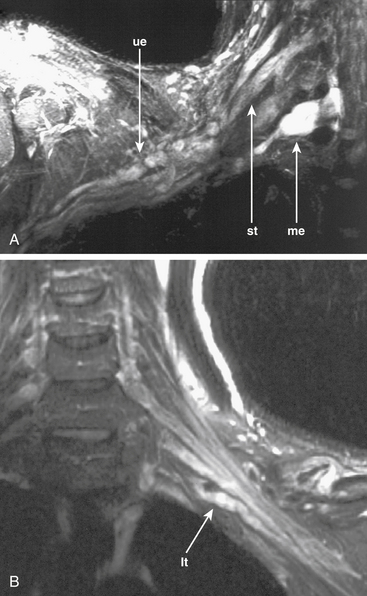
In trauma, assessments of nerve continuity and/or location of severed nerve endings are feasible. With the elapse of time after injury or repair, the development of traumatic neuromas may be readily appreciated (Fig. 196-3).
Imaging in The Setting of Nerve Entrapment and Pain
Thoracic Outlet Syndromes
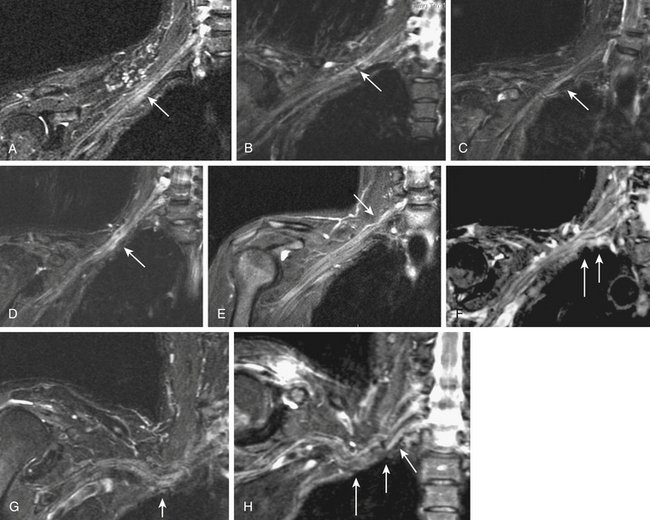
MR neurography has shown promising capabilities for discriminating among several different types of thoracic outlet syndrome lesions and in many cases can depict well-delineated and readily treatable specific pathologies.29,30 These include distortions of the course of the proximal elements at the scalene triangle (see Fig. 196-2A-D), fibrous band entrapments affecting C8 and T1 spinal nerves and the lower trunk of the brachial plexus (see Fig. 196-2F), gross distortions of the mid-plexus (see Fig. 196-2G and H), irritation at the level of the first rib, and distal plexus irritation.
MR neurography is also helpful when it demonstrates a completely normal course and caliber for all nerve elements that are under suspicion. In the presence of normal findings, it is possible to take a firm stance against surgical treatment of the hand, arm, or shoulder problems that might have been tentatively attributed to a thoracic outlet syndrome.
Brachial Plexus Neuritis
In addition to surgically treatable entrapments, MR neurography is also helpful in identifying patients with complaints attributable to nerve inflammations.27,31 These patients often present with painless hand atrophy, with no associated sensory abnormality. This has sometimes been termed a Gilliatt-Sumner hand syndrome. Brachial plexus elements appear bright and swollen but demonstrate no distinct evidence of impingement.
Lumbar Foraminal Pathology
Even when myelography is capable of demonstrating a nerve root cut off, an MR neurogram can provide considerable additional information. The full length of the foraminal impingement requiring treatment can often be better appreciated in a neurographic image. In addition, the ability of MR neurography to demonstrate hyperintensity in the lumbar root adjacent to the impingement helps confirm the clinical significance of the impingement.27
Piriformis, Pudendal and Ilioinguinal Pelvic Entrapments
MR neurography has had a significant impact on diagnosis of nerve entrapments in the pelvis.16,17,32–34 Although sciatic pathologies have been an important part of the advance, the ability of MR neurography to track other nerve elements in the pelvis such as the ilioinguinal nerve, the pudendal nerve, and the lateral femoral cutaneous nerve has gone a long way toward resolving what had been a troublesome black box. Imaging of the complete course of the L4 spinal nerve as it progresses into the femoral nerve has made it possible to search for abnormalities along the intra-abdominal and intrapelvic course that were previously almost impossible to diagnose (see Figs. 196-1 and 196-4).
A single imaging study can demonstrate the full course of the L5 and S1 spinal nerves and their descendants in the lumbosacral plexus and in the proximal sciatic nerve. It is very reliable for demonstrating the presence of a split nerve–split muscle configuration in the setting of a possible piriformis syndrome. Focal sciatic impingements at the ischial margin, at the tendon of the obturator internus, at the distal ischial tunnel on the lateral aspect of the ischial tuberosity, and at various locations in the thigh are readily distinguished.17,17a
Identification of the presence or absence of pudendal nerve irritation at its S2 or S3 spinal nerve origin in the variant condition of passage through the piriformis muscle, in the Alcock canal along the medial aspect of the obturator internus muscle or at the rectal branch of the pudendal nerve proximal to its entrance to the Alcock canal has also been quite useful clinically.18,34
Nerve Trauma
MR neurography can be fairly efficient for establishing the existence of significant nerve injury35 and for demonstrating true discontinuities in nerve (see Fig. 196-3B). At present, there still exists a limitation in that hemorrhage immediately after a trauma can obscure some details of the nerve image in the first few days after an injury.
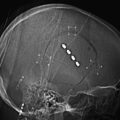
There is still no completely reliable means of confirming a true nerve root avulsion by imaging.36 An MR neurography study includes an effective MR Myelogram (see Fig. 196-3A) and can therefore demonstrate the meningoceles that may be associated with nerve root avulsions. The procedure is less invasive than a CT myelogram and provides information of similar quality.
Obstetric Brachial Plexus Injury
A particularly complex situation arises in the management of obstetric brachial plexus injuries. Imaging of infants is difficult and the need for sedation entails significant additional risks. However, it has proved possible to identify growing terminal neuromas in some locations and to demonstrate continuity of nerves at other sites. As computer techniques for postprocessing of images have progressed, it has become possible to generate fairly detailed image representations of complex brachial plexus injuries in children younger than four months.28
Follow-up of Nerve-Grafting Procedures
After nerve grafting or after primary early repair of a nerve laceration, several months must elapse before it becomes clear whether the graft has been successful. MR neurography has proved helpful for evaluating a nerve suture repair site when recovery did not ensue.23
Nerve Tumors
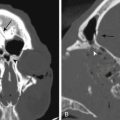
MR neurography permits a directed examination for nerve tumors that has a greater sensitivity than other MR methods because of its reliability for showing that a given mass is actually inside a nerve or in direct continuity with it (Fig. 196-4), as well as for locating safe entry approaches to the mass by demonstrating the position of nerve fascicles on the exterior surface of the mass. In some cases, the level of detail also allows distinguishing among types of tumors such as the reported capability of distinguishing perineuriomas37 from schwannomas and for identifying very small tumors that just slightly expand the caliber of a nerve. Imaging can play a role in the initial diagnosis of neurofibromatosis and is also helpful in tracking and analyzing advanced stages of the disease.
Imaging of Denervated Muscle
The development of signal alterations in muscle after denervation was first reported by Shabas38 and by Jolesz and colleagues.39 It is now known that abnormal muscle appearance may be detected as early as 4 days after an axonotmetic or neurotmetic injury. The signal abnormalities become progressively more intense as months pass, reaching a maximum about 4 months from the date of injury. In the 1- to 2-year range, the quality of the abnormality changes but will persist unless the nerve regrows or is restored through grafting.
Additional information about clinical utility of muscle imaging appears in a report on imaging of 32 cases by West and colleagues.40 They document a range of alterations in image appearance in a case study format.
Open MR-Guided Injections for Diagnosis and Treatment
Open MR-guided injections can be carried out in a low field (0.25 Tesla) imager that has a small-diameter magnet and in-room monitor41 (Fig. 196-5). If the diameter of the magnet is about 3 feet, then it is possible for the surgeon to easily reach into the center of the system as imaging progresses. The in-room monitor allows the surgeon to watch the image in real time. These typically involve a projector that provides a large crisp image showing multiple adjacent image frames.
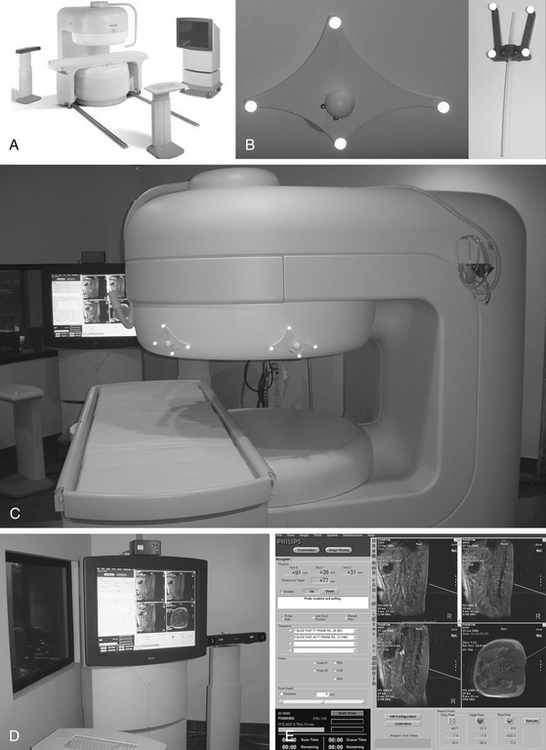
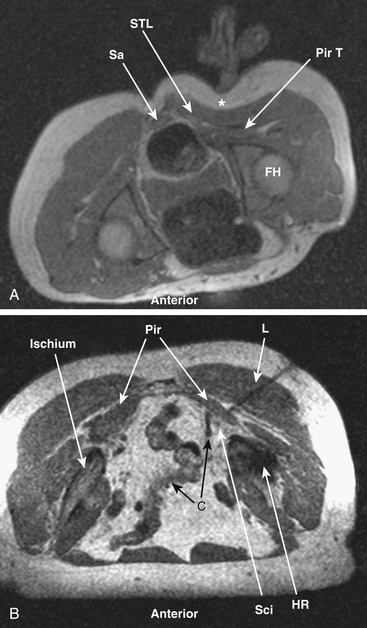
The imaging during procedures is monitored with fast (10 to 15 second) three-slice image sets: one working image and the two adjacent image slices. These are obtained using a type of MRI called FLASH (fast low-angle shot) or FFE (fast field echo). The needle advance must be maintained in the center slice of the three-slice set so that an accurate depiction of needle depth is seen. Because the piriformis muscle is often no more than 1 to 2 cm thick (Fig. 196-6) and because the bowel is often adjacent just deep to the muscle, it is necessary to re-image once or twice with each movement of the needle. Lower-accuracy alternatives to open MRI include x-ray fluoroscopy, CT guidance, or EMG with ultrasound.42
Conclusions
The introduction of imaging techniques capable of demonstrating the intrinsic signal of nerve as well as of preserving and displaying structural linear properties of neural tissue in general is progressively transforming all of neuroimaging even as it transforms our approach to diagnosis, treatment planning, and surgical access. It is now clear that diagnosis and surgical planning in the management of peripheral nerve disorders should include specialized nerve imaging just as the neurosurgeon has relied on imaging for cranial and spinal disorders in the past.
Aagaard B.D., Maravilla K.R., Kliot M. Magnetic resonance neurography: magnetic resonance imaging of peripheral nerves. Neuroimaging Clin North Am. 2001;11(1):131-146. viii
Bowen B.C., Pattany P.M., Saraf-Lavi E., et al. The brachial plexus: normal anatomy, pathology, and MR imaging. Neuroimaging Clin North Am. 2004;14(1):59-85. vii-viii
Filler A.G. Diagnosis and treatment of pudendal nerve entrapment syndrome subtypes: imaging, injections, and minimal access surgery. Neurosurg Focus. 2009;26(2):E9.
Filler A.G.. Minimal access nerve surgery and interventional MRI. Neurosurgery, 2009;suppl 4(65):A212-A221
Filler A.G. MR neurography and diffusion tensor imaging: origins, history and clinical impact of the first 50,000 cases with an assessment of efficacy and utility in a prospective 5,000 patient study group. Neurosurgery. 2009;65(suppl 4):A29-A43.
Filler A.G.. The history, development and impact of computed imaging in neurological diagnosis and neurosurgery: CT, MRI, DTI. Internet Journal of Neurosurgery, 2010;1(7) http://www.ispub.com/journal/the-internet-journal-of-neurosurgery/volume-7-number-1/the-history-development-and-impact-of-computed-imaging-in-neurological-diagnosis-and-neurosurgery-ct-mri-and-dti.html
Filler A.G., Haynes J., Jordan S.E., et al. Sciatica of nondisc origin and piriformis syndrome: diagnosis by magnetic resonance neurography and interventional magnetic resonance imaging with outcome study of resulting treatment. J Neurosurg Spine. 2005;2(2):99-115.
Filler A.G., Kliot M., Howe F.A., et al. Application of magnetic resonance neurography in the evaluation of patients with peripheral nerve pathology. J Neurosurg. 1996;85(2):299-309.
Filler A.G., Maravilla K.R., Tsuruda J.S. MR neurography and muscle MR imaging for image diagnosis of disorders affecting the peripheral nerves and musculature. Neurol Clin. 2004;22(3):643-682. vi-vii
Grant G.A., Britz G.W., Goodkin R., et al. The utility of magnetic resonance imaging in evaluating peripheral nerve disorders. Muscle Nerve. 2002;25(3):314-331.
Grant G.A., Goodkin R., Maravilla K.R., et al. MR neurography: diagnostic utility in the surgical treatment of peripheral nerve disorders. Neuroimaging Clin North Am. 2004;14(1):115-133.
Howe F.A., Filler A.G., Bell B.A., et al. Magnetic resonance neurography. Magn Reson Med. 1992;28(2):328-338.
Jarvik J.G., Comstock B.A., Heagerty P.J., et al. Magnetic resonance imaging compared with electrodiagnostic studies in patients with suspected carpal tunnel syndrome: predicting symptoms, function, and surgical benefit at 1 year. J Neurosurg. 2008;108(3):541-550.
Jarvik J.G., Yuen E., Haynor D.R., et al. MR nerve imaging in a prospective cohort of patients with suspected carpal tunnel syndrome. Neurology. 2002;58(11):1597-1602.
Khalil C., Hancart C., Le Thuc V., et al. Diffusion tensor imaging and tractography of the median nerve in carpal tunnel syndrome: preliminary results. Eur Radiol. 2008;18(10):2283-2291.
Lewis A.M., Layzer R., Engstrom J.W., et al. Magnetic resonance neurography in extraspinal sciatica. Arch Neurol. 2006;63(10):1469-1472.
Moseley M.E., Kucharczyk J., Asgari H.S., et al. Anisotropy in diffusion-weighted MRI. Magn Reson Med. 1991;19(2):321-326.
Richards T.L., Heide A.C., Tsuruda J.S., et al. Vector analysis of diffusion images in experimental allergic encephalomyelitis. Presented at the Society for Magnetic Resonance in Medicine, Berlin. SMRM Proceedings. 1992;11:412.
Smith A.B., Gupta N., Strober J., et al. Magnetic resonance neurography in children with birth-related brachial plexus injury. Pediatr Radiol. 2008;38(2):159-163.
Takahara T., Hendrikse J., Yamashita T., et al. Diffusion-weighted MR neurography of the brachial plexus: feasibility study. Radiology. 2008;249(2):653-660.
Viallon M., Vargas M.I., Jlassi H., et al. High-resolution and functional magnetic resonance imaging of the brachial plexus using an isotropic 3D T2 STIR (short term inversion recovery) SPACE sequence and diffusion tensor imaging. Eur Radiol. 2008;18(5):1018-1023.
West G.A., Haynor D.R., Goodkin R., et al. Magnetic resonance imaging signal changes in denervated muscles after peripheral nerve injury. Neurosurgery. 1994;35(6):1077-1085.
Yamashita T., Kwee T.C., Takahara T. Whole-body magnetic resonance neurography. N Engl J Med. 2009;361(5):538-539.
Yoshikawa T., Hayashi N., Yamamoto S., et al. Brachial plexus injury: clinical manifestations, conventional imaging findings, and the latest imaging techniques. Radiographics. 2006;26(suppl 1):S133-S143.
Zhou L., Yousem D.M., Chaudhry V. Role of magnetic resonance neurography in brachial plexus lesions. Muscle Nerve. 2004;30(3):305-309.
1. Howe F.A., Filler A.G., Bell B.A., et al. Magnetic resonance neurography: optimizing imaging techniques for peripheral nerve identification. Presented at the Society for Magnetic Resonance in Medicine, Berlin. SMRM Proceedings. 1992;11:1701.
2. Howe F.A., Filler A.G., Bell B.A., et al. Magnetic resonance neurography. Magn Reson Med. 1992;28(2):328-338.
3. Richards T.L., Heide A.C., Tsuruda J.S., et al. Vector analysis of diffusion images in experimental allergic encephalomyelitis. Presented at the Society for Magnetic Resonance in Medicine, Berlin. SMRM Proceedings. 1992;11:412.
4. Khalil C., Hancart C., Le Thuc V., et al. Diffusion tensor imaging and tractography of the median nerve in carpal tunnel syndrome: preliminary results. Eur Radiol. 2008;18(10):2283-2291.
5. Tsuchiya K., Imai M., Tateishi H., et al. Neurography of the spinal nerve roots by diffusion tensor scanning applying motion-probing gradients in six directions. Magn Reson Med Sci. 2007;6:1-5.
6. Viallon M., Vargas M.I., Jlassi H., et al. High-resolution and functional magnetic resonance imaging of the brachial plexus using an isotropic 3D T2 STIR (short term inversion recovery) SPACE sequence and diffusion tensor imaging. Eur Radiol. 2008;18(5):1018-1023.
7. Takahara T., Hendrikse J., Yamashita T., et al. Diffusion-weighted MR neurography of the brachial plexus: feasibility study. Radiology. 2008;249(2):653-660.
8. Yamashita T., Kwee T.C., Takahara T. Whole-body magnetic resonance neurography. N Engl J Med. 2009;361(5):538-539.
9. Filler A.G., Tsuruda J.S., Richards T.L., et al. Images, apparatus, algorithms and methods – July 31, 1992. UK Patent Office; 1992. GB 9216383
10. Filler A.G., Tsuruda J.S., Richards T.L., et al. Image Neurography and Diffusion Anisotropy Imaging. Unites States Patent Office; 1993. US 5,560,360
11. Filler AG M.R. Neurography and diffusion tensor imaging: origins, history and clinical impact of the first 50,000 cases with an assessment of efficacy and utility in a prospective 5,000 patient study group. Neurosurgery. 2009;65(suppl 4):A29-A43.
12. Filler A.G.. The history, development and impact of computed imaging in neurological diagnosis and neurosurgery: CT, MRI, DTI. Internet Journal of Neurosurgery, 2010;1(7) http://www.ispub.com/journal/the-internet-journal-of-neurosurgery/volume-7-number-1/the-history-development-and-impact-of-computed-imaging-in-neurological-diagnosis-and-neurosurgery-ct-mri-and-dti.html
13. Moseley M.E., Kucharczyk J., Asgari H.S., et al. Anisotropy in diffusion-weighted MRI. Magn Reson Med. 1991;19(2):321-326.
14. Jarvik J.G., Yuen E., Haynor D.R., et al. MR nerve imaging in a prospective cohort of patients with suspected carpal tunnel syndrome. Neurology. 2002;58(11):1597-1602.
15. Jarvik J.G., Comstock B.A., Heagerty P.J., et al. Magnetic resonance imaging compared with electrodiagnostic studies in patients with suspected carpal tunnel syndrome: predicting symptoms, function, and surgical benefit at 1 year. J Neurosurg. 2008;108(3):541-550.
16. Filler A.G., Haynes J., Jordan S.E., et al. Sciatica of nondisc origin and piriformis syndrome: diagnosis by magnetic resonance neurography and interventional magnetic resonance imaging with outcome study of resulting treatment. J Neurosurg Spine. 2005;2(2):99-115.
17. Filler A.G. Piriformis and related entrapment syndromes: Diagnosis and management. Neurosurg Clin North Am. 2008;19:609-622.
17a. Filler A.G. Imaging for peripheral nerve disorders. In: Winn H.R., editor. Youmans Neurological Surgery. Philadelphia: Elsevier, 2011. pp 2413–2426
18. Filler A.G. Diagnosis and management of pudendal nerve entrapment syndromes: impact of MR Neurography and open MR-guided injections. Neurosurg Q. 2008;18:1-6.
19. Aagaard B.D., Maravilla K.R., Kliot M. MR neurography. MR imaging of peripheral nerves. Magn Reson Imaging Clin North Am. 1998;6:179-194.
20. Aagaard B.D., Maravilla K.R., Kliot M. Magnetic resonance neurography: magnetic resonance imaging of peripheral nerves. Neuroimaging Clin North Am. 2001;11(1):131-146. viii
21. Kuntz C.4th, Blake L., Britz G., et al. Magnetic resonance neurography of peripheral nerve lesions in the lower extremity. Neurosurgery. 1996;39:750-756.
22. Filler A.G., Kliot M., Howe F.A., et al. Application of magnetic resonance neurography in the evaluation of patients with peripheral nerve pathology. J Neurosurg. 1996;85(2):299-309.
23. Dailey A.T., Tsuruda J.S., Filler A.G., et al. Magnetic resonance neurography of peripheral nerve degeneration and regeneration. Lancet. 1997;350:1221-1222.
24. Bowen B.C., Pattany P.M., Saraf-Lavi E., et al. The brachial plexus: normal anatomy, pathology, and MR imaging. Neuroimaging Clin North Am. 2004;14(1):59-85. vii-viii
25. Grant G.A., Britz G.W., Goodkin R., et al. The utility of magnetic resonance imaging in evaluating peripheral nerve disorders. Muscle Nerve. 2002;25(3):314-331.
26. Grant G.A., Goodkin R., Maravilla K.R., et al. MR neurography: diagnostic utility in the surgical treatment of peripheral nerve disorders. Neuroimaging Clin North Am. 2004;14(1):115-133.
27. Filler A.G., Maravilla K.R., Tsuruda J.S. MR neurography and muscle MR imaging for image diagnosis of disorders affecting the peripheral nerves and musculature. Neurol Clin. 2004;22(3):643-682. vi-vii
28. Smith A.B., Gupta N., Strober J., et al. Magnetic resonance neurography in children with birth-related brachial plexus injury. Pediatr Radiol. 2008;38(2):159-163.
29. Filler A.G. MR neurography and brachial plexus neurolysis in the management of thoracic outlet syndromes. In: Yao J.S.T., Pearce W.H. Advances in Vascular Surgery. Chicago: Precept Press, 2002,. pp 499–523
30. Filler AG, Johnson JP, Machleder H, et al: Neurographic findings in diagnosis of thoracic outlet syndrome [abstract]. In: Proceedings of the Congress of Neurological Surgeons Annual Meeting, New Orleans. Neurosurgery. 1997;41:724.
31. Zhou L., Yousem D.M., Chaudhry V. Role of magnetic resonance neurography in brachial plexus lesions. Muscle Nerve. 2004;30(3):305-309.
32. Moore K.R., Tsuruda J.S., Dailey A.T. The value of MR neurography for evaluating extraspinal neuropathic leg pain: a pictorial essay. AJNR Am J Neuroradiol. 2001;22:786-794.
33. Lewis A.M., Layzer R., Engstrom J.W., et al. Magnetic resonance neurography in extraspinal sciatica. Arch Neurol. 2006;63(10):1469-1472.
34. Filler A.G. Diagnosis and treatment of pudendal nerve entrapment syndrome subtypes: imaging, injections, and minimal access surgery. Neurosurg Focus. 2009;26(2):E9.
35. Cornwall R., Radomisli T.E.. Nerve injury in traumatic dislocation of the hip. Clin Orthop Relat Res, 2000;;377:84-91
36. Yoshikawa T., Hayashi N., Yamamoto S., et al. Brachial plexus injury: clinical manifestations, conventional imaging findings, and the latest imaging techniques. Radiographics. 2006;26(suppl 1):S133-S143.
37. Heilbrun M.E., Tsuruda J.S., Townsend J.J., et al. Intraneural perineurioma of the common peroneal nerve. Case report and review of the literature. J Neurosurg. 2001;94:811-815.
38. Shabas D., Gerard G., Rossi D. Magnetic resonance imaging examination of denervated muscle. Comput Radiol. 1987;11:9-13.
39. Polak J.F., Jolesz F.A., Adams D.F. Magnetic resonance imaging of skeletal muscle. Prolongation of T1 and T2 subsequent to denervation. Invest Radiol. 1988;23:365-369.
40. West G.A., Haynor D.R., Goodkin R., et al. Magnetic resonance imaging signal changes in denervated muscles after peripheral nerve injury. Neurosurgery. 1994;35(6):1077-1085.
41. Filler A.G. Minimal access nerve surgery and interventional MRI. Neurosurgery. 2009;65(suppl 4):A212-A221.
42. Peng P.W., Tumber P.S. Ultrasound-guided interventional procedures for patients with chronic pelvic pain—a description of techniques and review of literature. Pain Physician. 2008;11:215-224.