Ventilation-Perfusion Relationships
After reading this chapter, you will be able to:
• Explain why alveolar ventilation ( ) and pulmonary capillary blood flow (
 ) determine alveolar oxygen pressure (PAO2)
• Use the oxygen–carbon dioxide diagram to characterize absolute shunt and absolute dead space
• Explain why there is an alveolar-to-arterial oxygen pressure difference (P(A-a)O2) in the normal lung
• Show why P(A-a)O2 increases as fractional concentration of inspired oxygen (FIO2) increases
• Explain why high  lung regions can compensate for the hypercapnia but not the hypoxemia of low
  regions
• Differentiate between general hypoventilation, shunt, and  mismatch as causes of hypoxemia
• Explain why absolute shunt is not responsive to oxygen therapy
• Describe the major pathological defects involved in shunt-producing and dead space–producing diseases
• Differentiate between the effects absolute shunt and absolute dead space have on arterial blood gases
• Identify which of the following shunt indicators is the most clinically accurate and reliable: P(A-a)O2, PaO2/FIO2 ratio, or PaO2/PAO2 ratio
• Use the classic physiological shunt equation to calculate the fraction of shunted cardiac output
• Explain why changes in cardiac output affect PaO2 in a patient with abnormally high intrapulmonary shunt
Overall V ˙ A / Q ˙ C  Ratio
Ratio
Normal gas exchange between air and blood can occur only if pulmonary blood flow perfuses ventilated alveoli. Thus the  ratio is critical in maintaining normal gas exchange. The
  ratio may refer to ventilation and blood flow in a single alveolus, all alveoli in a single lobe, or all 300 million plus alveoli in the lung. The average resting
  (alveolar ventilation) for the lung is about 4 L per minute, and the resting
  (pulmonary capillary blood flow) is about 5 L per minute. The overall average
  is about 0.8 for the lung as a whole.1 However, the overall
  ratio reveals little about the lung’s ability to function as a gas-exchange organ. For example, consider the hypothetical extreme situation in which 5 L per minute of pulmonary blood perfuses a nonventilated left lung and 4 L per minute of gas ventilates a nonperfused right lung. The overall average
  would be normal (4 L/min ÷ 5 L/min = 0.8), but gas exchange would be impossible.


V ˙ A / Q ˙ C  Ratio as a Determinant Of Alveolar PO2
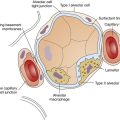
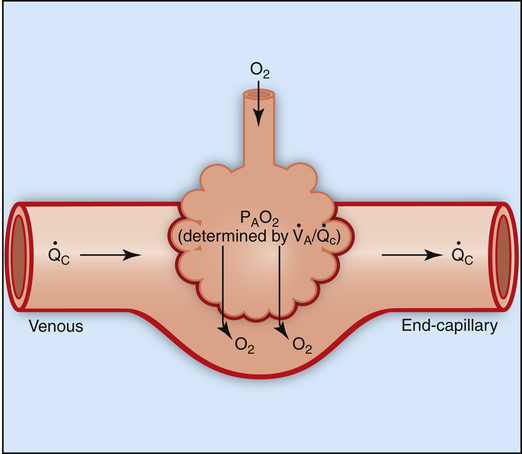
The model of the lung and its pulmonary blood flow in Figure 12-1 shows that ventilation continually adds atmospheric oxygen to the alveoli, whereas pulmonary blood flow continually removes oxygen from the alveoli. If blood flow ceases and ventilation continues, oxygen builds up in the alveoli until alveolar PO2 equals the inspired PO2. If ventilation ceases and blood flow continues, PAO2 decreases until it is equal to the PO2 of venous blood. Thus, the balance between the addition of oxygen ( ) and its removal (
 ) determines PAO2. Decreased
  relative to
  decreases the
  ratio and reduces PAO2 (blood removes oxygen more rapidly than it is replenished). Decreased
  relative to
  increases the
  ratio and increases PAO2 (ventilation adds oxygen more rapidly than it is removed). In the same way, the
  ratio also determines PACO2. In this instance, blood flow adds carbon dioxide to alveoli, whereas ventilation removes it.


Alveolar Oxygen–Carbon Dioxide Diagram
Figure 12-2 is a theoretical model of three alveoli with three different  relationships. The inspired PO2 and PCO2 for all alveoli are 150 mm Hg and 0 mm Hg (breathing room air at sea level). The middle alveolus has a normal
  ratio, maintaining a PAO2 equal to 100 mm Hg and a PACO2 equal to 40 mm Hg. Incoming mixed venous blood with a PO2 of 40 mm Hg and a PCO2 of 45 mm Hg takes on alveolar PO2 and PCO2 values as diffusion and equilibrium occur between the blood and alveolar gas pressures.
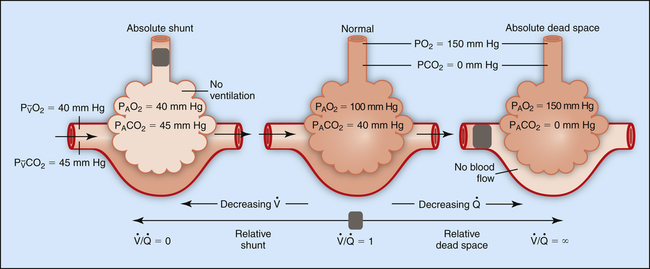
If ventilation gradually decreases with no change in blood flow, the  ratio decreases until it eventually equals 0 when ventilation ceases (left alveolus, Figure 12-2). This condition is called absolute shunt. Because no ventilation exists, PAO2 and PACO2 levels eventually equalize with the levels of mixed venous blood (i.e., PAO2 becomes 40 mm Hg, and PACO2 becomes 45 mm Hg). This condition is called shunt because blood leaving unventilated alveoli is identical in composition to the mixed venous blood entering the alveoli, as though blood flow took a detour around the lung, bypassing it altogether. (In reality, a completely blocked alveolus would collapse because blood flow would continually absorb oxygen and shrink the alveolus until it collapsed.)
The alveolus on the right (see Figure 12-2) shows the other extreme. Blood flow is completely blocked, but ventilation persists unchanged. Because no carbon dioxide can enter the alveolus and no oxygen can be taken up by the blood, PACO2 and PAO2 take on values identical to room air. This alveolus has exactly the same PO2 and PCO2 as the conducting airways (i.e., the anatomical dead space). This alveolus represents absolute dead space; the  equals ∞ (infinity) because blood flow is zero. The horizontal double arrow below the three alveolar units represents a
  continuum of all possibilities ranging from absolute shunt to absolute dead space (from
  = 0 to
  = 8).
= 8).
CONCEPT QUESTION 12-2
Referring to Figure 12-2, on which side of the  continuum is hyperventilation located?


Figure 12-3 illustrates the positions of the three hypothetical alveoli in Figure 12-2 on the oxygen–carbon dioxide diagram.1 PACO2 is plotted on the vertical (y) axis, and PAO2 is plotted on the horizontal (x) axis. Gas pressures in the normal alveolus ( = 1) are represented by a point on the oxygen–carbon dioxide diagram where PAO2 and PACO2 are 100 mm Hg and 40 mm Hg. This point also indicates PO2 and PCO2 values for end-capillary blood leaving the normal alveolus because capillary blood equilibrated with alveolar gas. The absolute shunt alveolus (
 = 0) takes on PAO2 values identical to values of mixed venous blood (note the mixed venous symbol,
  ). Gas pressures in this alveolus are plotted on the oxygen–carbon dioxide diagram showing that PO2 equals 40 mm Hg and PCO2 equals 45 mm Hg. The absolute dead space alveolus (
 ∞) takes on a PAO2 equal to 150 mm Hg and a PACO2 equal to 0 mm Hg, values identical to inspired atmospheric gas (note the inspired symbol, I, on the x axis). The curved line passing through these three points is the
  line. It represents all possible gas compositions in a single alveolus (breathing room air) supplied by mixed venous blood with a PO2 equal to 40 mm Hg and a PCO2 equal to 45 mm Hg. Because end-capillary blood leaving the alveoli equilibrated with alveolar gas, the
  line also represents all possible PO2 and PCO2 combinations of end-capillary blood from a single alveolus.
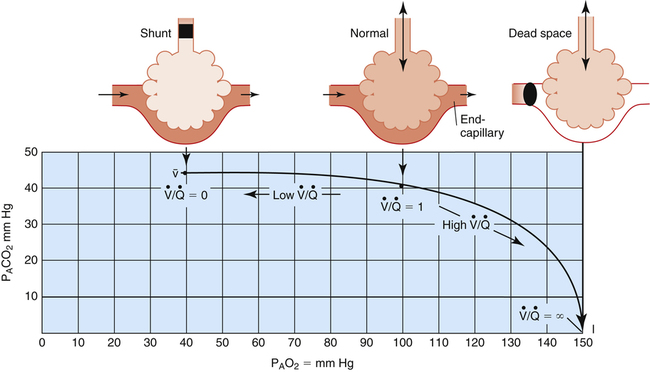


Figure 12-3 shows that a PAO2 of 50 mm Hg and PACO2 of 80 mm Hg cannot coexist in a single alveolus while the patient is breathing room air because this point does not lie on the  line. However, this alveolar gas composition can exist if the mixed venous blood composition changes greatly, creating a new
  line passing through different points. For example, a greatly increased metabolic rate would produce more carbon dioxide, increasing P
 CO2 and decreasing P
 O2, especially if cardiac output cannot increase appropriately. A new
  line would be created, beginning at much higher carbon dioxide and lower oxygen values on the left end (see Figure 12-3) but curving down to the same inspired point (PCO2 = 0 mm Hg and PO2 = 150 mm Hg) on the right end. The gas composition of any single alveolus and thus of its end-capillary blood depends on the PO2 and PCO2 of its mixed venous blood and its
  ratio.
Reciprocal Relationship between Alveolar Carbon Dioxide Pressure and Alveolar Oxygen Pressure Breathing Room Air
The  line in Figure 12-3 is drawn as though the mixed venous blood gas composition does not change as
  changes. Although this statement is essentially true if the
  of only one alveolus changes, it is not true if the collective
  of all alveoli uniformly change. Chapter 4 explains that
  and PACO2 are reciprocally related. For example, if
  decreases to half normal, PACO2 increases from 40 mm Hg to 80 mm Hg. The corresponding PAO2 while breathing room air can be calculated with the alveolar air equation (see Chapter 7), yielding the following result:
This reciprocal relationship is not shown on the oxygen–carbon dioxide diagram in Figure 12-3 because this diagram represents a hypothetical change in the  of one alveolus out of millions of alveoli; a
  change in one alveolus would not affect mixed venous blood composition. (The PAO2 of 54 mm Hg and PACO2 of 80 mm Hg in the example do not define a point on the
  curve.) In reality, mixed venous blood gases do change when the entire lung hypoventilates. For example, if all 300 million alveoli uniformly hypoventilate, the average PACO2 increases, producing an equal increase in the average end-capillary PCO2. As a result, arterial PCO2 increases. When this arterial blood with an increased PCO2 passes through tissue capillaries, tissue PCO2 builds up until a diffusion gradient from tissues to blood is created; this increases mixed venous PCO2. By increasing PACO2, overall hypoventilation ultimately also increases the mixed venous PCO2. The end result is a new PACO2-PAO2 combination, identifying a point on a new
  line in the oxygen–carbon dioxide diagram. The important point illustrated by Figure 12-3 is that the gas composition of any alveolus is determined by its incoming venous gas composition and
  ratio.
V ˙ A / Q ˙ C  RATIO Distribution in Normal Lung
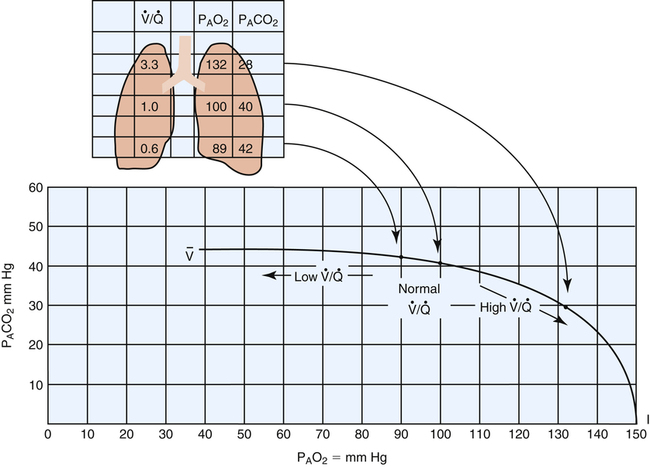
Chapter 6 describes why the  ratio increases from the lung base to the lung apex (see Figure 6-11). Similar to blood flow, ventilation is greatest in the lung base and least in the apex. However, from the base to apex, blood flow decreases at a more rapid rate than ventilation, which means that apical regions are relatively overventilated with respect to blood flow (high
  ), whereas basal regions are relatively underventilated with respect to blood flow (low
  ). Figure 12-4 illustrates these regional differences in
  with respect to the oxygen–carbon dioxide diagram. (In this figure, PAO2 decreases by 40 mm Hg from the lung apex to the lung base, whereas PACO2 increases only about 15 mm Hg from apex to base.2)
 distribution in the normal lung.
Effect Of V ˙ A / Q ˙ C  Imbalances on Gas Exchange
Normal Gas Exchange
Figure 12-4 shows that the normal lung is not a perfect gas-exchange organ. End-capillary blood from low  basal regions has a decreased PO2 and submaximal oxygen content. End-capillary blood from normal
  regions has near-maximal oxygen content (PO2 = 100 mm Hg; hemoglobin saturation = 98.5%). Blood from high
  apical regions carries only slightly more oxygen per 100 mL than blood from normal units because blood from normal
  regions already has near-maximal oxygen content.


Normal Alveolar-Arterial Oxygen Pressure Difference
To understand how the lung’s normal  imbalances contribute to the normal P(A-a)O2, one must understand what determines alveolar and arterial oxygen compositions. (Recall from Chapter 1 that another source of the normal P(A-a)O2 is anatomical shunting, in which bronchial venous blood mixes with freshly oxygenated pulmonary venous blood.) Arterial blood is a mixture of the end-capillary blood from all
  regions in the lungs. Alveolar gas, collected at the end of a tidal exhalation, is a mixture of alveolar gases from these same differing
  regions. Although alveolar gas is in equilibrium with end-capillary blood, the average PAO2 is not the same as the average end-capillary blood PO2. The oxygen-hemoglobin equilibrium curve illustrates this point (Figure 12-5). For the sake of simplicity, this illustration assumes that equal volumes of end-capillary blood from apical and basal lung regions mix to form arterial blood. (This is not actually true because the lung’s bases receive more blood flow than the apices.) PaO2 is not determined by an average of the mixed end-capillary PO2 values; instead, PaO2 is determined by an average of the mixed end-capillary oxygen contents.
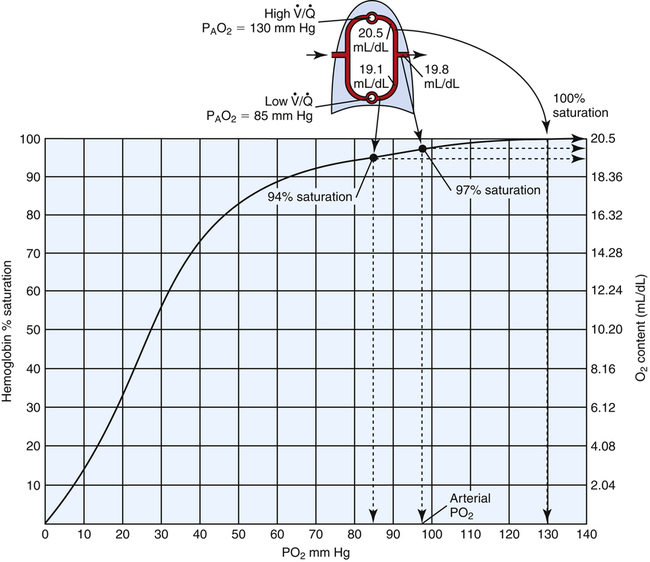
For example, let us assume in Figure 12-5 that 100 mL of end-capillary blood from the lung apex is mixed with 100 mL of end-capillary blood from the lung base. Blood from the apex has a PO2 equal to 130 mm Hg and an oxygen saturation (SaO2) of 100%. Blood from the base has a PO2 of 85 mm Hg and an SaO2 of about 94%. With a hemoglobin concentration of 15 g/dL, the oxygen content in 100 mL of apical blood is as follows:

The oxygen content in 100 mL of basal blood is as follows:

Mixing these two samples produces 200 mL of blood containing 39.6 mL of oxygen, or 19.8 mL of oxygen per 100 mL of blood (19.8 mL/dL), corresponding to about 97% saturation on the oxyhemoglobin equilibrium curve (see Figure 12-5). This mixture produces a PaO2 of about 96 to 97 mm Hg, which is obviously not the average of apical and basal PO2 values. High  apical units cannot negate the desaturating effect that low
  basal units have on mixed end-capillary blood. The desaturating effects of basal alveolar units are even more pronounced than illustrated in this example because basal regions actually receive more blood flow and contribute proportionally more to the arterial blood.
In contrast, mixed expired alveolar gas PO2 is simply the average of the PO2 values from all of the differing  regions in the lungs because no hemoglobin is involved. In the example just discussed, the average PAO2 is (130 + 85)/2 = 108 mm Hg, producing a P(A-a)O2 of 12 mm Hg (PAO2 of 108 mm Hg − PaO2 of 96 mm Hg). The differing
  ratios in the lung create a normal P(A-a)O2 of approximately 7 to 14 mm Hg, if room air is breathed (FIO2 = 0.21).3 Severely diseased lungs have many abnormally low
  regions; in such instances, the P(A-a)O2 is even higher.
Why Alveolar-Arterial Oxygen Pressure Difference Increases When Fractional Concentration of Oxygen in Inspired Gas Increases
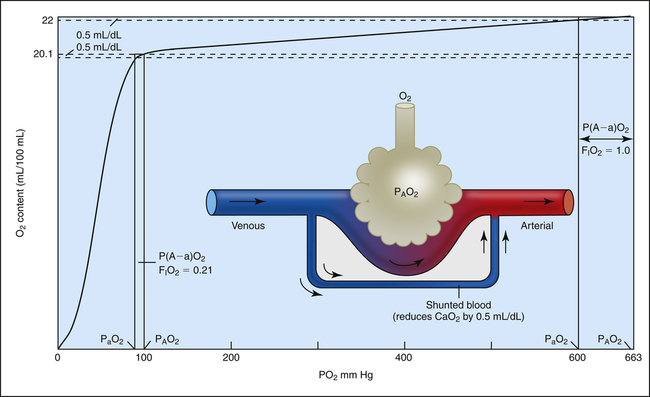
P(A-a)O2 increases from about 10 mm Hg when room air is breathed to greater than 50 mm Hg when 100% oxygen is breathed. The shape of the oxygen-hemoglobin equilibrium curve helps explain this phenomenon. Figure 12-6 shows the oxygen-hemoglobin curve extended to a PO2 of 663 mm Hg, which compresses the sigmoid shape of the curve into the extreme left side of the diagram. At PO2 values between 100 mm Hg and 663 mm Hg, the curve is practically flat because the hemoglobin is essentially saturated to capacity between these two points; the small increase in oxygen content is due to increased dissolved oxygen. The diagram of the lung indicates a small, normal amount of shunt—about 2% to 5% of the cardiac output does not perfuse ventilated alveoli. This shunted blood is venous in composition (PO2 = 40 mm Hg; saturation = 75%; oxygen content = 15 mL/dL). Figure 12-6 shows the effects of adding this small, fixed amount of desaturated venous blood to arterial blood when 100% oxygen is breathed (PAO2 = 663 mm Hg, lower right of the graph) and while room air is breathed (PAO2 = 100 mm Hg, lower left of the graph). Because the amount of shunted blood is fixed, the same decrease in arterial oxygen content occurs whether room air or 100% oxygen is breathed. For the sake of illustration, let us assume this reduction in arterial oxygen content is 0.5 mL/dL in both instances (see Figure 12-6). As shown, this 0.5-mL/dL decrease produces a much greater decrease in PaO2 when 100% oxygen compared to 21% oxygen is breathed because of the flatness of the curve at high PO2 values. The breathing of 100% oxygen increases the P(A-a)O2, not because it somehow impairs gas transfer from the alveolus to the blood, but simply because of the unique way hemoglobin binds to O2 molecules.
Abnormal Gas Exchange


Hypoventilation
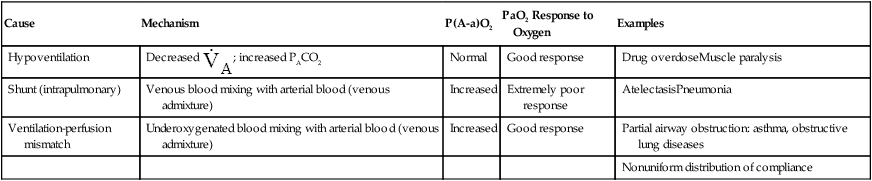
Overall hypoventilation increases PACO2; PAO2 consequently decreases in a reciprocal fashion (Figure 12-7, A). This kind of hypoxemia points to a ventilation problem, not an oxygen transfer problem; in other words, if ventilation is restored to normal, hypoxemia resolves. Figure 12-7 shows that the P(A-a)O2 is within normal limits when either room air or 30% oxygen is breathed, indicating normal oxygen transfer across the lung. (PaO2 is less than PO2 of the blood in either capillary in Figure 12-7 because a normal shunt of 2% to 5% [not illustrated] decreases arterial oxygen content and PO2.) Causes of general hypoventilation include muscle paralysis or weakness and drug-induced respiratory center depression (Table 12-1).
TABLE 12-1
Respiratory Causes of a Low Arterial PO2
| Cause | Mechanism | P(A-a)O2 | PaO2 Response to Oxygen | Examples |
| Hypoventilation | Decreased  ; increased PACO2 ; increased PACO2 |
Normal | Good response | Drug overdoseMuscle paralysis |
| Shunt (intrapulmonary) | Venous blood mixing with arterial blood (venous admixture) | Increased | Extremely poor response | AtelectasisPneumonia |
| Ventilation-perfusion mismatch | Underoxygenated blood mixing with arterial blood (venous admixture) | Increased | Good response | Partial airway obstruction: asthma, obstructive lung diseases |
| Nonuniform distribution of compliance |
The logical corrective treatment for patients experiencing general hypoventilation and hypoxemia involves therapy that increases ventilation. At the extreme, intubation and mechanical ventilation may be needed. Hypoventilation-induced hypoxemia can be corrected with oxygen therapy (see Figure 12-7, B), but oxygen therapy does not correct the underlying cause of hypoxemia.
Absolute Shunt
Physiological, or intrapulmonary, shunting occurs when mixed venous blood flows through the pulmonary capillaries of airless, unventilated alveoli (Figure 12-8, A). Venous blood does not physically bypass the lung, but the effect is the same; shunted blood can neither take up oxygen nor release carbon dioxide (i.e., the blood remains venous in composition). Any abnormal process that prevents alveolar ventilation produces physiological shunt (see Table 12-1). Examples include alveolar filling processes, such as pneumonia or pulmonary edema, and processes causing alveolar collapse, such as pulmonary surfactant abnormalities, pneumothorax, and major bronchial occlusion.
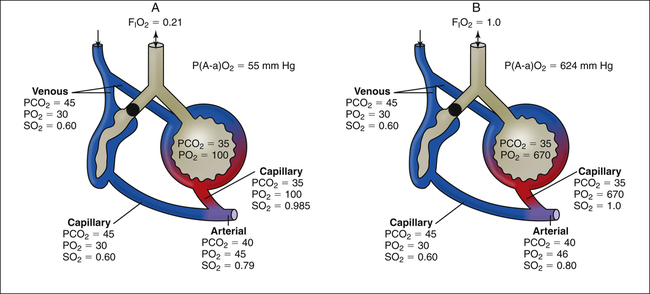
An increase in the percentage of oxygen (the gas) breathed by patients with shunting disease does little to improve arterial oxygenation because shunted venous blood cannot contact inspired gas (see Figure 12-8, B). Thus, the hallmark of intrapulmonary shunting is hypoxemia that responds poorly to oxygen therapy (refractory hypoxemia). An increase in FIO2 can increase the PO2 of only ventilated alveoli, but this adds little oxygen to the already saturated blood of these alveolar capillaries. (Compare capillary blood saturations in Figure 12-8, A and B.) Even increasing the FIO2 to 1.0 does not improve PaO2 significantly because arterial oxygen content (CaO2) or saturation
CLINICAL FOCUS 12-1 Hypoventilation as a Cause of Hypoxemia
Arterial blood gas values (on room air; barometric pressure = 760 mm Hg) are as follows:
is determined by the mixed oxygen saturations of end-capillary blood. The resulting arterial oxygen saturation determines PaO2 (see earlier discussion regarding Figure 12-5). The difference between PAO2 and PaO2 values is increased in absolute shunt when either room air or 100% oxygen is breathed (see Figure 12-8). This alveolar-arterial difference indicates impaired oxygen transfer across the lung. The magnitude of P(A-a)O2 is an indicator of the severity of shunt.
In Figure 12-8, PaCO2 remains normal, around 40 mm Hg because arterial hypoxemia sensitizes the peripheral chemoreceptors, increasing the ventilation of normal alveoli such that the PCO2 of their capillary blood is decreased to 35 mm Hg; this balances the PCO2 of 45 mm Hg in the blood coming from the shunt unit, producing a final normal PaCO2 of 40 mm Hg. Such an increase in ventilation of the normal alveoli cannot similarly create a normal PaO2.1 This phenomenon is explained later in this chapter.
Ventilation-Perfusion Mismatch
 mismatch (
 <1 but >0) is the most common cause of hypoxemia.2 Low
  ratios are sometimes called relative shunt because they produce a shuntlike effect. In other words, they produce hypoxemia and increase the P(A-a)O2. As discussed previously, normal lungs have a small degree of
  mismatch, producing a normal P(A-a)O2 gradient. However, this mismatch involves such a small number of alveoli that normal PaO2 and PaCO2 can easily be maintained.
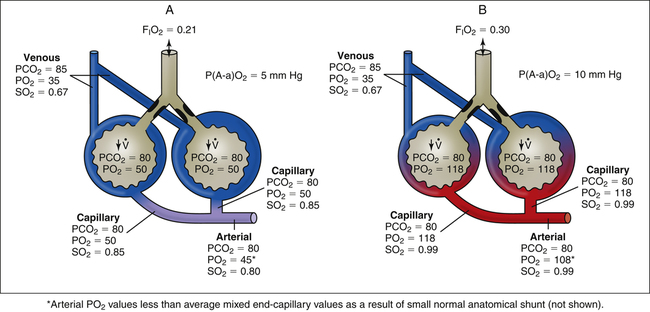
Unlike intrapulmonary shunt, blood perfusing low  alveoli is exposed to some ventilation. However, this blood receives inadequate ventilation, producing an increased end-capillary PCO2 and decreased PO2 (Figure 12-9, A). In contrast to overall hypoventilation,
  mismatch is a localized regional hypoventilation and does not usually produce an increased PaCO2 (see Figure 12-9, A).
  mismatch must be quite extensive throughout the lungs before hypercapnia occurs (e.g., severe chronic obstructive pulmonary disease [COPD]). In most conditions involving
  mismatch, normally
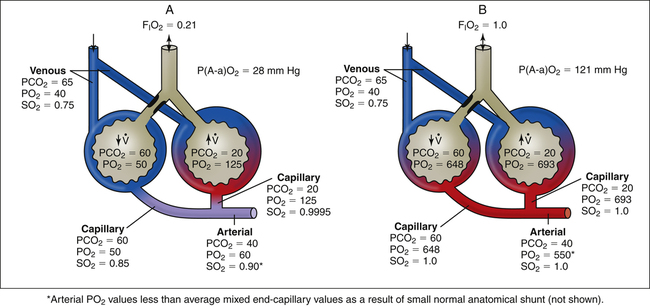

ventilated alveoli can easily compensate for the increased PCO2 of underventilated alveoli and maintain a normal or even low PaCO2. (Note the increased ventilation of normal units in Figure 12-9; PCO2 is decreased enough to balance the increased PCO2 of underventilated units.) The reason increased ventilation cannot do the same for oxygen is explained in detail in the next section.
As with shunting,  mismatch increases the P(A-a)O2, indicating impaired oxygen transfer across the lung (see Figure 12-9). In contrast to shunting,
  mismatch responds well to oxygen therapy because oxygen can enter underventilated units and increase the PO2 values to near-maximum (see Figure 12-9, B). Blood perfusing these underventilated units is maximally oxygenated, and the effect of venous admixture disappears. As in overall hypoventilation, PaO2 values in Figure 12-9 are lower than the values derived from averaging the saturations of end-capillary blood. The normal 2% to 5% shunt (which is not illustrated) accounts for this disparity.
Table 12-1 summarizes the mechanisms and effects of overall hypoventilation, absolute shunt, and  mismatch on arterial blood.
  mismatch is the most common mechanism causing hypoxemia and is seen in all lung diseases characterized by low
  ratios. These diseases include not only diseases involving partial airway obstruction but also those involving regional variations in lung compliance. For example, in emphysema and fibrotic lung diseases, compliance of all alveoli is not uniformly abnormal, and ventilation is not uniformly distributed.

Variable Effect of Q ˙ C  Imbalance on Carbon Dioxide and Oxygen Exchange
Theoretically, low  ratios (<1 and >0) should cause hypoxemia and hypercapnia. Consider a situation in which carbon dioxide production and oxygen consumption remain constant while overall
  decreases; if all other factors remain constant, this causes PaCO2 to increase and PaO2 to decrease. However, in the clinical setting, patients who are hypoxic because of
  mismatches or shunt often have a normal or low PaCO2.1 The reason is not, as some individuals erroneously suppose, that carbon dioxide is more diffusible than oxygen. Rather, when the medullary chemoreceptors sense even a slight increase in PaCO2, they increase the ventilatory drive1; this increases the ventilation of normal
  units enough to offset the effects of low
  units, keeping PaCO2 in the normal range. A normal PaCO2 can be maintained in this situation only by increasing total minute ventilation (
 ) above that which would normally be required. If a low
  ratio causes significant hypoxemia, PaCO2 may actually be lower than normal. That is, hypoxemia sufficient to activate the peripheral chemoreceptors may increase the ventilation of normal
  units enough to produce overall hyperventilation and respiratory alkalosis.
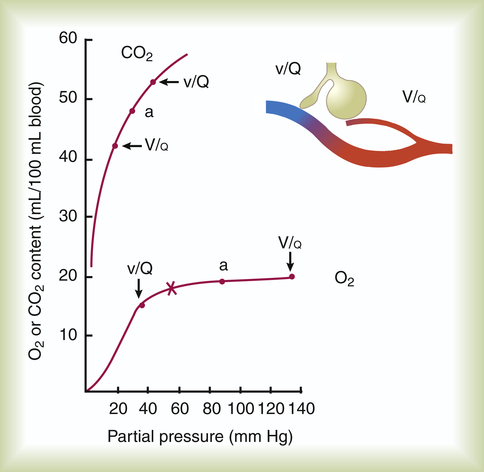
How can an increased  effectively decrease PaCO2 without significantly increasing PaO2? The differences in the shapes of the carbon dioxide and oxygen equilibrium curves answer this question. Figure 12-10 shows that the carbon dioxide equilibrium curve is almost a straight diagonal line in the physiological range, whereas the oxygen equilibrium curve is almost horizontal. Oxygen or carbon dioxide content is plotted on the vertical axis, and the partial pressure of either gas in arterial blood is plotted on the horizontal axis. The lung model to the right


CLINICAL FOCUS 12-3 Influence of Body Position on Arterial Oxygenation in Patients with  Mismatches
Arterial blood gas values 2 hours later with the patient on his right side are as follows:
Why did PaO2 improve significantly when the patient was moved onto his right side?

CLINICAL FOCUS 12-4 Differentiating among Hypoventilation, Shunt, and  Mismatch as the Cause of Hypoxemia
Was this patient’s hypoxemia caused by hypoventilation, shunt, or  mismatch?
Table 12-1 is helpful in analyzing the cause of this patient’s hypoxemia. Hypoventilation can be dismissed immediately on the basis of the low-normal PaCO2. Apparently, hypoxemia is stimulating the peripheral chemoreceptors, increasing this patient’s ventilation and decreasing PaCO2. Shunt is not the cause because PaO2 increased significantly when oxygen was administered. (Increasing PO2 in nonventilated alveoli is impossible.) The cause of this patient’s hypoxemia must be a ventilation-perfusion mismatch. Airway narrowing associated with asthma results in underventilation of some lung units, whereas ventilation to other lung units remains normal (see Figure 12-9). Breathing supplemental oxygen increases PO2 in normal and underventilated alveoli, increasing PaO2.
illustrates low and high  ratios. These
  ratios are plotted on both equilibrium curves, showing their respective contents and partial pressures. Point a on each curve represents normal arterial contents and partial pressures. (Low
  ratios produce high carbon dioxide contents and PCO2 values but low oxygen contents and PO2 values.)


Effect of High V ˙ A / Q ˙ C  Ratios on Arterial PO2 and Arterial PCO2
Increased Ventilation Relative to Blood Flow as a Cause of Dead Space
The discussion so far has focused mainly on the effect of low  ratios on gas exchange. It was briefly mentioned that high
  ratios are produced in the normal alveoli of lungs with shunt and
  mismatch (see Figures 12-8 and 12-9). However, these units do not produce hypoxemia or hypercapnia in the end-capillary blood; instead, they increase PAO2 and decrease PACO2 because their ventilation is high with respect to their blood flow. These units constitute relative dead space, or a dead space effect. Overall ventilation must increase in the lung to maintain a normal PaCO2, which is a hallmark of dead space. In this situation, increased dead space ventilation occurs because ventilation is increased out of proportion to blood flow. Generally, however, dead space–producing diseases are diseases in which reduced blood flow is the primary defect.


Effect of High V ˙ A / Q ˙ C  on Arterial PCO2 and Arterial PO2
Figure 12-11, A, illustrates the effect of cutting off blood flow to one lung while the lung continues to ventilate. Assuming both lungs had originally received equal blood flows, blood is redirected to the normal lung, doubling its flow. If ventilation of the normal lung remains constant, a low  ratio is created (i.e., perfusion increases while ventilation stays the same). Such conditions would produce increased PaCO2 and decreased PaO2 (see Figure 12-11, A).
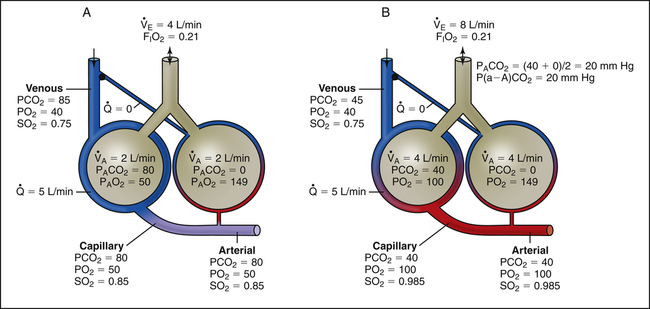


However, ventilation normally does not remain constant when dead space develops. At the same instant PaCO2 increases, medullary chemoreceptors stimulate an increase in  (see Figure 12-11, B). Ventilation increases as much as necessary to maintain normal PaCO2. Figure 12-11, B, represents the usual response to alveolar dead space; ventilation of the perfused lung increases to match its increased blood flow, preserving normal blood gases at the expense of greatly increased
  and work of breathing.
Arterial hypoxemia is not an inherent feature of dead space disease unless the ability to increase overall ventilation is impaired, as might be the case in patients with severe obstructive lung disease. Also, PACO2 of mixed alveolar gases is decreased because the nonperfused lung has a PACO2 of 0 mm Hg. This situation creates an alveolar-to-arterial carbon dioxide pressure difference (P[a-A]CO2) which is a diagnostic indicator of increased dead space. Alveolar dead space also creates an increased difference between PaCO2 and mixed expired PCO2 ( ). This difference is the basis for the Bohr dead space equation explained in Chapter 4. The Bohr equation is used to calculate the dead space-to-tidal volume ratio (VD/VT). If VD/VT is known and
  is measured,
  can be calculated.
Physiological Compensatory Responses to Dead Space and Shunt
The lung has two compensatory responses that help restore abnormal  ratios toward normal. Figures 12-8, 12-9, and 12-11 are oversimplified because they do not take these responses into account. In shunt, the decreased PO2 of blood passing through unventilated alveoli causes localized hypoxic pulmonary vasoconstriction (see Chapter 6). This vasoconstriction redistributes blood flow to well-ventilated alveoli. Poorly ventilated units receive less blood flow, which improves their
  ratios and reduces their effect on arterial blood. With regard to alveolar dead space, the low PCO2 values of alveoli with little or no blood flow cause local alveolar duct constriction, increasing airways resistance and decreasing ventilation in these regions; this helps create a better match between ventilation and blood flow, reducing the adverse blood gas effects of the
  imbalance.
Clinical Measurement of Shunt
Shunt Indicators
Alveolar-Arterial Oxygen Pressure Difference
P(A-a)O2 has been discussed extensively in earlier sections. P(A-a)O2, often called the A-a gradient, is probably the best-known index of oxygen-transfer efficiency. In the complete absence of shunt, no difference would exist between PAO2 and PaO2 values (see Figure 12-6); arterial blood would be identical to end-capillary blood of the ventilated alveolus. Thus, an increased P(A-a)O2 indicates increased physiological shunting. The normal P(A-a)O2 is about 7 to 14 mm Hg during breathing of room air and 50 to 60 mm Hg when breathing 100% oxygen.3 These normal values increase with age as the lung becomes more inefficient. The variability of P(A-a)O2 with FIO2 limits its usefulness as a shunt indicator when FIO2 is changed.
Calculation of P(A-a)O2 is straightforward. The ideal alveolar gas equation is used to compute PAO2, and arterial blood gas analysis provides PaO2. At FIO2 values ≤0.60, PAO2 is calculated as follows (see Chapter 7):

At FIO2 values > 0.60, the factor 1.2 is eliminated, as the following equation shows:

Arterial PO2/Alveolar PO2
CLINICAL FOCUS 12-5 Using the Bohr Dead Space Equation to Determine Dead Space and Alveolar Ventilation


stays constant. Thus, PaO2/PAO2 is more stable than P(A-a)O2 when FIO2 changes.3 The lower normal limit for PaO2/PAO2 is about 0.75. That is, at least 75% of PAO2 is normally transferred to the arterial blood. Because there is always some degree of P(A-a)O2 present, PaO2/PAO2 can never be 1.0.
Comparison of P(A-a)O2, PaO2/PAO2, and PaO2/FIO2
None of the indicators discussed previously consider the fact that in abnormally high shunt conditions mixed venous oxygen content (C O2) affects CaO2 and PaO2. This is true because shunted blood is composed of mixed venous blood, which eventually becomes part of the arterial blood. As was explained in Chapter 8, a decrease in cardiac output can decrease C
 O2. Thus, a nonpulmonary factor (cardiac output) can decrease PaO2. In this respect, shunt indicators sensitive to only pulmonary factors are inaccurate in reflecting the efficiency of the lung’s oxygen-transfer ability.

Assuming that cardiovascular function is constant, PaO2/PAO2 is the most reliable shunt indicator.3 It varies least with
CLINICAL FOCUS 12-6 Calculation of Fractional Concentration of Inspired Oxygen Required to Achieve Acceptable Arterial PO2
How much oxygen is needed to achieve a PaO2 of 90 mm Hg? What FIO2 should be used?
The equation used to calculate a FIO2 required for a desired PaO2 is as follows:

 1
1 2
2 3
3Equation 3 is similar to the “FIO2 required” equation. In fact, equation 3 can be used to calculate the FIO2 required. The PAO2 in the numerator of equation 3 is the PAO2 needed to produce the desired PaO2. This needed PAO2 can be calculated as follows if the original PaO2/PAO2 ratio is known:

changes in FIO2, is not affected by PaCO2, and can be used to compute the FIO2 necessary to achieve a desired PaO2.
Physiological Shunt Equation


Figure 12-12 helps illustrate the rationale for the shunt equation. The (Cc′O2 − C O2) is equal to the total oxygen uptake by the capillary blood. The (Cc′O2 − CaO2) is the amount of oxygen lost from the Cc′O2 as a result of mixing with poorly oxygenated
  . In other words, the greater the amount of shunted blood (
 ), the greater the amount of oxygen lost from the Cc′O2 when it mixes with
  . The shunt equation expresses this oxygen loss as a fraction of the total oxygen uptake:
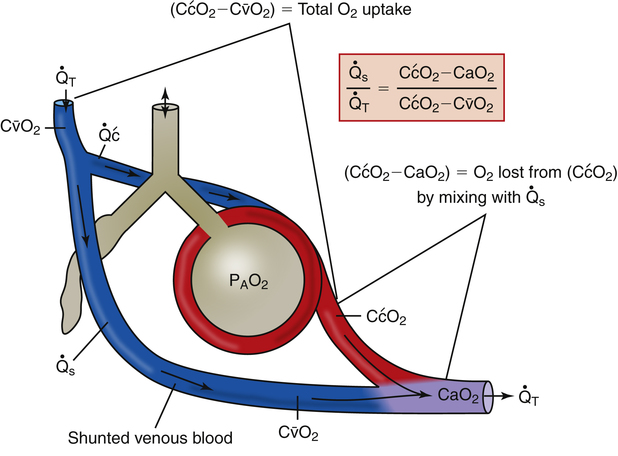
It should be apparent that this fraction is equal to the shunt fraction ( ).
).
A mixed venous blood sample must be available to use the shunt equation in the clinical setting. Mixed venous blood is available only when a pulmonary artery catheter is in place (see Chapter 6). In addition, because end-capillary blood cannot be directly sampled, the Cc′O2 is calculated as follows:

In reference to Figure 12-12, the Pc′O2 is of necessity equal to PAO2 because alveolar gas and end-capillary blood are in equilibrium. Pc′O2 is calculated from the alveolar air equation.
Clinical Significance


Calculated shunt fractions of 10% or less have no significant clinical effect. Table 12-2 summarizes the clinical significance of shunting.4
TABLE 12-2
Clinical Significance of Shunt
| Shunt Fraction Percentage | Clinical Significance |
| <10% | Clinically compatible with normal lungs |
| 10-19% | Intrapulmonary abnormality; seldom requires significant ventilatory support |
| 20-29% | Significant abnormality; requires ventilatory assistance with PEEP or CPAP |
| ≥30% | Severe disease; life threatening; requires aggressive mechanical support with PEEP |
CPAP, Continuous positive airway pressure; PEEP, positive end expiratory pressure.
CLINICAL FOCUS 12-7 Calculating Physiological Shunt Using Classic Shunt Equation


Using the classic shunt equation, calculate this patient’s  fraction.

To calculate shunt, first calculate Cc′O2, CaO2, and C O2:
O2:
The following calculations are made:

CLINICAL FOCUS 12-8 Effect of Low Cardiac Output on Arterial Oxygenation When Shunt Is High
Consider again the case presented in Clinical Focus 12-7. The patient is a 36-year-old woman with severe bilateral pneumonia, which fills many alveoli with fluid, creating a  of 21%. Her cardiac output decreases from 6.0 L per minute to 3.0 L per minute. Arterial blood gases are drawn and reveal the following:
| Cardiac Output 6.0 L/min | Cardiac Output 3.0 L/min | |
| FIO2 = | 1.0 | 1.0 |
| PaO2 = | 145 mm Hg | 82 mm Hg |
| PaCO2 = | 42 mm Hg | 45 mm Hg |
| pH = | 7.39 | 7.34 |
Examine the effect that decreased cardiac output had on this patient’s arterial oxygenation.